
Transcriptome Analysis Reveals Differential Gene Expression between the Closing Ductus Arteriosus and the Patent Ductus Arteriosus in Humans

 , , ,
, , ,
Abstract
:1. Introduction
2. Materials and Methods
2.1. Study Subjects and Ethics Statements
2.2. Total RNA Preparation and Microarray Analysis
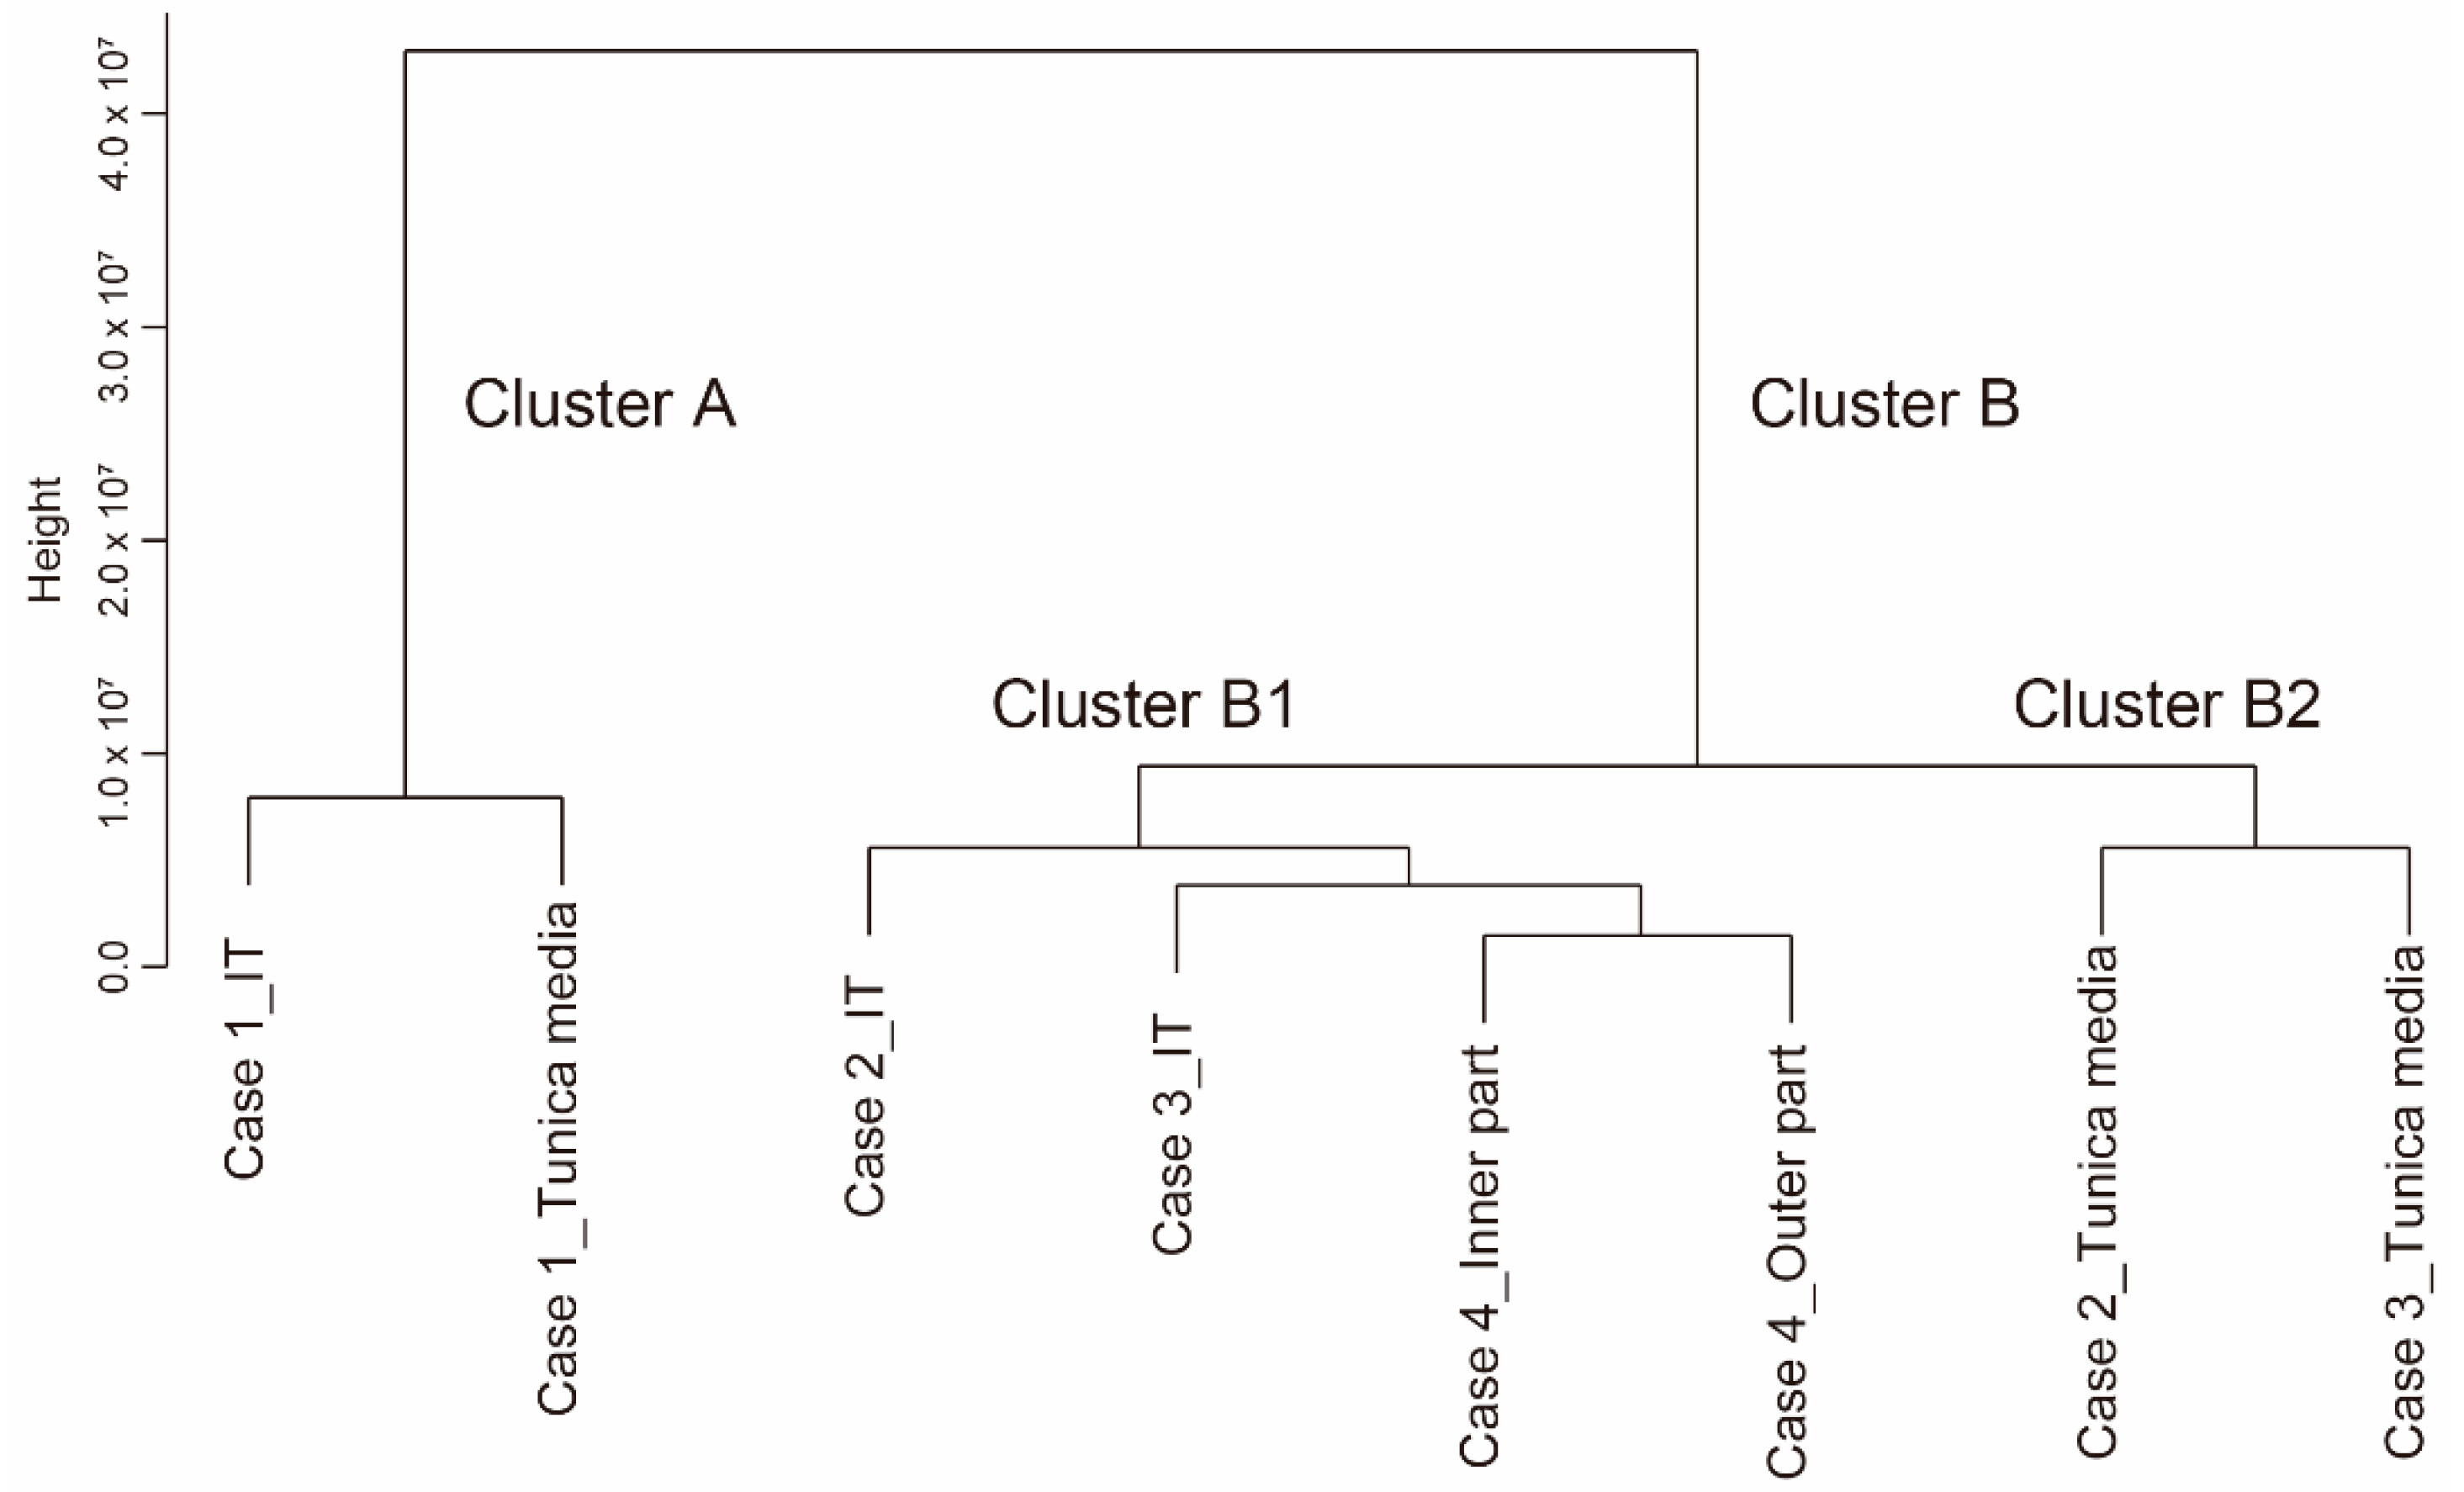
2.3. Generation of a Dendrogram, Venn Diagrams, and a Heatmap
2.4. Gene Set Enrichment Analyses (GSEAs)
2.5. Tissue Staining and Immunohistochemistry
3. Results
3.1. DA-Related Clinical Course of Each Participant
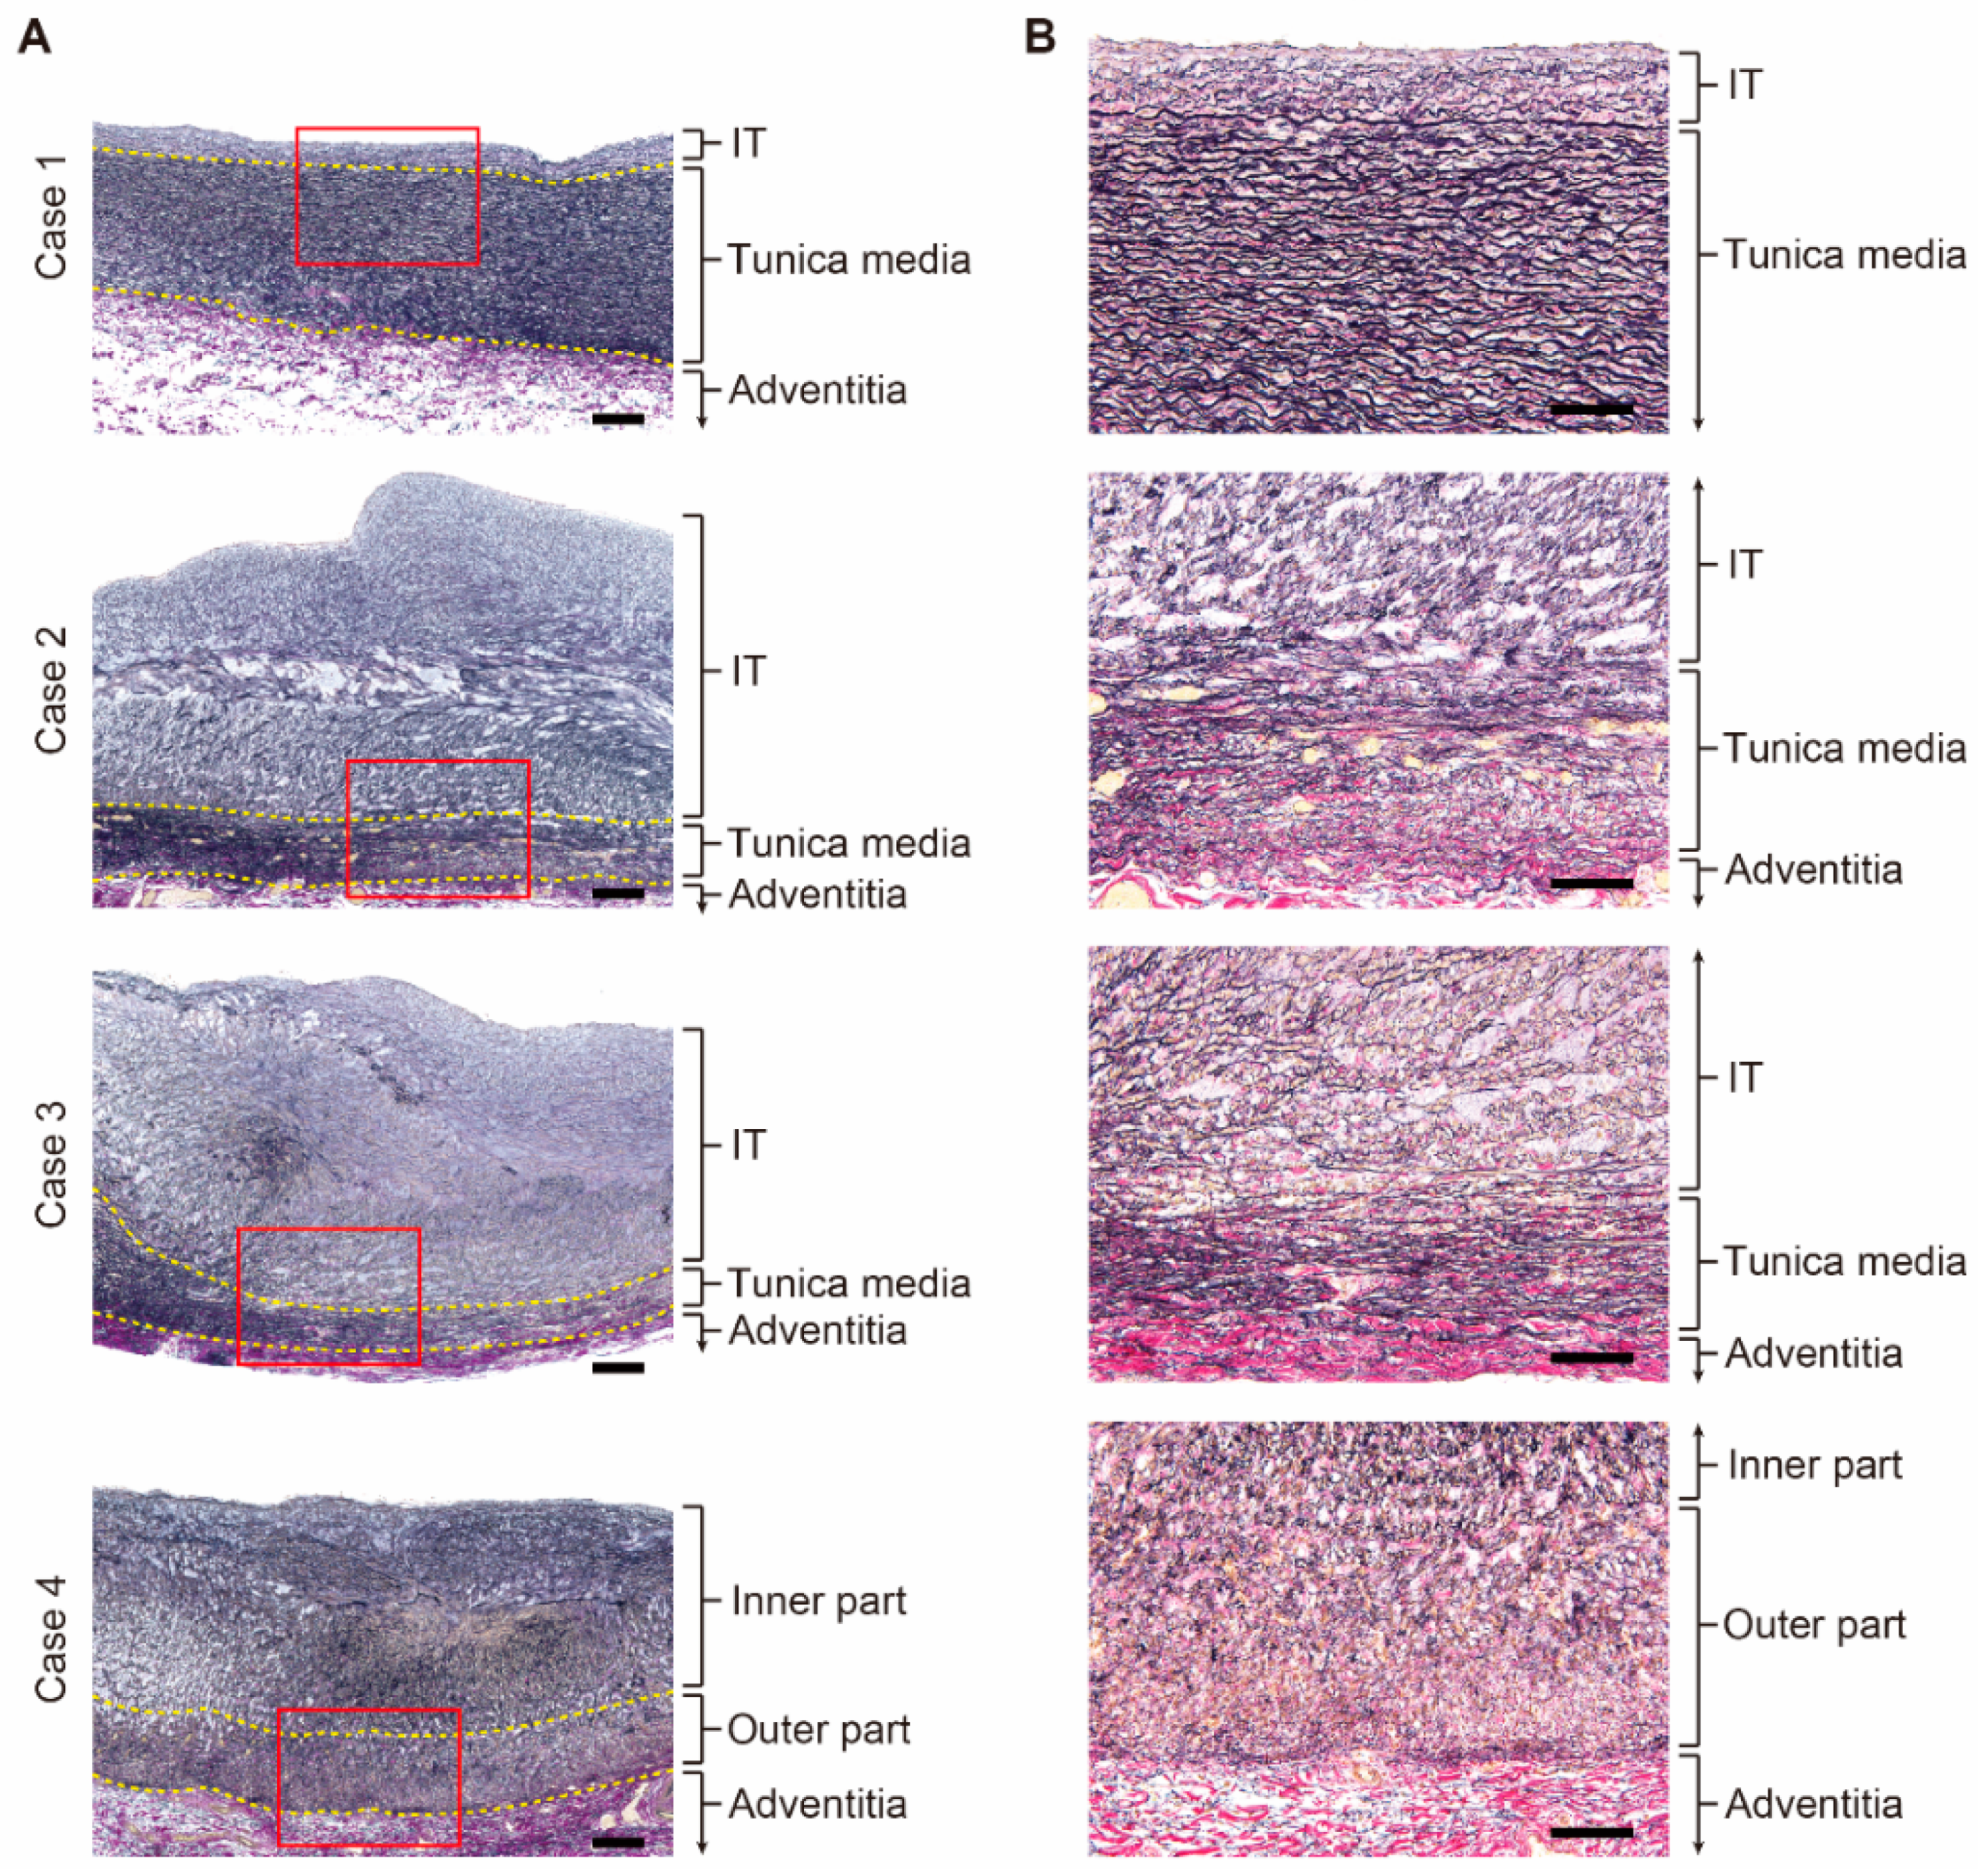
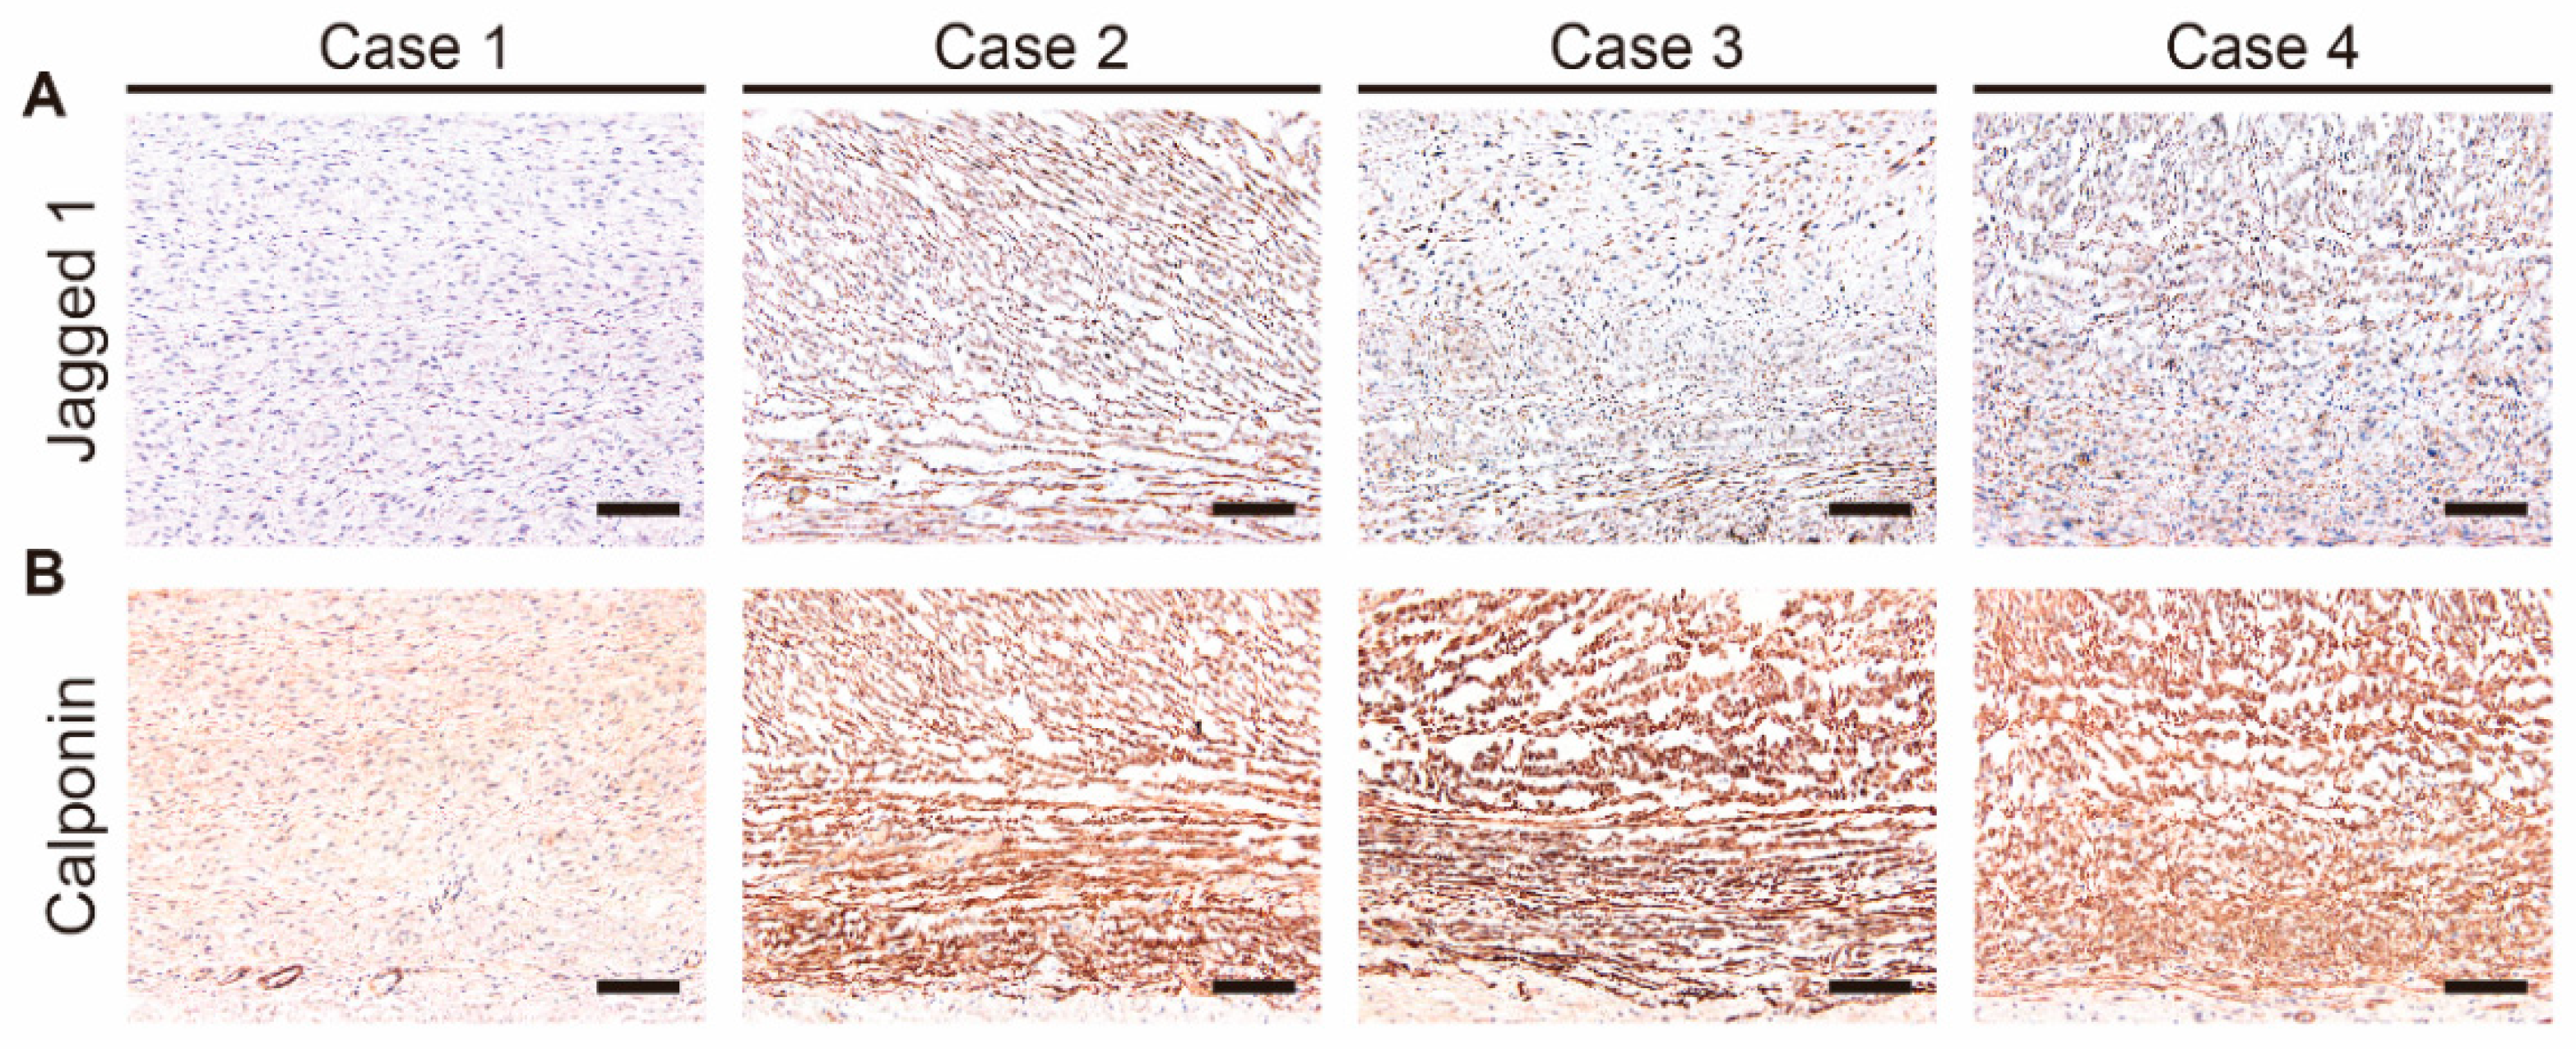
3.2. Histological Differences between the Patent DA and the Closing DA Tissues
3.3. Microarray Analysis of the IT and the Tunica Media of Human DA Tissues
3.4. Transcriptomic Differences between the Tunica Media of Closing DA Tissues and the Patent DA Tissue
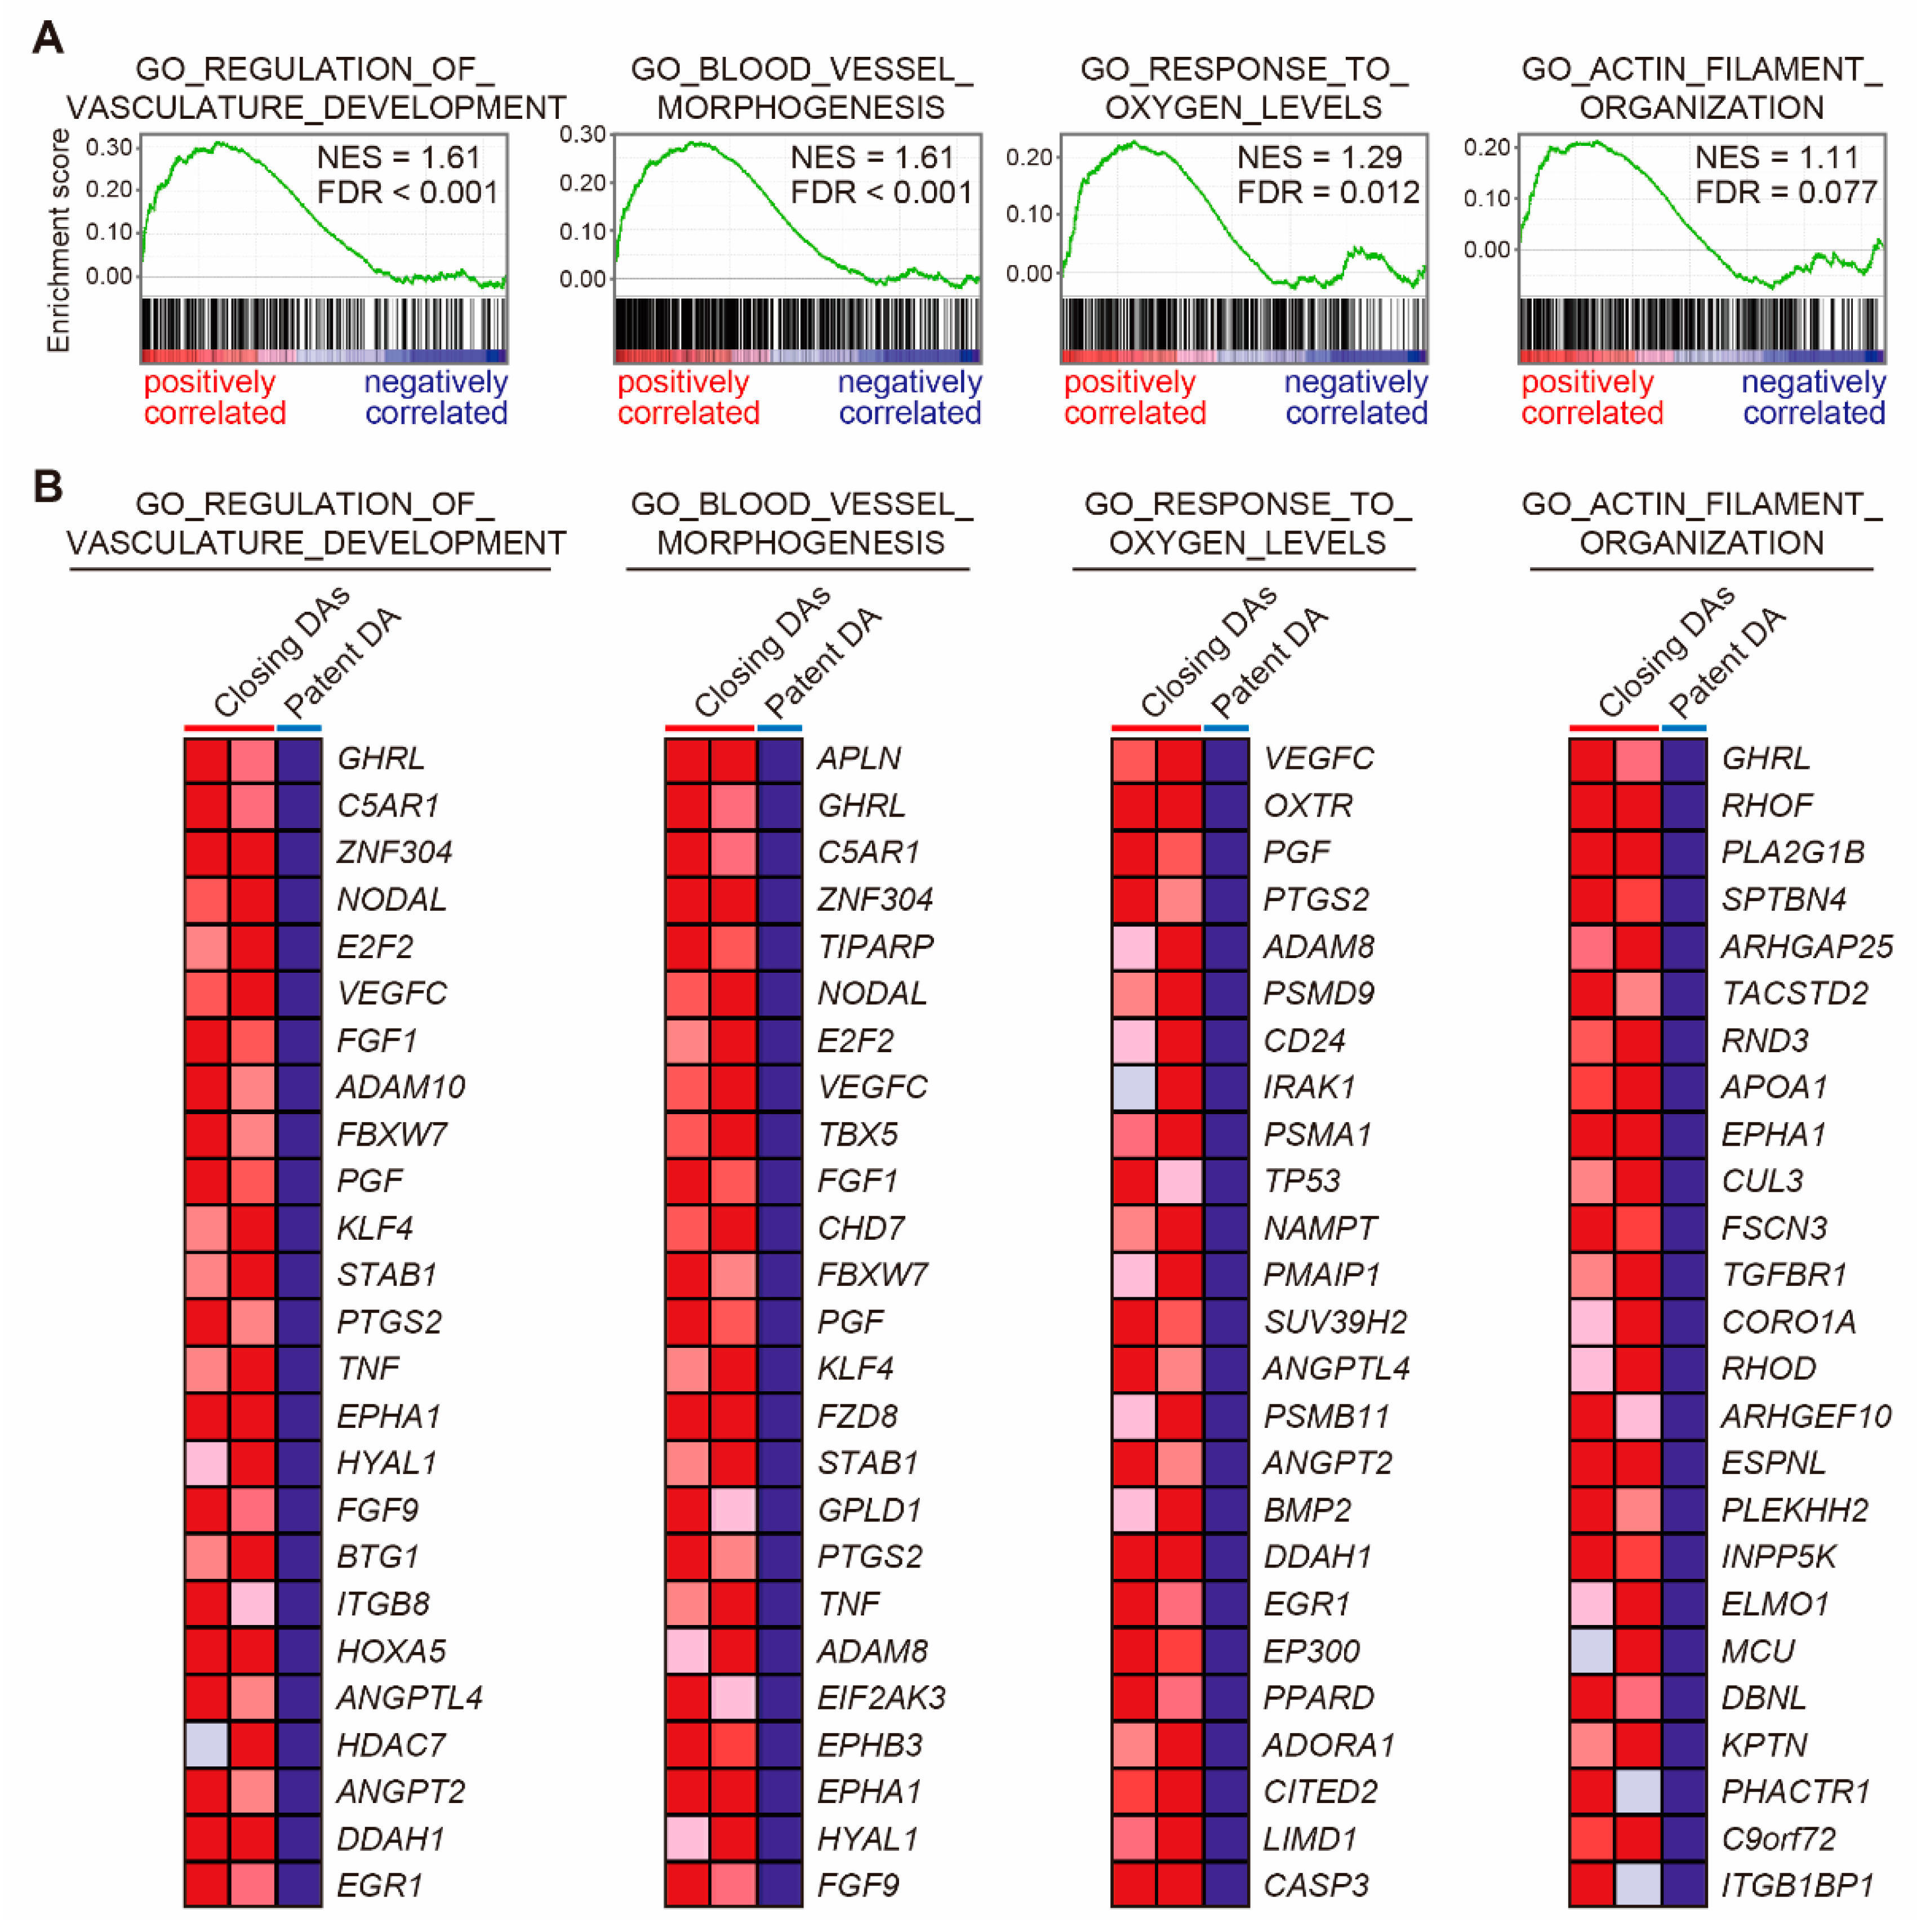
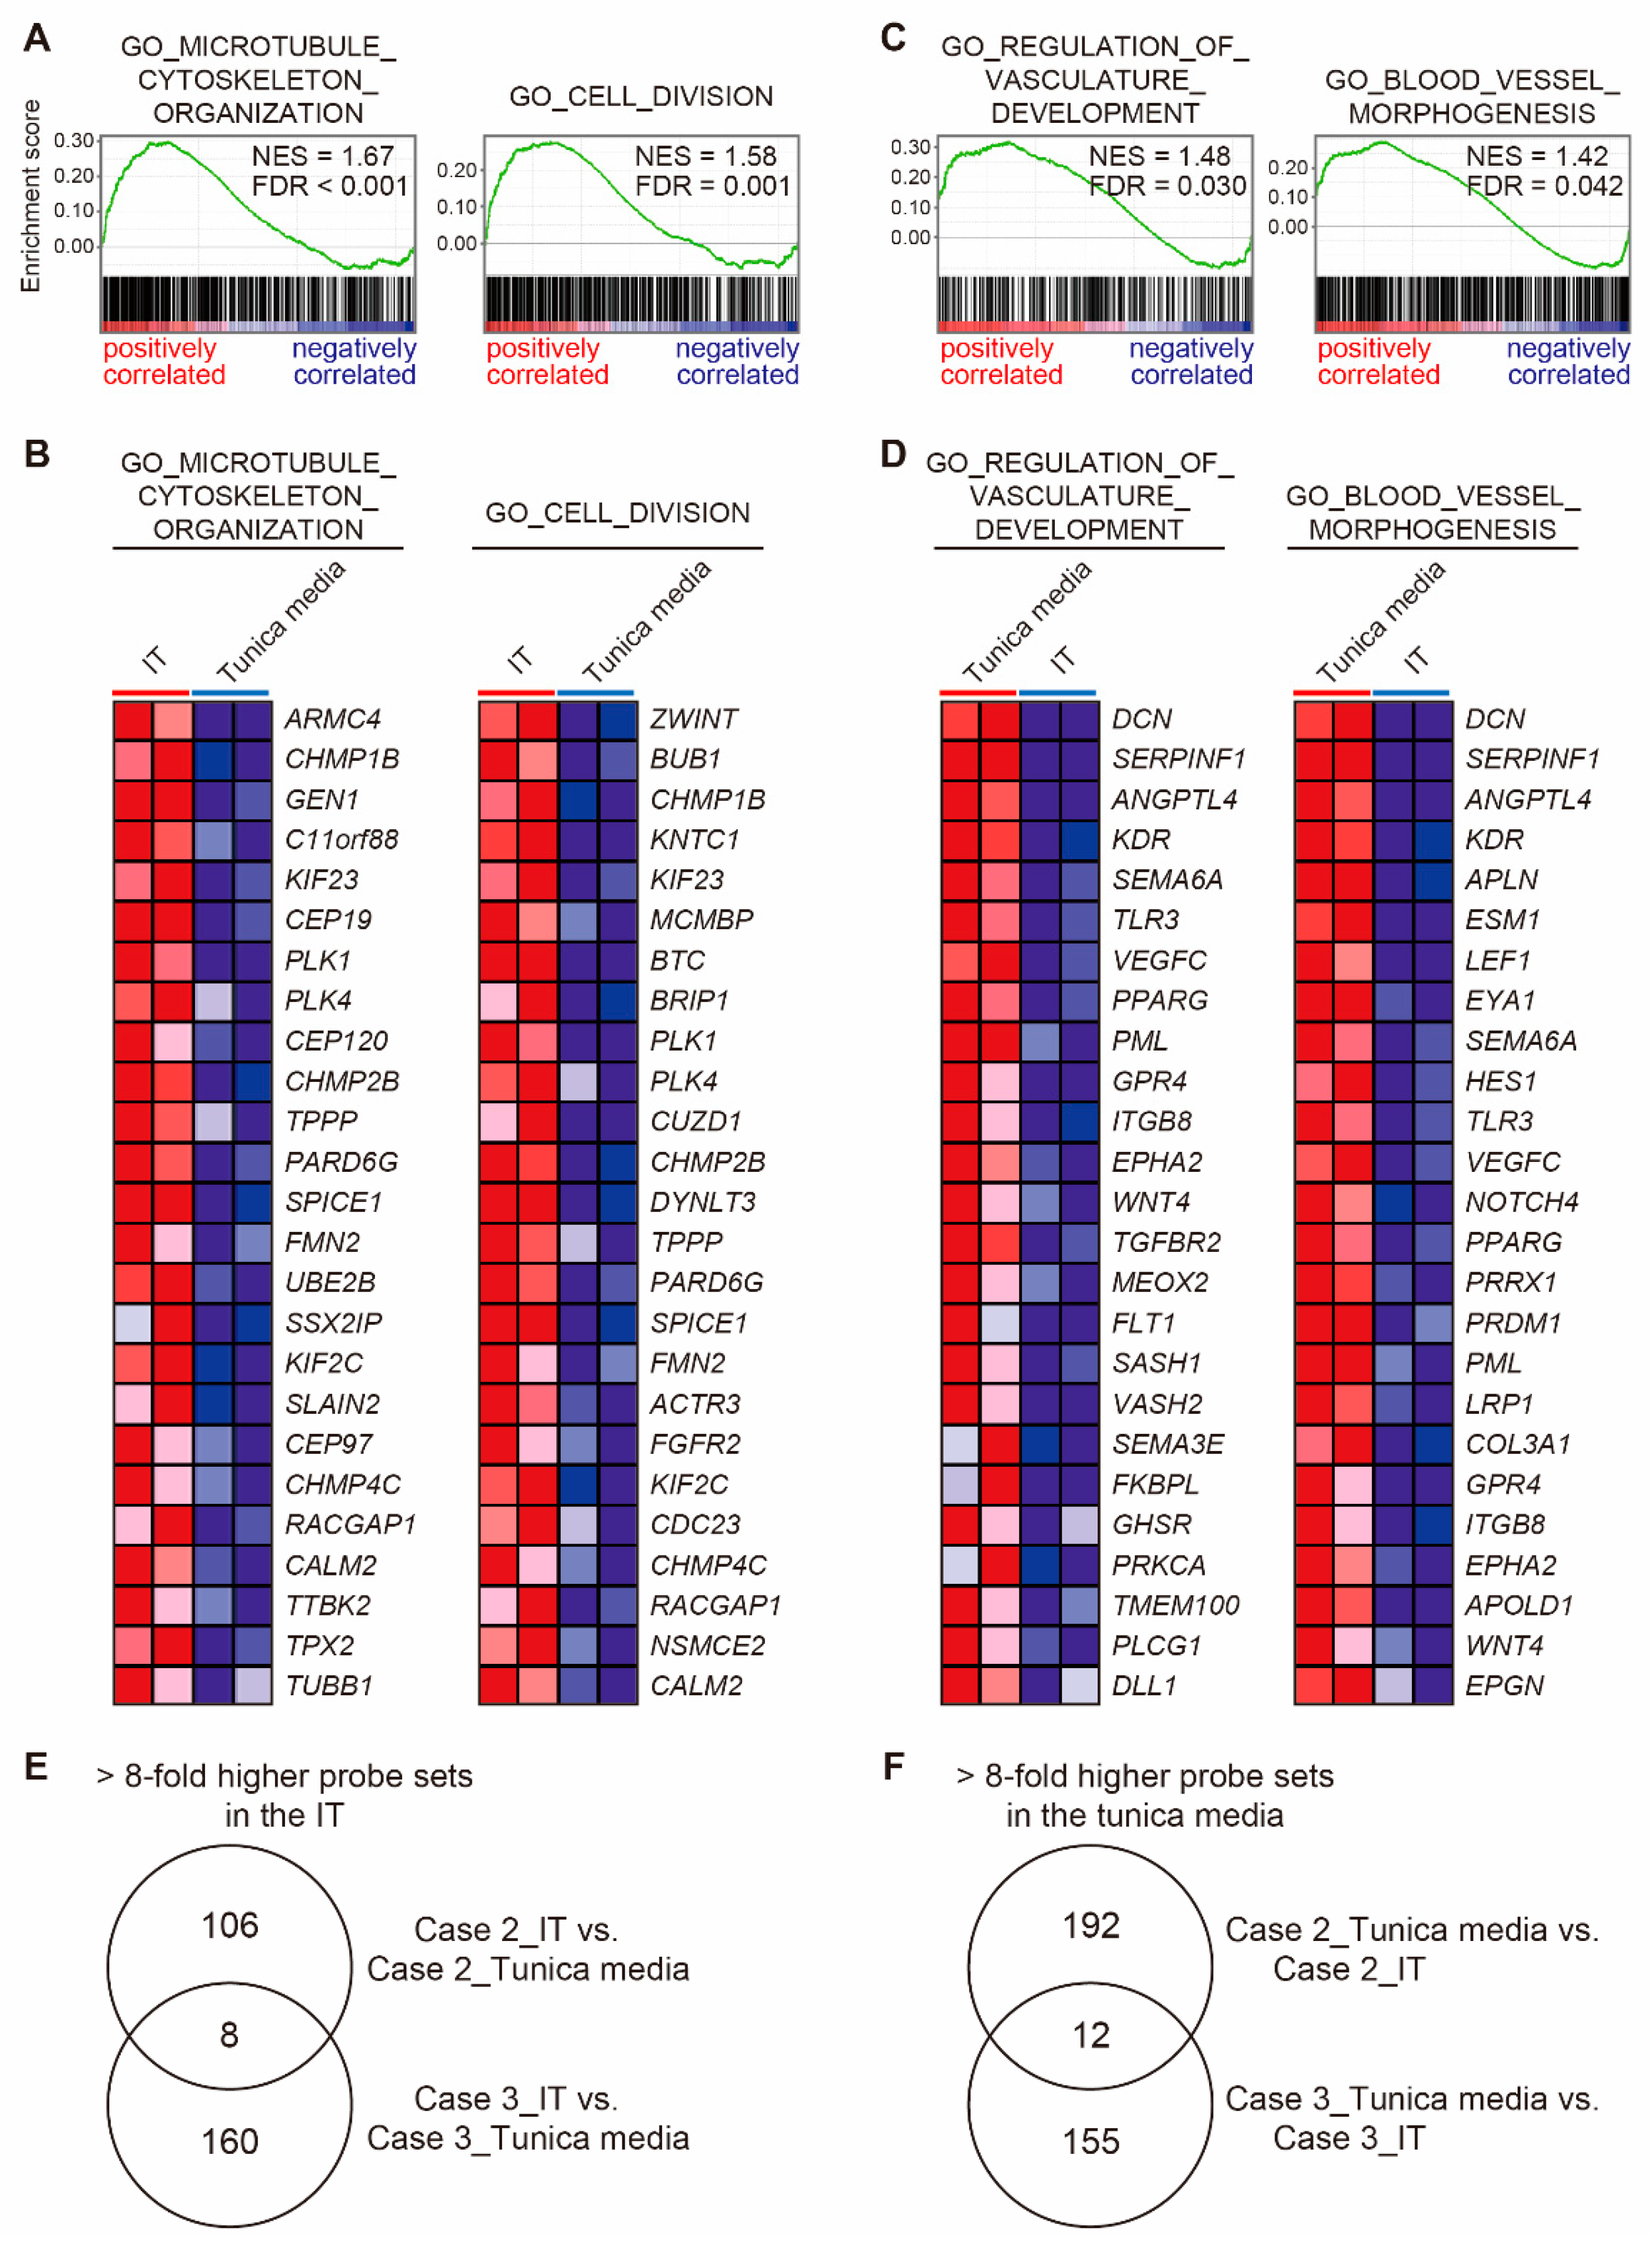
3.5. Vascular Development-Related Genes in Human DA Tissues
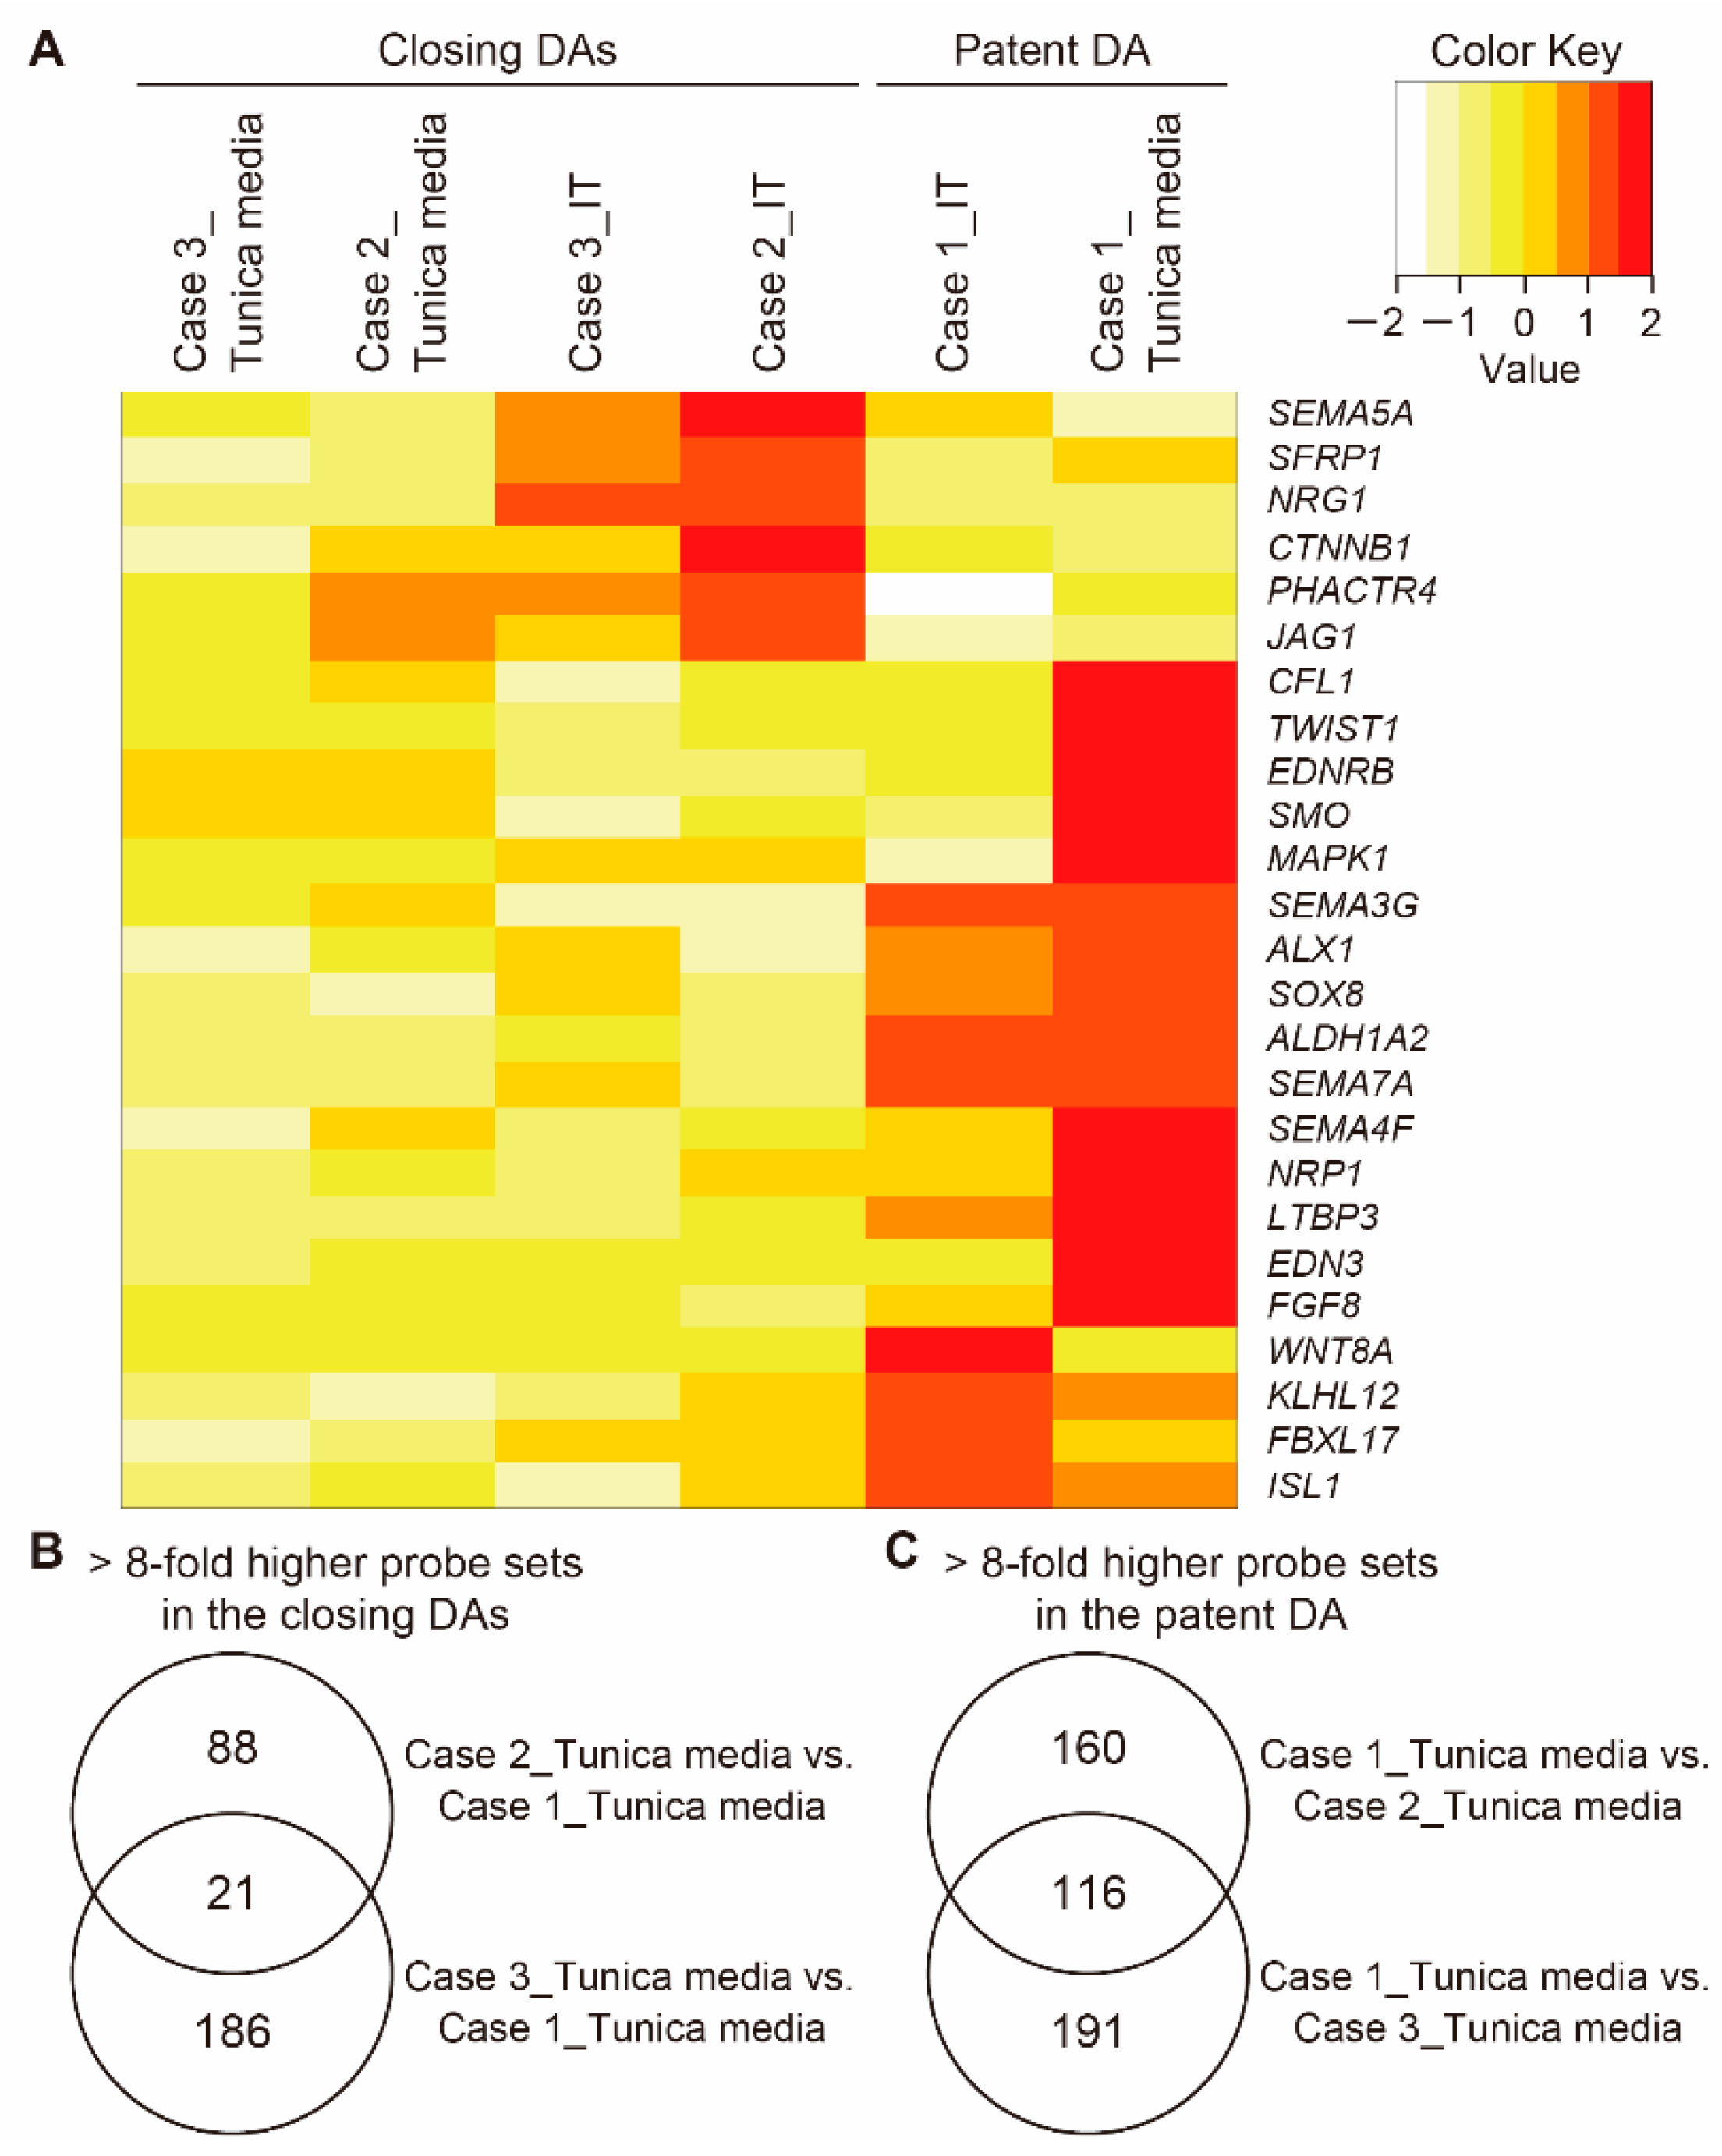
3.6. The Closing or Patent DA Tissue-Specific Gene Expression
3.7. Jagged 1 Was Highly Expressed in the Closing DA Tissues
3.8. Transcriptomic Characteristics of the IT and the Tunica Media in the Closing DA Tissues
4. Discussion
5. Conclusions
Supplementary Materials
Author Contributions
Funding
Institutional Review Board Statement
Informed Consent Statement
Data Availability Statement
Acknowledgments
Conflicts of Interest
References
- Slomp, J.; de Groot, A.C.G.; Glukhova, M.A.; van Munsteren, J.C.; Kockx, M.M.; Schwartz, S.M.; Kote-liansky, V.E. Differentiation, dedifferentiation, and apoptosis of smooth muscle cells during the development of the human ductus arteriosus. Arterioscler. Thromb. Vasc. Biol. 1997, 17, 1003–1009. [Google Scholar] [CrossRef]
- Yokoyama, U.; Minamisawa, S.; Ishikawa, Y. Regulation of vascular tone and remodeling of the ductus arteriosus. J. Smooth Muscle Res. 2010, 46, 77–87. [Google Scholar] [CrossRef] [PubMed] [Green Version]
- Yokoyama, U.; Minamisawa, S.; Katayama, A.; Tang, T.; Suzuki, S.; Iwatsubo, K.; Iwasaki, S.; Kurotani, R.; Okumura, S.; Sato, M.; et al. Differential Regulation of Vascular Tone and Remodeling via Stimulation of Type 2 and Type 6 Adenylyl Cyclases in the Ductus Arteriosus. Circ. Res. 2010, 106, 1882–1892. [Google Scholar] [CrossRef] [PubMed]
- Yokoyama, U.; Minamisawa, S.; Quan, H.; Akaike, T.; Suzuki, S.; Jin, M.; Jiao, Q.; Watanabe, M.; Otsu, K.; Iwasaki, S.; et al. Prostaglandin e2-activated epac promotes neointimal formation of the rat ductus arteriosus by a process distinct from that of camp-dependent protein kinase A. J. Biol. Chem. 2008, 283, 28702–28709. [Google Scholar] [CrossRef] [PubMed] [Green Version]
- Yokoyama, U.; Minamisawa, S.; Quan, H.; Ghatak, S.; Akaike, T.; Segi-Nishida, E.; Iwasaki, S.; Iwamoto, M.; Misra, S.; Tamura, K.; et al. Chronic activation of the prostaglandin receptor ep4 promotes hyaluronan-mediated neointimal formation in the ductus arteriosus. J. Clin. Investig. 2006, 116, 3026–3034. [Google Scholar] [CrossRef] [Green Version]
- Yokoyama, U.; Minamisawa, S.; Shioda, A.; Ishiwata, R.; Jin, M.H.; Masuda, M.; Asou, T.; Sugimoto, Y.; Aoki, H.; Nakamura, T.; et al. Prostaglandin E2 Inhibits Elastogenesis in the Ductus Arteriosus via EP4 Signaling. Circulation 2014, 129, 487–496. [Google Scholar] [CrossRef] [Green Version]
- Yokoyama, U. Prostaglandin E-mediated molecular mechanisms driving remodeling of the ductus arteriosus. Pediatr. Int. 2015, 57, 820–827. [Google Scholar] [CrossRef]
- Forsey, J.T.; Elmasry, O.A.; Martin, R.P. Patent arterial duct. Orphanet J. Rare Dis. 2009, 4, 17–19. [Google Scholar] [CrossRef] [Green Version]
- De Groot, A.C.G. Persistent ductus arteriosus: Most probably a primary congenital malformation. Br. Heart J. 1977, 39, 610–618. [Google Scholar] [CrossRef] [Green Version]
- Yokoyama, U.; Sato, Y.; Akaike, T.; Ishida, S.; Sawada, J.; Nagao, T.; Quan, H.; Jin, M.; Iwamoto, M.; Yokota, S.; et al. Maternal vitamin A alters gene profiles and structural maturation of the rat ductus arteriosus. Physiol. Genom. 2007, 31, 139–157. [Google Scholar] [CrossRef] [Green Version]
- Jin, M.H.; Yokoyama, U.; Sato, Y.; Shioda, A.; Jiao, Q.; Ishikawa, Y.; Minamisawa, S. DNA microarray profiling identified a new role of growth hormone in vascular remodeling of rat ductus arteriosus. J. Physiol. Sci. 2011, 61, 167–179. [Google Scholar] [CrossRef]
- Liu, N.M.; Yokota, T.; Maekawa, S.; Lu, P.; Zheng, Y.W.; Taniguchi, H.; Yokoyama, U.; Kato, T.; Minamisawa, S. Transcription profiles of endothelial cells in the rat ductus arteriosus during a perinatal period. PLoS ONE 2013, 8, e73685. [Google Scholar] [CrossRef] [Green Version]
- Goyal, R.; Goyal, D.; Longo, L.D.; Clyman, R.I. Microarray gene expression analysis in ovine ductus arteriosus during fetal development and birth transition. Pediatr. Res. 2016, 80, 610–618. [Google Scholar] [CrossRef] [Green Version]
- Bokenkamp, R.; van Brempt, R.; van Munsteren, J.C.; van den Wijngaert, I.; de Hoogt, R.; Finos, L.; Goeman, J.; Groot, A.C.; Poelmann, R.E.; Blom, N.A.; et al. Dlx1 and rgs5 in the ductus arteriosus: Vessel-specific genes identified by transcriptional profiling of laser-capture microdissected endothelial and smooth muscle cells. PLoS ONE 2014, 9, e86892. [Google Scholar] [CrossRef] [Green Version]
- Shelton, E.L.; Ector, G.; Galindo, C.L.; Hooper, C.W.; Brown, N.; Wilkerson, I.; Pfaltzgraff, E.R.; Paria, B.C.; Cotton, R.B.; Stoller, J.Z.; et al. Transcriptional profiling reveals ductus arteriosus-specific genes that regulate vascular tone. Physiol. Genom. 2014, 46, 457–466. [Google Scholar] [CrossRef] [Green Version]
- Costa, M.; Barogi, S.; Socci, N.D.; Angeloni, D.; Maffei, M.; Baragatti, B.; Chiellini, C.; Grasso, E.; Coceani, F. Gene expression in ductus arteriosus and aorta: Comparison of birth and oxygen effects. Physiol. Genom. 2006, 25, 250–262. [Google Scholar] [CrossRef] [PubMed]
- Hsieh, Y.T.; Liu, N.M.; Ohmori, E.; Yokota, T.; Kajimura, I.; Akaike, T.; Ohshima, T.; Goda, N.; Minamisawa, S. Transcription profiles of the ductus arteriosus in brown-norway rats with irregular elastic fiber formation. Circ. J. 2014, 78, 1224–1233. [Google Scholar] [CrossRef] [PubMed] [Green Version]
- Yarboro, M.T.; Durbin, M.D.; Herington, J.L.; Shelton, E.L.; Zhang, T.; Ebby, C.G.; Stoller, J.Z.; Clyman, R.I.; Reese, J. Transcriptional profiling of the ductus arteriosus: Comparison of rodent microarrays and human RNA sequencing. Semin. Perinatol. 2018, 42, 212–220. [Google Scholar] [CrossRef]
- Mueller, P.P.; Drynda, A.; Goltz, D.; Hoehn, R.; Hauser, H.; Peuster, M. Common signatures for gene expression in postnatal patients with patent arterial ducts and stented arteries. Cardiol. Young 2009, 19, 352–359. [Google Scholar] [CrossRef] [PubMed]
- Subramanian, A.; Tamayo, P.; Mootha, V.K.; Mukherjee, S.; Ebert, B.L.; Gillette, M.A.; Paulovich, A.; Pomeroy, S.L.; Golub, T.R.; Lander, E.S.; et al. Gene set enrichment analysis: A knowledge-based approach for interpreting genome-wide expression profiles. Proc. Natl. Acad. Sci. USA 2005, 102, 15545–15550. [Google Scholar] [CrossRef] [PubMed] [Green Version]
- Saito, J.; Yokoyama, U.; Nicho, N.; Zheng, Y.-W.; Ichikawa, Y.; Ito, S.; Umemura, M.; Fujita, T.; Ito, S.; Taniguchi, H.; et al. Tissue-type plasminogen activator contributes to remodeling of the rat ductus arteriosus. PLoS ONE 2018, 13, e0190871. [Google Scholar] [CrossRef] [Green Version]
- Ito, S.; Yokoyama, U.; Nakakoji, T.; Cooley, M.A.; Sasaki, T.; Hatano, S.; Kato, Y.; Saito, J.; Nicho, N.; Iwasaki, S.; et al. Fibulin-1 Integrates Subendothelial Extracellular Matrices and Contributes to Anatomical Closure of the Ductus Arteriosus. Arterioscler. Thromb. Vasc. Biol. 2020, 40, 2212–2226. [Google Scholar] [CrossRef]
- Blom, M.; Reis, K.; Heldin, J.; Kreuger, J.; Aspenstrom, P. The atypical Rho GTPase RhoD is a regulator of actin cytoskeleton dynamics and directed cell migration. Exp. Cell Res. 2017, 352, 255–264. [Google Scholar] [CrossRef] [PubMed] [Green Version]
- Kang, Y.; Kim, J.; Anderson, J.P.; Wu, J.; Gleim, S.R.; Kundu, R.K.; McLean, D.L.; Kim, J.D.; Park, H.; Jin, S.W.; et al. Apelin-APJ signaling is a critical regulator of endothelial MEF2 activation in cardiovascular development. Circ. Res. 2013, 113, 22–31. [Google Scholar] [CrossRef] [PubMed] [Green Version]
- Shimoda, M.; Yoshida, H.; Mizuno, S.; Hirozane, T.; Horiuchi, K.; Yoshino, Y.; Hara, H.; Kanai, Y.; Inoue, S.; Ishijima, M.; et al. Hyaluronan-Binding Protein Involved in Hyaluronan Depolymerization Controls Endochondral Ossification through Hyaluronan Metabolism. Am. J. Pathol. 2017, 187, 1162–1176. [Google Scholar] [CrossRef] [Green Version]
- Benso, A.; Broglio, F.; Marafetti, L.; Lucatello, B.; Seardo, M.A.; Granata, R.; Martina, V.; Papotti, M.; Muccioli, G.; Ghigo, E. Ghrelin and Synthetic Growth Hormone Secretagogues are Cardioactive Molecules with Identities and Differences. Semin. Vasc. Med. 2004, 4, 107–114. [Google Scholar] [CrossRef]
- Luo, X.; Liu, J.; Zhou, H.; Chen, L. Apelin/APJ system: A critical regulator of vascular smooth muscle cell. J. Cell. Physiol. 2018, 233, 5180–5188. [Google Scholar] [CrossRef]
- Scholler, N.; Hayden-Ledbetter, M.; Hellstrom, K.E.; Hellstrom, I.; Ledbetter, J.A. Cd83 is an i-type lectin adhesion receptor that binds monocytes and a subset of activated cd8+ t cells [corrected]. J. Immunol. 2001, 166, 3865–3872. [Google Scholar] [CrossRef] [PubMed] [Green Version]
- Khabibullin, D.; Medvetz, D.A.; Pinilla, M.; Hariharan, V.; Li, C.; Hergrueter, A.; Contreras, M.L.; Zhang, E.; Parkhitko, A.; Yu, J.J.; et al. Folliculin regulates cell-cell adhesion, AMPK, and mTORC1 in a cell-type-specific manner in lung-derived cells. Physiol. Rep. 2014, 2, e12107. [Google Scholar] [CrossRef] [PubMed]
- Alba, G.A.; Samokhin, A.O.; Wang, R.S.; Zhang, Y.Y.; Wertheim, B.M.; Arons, E.; Greenfield, E.A.; Slingsby, M.H.L.; Ceglowski, J.R.; Haley, K.J.; et al. NEDD9 is a Novel and Modifiable Mediator of Platelet-Endothelial Adhesion in the Pulmonary Circulation. Am. J. Respir. Crit. Care Med. 2021. [Google Scholar] [CrossRef]
- Aquino, J.B.; Lallemend, F.; Marmigere, F.; Adameyko, I.; Golemis, E.A.; Ernfors, P. The retinoic acid inducible Cas-family signaling protein Nedd9 regulates neural crest cell migration by modulating adhesion and actin dynamics. Neuroscience 2009, 162, 1106–1119. [Google Scholar] [CrossRef] [PubMed] [Green Version]
- Dieci, E.; Casati, L.; Pagani, F.; Celotti, F.; Sibilia, V. Acylated and unacylated ghrelin protect MC3T3-E1 cells against tert-butyl hydroperoxide-induced oxidative injury: Pharmacological characterization of ghrelin receptor and possible epigenetic involvement. Amino Acids 2014, 46, 1715–1725. [Google Scholar] [CrossRef] [PubMed]
- Robertson, I.B.; Horiguchi, M.; Zilberberg, L.; Dabovic, B.; Hadjiolova, K.; Rifkin, D.B. Latent tgf-beta-binding proteins. Matrix Biol. 2015, 47, 44–53. [Google Scholar] [CrossRef]
- Zhou, Y.; Cashman, T.J.; Nevis, K.R.; Obregon, P.; Carney, S.A.; Liu, Y.; Gu, A.; Mosimann, C.; Sondalle, S.; Peterson, R.E.; et al. Latent tgf-beta binding protein 3 identifies a second heart field in zebrafish. Nature 2011, 474, 645–648. [Google Scholar] [CrossRef] [PubMed] [Green Version]
- Huang, J.; Cheng, L.; Li, J.; Chen, M.; Zhou, D.; Lu, M.M.; Proweller, A.; Epstein, J.A.; Parmacek, M.S. Myocardin regulates expression of contractile genes in smooth muscle cells and is required for closure of the ductus arteriosus in mice. J. Clin. Investig. 2008, 118, 515–525. [Google Scholar] [CrossRef] [Green Version]
- Ivey, K.N.; Sutcliffe, D.; Richardson, J.; Clyman, R.I.; Garcia, J.A.; Srivastava, D. Transcriptional regulation during development of the ductus arteriosus. Circ. Res. 2008, 103, 388–395. [Google Scholar] [CrossRef] [Green Version]
- Feng, X.; Krebs, L.T.; Gridley, T. Patent ductus arteriosus in mice with smooth muscle-specific Jag1 deletion. Development 2010, 137, 4191–4199. [Google Scholar] [CrossRef] [Green Version]
- Hohenauer, T.; Berking, C.; Schmidt, A.; Haferkamp, S.; Senft, D.; Kammerbauer, C.; Fraschka, S.; Graf, S.A.; Irmler, M.; Beckers, J.; et al. The neural crest transcription factor brn3a is expressed in melanoma and required for cell cycle progression and survival. EMBO Mol. Med. 2013, 5, 919–934. [Google Scholar] [CrossRef]
- Mi, S.; Wang, P.; Lin, L. Mir-188-3p inhibits vascular smooth muscle cell proliferation and migration by targeting fibro-blast growth factor 1 (fgf1). Med. Sci. Monit. 2020, 26, e924394. [Google Scholar] [CrossRef] [PubMed]
- Heng, W.; Huang, J.A.; Wang, Z.Y. Inhibition of Cellular Growth and Migration by Suppression of Endothelial Protein C Receptor (EPCR) in Lung Carcinoma Cells. Oncol. Res. 2012, 20, 231–240. [Google Scholar] [CrossRef]
- Robb, L.; Hartley, L.; Wang, C.C.; Harvey, R.P.; Begley, C.G. Musculin: A murine basic helix-loop-helix transcription factor gene expressed in embryonic skeletal muscle. Mech. Dev. 1998, 76, 197–201. [Google Scholar] [CrossRef]
- Järveläinen, H.; Vernon, R.B.; Gooden, M.D.; Francki, A.; Lara, S.; Johnson, P.Y.; Kinsella, M.G.; Sage, E.H.; Wight, T.N. Overexpression of Decorin by Rat Arterial Smooth Muscle Cells Enhances Contraction of Type I Collagen In Vitro. Arterioscler. Thromb. Vasc. Biol. 2004, 24, 67–72. [Google Scholar] [CrossRef]
- Figueroa, C.D.; Marchant, A.; Novoa, U.; Forstermann, U.; Jarnagin, K.; Scholkens, B.; Muller-Esterl, W. Differential distribution of bradykinin b(2) receptors in the rat and human cardiovascular system. Hypertension 2001, 37, 110–120. [Google Scholar] [CrossRef] [Green Version]
- Danielson, K.G.; Baribault, H.; Holmes, D.F.; Graham, H.; Kadler, K.E.; Iozzo, R.V. Targeted Disruption of Decorin Leads to Abnormal Collagen Fibril Morphology and Skin Fragility. J. Cell Biol. 1997, 136, 729–743. [Google Scholar] [CrossRef] [PubMed] [Green Version]
- Reinboth, B.; Hanssen, E.; Cleary, E.G.; Gibson, M.A. Molecular interactions of biglycan and decorin with elastic fiber components: Biglycan forms a ternary complex with tropoelastin and microfibril-associated glycoprotein 1. J. Biol. Chem. 2002, 277, 3950–3957. [Google Scholar] [CrossRef] [Green Version]
- Schussler, O.; Gharibeh, L.; Mootoosamy, P.; Murith, N.; Tien, V.; Rougemont, A.L.; Sologashvili, T.; Suuronen, E.; Lecarpentier, Y.; Ruel, M. Cardiac Neural Crest Cells: Their Rhombomeric Specification, Migration, and Association with Heart and Great Vessel Anomalies. Cell. Mol. Neurobiol. 2020, 41, 403–429. [Google Scholar] [CrossRef] [PubMed]
- Sawada, H.; Rateri, D.L.; Moorleghen, J.J.; Majesky, M.W.; Daugherty, A. Smooth Muscle Cells Derived From Second Heart Field and Cardiac Neural Crest Reside in Spatially Distinct Domains in the Media of the Ascending Aorta—Brief Report. Arterioscler. Thromb. Vasc. Biol. 2017, 37, 1722–1726. [Google Scholar] [CrossRef] [Green Version]
- Zhou, Z.; Wang, J.; Guo, C.; Chang, W.; Zhuang, J.; Zhu, P.; Li, X. Temporally Distinct Six2 -Positive Second Heart Field Progenitors Regulate Mammalian Heart Development and Disease. Cell Rep. 2017, 18, 1019–1032. [Google Scholar] [CrossRef] [Green Version]
- Wang, X.; Chen, D.; Chen, K.; Jubran, A.; Ramirez, A.; Astrof, S. Endothelium in the pharyngeal arches 3, 4 and 6 is derived from the second heart field. Dev. Biol. 2017, 421, 108–117. [Google Scholar] [CrossRef] [PubMed]
- Kim, H.S.; Aikawa, M.; Kimura, K.; Kuroo, M.; Nakahara, K.; Suzuki, T.; Katoh, H.; Okamoto, E.; Yazaki, Y.; Nagai, R. Ductus arteriosus. Advanced differentiation of smooth muscle cells demonstrated by myosin heavy chain isoform expression in rabbits. Circulation 1993, 88, 1804–1810. [Google Scholar] [CrossRef] [Green Version]
- Schneider, D.J.; Moore, J.W. Patent ductus arteriosus. Circulation 2006, 114, 1873–1882. [Google Scholar] [CrossRef]
- Bokenkamp, R.; DeRuiter, M.C.; van Munsteren, C.; de Groot, A.C.G. Insights into the pathogenesis and genetic background of patency of the ductus arteriosus. Neonatology 2010, 98, 6–17. [Google Scholar] [CrossRef] [PubMed]
- Hajj, H.; Dagle, J.M. Genetics of Patent Ductus Arteriosus Susceptibility and Treatment. Semin. Perinatol. 2012, 36, 98–104. [Google Scholar] [CrossRef] [PubMed]
- Lewis, T.R.; Shelton, E.L.; Van Driest, S.L.; Kannankeril, P.J.; Reese, J. Genetics of the patent ductus arteriosus (PDA) and pharmacogenetics of PDA treatment. Semin. Fetal Neonatal Med. 2018, 23, 232–238. [Google Scholar] [CrossRef]
- Rose, V.; Izukawa, T.; Moes, C.A. Syndromes of asplenia and polysplenia. A review of cardiac and non-cardiac malformations in 60 cases withspecial reference to diagnosis and prognosis. Br. Heart J. 1975, 37, 840–852. [Google Scholar] [CrossRef] [Green Version]
- Raya, A.; Kawakami, Y.; Rodriguez-Esteban, C.; Buscher, D.; Koth, C.M.; Itoh, T.; Morita, M.; Raya, R.M.; Dubova, I.; Bessa, J.G.; et al. Notch activity induces nodal expression and mediates the establishment of left-right asymmetry in vertebrate embryos. Genes. Dev. 2003, 17, 1213–1218. [Google Scholar] [CrossRef] [PubMed] [Green Version]
- Krebs, L.T.; Iwai, N.; Nonaka, S.; Welsh, I.C.; Lan, Y.; Jiang, R.; Saijoh, Y.; O’Brien, T.P.; Hamada, H.; Gridley, T. Notch signaling regulates left-right asymmetry determination by inducing nodal expression. Genes. Dev. 2003, 17, 1207–1212. [Google Scholar] [CrossRef] [Green Version]
- De Angelis, M.H.; McIntyre, J., 2nd; Gossler, A. Maintenance of somite borders in mice requires the delta homologue dii1. Nature 1997, 386, 717–721. [Google Scholar] [CrossRef]
- Baeten, J.T.; Jackson, A.R.; McHugh, K.M.; Lilly, B. Loss of Notch2 and Notch3 in vascular smooth muscle causes patent ductus arteriosus. Genesis 2015, 53, 738–748. [Google Scholar] [CrossRef] [PubMed]
- Xue, Y.; Gao, X.; Lindsell, C.E.; Norton, C.R.; Chang, B.; Hicks, C.; Gendron-Maguire, M.; Rand, E.B.; Weinmaster, G.; Gridley, T. Embryonic Lethality and Vascular Defects in Mice Lacking the Notch Ligand Jagged1. Hum. Mol. Genet. 1999, 8, 723–730. [Google Scholar] [CrossRef] [PubMed]
- Kamath, B.M.; Spinner, N.B.; Emerick, K.M.; Chudley, A.E.; Booth, C.; Piccoli, D.A.; Krantz, I.D. Vascular anomalies in alagille syndrome: A significant cause of morbidity and mortality. Circulation 2004, 109, 1354–1358. [Google Scholar] [CrossRef] [Green Version]
- Spinner, N.B.; Colliton, R.P.; Crosnier, C.; Krantz, I.D.; Hadchouel, M.; Meunier-Rotival, M. Jagged1 mutations in alagille syndrome. Hum. Mutat. 2001, 17, 18–33. [Google Scholar] [CrossRef]
- Clyman, R.I.; Mauray, F.; Roman, C.; Rudolph, A.M.; Heymann, M.A.; Maury, F. Circulating prostaglandin E2 concentrations and patent ductus arteriosus in fetal and neonatal lambs. J. Pediatr. 1980, 97, 455–461. [Google Scholar] [CrossRef]
- Smith, G.C. The pharmacology of the ductus arteriosus. Pharmacol. Rev. 1998, 50, 35–58. [Google Scholar]
- Mitani, Y.; Takabayashi, S.; Sawada, H.; Ohashi, H.; Hayakawa, H.; Ikeyama, Y.; Imanaka-Yoshida, K.; Maruyama, K.; Shimpo, H.; Komada, Y. Fate of the “opened” arterial duct: Lessons learned from bilateral pulmonary artery banding for hypoplastic left heart syndrome under the continuous infusion of prostaglandin E1. J. Thorac. Cardiovasc. Surg. 2007, 133, 1653–1654.e2. [Google Scholar] [CrossRef] [Green Version]
- De Groot, A.C.G.; Strengers, J.L. Histopathology of the arterial duct (ductus arteriosus) with and without treatment with prostaglandin E1. Int. J. Cardiol. 1988, 19, 153–166. [Google Scholar] [CrossRef]


| Case Number | Diagnosis | Gestational Age (Weeks) | Birth Weight (g) | Age at Operation (Days) | Duration of PGE1 Administration (Days) | Closing Tendency of the DA |
|---|---|---|---|---|---|---|
| 1 | Polysplenia, intermediate AVSD, CoA, TAPVC (cardiac type), PDA, IVC interruption (azygos connection) | 38 | 2714 | 17 | 0 | No |
| 2 | DORV (subpulmonary VSD), hypoplastic distal arch, CoA, PFO | 41 | 2948 | 5 | 5 | Yes |
| 3 | HLHS, TR, cor triatriatum, PLSVC | 40 | 3352 | 24 | 24 | Yes |
| 4 | HLHS (MA, AA), PLSVC | 37 | 2654 | 98 | 98 | Yes |
| Gene Set Name | Size | NES | FDR q-Value | Rank at Max |
|---|---|---|---|---|
| GO_REGULATION_OF_VASCULATURE_DEVELOPMENT | 310 | 1.61 | 0.000 | 6660 |
| GO_BLOOD_VESSEL_MORPHOGENESIS | 564 | 1.61 | 0.000 | 6712 |
| GO_GOLGI_VESICLE_TRANSPORT | 350 | 1.61 | 0.000 | 8448 |
| GO_REGULATION_OF_HEMOPOIESIS | 441 | 1.60 | 0.000 | 6338 |
| GO_NCRNA_PROCESSING | 340 | 1.59 | 0.000 | 5889 |
| GO_VIRAL_LIFE_CYCLE | 315 | 1.58 | 0.000 | 7537 |
| GO_REGULATION_OF_MAP_KINASE_ACTIVITY | 332 | 1.55 | 0.000 | 6500 |
| GO_LEUKOCYTE_CELL_CELL_ADHESION | 339 | 1.54 | 0.000 | 5082 |
| GO_NEGATIVE_REGULATION_OF_IMMUNE_SYSTEM_PROCESS | 405 | 1.54 | 0.000 | 4982 |
| GO_NEGATIVE_REGULATION_OF_PHOSPHORYLATION | 424 | 1.53 | 0.000 | 5671 |
| GO_POSITIVE_REGULATION_OF_CELL_ADHESION | 410 | 1.53 | 0.000 | 4942 |
| GO_NEGATIVE_REGULATION_OF_CELL_CYCLE_PROCESS | 312 | 1.53 | 0.000 | 5276 |
| GO_NUCLEAR_TRANSPORT | 337 | 1.52 | 0.000 | 7197 |
| GO_T_CELL_ACTIVATION | 458 | 1.51 | 0.000 | 5293 |
| GO_IN_UTERO_EMBRYONIC_DEVELOPMENT | 372 | 1.47 | 0.000 | 6660 |
| GO_REGULATION_OF_INFLAMMATORY_RESPONSE | 348 | 1.47 | 0.000 | 5237 |
| GO_PEPTIDYL_LYSINE_MODIFICATION | 353 | 1.46 | 0.000 | 8228 |
| GO_REGULATION_OF_PROTEIN_CATABOLIC_PROCESS | 372 | 1.45 | 0.000 | 6333 |
| GO_IMMUNE_RESPONSE_REGULATING_SIGNALING_PATHWAY | 385 | 1.40 | 0.000 | 7472 |
| GO_CELLULAR_RESPONSE_TO_EXTERNAL_STIMULUS | 305 | 1.40 | 0.000 | 7120 |
| GO_REGULATION_OF_CELL_CELL_ADHESION | 406 | 1.39 | 0.000 | 5082 |
| GO_RNA_SPLICING | 423 | 1.39 | 0.000 | 7328 |
| GO_ACTIVATION_OF_PROTEIN_KINASE_ACTIVITY | 321 | 1.39 | 0.000 | 5553 |
| GO_REGULATION_OF_CELLULAR_RESPONSE_TO_STRESS | 690 | 1.39 | 0.000 | 6338 |
| GO_RAS_PROTEIN_SIGNAL_TRANSDUCTION | 330 | 1.39 | 0.000 | 7040 |
| GO_POSITIVE_REGULATION_OF_PROTEIN_SERINE_THREONINE_KINASE_ACTIVITY | 329 | 1.38 | 0.000 | 6543 |
| GO_AMEBOIDAL_TYPE_CELL_MIGRATION | 386 | 1.38 | 0.000 | 7624 |
| GO_REGULATION_OF_DNA_BINDING_TRANSCRIPTION_FACTOR_ACTIVITY | 415 | 1.37 | 0.000 | 6196 |
| GO_REGULATION_OF_LYMPHOCYTE_ACTIVATION | 420 | 1.35 | 0.000 | 5268 |
| GO_RNA_SPLICING_VIA_TRANSESTERIFICATION_REACTIONS | 341 | 1.35 | 0.000 | 7328 |
| GO_REGULATION_OF_T_CELL_ACTIVATION | 316 | 1.35 | 0.000 | 5256 |
| GO_LYMPHOCYTE_DIFFERENTIATION | 354 | 1.34 | 0.000 | 5436 |
| GO_ORGANELLE_FISSION | 414 | 1.34 | 0.000 | 4640 |
| GO_POSITIVE_REGULATION_OF_CATABOLIC_PROCESS | 430 | 1.34 | 0.000 | 4648 |
| GO_EPITHELIAL_CELL_PROLIFERATION | 379 | 1.33 | 0.011 | 6543 |
| GO_REGULATION_OF_PROTEIN_SERINE_THREONINE_KINASE_ACTIVITY | 495 | 1.33 | 0.010 | 6256 |
| GO_MRNA_PROCESSING | 477 | 1.33 | 0.010 | 7113 |
| GO_EMBRYO_DEVELOPMENT_ENDING_IN_BIRTH_OR_EGG_HATCHING | 644 | 1.32 | 0.010 | 6259 |
| GO_NEGATIVE_REGULATION_OF_INTRACELLULAR_SIGNAL_TRANSDUCTION | 475 | 1.32 | 0.009 | 7981 |
| GO_PROTEIN_POLYUBIQUITINATION | 327 | 1.31 | 0.014 | 6212 |
| GO_RIBONUCLEOPROTEIN_COMPLEX_BIOGENESIS | 405 | 1.31 | 0.013 | 6510 |
| GO_MAINTENANCE_OF_LOCATION | 305 | 1.31 | 0.013 | 5837 |
| GO_LEUKOCYTE_DIFFERENTIATION | 514 | 1.31 | 0.013 | 7110 |
| GO_POSITIVE_REGULATION_OF_CELL_CYCLE | 357 | 1.31 | 0.013 | 5009 |
| GO_POSTTRANSCRIPTIONAL_REGULATION_OF_GENE_EXPRESSION | 554 | 1.29 | 0.012 | 6212 |
| GO_RESPONSE_TO_OXYGEN_LEVELS | 370 | 1.29 | 0.012 | 6459 |
| GO_POSITIVE_REGULATION_OF_ESTABLISHMENT_OF_PROTEIN_LOCALIZATION | 371 | 1.28 | 0.012 | 6982 |
| GO_REGULATION_OF_METAL_ION_TRANSPORT | 363 | 1.28 | 0.012 | 4661 |
| GO_PROTEASOMAL_PROTEIN_CATABOLIC_PROCESS | 455 | 1.28 | 0.011 | 5596 |
| GO_NEGATIVE_REGULATION_OF_PHOSPHORUS_METABOLIC_PROCESS | 530 | 1.26 | 0.011 | 5671 |
| GO_POSITIVE_REGULATION_OF_GTPASE_ACTIVITY | 375 | 1.26 | 0.011 | 7037 |
| GO_REGULATION_OF_GTPASE_ACTIVITY | 447 | 1.26 | 0.011 | 7095 |
| GO_POSITIVE_REGULATION_OF_RESPONSE_TO_EXTERNAL_STIMULUS | 496 | 1.25 | 0.010 | 6529 |
| GO_COVALENT_CHROMATIN_MODIFICATION | 436 | 1.25 | 0.010 | 6473 |
| GO_NEURON_DEATH | 338 | 1.25 | 0.010 | 7040 |
| GO_POSITIVE_REGULATION_OF_PROTEOLYSIS | 340 | 1.24 | 0.010 | 6359 |
| GO_POSITIVE_REGULATION_OF_CELLULAR_PROTEIN_LOCALIZATION | 307 | 1.24 | 0.010 | 6982 |
| GO_POSITIVE_REGULATION_OF_CYTOKINE_PRODUCTION | 432 | 1.24 | 0.010 | 5082 |
| GO_PROCESS_UTILIZING_AUTOPHAGIC_MECHANISM | 495 | 1.23 | 0.009 | 5327 |
| GO_VESICLE_ORGANIZATION | 315 | 1.23 | 0.009 | 7253 |
| GO_POSITIVE_REGULATION_OF_CELL_ACTIVATION | 324 | 1.23 | 0.009 | 7094 |
| GO_POST_TRANSLATIONAL_PROTEIN_MODIFICATION | 352 | 1.23 | 0.009 | 7885 |
| GO_LEUKOCYTE_MIGRATION | 428 | 1.22 | 0.009 | 7094 |
| GO_ESTABLISHMENT_OF_ORGANELLE_LOCALIZATION | 397 | 1.22 | 0.009 | 6914 |
| GO_CANONICAL_WNT_SIGNALING_PATHWAY | 315 | 1.20 | 0.009 | 5210 |
| GO_REGULATION_OF_CELLULAR_AMIDE_METABOLIC_PROCESS | 385 | 1.19 | 0.008 | 6376 |
| GO_REGULATION_OF_AUTOPHAGY | 327 | 1.18 | 0.008 | 4699 |
| GO_REGULATION_OF_CHROMOSOME_ORGANIZATION | 321 | 1.17 | 0.014 | 6695 |
| GO_REGULATION_OF_SMALL_GTPASE_MEDIATED_SIGNAL_TRANSDUCTION | 312 | 1.16 | 0.024 | 7040 |
| GO_REPRODUCTIVE_SYSTEM_DEVELOPMENT | 428 | 1.16 | 0.026 | 3453 |
| GO_REGULATION_OF_SUPRAMOLECULAR_FIBER_ORGANIZATION | 339 | 1.15 | 0.028 | 6891 |
| GO_POSITIVE_REGULATION_OF_DEFENSE_RESPONSE | 360 | 1.14 | 0.048 | 5237 |
| GO_POSITIVE_REGULATION_OF_NERVOUS_SYSTEM_DEVELOPMENT | 513 | 1.14 | 0.047 | 4697 |
| GO_REGULATION_OF_APOPTOTIC_SIGNALING_PATHWAY | 383 | 1.13 | 0.047 | 5796 |
| GO_MYELOID_CELL_DIFFERENTIATION | 375 | 1.12 | 0.061 | 6268 |
| GO_RESPONSE_TO_VIRUS | 315 | 1.12 | 0.060 | 5563 |
| GO_ACTIN_FILAMENT_ORGANIZATION | 400 | 1.11 | 0.077 | 6891 |
| GO_RESPONSE_TO_MOLECULE_OF_BACTERIAL_ORIGIN | 326 | 1.10 | 0.097 | 6178 |
| GO_REGULATION_OF_PROTEIN_CONTAINING_COMPLEX_ASSEMBLY | 408 | 1.10 | 0.098 | 6574 |
| GO_OSSIFICATION | 378 | 1.10 | 0.106 | 6790 |
| GO_POSITIVE_REGULATION_OF_SECRETION | 358 | 1.09 | 0.109 | 6953 |
| GO_EPITHELIAL_TUBE_MORPHOGENESIS | 326 | 1.09 | 0.126 | 6477 |
| GO_ACTIVATION_OF_IMMUNE_RESPONSE | 433 | 1.09 | 0.138 | 7472 |
| GO_CELL_SUBSTRATE_ADHESION | 342 | 1.08 | 0.172 | 8285 |
| GO_REGULATION_OF_BINDING | 349 | 1.08 | 0.178 | 6143 |
| GO_REGULATION_OF_DEVELOPMENTAL_GROWTH | 324 | 1.08 | 0.178 | 4701 |
| GO_CELLULAR_RESPONSE_TO_CHEMICAL_STRESS | 329 | 1.07 | 0.229 | 4800 |
| Gene Name | Description | Fold Change | |
|---|---|---|---|
| Case 2 vs. Case 1 | Case 3 vs. Case 1 | ||
| CD83 | CD83 molecule | 29.9 | 29.9 |
| AP1S3 | adaptor-related protein complex 1 subunit sigma 3 | 26.5 | 18.0 |
| GSTT1 | glutathione S-transferase theta 1 | 21.6 | 10.7 |
| BCL2L13 | BCL2-like 13 | 12.9 | 13.1 |
| NEDD9 | neural precursor cell expressed, developmentally downregulated 9 | 12.1 | 13.6 |
| HLA-DMA | major histocompatibility complex, class II, DM alpha | 9.1 | 16.3 |
| GHRL | ghrelin and obestatin prepropeptide | 13.1 | 12.2 |
| FLCN | folliculin | 12.2 | 9.1 |
| TCF7 | transcription factor 7, T-cell-specific | 11.0 | 9.0 |
| ELOVL5 | ELOVL fatty-acid elongase 5 | 9.0 | 9.9 |
| APLN | apelin | 9.2 | 9.6 |
| MAFF | MAF bZIP transcription factor F | 9.5 | 8.8 |
| AURKAPS1 | aurora kinase A pseudogene 1 | 9.7 | 8.4 |
| MIS12 | MIS12 kinetochore complex component | 9.5 | 8.3 |
| CEMIP2 | cell migration inducing hyaluronidase 2 | 8.4 | 9.1 |
| GMCL1 | germ cell-less 1, spermatogenesis associated | 8.5 | 8.5 |
| Gene Name | Description | Fold Change | |
|---|---|---|---|
| Case 1 vs. Case 2 | Case 1 vs. Case 3 | ||
| MYH16 | myosin heavy chain 16 pseudogene | 70.1 | 68.9 |
| PRDM12 | PR/SET domain 12 | 69.8 | 68.5 |
| CXXC4 | CXXC finger protein 4 | 62.8 | 61.5 |
| VENTXP1 | VENT homeobox pseudogene 1 | 60.4 | 57.3 |
| MKRN3 | makorin ring finger protein 3 | 70.9 | 43.7 |
| CLEC3A | C-type lectin domain family 3 member A | 26.1 | 251.3 |
| TEX43 | testis expressed 43 | 51.3 | 26.7 |
| SCN11A | sodium channel, voltage-gated, type XI, alpha subunit 11 | 38.0 | 26.5 |
| CYP3A43 | cytochrome P450 family 3 subfamily A member 43 | 24.5 | 22.3 |
| MROH2A | maestro heat-like repeat family member 2A | 21.1 | 21.4 |
| MUC12 | mucin 12, cell-surface-associated | 30.5 | 15.3 |
| MS4A6A | membrane-spanning 4-domains subfamily A member 6A | 46.8 | 11.7 |
| RBFOX3 | RNA-binding fox-1 homolog 3 | 15.5 | 20.4 |
| SLC2A1 | solute carrier family 2 member 1 | 30.4 | 10.7 |
| CFAP299 | cilia- and flagella-associated protein 299 | 15.4 | 15.8 |
| PSG5 | pregnancy-specific beta-1-glycoprotein 5 | 16.3 | 14.6 |
| LTBP3 | latent transforming growth factor beta-binding protein 3 | 13.7 | 16.9 |
| ZFP57 | zinc finger protein 57 | 21.8 | 11.0 |
| MFSD4 | major facilitator superfamily domain-containing 4A | 13.8 | 13.8 |
| HOXA11 | homeobox A11 | 10.2 | 19.1 |
| ALLC | allantoicase | 24.8 | 8.8 |
| SLC6A14 | solute carrier family 6 member 14 | 13.1 | 12.1 |
| SLC44A4 | solute carrier family 44 member 4 | 12.7 | 11.7 |
| MAS1 | MAS1 proto-oncogene, G-protein-coupled receptor | 12.2 | 12.2 |
| CARD18 | caspase recruitment domain family member 18 | 12.9 | 11.5 |
| LCE1C | late cornified envelope protein 1C | 12.2 | 10.6 |
| PAMR1 | peptidase domain-containing associated with muscle regeneration 1 | 8.1 | 18.7 |
| PRSS55 | serine protease 55 | 11.4 | 10.5 |
| RUNDC3B | RUN domain-containing 3B | 10.0 | 11.8 |
| LINC00114 | long intergenic non-protein-coding RNA 114 | 8.9 | 13.8 |
| TFAP4 | transcription factor AP-4 | 11.2 | 10.1 |
| PLIN2 | perilipin 2 | 9.8 | 11.1 |
| CCR2 | C–C motif chemokine receptor 2 | 11.7 | 9.3 |
| CDKN2B-AS | CDKN2B antisense RNA 1 | 10.0 | 9.8 |
| MYO7A | myosin VIIA | 10.4 | 9.3 |
| PDILT | protein disulfide isomerase like, testis expressed | 9.6 | 9.6 |
| SPA17 | sperm autoantigenic protein 17 | 10.8 | 8.5 |
| SLITRK2 | SLIT and NTRK-like family member 2 | 9.5 | 9.5 |
| SLC9B1 | solute carrier family 9 member B1 | 9.3 | 9.7 |
| PANX2 | pannexin 2 | 11.4 | 8.0 |
| PLPPR1 | phospholipid phosphatase-related 1 | 10.1 | 8.8 |
| ASTE1 | asteroid homolog 1 | 9.2 | 9.4 |
| MUC16 | mucin 16, cell-surface-associated | 9.5 | 8.7 |
| OR51B2 | olfactory receptor family 51 subfamily B member 2 | 9.2 | 8.6 |
| ARHGAP36 | Rho GTPase-activating protein 36 | 8.8 | 8.7 |
| KRTAP4-8 | keratin-associated protein 4-8 | 8.8 | 8.5 |
| METTL21CP1 | methyltransferase-like 21E, pseudogene | 9.1 | 8.3 |
| BPIFB6 | BPI fold-containing family B member 6 | 8.9 | 8.4 |
| HABP2 | hyaluronan-binding protein 2 | 9.0 | 8.2 |
| DUSP13 | dual-specificity phosphatase 13 | 8.9 | 8.2 |
| CXorf51A | chromosome X open reading frame 51A | 8.2 | 8.0 |
| MTM1 | myotubularin 1 | 8.2 | 8.1 |
| Gene Set Name | Size | NES | FDR q-Value | Rank at Max |
|---|---|---|---|---|
| GO_MICROTUBULE_CYTOSKELETON_ORGANIZATION | 526 | 1.67 | 0.000 | 6797 |
| GO_MICROTUBULE_BASED_PROCESS | 757 | 1.59 | 0.000 | 6797 |
| GO_CELL_DIVISION | 549 | 1.58 | 0.000 | 6799 |
| GO_PROTEIN_POLYUBIQUITINATION | 327 | 1.56 | 0.000 | 7778 |
| GO_MITOTIC_CELL_CYCLE | 954 | 1.54 | 0.000 | 6055 |
| GO_MODIFICATION_DEPENDENT_MACROMOLECULE_CATABOLIC_PROCESS | 604 | 1.51 | 0.000 | 6933 |
| GO_NEGATIVE_REGULATION_OF_CELL_CYCLE | 566 | 1.51 | 0.000 | 6548 |
| GO_NEGATIVE_REGULATION_OF_CELL_CYCLE_PROCESS | 312 | 1.50 | 0.001 | 6055 |
| GO_MRNA_PROCESSING | 477 | 1.50 | 0.001 | 6995 |
| GO_RNA_SPLICING_VIA_TRANSESTERIFICATION_REACTIONS | 341 | 1.48 | 0.001 | 6758 |
| GO_ESTABLISHMENT_OF_ORGANELLE_LOCALIZATION | 397 | 1.47 | 0.001 | 6823 |
| GO_REGULATION_OF_MRNA_METABOLIC_PROCESS | 326 | 1.47 | 0.001 | 9158 |
| GO_ORGANELLE_LOCALIZATION | 602 | 1.46 | 0.001 | 6823 |
| GO_RNA_SPLICING | 423 | 1.45 | 0.002 | 6007 |
| GO_CELL_CYCLE | 1681 | 1.44 | 0.002 | 6059 |
| GO_ORGANELLE_FISSION | 414 | 1.44 | 0.002 | 5836 |
| GO_CELL_CYCLE_PROCESS | 1251 | 1.43 | 0.002 | 6470 |
| GO_REGULATION_OF_MITOTIC_CELL_CYCLE | 600 | 1.43 | 0.002 | 6548 |
| GO_MUSCLE_TISSUE_DEVELOPMENT | 368 | 1.42 | 0.003 | 4069 |
| GO_CELLULAR_PROTEIN_CATABOLIC_PROCESS | 733 | 1.41 | 0.005 | 6933 |
| GO_REGULATION_OF_CELL_CYCLE_PROCESS | 706 | 1.41 | 0.005 | 6450 |
| GO_CELL_CYCLE_PHASE_TRANSITION | 578 | 1.40 | 0.005 | 6055 |
| GO_REGULATION_OF_CELL_CYCLE | 1110 | 1.40 | 0.004 | 6548 |
| GO_MICROTUBULE_BASED_MOVEMENT | 321 | 1.37 | 0.007 | 5942 |
| GO_PROTEIN_MODIFICATION_BY_SMALL_PROTEIN_CONJUGATION_OR_REMOVAL | 1033 | 1.36 | 0.008 | 6585 |
| GO_PROTEIN_CATABOLIC_PROCESS | 876 | 1.36 | 0.008 | 7607 |
| GO_PROTEASOMAL_PROTEIN_CATABOLIC_PROCESS | 455 | 1.34 | 0.011 | 7536 |
| GO_POST_TRANSLATIONAL_PROTEIN_MODIFICATION | 352 | 1.33 | 0.013 | 4520 |
| GO_VESICLE_ORGANIZATION | 315 | 1.33 | 0.013 | 6530 |
| GO_PROTEIN_MODIFICATION_BY_SMALL_PROTEIN_CONJUGATION | 864 | 1.32 | 0.014 | 7634 |
| GO_PROTEIN_CONTAINING_COMPLEX_DISASSEMBLY | 310 | 1.32 | 0.014 | 6434 |
| GO_CHROMOSOME_ORGANIZATION | 1059 | 1.32 | 0.015 | 6004 |
| GO_RNA_PROCESSING | 1149 | 1.31 | 0.016 | 7021 |
| GO_REGULATION_OF_CHROMOSOME_ORGANIZATION | 321 | 1.29 | 0.024 | 7299 |
| GO_REGULATION_OF_CELL_CYCLE_PHASE_TRANSITION | 424 | 1.29 | 0.024 | 6055 |
| GO_MRNA_METABOLIC_PROCESS | 789 | 1.28 | 0.026 | 7021 |
| GO_REGULATION_OF_INTRACELLULAR_TRANSPORT | 325 | 1.28 | 0.026 | 6449 |
| GO_MUSCLE_SYSTEM_PROCESS | 423 | 1.28 | 0.028 | 3948 |
| GO_CELLULAR_MACROMOLECULE_CATABOLIC_PROCESS | 1100 | 1.26 | 0.034 | 7104 |
| GO_REGULATION_OF_AUTOPHAGY | 327 | 1.25 | 0.041 | 6901 |
| GO_CELLULAR_PROTEIN_CONTAINING_COMPLEX_ASSEMBLY | 909 | 1.25 | 0.041 | 6799 |
| GO_REGULATION_OF_WNT_SIGNALING_PATHWAY | 347 | 1.25 | 0.042 | 3438 |
| GO_RIBONUCLEOPROTEIN_COMPLEX_BIOGENESIS | 405 | 1.24 | 0.042 | 8496 |
| GO_PROCESS_UTILIZING_AUTOPHAGIC_MECHANISM | 495 | 1.23 | 0.049 | 6585 |
| GO_ANATOMICAL_STRUCTURE_HOMEOSTASIS | 426 | 1.23 | 0.048 | 6332 |
| GO_ORGANOPHOSPHATE_BIOSYNTHETIC_PROCESS | 526 | 1.23 | 0.049 | 3613 |
| GO_REGULATION_OF_CELLULAR_CATABOLIC_PROCESS | 812 | 1.23 | 0.051 | 6913 |
| GO_PROTEIN_CONTAINING_COMPLEX_SUBUNIT_ORGANIZATION | 1716 | 1.23 | 0.052 | 5624 |
| GO_REGULATION_OF_SYSTEM_PROCESS | 571 | 1.22 | 0.057 | 3069 |
| GO_GLYCEROPHOSPHOLIPID_METABOLIC_PROCESS | 325 | 1.22 | 0.055 | 2842 |
| GO_ORGANELLE_ASSEMBLY | 780 | 1.22 | 0.055 | 5055 |
| GO_MUSCLE_CONTRACTION | 339 | 1.20 | 0.070 | 3948 |
| GO_REGULATION_OF_CELLULAR_LOCALIZATION | 939 | 1.20 | 0.073 | 6537 |
| GO_CYTOSKELETON_ORGANIZATION | 1278 | 1.20 | 0.072 | 5064 |
| GO_REGULATION_OF_CATABOLIC_PROCESS | 960 | 1.20 | 0.075 | 7638 |
| GO_MACROMOLECULE_CATABOLIC_PROCESS | 1319 | 1.19 | 0.077 | 7614 |
| GO_ORGANONITROGEN_COMPOUND_CATABOLIC_PROCESS | 1233 | 1.19 | 0.080 | 6337 |
| GO_CANONICAL_WNT_SIGNALING_PATHWAY | 315 | 1.18 | 0.084 | 3438 |
| GO_DIVALENT_INORGANIC_CATION_TRANSPORT | 443 | 1.18 | 0.087 | 2865 |
| GO_MUSCLE_STRUCTURE_DEVELOPMENT | 606 | 1.18 | 0.094 | 4139 |
| GO_POSITIVE_REGULATION_OF_ESTABLISHMENT_OF_PROTEIN_LOCALIZATION | 371 | 1.18 | 0.092 | 5436 |
| GO_DNA_METABOLIC_PROCESS | 822 | 1.18 | 0.091 | 7381 |
| GO_CELL_CELL_SIGNALING_BY_WNT | 488 | 1.17 | 0.102 | 3490 |
| GO_INTRACELLULAR_TRANSPORT | 1599 | 1.16 | 0.108 | 6629 |
| GO_MUSCLE_ORGAN_DEVELOPMENT | 360 | 1.16 | 0.108 | 4772 |
| GO_REGULATION_OF_PEPTIDE_TRANSPORT | 641 | 1.16 | 0.109 | 5020 |
| GO_SECOND_MESSENGER_MEDIATED_SIGNALING | 412 | 1.15 | 0.125 | 3308 |
| GO_PEPTIDE_SECRETION | 495 | 1.15 | 0.125 | 3880 |
| GO_REGULATION_OF_CYTOSKELETON_ORGANIZATION | 513 | 1.15 | 0.128 | 3944 |
| GO_SIGNAL_RELEASE | 577 | 1.14 | 0.130 | 3898 |
| GO_DNA_REPAIR | 480 | 1.14 | 0.132 | 6578 |
| GO_MUSCLE_CELL_DIFFERENTIATION | 338 | 1.14 | 0.131 | 4061 |
| GO_NEGATIVE_REGULATION_OF_PROTEIN_MODIFICATION_PROCESS | 565 | 1.14 | 0.132 | 5343 |
| GO_NEGATIVE_REGULATION_OF_PHOSPHORYLATION | 424 | 1.14 | 0.138 | 5364 |
| GO_MITOCHONDRION_ORGANIZATION | 459 | 1.14 | 0.138 | 7936 |
| GO_NEGATIVE_REGULATION_OF_PHOSPHORUS_METABOLIC_PROCESS | 530 | 1.13 | 0.144 | 5394 |
| GO_HORMONE_TRANSPORT | 309 | 1.12 | 0.165 | 3880 |
| GO_REGULATION_OF_PROTEIN_CATABOLIC_PROCESS | 372 | 1.12 | 0.176 | 7675 |
| GO_REGULATION_OF_PROTEIN_LOCALIZATION | 905 | 1.11 | 0.184 | 6577 |
| GO_RIBOSE_PHOSPHATE_METABOLIC_PROCESS | 373 | 1.11 | 0.183 | 4526 |
| GO_OSSIFICATION | 378 | 1.11 | 0.180 | 5020 |
| GO_REGULATION_OF_DNA_METABOLIC_PROCESS | 314 | 1.11 | 0.192 | 7720 |
| GO_NUCLEOBASE_CONTAINING_SMALL_MOLECULE_METABOLIC_PROCESS | 545 | 1.11 | 0.196 | 3618 |
| GO_PHOSPHOLIPID_METABOLIC_PROCESS | 420 | 1.10 | 0.215 | 5395 |
| GO_REGULATION_OF_ORGANELLE_ORGANIZATION | 1209 | 1.10 | 0.220 | 5212 |
| GO_ORGANOPHOSPHATE_METABOLIC_PROCESS | 950 | 1.09 | 0.238 | 3618 |
| GO_REGULATION_OF_CELLULAR_RESPONSE_TO_STRESS | 690 | 1.09 | 0.235 | 6943 |
| GO_CELLULAR_RESPONSE_TO_DNA_DAMAGE_STIMULUS | 761 | 1.09 | 0.246 | 6578 |
| GO_GLYCEROLIPID_METABOLIC_PROCESS | 409 | 1.09 | 0.246 | 5591 |
| Gene Set Name | Size | NES | FDR q-Value | Rank at Max |
|---|---|---|---|---|
| GO_EXTRACELLULAR_STRUCTURE_ORGANIZATION | 376 | 1.67 | 0.002 | 5349 |
| GO_SKELETAL_SYSTEM_DEVELOPMENT | 494 | 1.55 | 0.012 | 5310 |
| GO_REGULATION_OF_VASCULATURE_DEVELOPMENT | 310 | 1.49 | 0.030 | 7236 |
| GO_EMBRYONIC_ORGAN_DEVELOPMENT | 443 | 1.49 | 0.023 | 6270 |
| GO_PATTERN_SPECIFICATION_PROCESS | 442 | 1.48 | 0.021 | 6393 |
| GO_INFLAMMATORY_RESPONSE | 706 | 1.45 | 0.029 | 7279 |
| GO_TAXIS | 612 | 1.45 | 0.027 | 7278 |
| GO_NEGATIVE_REGULATION_OF_CELL_DEVELOPMENT | 311 | 1.44 | 0.030 | 6296 |
| GO_BLOOD_VESSEL_MORPHOGENESIS | 564 | 1.43 | 0.030 | 7164 |
| GO_NEGATIVE_REGULATION_OF_CELL_DIFFERENTIATION | 668 | 1.42 | 0.032 | 6377 |
| GO_POSITIVE_REGULATION_OF_NERVOUS_SYSTEM_DEVELOPMENT | 513 | 1.42 | 0.036 | 6270 |
| GO_REGIONALIZATION | 347 | 1.40 | 0.043 | 6393 |
| GO_VASCULATURE_DEVELOPMENT | 676 | 1.39 | 0.050 | 6711 |
| GO_EMBRYONIC_MORPHOGENESIS | 578 | 1.39 | 0.050 | 5668 |
| GO_POSITIVE_REGULATION_OF_CELL_DEVELOPMENT | 528 | 1.38 | 0.052 | 5938 |
| GO_REGULATION_OF_NERVOUS_SYSTEM_DEVELOPMENT | 888 | 1.37 | 0.058 | 6409 |
| GO_BIOLOGICAL_ADHESION | 1379 | 1.37 | 0.062 | 7362 |
| GO_EPITHELIAL_TUBE_MORPHOGENESIS | 326 | 1.36 | 0.069 | 6392 |
| GO_TUBE_MORPHOGENESIS | 808 | 1.35 | 0.075 | 6726 |
| GO_REGULATION_OF_NEURON_DIFFERENTIATION | 631 | 1.35 | 0.073 | 4480 |
| GO_POSITIVE_REGULATION_OF_DEVELOPMENTAL_PROCESS | 1298 | 1.35 | 0.071 | 6726 |
| GO_REGULATION_OF_INFLAMMATORY_RESPONSE | 348 | 1.34 | 0.074 | 6671 |
| GO_POSITIVE_REGULATION_OF_CELL_DIFFERENTIATION | 939 | 1.34 | 0.072 | 6708 |
| GO_AMEBOIDAL_TYPE_CELL_MIGRATION | 386 | 1.34 | 0.070 | 3718 |
| GO_POSITIVE_REGULATION_OF_MULTICELLULAR_ORGANISMAL_PROCESS | 1662 | 1.34 | 0.067 | 6427 |
| GO_REGULATION_OF_CELL_ADHESION | 682 | 1.34 | 0.071 | 7361 |
| GO_CELL_MORPHOGENESIS_INVOLVED_IN_NEURON_DIFFERENTIATION | 585 | 1.33 | 0.075 | 6775 |
| GO_NEGATIVE_REGULATION_OF_DEVELOPMENTAL_PROCESS | 905 | 1.33 | 0.075 | 6377 |
| GO_AXON_DEVELOPMENT | 512 | 1.32 | 0.079 | 7161 |
| GO_TUBE_DEVELOPMENT | 998 | 1.32 | 0.080 | 6726 |
| GO_NEUROGENESIS | 1571 | 1.32 | 0.079 | 6708 |
| GO_REGULATION_OF_ANATOMICAL_STRUCTURE_MORPHOGENESIS | 1032 | 1.32 | 0.079 | 6334 |
| GO_REGULATION_OF_CELL_DIFFERENTIATION | 1729 | 1.31 | 0.086 | 6377 |
| GO_REGULATION_OF_T_CELL_ACTIVATION | 316 | 1.31 | 0.084 | 5912 |
| GO_POSITIVE_REGULATION_OF_CELL_ADHESION | 410 | 1.31 | 0.083 | 6893 |
| GO_REGULATION_OF_CELL_DEVELOPMENT | 904 | 1.31 | 0.086 | 6400 |
| GO_REGULATION_OF_CELL_MORPHOGENESIS | 474 | 1.30 | 0.102 | 6663 |
| GO_REGULATION_OF_CELL_CELL_ADHESION | 406 | 1.29 | 0.105 | 6811 |
| GO_ANATOMICAL_STRUCTURE_FORMATION_INVOLVED_IN_MORPHOGENESIS | 1044 | 1.29 | 0.106 | 7374 |
| GO_EPITHELIAL_CELL_PROLIFERATION | 379 | 1.28 | 0.119 | 6725 |
| GO_POSITIVE_REGULATION_OF_NEURON_DIFFERENTIATION | 356 | 1.28 | 0.120 | 6270 |
| GO_REGULATION_OF_PEPTIDASE_ACTIVITY | 419 | 1.28 | 0.118 | 6411 |
| GO_LEUKOCYTE_CELL_CELL_ADHESION | 339 | 1.28 | 0.116 | 6889 |
| GO_CELL_CELL_ADHESION | 826 | 1.28 | 0.119 | 7362 |
| GO_CELL_MORPHOGENESIS | 996 | 1.27 | 0.118 | 6775 |
| GO_MORPHOGENESIS_OF_AN_EPITHELIUM | 539 | 1.27 | 0.125 | 6433 |
| GO_CIRCULATORY_SYSTEM_DEVELOPMENT | 1018 | 1.27 | 0.127 | 6433 |
| GO_POSITIVE_REGULATION_OF_HYDROLASE_ACTIVITY | 719 | 1.26 | 0.132 | 6562 |
| GO_CELLULAR_PROCESS_INVOLVED_IN_REPRODUCTION_IN_MULTICELLULAR_ORGANISM | 330 | 1.26 | 0.131 | 6092 |
| GO_GLAND_DEVELOPMENT | 436 | 1.26 | 0.143 | 6386 |
| GO_NEGATIVE_REGULATION_OF_MULTICELLULAR_ORGANISMAL_PROCESS | 1145 | 1.25 | 0.147 | 6749 |
| GO_REGULATION_OF_CELLULAR_COMPONENT_SIZE | 360 | 1.25 | 0.152 | 3939 |
| GO_SENSORY_ORGAN_DEVELOPMENT | 560 | 1.25 | 0.155 | 5533 |
| GO_NEURON_DIFFERENTIATION | 1327 | 1.25 | 0.155 | 6400 |
| GO_REPRODUCTIVE_SYSTEM_DEVELOPMENT | 428 | 1.25 | 0.154 | 4925 |
| GO_CELL_PART_MORPHOGENESIS | 680 | 1.24 | 0.155 | 6775 |
| GO_NEURON_DEVELOPMENT | 1080 | 1.24 | 0.155 | 6705 |
| GO_T_CELL_ACTIVATION | 458 | 1.24 | 0.154 | 7224 |
| GO_POSITIVE_REGULATION_OF_CELL_PROJECTION_ORGANIZATION | 366 | 1.24 | 0.169 | 6270 |
| GO_ANIMAL_ORGAN_MORPHOGENESIS | 1048 | 1.24 | 0.168 | 6373 |
| GO_ORGANIC_ANION_TRANSPORT | 491 | 1.22 | 0.168 | 6889 |
| GO_CELL_MORPHOGENESIS_INVOLVED_IN_DIFFERENTIATION | 728 | 1.22 | 0.168 | 6775 |
| GO_ANION_TRANSMEMBRANE_TRANSPORT | 303 | 1.22 | 0.191 | 8857 |
| GO_ALCOHOL_METABOLIC_PROCESS | 362 | 1.22 | 0.192 | 7136 |
| GO_G_PROTEIN_COUPLED_RECEPTOR_SIGNALING_PATHWAY | 1235 | 1.22 | 0.195 | 9098 |
| GO_EMBRYO_DEVELOPMENT | 1018 | 1.22 | 0.194 | 6690 |
| GO_ANION_TRANSPORT | 628 | 1.21 | 0.204 | 6889 |
| GO_REGULATION_OF_NEURON_PROJECTION_DEVELOPMENT | 486 | 1.21 | 0.202 | 4480 |
| GO_REGULATION_OF_CELL_PROJECTION_ORGANIZATION | 652 | 1.21 | 0.203 | 6334 |
| GO_LIPID_CATABOLIC_PROCESS | 327 | 1.21 | 0.203 | 6013 |
| GO_UROGENITAL_SYSTEM_DEVELOPMENT | 325 | 1.20 | 0.233 | 6411 |
| GO_TISSUE_MORPHOGENESIS | 639 | 1.20 | 0.233 | 6433 |
| GO_REGULATION_OF_HEMOPOIESIS | 441 | 1.20 | 0.236 | 7164 |
| GO_REGULATION_OF_HYDROLASE_ACTIVITY | 1205 | 1.20 | 0.236 | 6564 |
| GO_REGULATION_OF_IMMUNE_SYSTEM_PROCESS | 1387 | 1.20 | 0.235 | 7164 |
| GO_LYMPHOCYTE_DIFFERENTIATION | 354 | 1.19 | 0.243 | 8193 |
| GO_EPITHELIUM_DEVELOPMENT | 1261 | 1.19 | 0.240 | 6313 |
| GO_HEAD_DEVELOPMENT | 765 | 1.19 | 0.238 | 7239 |
| GO_ENDOCYTOSIS | 541 | 1.19 | 0.238 | 5944 |
| GO_TRANSMEMBRANE_RECEPTOR_PROTEIN_TYROSINE_KINASE_SIGNALING_PATHWAY | 695 | 1.19 | 0.245 | 7173 |
| GO_REGULATION_OF_CELL_ACTIVATION | 538 | 1.19 | 0.247 | 7342 |
| Gene Name | Description | Fold Change IT vs. the Tunica Media | |
|---|---|---|---|
| Case 2 | Case 3 | ||
| POU4F1 | POU class 4 homeobox 1 | 22.1 | 16.4 |
| BMX | BMX non-receptor tyrosine kinase | 10.6 | 29.2 |
| FGF1 | fibroblast growth factor 1 | 15.9 | 9.0 |
| MPZL2 | myelin protein zero-like 2 | 18.8 | 10.2 |
| FMO3 | flavin-containing dimethylaniline monooxygenase 3 | 12.8 | 10.0 |
| PROCR | protein C receptor | 13.0 | 8.6 |
| DSP | desmoplakin | 9.3 | 11.7 |
| NR1I2 | nuclear receptor subfamily 1 group I member 2 | 9.7 | 10.7 |
| Gene Name | Description | Fold Change the Tunica Media vs. IT | |
|---|---|---|---|
| Case 2 | Case 3 | ||
| GAS7 | growth arrest-specific 7 | 52.4 | 9.8 |
| H19 | H19 imprinted maternally expressed transcript | 14.2 | 18.5 |
| BTNL9 | butyrophilin-like 9 | 8.4 | 17.9 |
| SELENOP | selenoprotein P | 14.8 | 13.4 |
| BDKRB2 | bradykinin receptor B2 | 11.3 | 11.6 |
| CHRDL1 | chordin-like 1 | 9.2 | 23.6 |
| MSC | musculin | 11.7 | 8.4 |
| DCN | decorin | 9.0 | 9.4 |
Publisher’s Note: MDPI stays neutral with regard to jurisdictional claims in published maps and institutional affiliations. |
© 2021 by the authors. Licensee MDPI, Basel, Switzerland. This article is an open access article distributed under the terms and conditions of the Creative Commons Attribution (CC BY) license (https://creativecommons.org/licenses/by/4.0/).
Share and Cite
Saito, J.; Kojima, T.; Tanifuji, S.; Kato, Y.; Oka, S.; Ichikawa, Y.; Miyagi, E.; Tachibana, T.; Asou, T.; Yokoyama, U. Transcriptome Analysis Reveals Differential Gene Expression between the Closing Ductus Arteriosus and the Patent Ductus Arteriosus in Humans. J. Cardiovasc. Dev. Dis. 2021, 8, 45. https://0-doi-org.brum.beds.ac.uk/10.3390/jcdd8040045
Saito J, Kojima T, Tanifuji S, Kato Y, Oka S, Ichikawa Y, Miyagi E, Tachibana T, Asou T, Yokoyama U. Transcriptome Analysis Reveals Differential Gene Expression between the Closing Ductus Arteriosus and the Patent Ductus Arteriosus in Humans. Journal of Cardiovascular Development and Disease. 2021; 8(4):45. https://0-doi-org.brum.beds.ac.uk/10.3390/jcdd8040045
Chicago/Turabian StyleSaito, Junichi, Tomoyuki Kojima, Shota Tanifuji, Yuko Kato, Sayuki Oka, Yasuhiro Ichikawa, Etsuko Miyagi, Tsuyoshi Tachibana, Toshihide Asou, and Utako Yokoyama. 2021. "Transcriptome Analysis Reveals Differential Gene Expression between the Closing Ductus Arteriosus and the Patent Ductus Arteriosus in Humans" Journal of Cardiovascular Development and Disease 8, no. 4: 45. https://0-doi-org.brum.beds.ac.uk/10.3390/jcdd8040045