Genome-Scale Metabolic Model of the Human Pathogen Candida albicans: A Promising Platform for Drug Target Prediction

 ,
,
Abstract
:1. Introduction
2. Materials and Methods
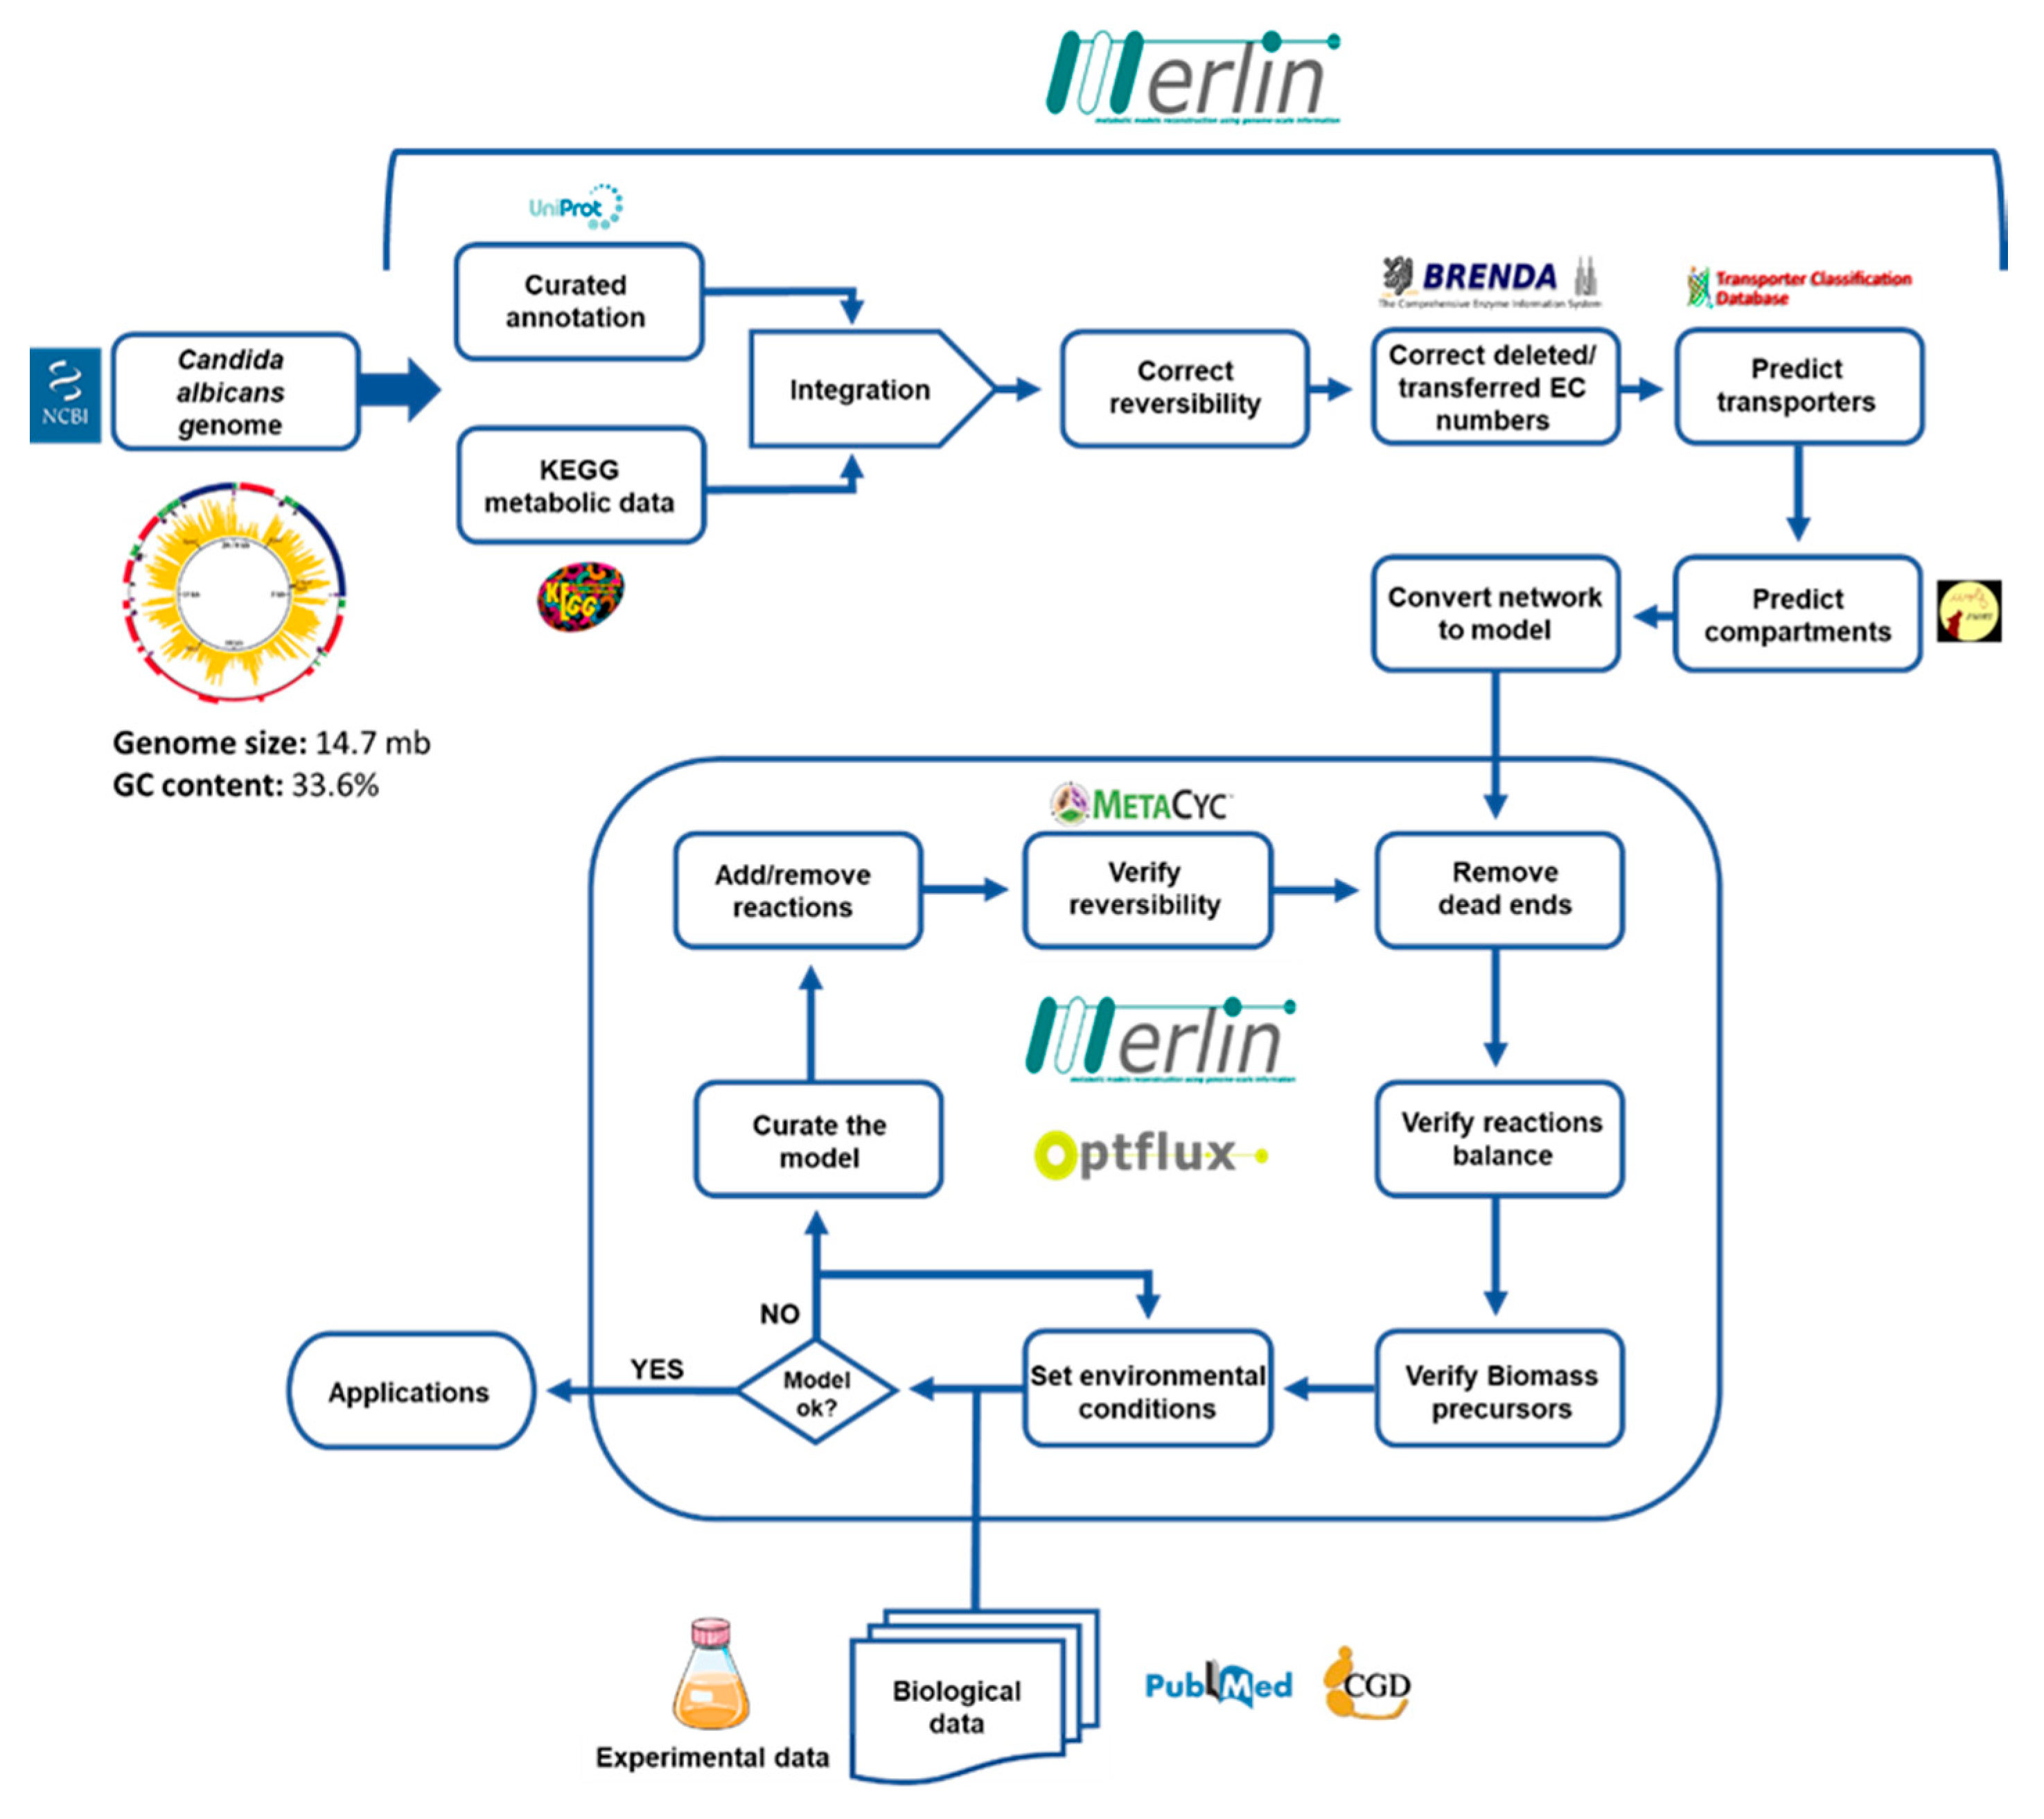
2.1. Model Development
2.2. Genome Annotation and Assembling the Metabolic Network
2.3. Reversibility and Balancing
2.4. Compartmentalization
2.5. Transport Reactions
2.6. Biomass Equation
2.7. Curation of the Model
2.8. Strains and Growth Media
2.9. Carbon and Nitrogen Source Utilization Assessment
2.10. Network Simulation and Analysis
3. Results and Discussion
3.1. Model Characteristics
- The enzyme 1.13.99.1, inositol oxygenase, responsible for the conversion of myo-inositol into D-glucuronate. This enzyme seems to be involved in resistance to toxic ergosterol analogs [44], is also present in other Candida species, including some important pathogens (C. parapsilosis, C. dubliniensis, C. auris), but absent in C. glabrata.
- The enzyme 1.1.1.289, sorbose reductase, responsible for the interconversion of L-sorbose into D-sorbitol. In fact, the presence this enzyme allows C. albicans to use L-sorbose as carbon source [45], unlike S. cerevisiae.
- The enzyme 1.14.19.17, sphingolipid 4-desaturase, responsible for the conversion of dihydroceramide into N-Acylsphingosine. This protein is involved in sphingolipid metabolism, with possible impact in azole resistance in C. albicans [46]. The presence of this enzyme may represent a specific resistance feature of some Candida species, being present in C. parapsilosis, C. dubliniensis, C. auris, but not in C. glabrata.
- The enzyme 1.1.99.2, L-2-hydroxyglutarate dehydrogenase, is a metabolite repair enzyme responsible for the conversion of (S)-2-hydroxyglutarate into 2-oxoglutarate. In other organisms such as plants [47] or humans [48], the inactivation of this enzyme leads to the accumulation of the toxic (S)-2-hydroxyglutarate.
- The enzyme 2.7.1.59, N-acetylglucosamine kinase, responsible for the conversion of N-acetyl-D-glucosamine into N-acetyl-D-glucosamine 6-phosphate. Many yeast species, including S. cerevisiae have lost their ability to utilize N-acetyl-D-glucosamine as carbon source, however, genetically altered yeasts are able to use it, based on expression of C. albicans genes [49]. In fact, this enzyme allows C. albicans to utilize this carbon source, a feature that is particularly important for its survival inside the phagosomes [50].
- The enzyme 3.5.1.25, N-acetylglucosamine-6-phosphate deacetylase, responsible for the conversion of N-acetyl-D-glucosamine 6-phosphate into D-glucosamine 6-phosphate. Like 2.7.1.59, this enzyme is also involved in N-acetyl-D-glucosamine metabolism.
- The enzyme 1.4.3.3, D-amino-acid oxidase, responsible for the conversion of a D-amino acid into a 2-oxo carboxylate and ammonia, is the first enzyme involved in the catabolism of D-amino acids and may allow the utilization D-amino acids as a source of carbon or nitrogen in some yeasts [51]. It may be an interesting feature to be explored in C. albicans.
3.1.1. Gap Filling and Model Curation
3.1.2. Biomass Equation
3.2. Validation of the iRV781 Model
3.2.1. Carbon and Nitrogen Source Utilization
3.2.2. Growth Parameters in Batch Culture
3.3. Gene Essentiality Assessment: A Tool for Drug Target Discovery?
4. Conclusions
Supplementary Materials
Author Contributions
Funding
Acknowledgments
Conflicts of Interest
References
- Wisplinghoff, H.; Bischoff, T.; Tallent, S.M.; Seifert, H.; Wenzel, R.; Edmond, M.B. Nosocomial bloodstream infections in US hospitals: Analysis of 24,179 cases from a prospective nationwide surveillance study. Clin. Infect. Dis. 2004, 39, 309–317. [Google Scholar] [CrossRef] [Green Version]
- Perlroth, J.; Choi, B.; Spellberg, B. Nosocomial fungal infections: Epidemiology, diagnosis, and treatment. Med. Mycol. 2007, 45, 321–346. [Google Scholar] [CrossRef]
- Yapar, N. Epidemiology and risk factors for invasive candidiasis. Ther. Clin. Risk Manag. 2014, 10, 95–105. [Google Scholar] [CrossRef] [Green Version]
- Horn, D.L.; Neofytos, D.; Anaissie, E.J.; Fishman, J.A.; Steinbach, W.J.; Olyaei, A.J.; Marr, K.A.; Pfaller, M.A.; Chang, C.-H.; Webster, K.M. Epidemiology and outcomes of candidemia in 2019 patients: Data from the prospective antifungal therapy alliance registry. Clin. Infect. Dis. 2009, 48, 1695–1703. [Google Scholar] [CrossRef]
- Galocha, M.; Pais, P.; Cavalheiro, M.; Pereira, D.; Viana, R.; Teixeira, M. Divergent approaches to virulence in C. albicans and C. glabrata: Two sides of the same coin. Int. J. Mol. Sci. 2019, 20, 2345. [Google Scholar] [CrossRef] [Green Version]
- Cavalheiro, M.; Teixeira, M. Candida biofilms: Threats, challenges, and promising strategies. Front. Med. 2018, 5. [Google Scholar] [CrossRef] [Green Version]
- Hampe, I.A.I.; Friedman, J.; Edgerton, M.; Morschhäuser, J. An acquired mechanism of antifungal drug resistance simultaneously enables Candida albicans to escape from intrinsic host defenses. PLoS Pathog. 2017, 13, e1006655. [Google Scholar] [CrossRef] [Green Version]
- Pfaller, M.A.; Rhomberg, P.; Messer, S.; Jones, R.; Castanheira, M. Isavuconazole, micafungin, and 8 comparator antifungal agents’ susceptibility profiles for common and uncommon opportunistic fungi collected in 2013: Temporal analysis of antifungal drug resistance using CLSI species-specific clinical breakpoints and proposed epidemiological cutoff values. Diagn. Microbiol. Infect. Dis. 2015, 82, 303–313. [Google Scholar] [CrossRef]
- Cleveland, A.A.; Farley, M.M.; Harrison, L.H.; Stein, B.; Hollick, R.; Lockhart, S.R.; Magill, S.S.; Derado, G.; Park, B.J.; Chiller, T.M. Changes in incidence and antifungal drug resistance in candidemia: Results from population-based laboratory surveillance in atlanta and baltimore, 2008–2011. Clin. Infect. Dis. 2012, 55, 1352–1361. [Google Scholar] [CrossRef]
- Arendrup, M.C.; Patterson, T.F. Multidrug-resistant Candida: Epidemiology, molecular mechanisms, and treatment. J. Infect. Dis. 2017, 216, S445–S451. [Google Scholar] [CrossRef] [Green Version]
- Pham, C.D.; Iqbal, N.; Bolden, C.B.; Kuykendall, R.J.; Harrison, L.H.; Farley, M.M.; Schaffner, W.; Beldavs, Z.G.; Chiller, T.M.; Park, B.J.; et al. Role of FKS mutations in Candida glabrata: MIC values, echinocandin resistance, and multidrug resistance. Antimicrob. Agents Chemother. 2014, 58, 4690–4696. [Google Scholar] [CrossRef] [Green Version]
- Pfaller, M.; Messer, S.A.; Woosley, L.N.; Jones, R.N.; Castanheira, M. Echinocandin and triazole antifungal susceptibility profiles for clinical opportunistic yeast and mold isolates collected from 2010 to 2011: Application of new CLSI clinical breakpoints and epidemiological cutoff values for characterization of geographic and temporal trends of antifungal resistance. J. Clin. Microbiol. 2013, 51, 2571–2581. [Google Scholar] [CrossRef] [Green Version]
- Lockhart, S.R.; Etienne, K.A.; Vallabhaneni, S.; Farooqi, J.; Chowdhary, A.; Govender, N.P.; Colombo, A.L.; Calvo, B.; Cuomo, C.A.; Desjardins, C.A.; et al. Simultaneous emergence of multidrug-resistant Candida auris on 3 continents confirmed by whole-genome sequencing and epidemiological analyses. Clin. Infect. Dis. 2016, 64, 134–140. [Google Scholar] [CrossRef] [Green Version]
- Dias, O.; Pereira, R.; Gombert, A.K.; Ferreira, E.C.; Rocha, I. iOD907, the first genome-scale metabolic model for the milk yeast Kluyveromyces lactis. Biotechnol. J. 2014, 9, 776–790. [Google Scholar] [CrossRef] [Green Version]
- Kim, T.Y.; Kim, H.U.; Lee, S.Y. Metabolite-centric approaches for the discovery of antibacterials using genome-scale metabolic networks. Metab. Eng. 2010, 12, 105–111. [Google Scholar] [CrossRef]
- Raškevičius, V.; Mikalayeva, V.; Antanavičiūtė, I.; Ceslevičienė, I.; Skeberdis, V.A.; Kairys, V.; Bordel, S. Genome scale metabolic models as tools for drug design and personalized medicine. PLoS ONE 2018, 13, e0190636. [Google Scholar] [CrossRef] [Green Version]
- Robinson, J.; Nielsen, J. Anticancer drug discovery through genome-scale metabolic modeling. Curr. Opin. Syst. Biol. 2017, 4, 1–8. [Google Scholar] [CrossRef]
- Mienda, B.S.; Salihu, R.; Adamu, A.; Idris, S. Genome-scale metabolic models as platforms for identification of novel genes as antimicrobial drug targets. Futur. Microbiol. 2018, 13, 455–467. [Google Scholar] [CrossRef]
- Dias, O.; Saraiva, J.; Faria, C.; Ramirez, M.; Pinto, F.R.; Rocha, I. iDS372, a phenotypically reconciled model for the metabolism of streptococcus pneumoniae strain R6. Front. Microbiol. 2019, 10, 10. [Google Scholar] [CrossRef]
- Abdel-Haleem, A.M.; Hefzi, H.; Mineta, K.; Gao, X.; Gojobori, T.; Palsson, B.O.; Lewis, N.E.; Jamshidi, N. Functional interrogation of Plasmodium genus metabolism identifies species and stage-specific differences in nutrient essentiality and drug targeting. PLoS Comput. Biol. 2018, 14, e1005895. [Google Scholar] [CrossRef]
- Rocha, I.; Maia, P.; Evangelista, P.; Vilaça, P.; Soares, S.; Pinto, J.P.B.G.P.; Nielsen, J.; Patil, K.R.; Ferreira, E.C.; Rocha, M. OptFlux: An open-source software platform for in silico metabolic engineering. BMC Syst. Biol. 2010, 4, 45. [Google Scholar] [CrossRef] [Green Version]
- Heirendt, L.; Arreckx, S.; Pfau, T.; Mendoza, S.N.; Richelle, A.; Heinken, A.; Haraldsdóttir, H.S.; Wachowiak, J.; Keating, S.M.; Vlasov, V.; et al. Creation and analysis of biochemical constraint-based models using the COBRA Toolbox v.3. Nat. Protoc. 2019, 14, 639–702. [Google Scholar] [CrossRef] [Green Version]
- Dias, O.; Rocha, M.; Ferreira, E.C.; Rocha, I. Reconstructing genome-scale metabolic models with merlin. Nucleic Acids Res. 2015, 43, 3899–3910. [Google Scholar] [CrossRef]
- Dias, O.; Rocha, M.; Ferreira, E.C.; Rocha, I. Reconstructing high-quality large-scale metabolic models with merlin. Adv. Struct. Saf. Stud. 2017, 1716, 1–36. [Google Scholar] [CrossRef]
- Kitts, P.A.; Church, D.M.; Thibaud-Nissen, F.; Choi, J.; Hem, V.; Sapojnikov, V.; Smith, R.G.; Tatusova, T.; Xiang, C.; Zherikov, A.; et al. Assembly: A resource for assembled genomes at NCBI. Nucleic Acids Res. 2015, 44, D73–D80. [Google Scholar] [CrossRef]
- Federhen, S. The NCBI taxonomy database. Nucleic Acids Res. 2011, 40, D136–D143. [Google Scholar] [CrossRef] [Green Version]
- Kumar, S.; Stecher, G.; Li, M.; Knyaz, C.; Tamura, K. MEGA X: Molecular evolutionary genetics analysis across computing platforms. Mol. Biol. Evol. 2018, 35, 1547–1549. [Google Scholar] [CrossRef]
- Tamura, K.; Nei, M. Estimation of the number of nucleotide substitutions in the control region of mitochondrial DNA in humans and chimpanzees. Mol. Biol. Evol. 1993, 10. [Google Scholar] [CrossRef]
- Altschul, S.F.; Gish, W.; Miller, W.; Myers, E.W.; Lipman, D.J. Basic local alignment search tool. J. Mol. Biol. 1990, 215, 403–410. [Google Scholar] [CrossRef]
- Boutet, E.; Lieberherr, D.; Tognolli, M.; Schneider, M.; Bansal, P.; Bridge, A.; Poux, S.; Bougueleret, L.; Xenarios, I. UniProtKB/Swiss-prot, the manually annotated section of the UniProt knowledgebase: How to use the entry view. Adv. Struct. Saf. Stud. 2016, 1374, 23–54. [Google Scholar] [CrossRef]
- Finn, R.D.; Clements, J.; Eddy, S.R. HMMER web server: Interactive sequence similarity searching. Nucleic Acids Res. 2011, 39 (Suppl. S2), W29–W37. [Google Scholar] [CrossRef] [PubMed] [Green Version]
- Placzek, S.; Schomburg, I.; Chang, A.; Jeske, L.; Ulbrich, M.; Tillack, J.; Schomburg, D. BRENDA in 2017: New perspectives and new tools in BRENDA. Nucleic Acids Res. 2016, 45, D380–D388. [Google Scholar] [CrossRef] [PubMed]
- Stelzer, M.; Sun, J.; Kamphans, T.; Fekete, S.P.; Zeng, A.-P. An extended bioreaction database that significantly improves reconstruction and analysis of genome-scale metabolic networks. Integr. Biol. 2011, 3, 1071–1086. [Google Scholar] [CrossRef] [PubMed]
- Schomburg, D. BRENDA, enzyme data and metabolic information. Nucleic Acids Res. 2002, 30, 47–49. [Google Scholar] [CrossRef] [PubMed]
- Caspi, R.; Altman, T.; Billington, R.; Dreher, K.; Foerster, H.; Fulcher, C.A.; Holland, T.A.; Keseler, I.M.; Kothari, A.; Kubo, A.; et al. The MetaCyc database of metabolic pathways and enzymes and the BioCyc collection of Pathway/Genome Databases. Nucleic Acids Res. 2013, 42, D471–D480. [Google Scholar] [CrossRef] [Green Version]
- Ogata, H.; Goto, S.; Sato, K.; Fujibuchi, W.; Bono, H.; Kanehisa, M. KEGG: Kyoto encyclopedia of genes and genomes. Nucleic Acids Res. 1999, 27, 29–34. [Google Scholar] [CrossRef] [Green Version]
- Horton, P.; Park, K.-J.; Obayashi, T.; Fujita, N.; Harada, H.; Adams-Collier, C.; Nakai, K. WoLF PSORT: Protein localization predictor. Nucleic Acids Res. 2007, 35, W585–W587. [Google Scholar] [CrossRef] [Green Version]
- Santos, S.; Rocha, I. Estimation of biomass composition from genomic and transcriptomic information. J. Integr. Bioinform. 2016, 13, 1–14. [Google Scholar] [CrossRef]
- Verduyn, C. Physiology of yeasts in relation to biomass yields. Antonie van Leeuwenhoek 1991, 60, 325–353. [Google Scholar] [CrossRef]
- Mishra, P.; Park, G.; Lakshmanan, M.; Lee, H.; Lee, H.; Chang, M.W.; Ching, C.B.; Ahn, J.O.; Lee, N.-Y. Genome-scale metabolic modeling and in silico analysis of lipid accumulating yeastCandida tropicalisfor dicarboxylic acid production. Biotechnol. Bioeng. 2016, 113, 1993–2004. [Google Scholar] [CrossRef]
- Xu, N.; Liu, L.; Zou, W.; Liu, J.; Hua, Q.; Chen, J. Reconstruction and analysis of the genome-scale metabolic network of Candida glabrata. Mol. BioSyst. 2013, 9, 205–216. [Google Scholar] [CrossRef] [PubMed]
- Mo, M.L.; Palsson, B.O.; Herrgård, M.J. Connecting extracellular metabolomic measurements to intracellular flux states in yeast. BMC Syst. Biol. 2009, 3, 37. [Google Scholar] [CrossRef] [PubMed] [Green Version]
- Oliveros, J.C. VENNY. An interactive tool for comparing lists with Venn Diagrams. Int. J. Proteom. 2014. Available online: http://bioinfogp.cnb.csic.es/tools/venny/index.html (accessed on 11 September 2007).
- Xu, D.; Jiang, B.; Ketela, T.; Lemieux, S.; Veillette, K.; Martel, N.; Davison, J.; Sillaots, S.; Trosok, S.; Bachewich, C.; et al. Genome-wide fitness test and mechanism-of-action studies of inhibitory compounds in Candida albicans. PLoS Pathog. 2007, 3, e92. [Google Scholar] [CrossRef] [Green Version]
- Greenberg, J.R.; Price, N.P.; Oliver, R.P.; Sherman, F.; Rustchenko, E. Candida albicans SOU1 encodes a sorbose reductase required forL-sorbose utilization. Yeast 2005, 22, 957–969. [Google Scholar] [CrossRef] [PubMed]
- Gao, J.; Wang, H.; Li, Z.; Wong, A.H.-H.; Wang, Y.-Z.; Guo, Y.; Lin, X.; Zeng, G.; Liu, H.; Wang, Y.; et al. Candida albicans gains azole resistance by altering sphingolipid composition. Nat. Commun. 2018, 9, 4495. [Google Scholar] [CrossRef] [Green Version]
- Hüdig, M.; Maier, A.; Scherrers, I.; Seidel, L.; Jansen, E.E.; Mettler-Altmann, T.; Engqvist, M.K.M.; Maurino, V.G. Plants possess a cyclic mitochondrial metabolic pathway similar to the mammalian metabolic repair mechanism involving malate dehydrogenase and l-2-hydroxyglutarate dehydrogenase. Plant Cell Physiol. 2015, 56, 1820–1830. [Google Scholar] [CrossRef] [Green Version]
- Rzem, R.; Veiga-Da-Cunha, M.; Noël, G.; Goffette, S.; Nassogne, M.-C.; Tabarki, B.; Schöller, C.; Marquardt, T.; Vikkula, M.; Van Schaftingen, E. A gene encoding a putative FAD-dependent L-2-hydroxyglutarate dehydrogenase is mutated in L-2-hydroxyglutaric aciduria. Proc. Natl. Acad. Sci. USA 2004, 101, 16849–16854. [Google Scholar] [CrossRef] [Green Version]
- Wendland, J.; Schaub, Y.; Walther, A. N-acetylglucosamine utilization by saccharomyces cerevisiae based on expression of Candida albicans NAG genes. Appl. Environ. Microbiol. 2009, 75, 5840–5845. [Google Scholar] [CrossRef] [Green Version]
- Vesely, E.M.; Williams, R.B.; Konopka, J.B.; Lorenz, M.C. N-acetylglucosamine metabolism promotes survival of Candida albicans in the phagosome. mSphere 2017, 2, e00357-17. [Google Scholar] [CrossRef] [Green Version]
- Molla, G.; Motteran, L.; Piubelli, L.; Pilone, M.S.; Pollegioni, L. Regulation ofD-amino acid oxidase expression in the yeastRhodotorula gracilis. Yeast 2003, 20, 1061–1069. [Google Scholar] [CrossRef] [PubMed] [Green Version]
- Thiele, I.; Palsson, B.O. A protocol for generating a high-quality genome-scale metabolic reconstruction. Nat. Protoc. 2010, 5, 93–121. [Google Scholar] [CrossRef] [PubMed] [Green Version]
- Santos, S.T. Development of Computational Methods for the Determination of Biomass Composition and Evaluation of Its Impact in Genome-Scale Models Predictions. Master’s Thesis, Universidade do Minho, Braga, Portugal, 2013. [Google Scholar]
- Brondz, I.; Olsen, I. Multivariate analyses of cellular carbohydrates and fatty acids of Candida albicans, torulopsis glabrata, and saccharomyces cerevisiae. J. Clin. Microbiol. 1990, 28, 1854–1857. [Google Scholar] [CrossRef] [Green Version]
- Ghannoum, M.; Swairjo, I.; Soll, D. Variation in lipid and sterol contents inCandida albicanswhite and opaque phenotypes. Med. Mycol. 1990, 28, 103–115. [Google Scholar] [CrossRef]
- Abu-Elteen, K.H.; Whittaker, P.A. Effect of sub-inhibitory concentration of chlorhexidine on lipid and sterol composition of shape Candida albicans. Mycopathol 1997, 140, 69–76. [Google Scholar] [CrossRef] [PubMed]
- Mayatepek, E.; Herz, A.; Leichsenring, M.; Kappe, R. Fatty acid analysis of different Candida, species by capillary column gas-liquid chromatography. Mycoses 2009, 34, 53–57. [Google Scholar] [CrossRef]
- Xavier, J.C.; Patil, K.R.; Rocha, I. Integration of biomass formulations of genome-scale metabolic models with experimental data reveals universally essential cofactors in prokaryotes. Metab. Eng. 2017, 39, 200–208. [Google Scholar] [CrossRef] [PubMed] [Green Version]
- Verduyn, C.; Postma, E.; Scheffers, W.A.; Van Dijken, J.P. Physiology of saccharomyces cerevisiae in anaerobic glucose-limited chemostat culturesx. J. Gen. Microbiol. 1990, 136, 395–403. [Google Scholar] [CrossRef] [Green Version]
- CBS-KNAW Collections. Available online: http://www.cbs.knaw.nl/Collections (accessed on 24 July 2020).
- Brown, V.; Sexton, J.A.; Johnston, M. A Glucose Sensor in Candida albicans. Eukaryot. Cell 2006, 5, 1726–1737. [Google Scholar] [CrossRef] [Green Version]
- Huang, X.; Chen, X.; He, Y.; Yu, X.; Li, S.; Gao, N.; Niu, L.; Mao, Y.; Wang, Y.; Wu, X.; et al. Mitochondrial complex I bridges a connection between regulation of carbon flexibility and gastrointestinal commensalism in the human fungal pathogen Candida albicans. PLoS Pathog. 2017, 13, e1006414. [Google Scholar] [CrossRef]
- Guan, G.; Wang, H.; Liang, W.; Cao, C.; Tao, L.; Naseem, S.; Konopka, J.; Wang, Y.; Huang, G. The mitochondrial protein Mcu1 plays important roles in carbon source utilization, filamentation, and virulence in Candida albicans. Fungal Genet. Biol. 2015, 81, 150–159. [Google Scholar] [CrossRef] [PubMed]
- Choudary, P.V.; Rao, G.R. Molecular analysis of inorganic nitrogen assimilation in yeasts. Arch. Microbiol. 1984, 138, 183–186. [Google Scholar] [CrossRef]
- Rozpędowska, E.; Galafassi, S.; Johansson, L.; Hagman, A.; Piškur, J.; Compagno, C. Candida albicans a pre-whole genome duplication yeast—Is predominantly aerobic and a poor ethanol producer. FEMS Yeast Res. 2011, 11, 285–291. [Google Scholar] [CrossRef] [PubMed] [Green Version]
- Askew, C.; Sellam, A.; Epp, E.; Hogues, H.; Mullick, A.; Nantel, A.; Whiteway, M. Transcriptional regulation of carbohydrate metabolism in the human pathogen Candida albicans. PLoS Pathog. 2009, 5, e1000612. [Google Scholar] [CrossRef] [Green Version]
- Dumitru, R.; Hornby, J.M.; Nickerson, K.W. Defined anaerobic growth medium for studying Candida albicans basic biology and resistance to eight antifungal drugs. Antimicrob. Agents Chemother. 2004, 48, 2350–2354. [Google Scholar] [CrossRef] [Green Version]
- Jouhten, P.; Rintala, E.; Huuskonen, A.; Tamminen, A.; Toivari, M.; Wiebe, M.G.; Ruohonen, L.; Penttilä, M.; Maaheimo, H. Oxygen dependence of metabolic fluxes and energy generation of Saccharomyces cerevisiae CEN.PK113-1A. BMC Syst. Biol. 2008, 2, 60. [Google Scholar] [CrossRef] [Green Version]
- O’Meara, T.; Veri, A.O.; Ketela, T.; Jiang, B.; Roemer, T.; Cowen, L.E. Global analysis of fungal morphology exposes mechanisms of host cell escape. Nat. Commun. 2015, 6, 6741. [Google Scholar] [CrossRef]
- Wishart, D.S. DrugBank: A comprehensive resource for in silico drug discovery and exploration. Nucleic Acids Res. 2006, 34, D668–D672. [Google Scholar] [CrossRef]
- Robbins, N.; Wright, G.D.; Cowen, L.E. Antifungal drugs: The current armamentarium and development of new agents. Fungal Kingd. 2017, 4, 903–922. [Google Scholar] [CrossRef]
- Lupetti, A. Molecular basis of resistance to azole antifungals. Trends Mol. Med. 2002, 8, 76–81. [Google Scholar] [CrossRef]
- Rodrigues, M.L. The multifunctional fungal ergosterol. mBio 2018, 9, e01755-18. [Google Scholar] [CrossRef] [PubMed] [Green Version]
- Nixon, G.L.; Moss, D.M.; Shone, A.E.; Lalloo, D.G.; Fisher, N.; O’Neill, P.M.; Ward, S.; Biagini, G.A. Antimalarial pharmacology and therapeutics of atovaquone. J. Antimicrob. Chemother. 2013, 68, 977–985. [Google Scholar] [CrossRef] [PubMed] [Green Version]
- Iliades, P.; Berglez, J.; Meshnick, S.; Macreadie, I. Promoter strength of folic acid synthesis genes affects sulfa drug resistance in saccharomyces cerevisiae. Microb. Drug Resist. 2003, 9, 249–255. [Google Scholar] [CrossRef] [PubMed]
- Eldesouky, H.E.; Mayhoub, A.; Hazbun, T.R.; Seleem, M.N. Reversal of azole resistance in Candida albicansby sulfa antibacterial drugs. Antimicrob. Agents Chemother. 2017, 62, e00701-17. [Google Scholar] [CrossRef] [Green Version]
- Garcia-Effron, G.; Lee, S.; Park, S.; Cleary, J.D.; Perlin, D.S. Effect of Candida glabrata FKS1 and FKS2 mutations on echinocandin sensitivity and kinetics of 1,3-β-d-glucan synthase: Implication for the existing susceptibility breakpoint. Antimicrob. Agents Chemother. 2009, 53, 3690–3699. [Google Scholar] [CrossRef] [Green Version]
- Walker, L.A.; Gow, N.A.R.; Munro, C.A. Fungal echinocandin resistance. Fungal Genet. Biol. 2010, 47, 117–126. [Google Scholar] [CrossRef] [Green Version]
- Lopes, H.; Rocha, I. Genome-scale modeling of yeast: Chronology, applications and critical perspectives. FEMS Yeast Res. 2017, 17, 50. [Google Scholar] [CrossRef]
- Chavali, A.K.; D’Auria, K.M.; Hewlett, E.L.; Pearson, R.D.; Papin, J.A. A metabolic network approach for the identification and prioritization of antimicrobial drug targets. Trends Microbiol. 2012, 20, 113–123. [Google Scholar] [CrossRef] [Green Version]
- Jouhten, P.; Ponomarova, O.; Gonzalez, R.; Patil, K.R. Saccharomyces cerevisiae metabolism in ecological context. FEMS Yeast Res. 2016, 16, 80. [Google Scholar] [CrossRef] [Green Version]
- Gu, C.; Kim, G.B.; Kim, W.J.; Kim, H.U.; Lee, S.Y. Current status and applications of genome-scale metabolic models. Genome Biol. 2019, 20, 121. [Google Scholar] [CrossRef] [Green Version]


| C. albicans | C. glabrata | S. cerevisiae | |
|---|---|---|---|
| iRV781 | iNX804 | iMM904 | |
| Amino acid metabolism | 218 | 223 | 217 |
| NAD biosynthesis | 20 | 20 | 24 |
| Cofactors and vitamins | 122 | 120 | 127 |
| Nucleotide metabolism | 120 | 138 | 135 |
| Alternate carbon metabolism | 27 | 31 | 27 |
| Glycolysis/gluconeogenesis | 26 | 18 | 22 |
| Citrate cycle | 24 | 20 | 13 |
| Pentose phosphate pathway | 18 | 16 | 13 |
| Pyruvate metabolism | 31 | 28 | 18 |
| Oxidative phosphorylation | 10 | 13 | 19 |
| Sterol metabolism | 29 | 30 | 49 |
| Fatty acid metabolism | 87 | 81 | 108 |
| Glycerolipid metabolism | 13 | 9 | 12 |
| Phospholipid metabolism | 34 | 44 | 52 |
| Metabolite | g/gDCW | Metabolite | g/gDCW |
|---|---|---|---|
| Protein components | Lipids | ||
| L-Valine | 0.02001 | Lanosterol | 0.00166 |
| L-Tyrosine | 0.02153 | Squalene | 0.00088 |
| L-Tryptophan | 0.00671 | Ergosterol | 0.00247 |
| L-Threonine | 0.02311 | Phosphatidylserine | 0.00299 |
| L-Serine | 0.02908 | Phosphatidylinositol | 0.00417 |
| L-Proline | 0.01616 | Phosphatidylcholine | 0.00681 |
| L-Phenylalanine | 0.02407 | Phosphatidylethanolamine | 0.00542 |
| L-Methionine | 0.00869 | Cardiolipin | 0.00201 |
| L-Lysine | 0.03535 | Phosphatidic acid | 0.00271 |
| L-Leucine | 0.03874 | Phosphatidylglycerol | 0.00174 |
| L-Isoleucine | 0.02992 | Tetradecanoic acid | 0.00003 |
| L-Histidine | 0.01067 | Hexadecanoic acid | 0.00073 |
| L-Glutamate | 0.03084 | Palmitoleic acid | 0.00022 |
| L-Cysteine | 0.00410 | Octadecanoic acid | 0.00035 |
| L-Aspartate | 0.02508 | Oleic acid | 0.00163 |
| L-Asparagine | 0.02841 | Linoleate | 0.00054 |
| L-Arginine | 0.02203 | Linolenate | 0.00008 |
| L-Alanine | 0.01334 | Triacylglycerol | 0.00573 |
| Glycine | 0.01077 | Monoacylglycerol | 0.00620 |
| L-Glutamine | 0.02158 | Diacylglycerol | 0.00087 |
| Sterol esters | 0.01177 | ||
| Carbohydrates | |||
| Chitin | 0.01368 | Soluble Pool | |
| Mannan | 0.14669 | Thiamine | 0.00290 |
| β (1.3)-Glucan | 0.23962 | Ubiquinone-6 | 0.00290 |
| NADP+ | 0.00290 | ||
| Deoxyribonucleotides | NAD+ | 0.00290 | |
| dTTP | 0.02072 | FMN | 0.00290 |
| dGTP | 0.01266 | FAD | 0.00290 |
| dCTP | 0.01118 | CoA | 0.00290 |
| dATP | 0.02114 | Biotin | 0.00290 |
| Pyridoxal phosphate | 0.00290 | ||
| Ribonucleotides | 5-Methyltetrahydrofolate | 0.00290 | |
| UTP | 0.00603 | ||
| GTP | 0.00714 | ||
| CTP | 0.00561 | ||
| ATP | 0.00714 | ||
| Biomass | |||
|---|---|---|---|
| In Vivo | In Silico | Reference | |
| Carbon Source | |||
| N-acetylglucosamine | + | + | [62,63] |
| Glucose | + | + | [61,62,63] |
| Maltose | + | + | [63] |
| Galactose | + | + | [61,62,63] |
| Sucrose | + | + | [63] |
| Fructose | + | + | [61,62,63] |
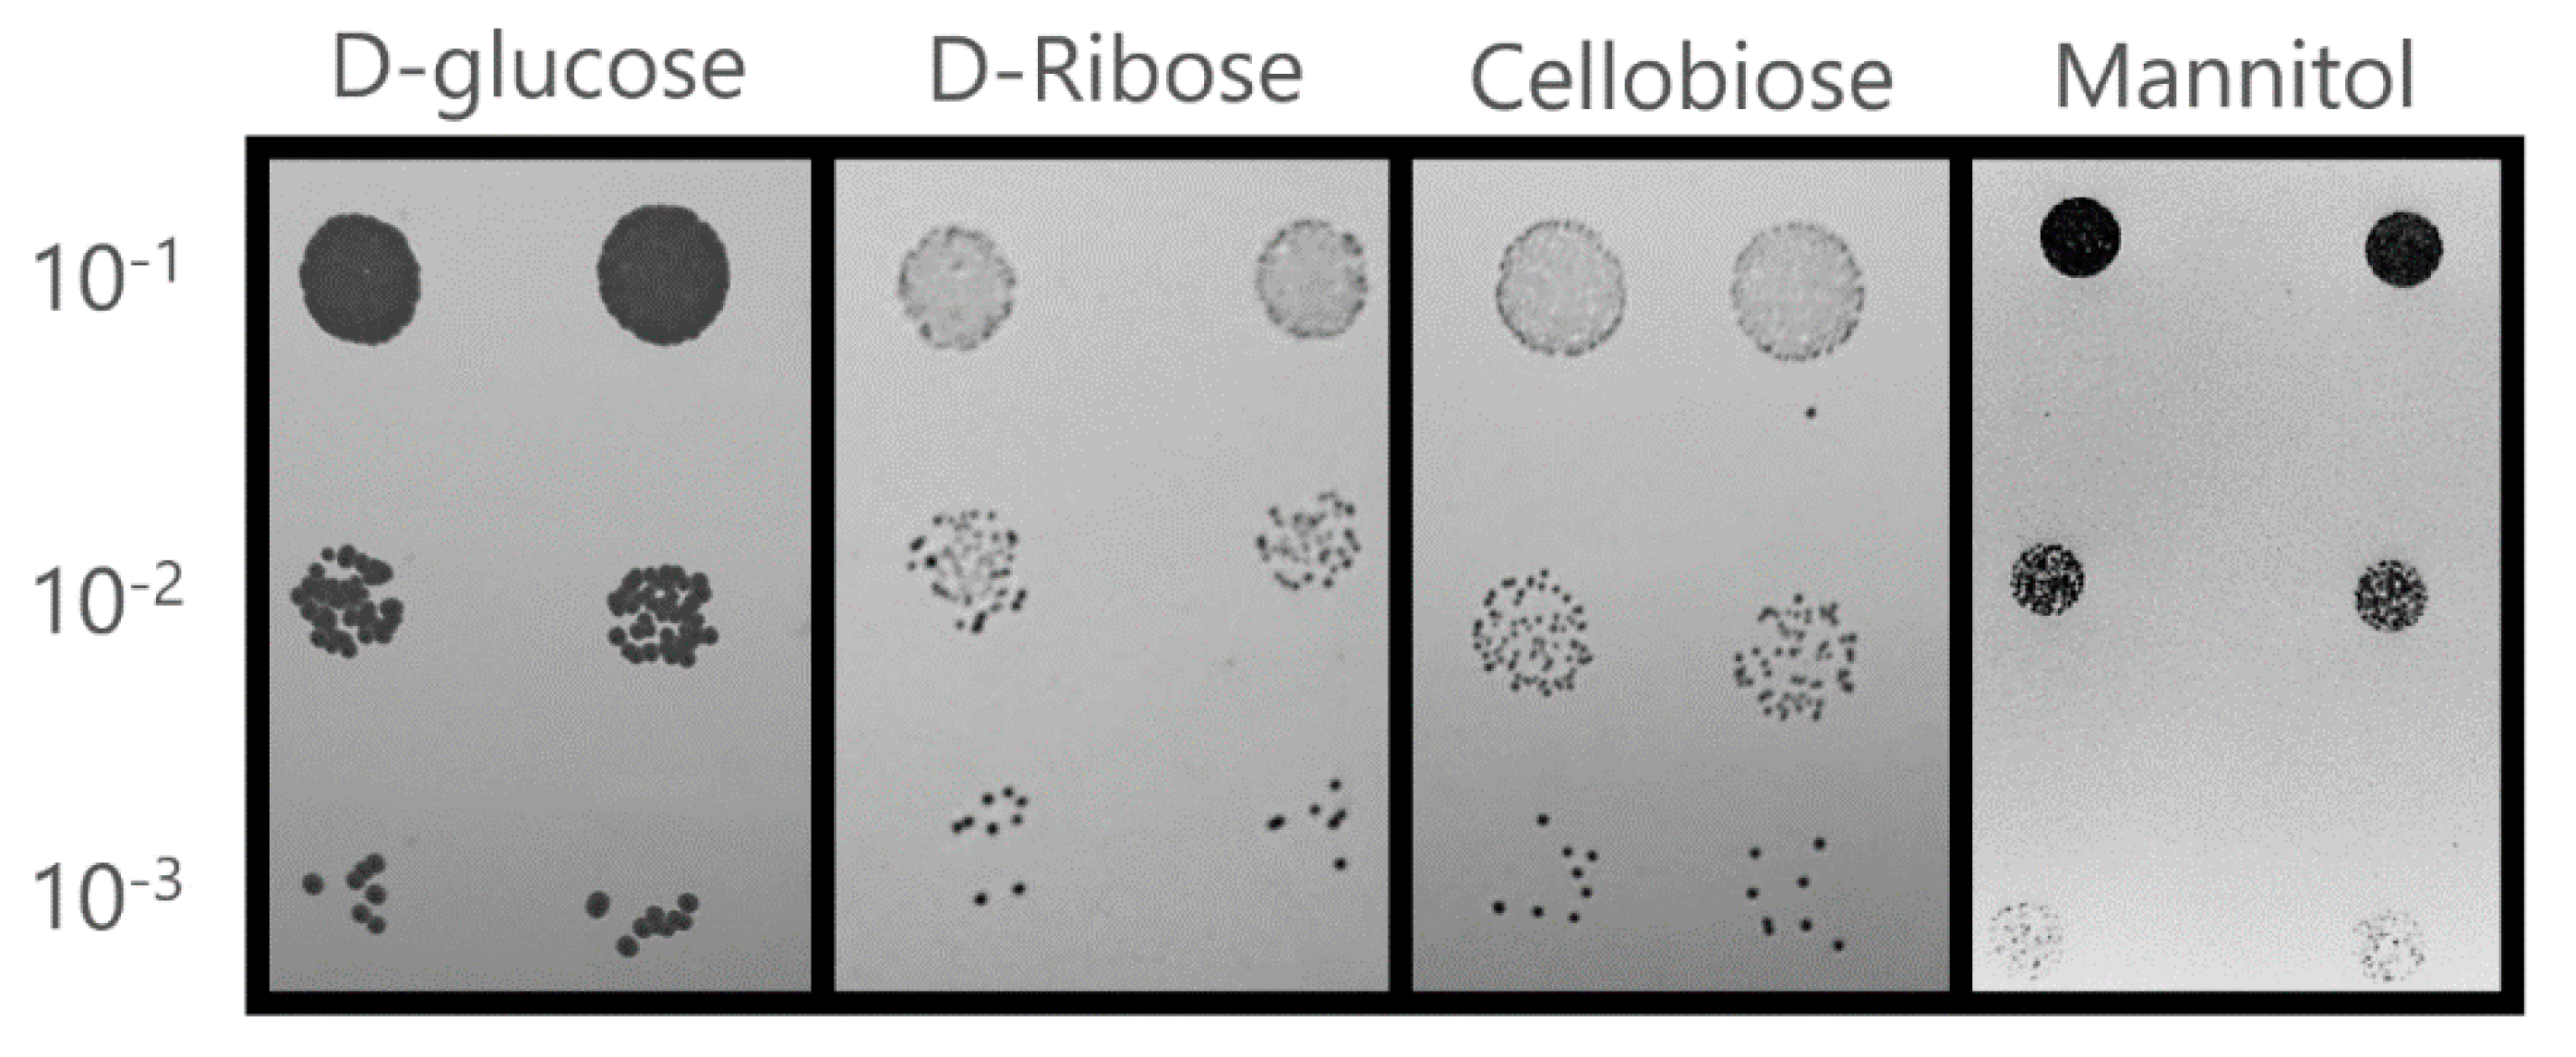
| Mannitol | + | − | This study |
| Acetate | + | + | [63] |
| Ethanol | + | + | [63] |
| Glycerol | + | + | [61,62,63] |
| Mannose | + | + | [61,62] |
| Citrate | + | + | [60] |
| Lactate | + | + | [62] |
| Sorbitol | + | + | [62] |
| L-sorbose | + | + | [60] |
| D-xylose | + | + | [60] |
| L-rhamnose | − | − | [60] |
| α,α-trehalose | + | + | [60] |
| Cellobiose | + | + | This study |
| Salicin | − | − | [60] |
| Myo-inositol | − | − | [60] |
| D-ribose | + | + | This study |
| Ribitol | − | − | [60] |
| D-glucuronate | − | − | [60] |
| D-galacturonate | − | − | [60] |
| Succinate | + | + | [60] |
| D-gluconate | + | + | [60] |
| Arbutin | − | − | [60] |
| D-arabinose | − | − | [60] |
| Galactitol | − | − | [60] |
| Starch | + | + | [60] |
| D-glucosamine | + | + | [60] |
| Inulin | − | − | [60] |
| Melibiose | − | − | [60] |
| Lactose | − | − | [60] |
| Raffinose | − | − | [60] |
| Erythritol | − | − | [60] |
| Xylitol | + | + | [60] |
| L-arabinitol | − | − | [60] |
| Nitrogen Source | |||
| Nitrate | − | − | [60,64] |
| Nitrite | − | − | [60,64] |
| Ethylamine | + | − | [60] |
| L-Lysine | + | + | [60] |
| Ammonia | + | + | [60,64] |
| Cadaverine | + | − | [60] |
| Glucosamine | − | + | [60] |
| Creatine | − | − | [60] |
| Creatinine | − | − | [60] |
| Imidazole | − | − | [60] |
| L-asparagine | + | + | [60,64] |
| Urea | + | + | [60,64] |
| Hydroxylamine | − | − | [60,64] |
| Hydrazine | − | − | [60,64] |
| D-Tryptophan | − | − | [60] |
| Specific Growth Rate (h−1) | q (mmol g−1 dry weight h−1) | ||||
|---|---|---|---|---|---|
| Glucose | Ethanol | Glycerol | Acetic Acid | ||
| In silico C. albicans | 0.53 | 7.56 | 0 | 0 | 0 |
| In vivo C. albicans [60] | 0.51 | 7.56 | 0.38 | 0 | 0 |
| In vivo S. cerevisiae [60] | 0.38 | 13.26 | 21.87 | 1.98 | <0.1 |
| Condition | Specific Growth Rate (h−1) | q (mmol g−1 dry weight h−1) | ||
|---|---|---|---|---|
| Glucose | Ethanol | Glycerol | ||
| In silico GPP | 0 | 0 | 0 | 0 |
| In silico GPPsup. | 0.08 | 6.58 | 10.80 | 0 |
| In silico DMM | 0 | 0 | 0 | 0 |
| In silico DMMsup. | 0.08 | 6.58 | 10.80 | 0 |
| S. cerevisiae DMM [68] | 0.10 | 6.58 | 9.47 | 1.11 |
| Systematic Name | Standard Name | EC Number | Organism | Drug | PDB Entry | Similarity | Coverage |
|---|---|---|---|---|---|---|---|
| C1_08590C_A | ERG1 | 1.14.14.17 | Candida albicans | Terbinafine | - | - | - |
| Candida albicans | Tolnaftate | - | - | - | |||
| C1_09720W_A | URA1 | 1.3.5.2 | Plasmodium falciparum | Atovaquone | 5DEL | 37% | 81% |
| C2_02460W_A | ERG7 | 5.4.99.7 | Candida albicans | Oxiconazole | - | - | - |
| C5_00190C_A | FAS1 | 1.3.1.9 | Mycobacterium tuberculosis | Ethionamide | 4V8W | 30% | 45% |
| Mycobacterium tuberculosis | Isoniazid | ||||||
| C5_00770C_A | FOL1 | 4.1.2.25 | Saccharomyces cerevisiae | Sulfacetamide | 2BMB | 42% | 65% |
| C5_02710W_A | TRR1 | 1.8.1.9 | Staphylococcus aureus | Azelaic acid | 4GCM | 42% | 98% |
| C7_03130C_A | DFR1 | 1.5.1.3 | Escherichia coli | Trimethoprim | 4GH8 | 35% | 77% |
| C5_00770C_A | FOL1 | 2.5.1.15 | Escherichia coli | Sulfonamides and sulfones | 1AJ2 | 36% | 40% |
| P. falciparum | Sulfonamides and sulfones | 6KCM | 26% | 65% | |||
| C1_02420C_A | GSC1 | 2.4.1.34 | Candida albicans | Anidulafungin | - | - | - |
| C1_05600W_A | GSL1 | Candida albicans | Caspofungin | - | - | - | |
| CR_00850C_A | GSL2 | Candida albicans | Micafungin | - | - | - | |
| C3_04830C_A | FAS2 | 2.3.1.41 | Escherichia coli | Cerulenin | 2BYX | 31% | 8% |
| CR_00850C_A | ERG11 | 1.14.14.154 | Candida albicans | Azoles | - | - | - |
© 2020 by the authors. Licensee MDPI, Basel, Switzerland. This article is an open access article distributed under the terms and conditions of the Creative Commons Attribution (CC BY) license (http://creativecommons.org/licenses/by/4.0/).
Share and Cite
Viana, R.; Dias, O.; Lagoa, D.; Galocha, M.; Rocha, I.; Teixeira, M.C. Genome-Scale Metabolic Model of the Human Pathogen Candida albicans: A Promising Platform for Drug Target Prediction. J. Fungi 2020, 6, 171. https://0-doi-org.brum.beds.ac.uk/10.3390/jof6030171
Viana R, Dias O, Lagoa D, Galocha M, Rocha I, Teixeira MC. Genome-Scale Metabolic Model of the Human Pathogen Candida albicans: A Promising Platform for Drug Target Prediction. Journal of Fungi. 2020; 6(3):171. https://0-doi-org.brum.beds.ac.uk/10.3390/jof6030171
Chicago/Turabian StyleViana, Romeu, Oscar Dias, Davide Lagoa, Mónica Galocha, Isabel Rocha, and Miguel Cacho Teixeira. 2020. "Genome-Scale Metabolic Model of the Human Pathogen Candida albicans: A Promising Platform for Drug Target Prediction" Journal of Fungi 6, no. 3: 171. https://0-doi-org.brum.beds.ac.uk/10.3390/jof6030171