Light-Photoreceptors and Proteins Related to Monilinia laxa Photoresponses
by
 , , ,
, , ,
Silvia Rodríguez-Pires
1 ,
,
Eduardo A. Espeso
2,
Neringa Rasiukevičiūtė
3 ,
,
Paloma Melgarejo
4 and
Antonieta De Cal
1,*
1
Department of Plant Protection, Instituto Nacional de Investigación y Tecnología Agraria y Alimentaria (INIA), Ctra. de La Coruña Km. 7, 28040 Madrid, Spain
2
Department of Cellular and Molecular Biology, Centro de Investigaciones Biológicas (CIB), Consejo Superior de Investigaciones Científicas, Ramiro de Maeztu 9, 28040 Madrid, Spain
3
Laboratory of Plant Protection, Lithuanian Research Centre for Agriculture and Forestry, Institute of Horticulture, Kaunas St. 30, LT-54333 Babtai, Kaunas, Lithuania
4
Dirección General de Producciones y Mercados Agrarios, Ministerio de Agricultura, Pesca y Alimentación, 28071 Madrid, Spain
*
Author to whom correspondence should be addressed.
J. Fungi 2021, 7(1), 32; https://0-doi-org.brum.beds.ac.uk/10.3390/jof7010032
Submission received: 24 November 2020
/
Revised: 14 December 2020
/
Accepted: 17 December 2020
/
Published: 7 January 2021
Abstract
:Light represents a ubiquitous source of information for organisms to evaluate their environment. The influence of light on colony growth and conidiation was determined for three Monilinia laxa isolates. The highest mycelial growth rate was observed under red light for the three M. laxa isolates, followed by green light, daylight or darkness. However, reduced sporulation levels were observed in darkness and red light, but conidiation enhancement was found under daylight, black and green light with more hours of exposure to light. Putative photoreceptors for blue (white-collar and cryptochromes), green (opsins), and red light (phytochromes) were identified, and the photoresponse-related regulatory family of velvet proteins. A unique ortholog for each photoreceptor was found, and their respective domain architecture was highly conserved. Transcriptional analyses of uncovered sets of genes were performed under daylight or specific color light, and both in time course illumination, finding light-dependent triggered gene expression of MlVEL2, MlPHY2, MlOPS2, and MlCRY2, and color light as a positive inductor of MlVEL3, MlVEL4, MlPHY1, and MlCRY1 expression. M. laxa has a highly conserved set of photoreceptors with other light-responsive fungi. Our phenotypic analyses and the existence of this light-sensing machinery suggest transcriptional regulatory systems dedicated to modulating the development and dispersion of this pathogen.
1. Introduction
The European brown rot Monilinia laxa (Aderhold et Rulhand) Honey causes diseases in important Rosaceae family crops, in particular, stone fruit and pome fruit [1]. Climatic conditions are critical for M. laxa infection in stone fruit. Among the climatic factors that most influence the penetration and infection of Monilinia spp. are temperature and wetness duration period [2]. A positive correlation has been reported between M. laxa incidence at postharvest and temperature, temperature being responsible for 82% of postharvest brown rot [3]. The temperature was also positively correlated with the number of necrotic infected twigs in peach orchards [4]. Survival, colonization, latency, reproduction, release, transport, and deposition of Monilinia spp. conidia are related to temperature, the relative humidity, the amount of rainfall, and the wind direction [5,6].
Other less studied abiotic environmental factors, such as light and circadian rhythms, are important sources of information for organisms to evaluate their environment. Light has been recognized as one of the environmental factors stimulating pathogens for host invasion [7]. Interest in plant–pathogen interactions has increased because of its possible role in the development of disease [8,9], photoreceptors being even necessary for complete virulence [10,11,12]. Light responsive Botrytis cinerea strains show different colonial growth behaviors through sensing specific ranges of light wavelength. The ultraviolet (UV) and far-red lights promote conidiation, while red and blue lights have a negative effect [13]. The effect of green light was less studied in B. cinerea, although it has been related to repression of mycelial growth and conidial germination [14]. In Monilinia spp. long-wave UV light is a useful tool to distinguish between species; a faster growth rate was observed in M. fructigena through light–dark cycles or UV light [15]. Light triggers spore production in the field through diurnal patterns of light–darkness [5]. Brown rot caused by M. laxa is related to the intensity and quality of light as well as the light duration period. An increase in conidia density on nectarines was recorded with greater exposure to light during M. laxa–fruit interaction [16]. Red light also causes a significant increase in the incidence and severity of nectarine brown rot caused by M. laxa [16].
Fungi have the ability to sense light through photoreceptors that can respond to direction, different wavelengths, or intensity of light [9,17,18]. As part of the signaling networks, the activity of photoreceptors influences multiple biological responses, such as spore germination, vegetative growth, sexual and asexual development, secondary metabolism, and circadian rhythm [19,20,21]. Photobiology has been thoroughly examined in fungal models, such as Neurospora crassa and Aspergillus nidulans, harboring similar genetic components but subject to differential regulation. For example, the white-collar complex is the central photosensory system in N. crassa, while multiple photoreceptors are needed in A. nidulans [22,23,24]. Light is essential for conidiation in A. nidulans regulated by the veA gene product (velvet family), both asexual development and secondary metabolism [25,26,27]. Members of the velvet family are probably one of the most ancient fungal regulators connecting signal transduction with the control of development and metabolism [28]. The continuous increase in information on fungal genomes allows wide-ranging searches for candidate photoreceptors that identify highly conserved groups; white-collar and cryptochrome families as blue light receptors, phytochromes, and opsins for the red light and green light-sensing, respectively [9,20,29].
The closely related B. cinerea, Sclerotiniaceae family member like Monilinia spp., possesses a remarkable collection of photoreceptor genes covering UV to far-red light [30]. The importance of sensing light for this pathogen became evident when a natural variation in one of the velvet genes was found and explained the light-dependent conidiation in B05.10 in contrast to the T4 isolate [11]. M. laxa is a light-responsive fungus with the ability to react to light [16]. The presence of light changes their gene expression patterns [31], but the machinery by which they perceive light has been scarcely explored.
The main objective of this work was to evaluate the effect of light on colony growth and conidiation of Monilinia laxa in vitro conditions and describe the putative photoreceptor machinery in M. laxa genome by in silico analyses. The transcriptional pattern of some potential photoreceptor genes in response to different light wavelengths was also determined.
2. Materials and Methods
2.1. Monilinia laxa Strains and Culture Conditions
Three single-spore strains from M. laxa (namely 5L, 8L, and 25L) were used in this work from the culture collection of the Plant Protection Department of INIA (Madrid, Spain). Strains were originally isolated from mummified plum fruit (cv. Sungold) from a commercial orchard in Lagunilla (Salamanca, Spain). The genome sequence of M. laxa 8L was recently published [32], and the strain was also deposited in the Spanish Culture Type Collection (Spanish acronym, CECT 21100). M. laxa strains were stored at 4 °C on potato dextrose agar for short-term storage and −80 °C as a conidial suspension in 20% glycerol for long-term storage. Cultures were incubated at 22 °C with a 12 h photoperiod for conidiation on potato dextrose agar amended with 20% of tomato pulp (PDA-T; Difco, Detroit, MI, USA) for 7–9 days.
2.2. Effect of Light on Monilinia laxa Colony Growth and Conidiation
The influence of different illumination conditions on colony growth rate and conidia production under two photoperiods was evaluated for the three M. laxa isolates described above. A 15 µL droplet of conidia suspension of each strain (105 conidia ml−1) was placed on the center of Petri dishes filled with PDA-T and incubated for 7 days at 22 °C in the indicated light environment. To determine the effect of light on M. laxa growth, two perpendicular diameters were measured daily from 3-day to 7-day incubation. The daily growth length (diameter in mm day−1) was calculated from the individual measurements of the colony diameter using regression analysis. Sporulation concerning the growth area from each strain and condition was calculated at the end of each assay. For that purpose, the surface of each plate was individually scratched with a sterile loop after adding 5 mL of sterilized distilled water and filtered through glass wool to remove the mycelia. The number of conidia produced by M. laxa strains in each light condition and photoperiod was counted using a hemocytometer. Data are expressed as total conidia divided by the colony area (cm2). Two different photoperiods were tested, 16 h light/8 h darkness or 8 h light/16 h darkness, and three replicates were made of each light condition, and the complete experiment assay was done twice. Plates belonging to continuous darkness condition were protected from light but subjected to both photoperiods. White light was generated using a set of 4 fluorescent bulbs of Osram 36 W/954 (daylight) and Osram 36 W/840 (cool light). Red light, blue light, green light, and black light (UV-A) were generated by using a set of 4 fluorescent bulbs of F36W/T8/Red Sylvania, F36/T8/B Sylvania, F36W/T8/G Sylvania, and TL-D Philips 36W fluorescent bulbs, respectively.
2.3. Identification of Putative Photoreceptors
To find putative photoreceptors of M. laxa, we used protein sequences of described photoreceptors in B. cinerea B05.10 (Table 1) as query sequences against the M. laxa 8L predicted proteome [32] using BLASTP tool through NCBI Genome Workbench software (https://0-www-ncbi-nlm-nih-gov.brum.beds.ac.uk/tools/gbench/). Moreover, all the sequences were verified in a recently Mlax316 M. laxa available genome [33], and candidates were subjected to gene ontology classification using OmicsBox v1.3.11 (BioBam, Valencia, Spain). Candidate M. laxa 8L proteins were further analyzed for their domain structure with InterPro Scan, Pfam, Prosite software tools using default settings and NCBI conserved domain database.
We used the Mlax316 M. laxa genome database [33] to design specific primers for the amplification and sequencing of the complete velvet4 in our M. laxa isolates due to not appearing in our proteome prediction from the deposited genome. The presence of velvet4 in the genomic DNA was confirmed by PCR (Table S1). PCR products were purified using Nucleospin gel and PCR clean-up kit (MN, Düren, Germany) and sequenced (STAB VIDA, Caparica, Portugal).
2.4. Light Transcriptomic Analyses
Freshly harvested conidia from M. laxa 8L were used to inoculate potato dextrose broth (PDB; Difco, Detroit, MI, USA) with a final concentration of 105 conidia ml−1 and incubated at 22 °C in darkness at 150 rpm for 24 h. Mycelium was collected from 50 mL of PDB by brief vacuum filtration into 0.45 µm cellulose–nitrate membrane placed on PDA-T under darkness, daylight, blue, green, and red light exposure. After 0.5, 2, 4, and 6 h of the indicated light environment, mycelium was harvested and immediately frozen in liquid nitrogen. The complete assay was repeated twice.
Total RNA was isolated from mycelia of each light and time exposure with TRI reagent (Sigma–Aldrich, St Louis, MO, USA), according to [34]. RNA concentration and purity were assessed using a Nanodrop 2000 spectrophotometer (Thermo Scientific, Wilmington, DE, USA). RNA integrity was checked by 1.2% agarose gel electrophoresis. RNA was treated with DNase I Amplification Grade (Invitrogen, Carlsbad, CA, USA) according to the manufacturer’s specifications to remove any remaining genomic DNA. cDNA was synthesized from 2 µg of RNA using the SuperScript First-Strand Synthesis System for RT-PCR and oligo(dT) primer (Invitrogen, Carlsbad, CA, USA). Real-time PCR was performed with a 7500 Fast Real-Time PCR (Applied Biosystems, Foster City, CA, USA) using GoTaq qPCR Master Mix (Promega, Madison, WI, USA). Each reaction was carried out in triplicates in a total volume of 20 µL, containing 10 µL of 2× GoTaq qPCR Master Mix, 7.8 µL of Nuclease-Free water, 0.6 µL of each primer (10 µM), and 1 µL of cDNA. The cycling program was 2 min at 95 °C, followed by 40 cycles of 15 sec at 95 °C and 1 min at 60 °C. After the amplification reaction, a melt curve analysis was performed to check the specificity of different reaction products. The relative expression levels were calculated using the 2−ΔΔCT method [35] relative to darkness condition at 0 h post illumination. The M. laxa histone H3 (Ml_HistoneH3, BK012065) and 60S ribosomal protein L5 (MlRPL5, BK013068) were used as endogenous reference genes. All the primers used in RT-qPCR were designed base on M. laxa 8L genome using vector NTI (ThermoFisher, Waltham, MA, USA) and listed in Table S1. Three technical replicates were analyzed for each biological replicate for both the target and the reference genes. Nucleotide sequence data reported are available in the Third Party Annotation Section of the DDBJ/ENA/GenBank databases under the accession numbers TPA: Ml_HistoneH3, BK012065; MlRPL5, BK013068; and BK014380 to BK014395 for putative photoreceptors.
2.5. Statistical Analysis
Data were analyzed by a multiway analysis of variance [36]. When F-test was significant at p ≤ 0.05, the means were compared using Duncan’s multiple range test.
3. Results
3.1. Effect of Light on Monilinia Laxa Colony Growth, Conidiation, and Morphology
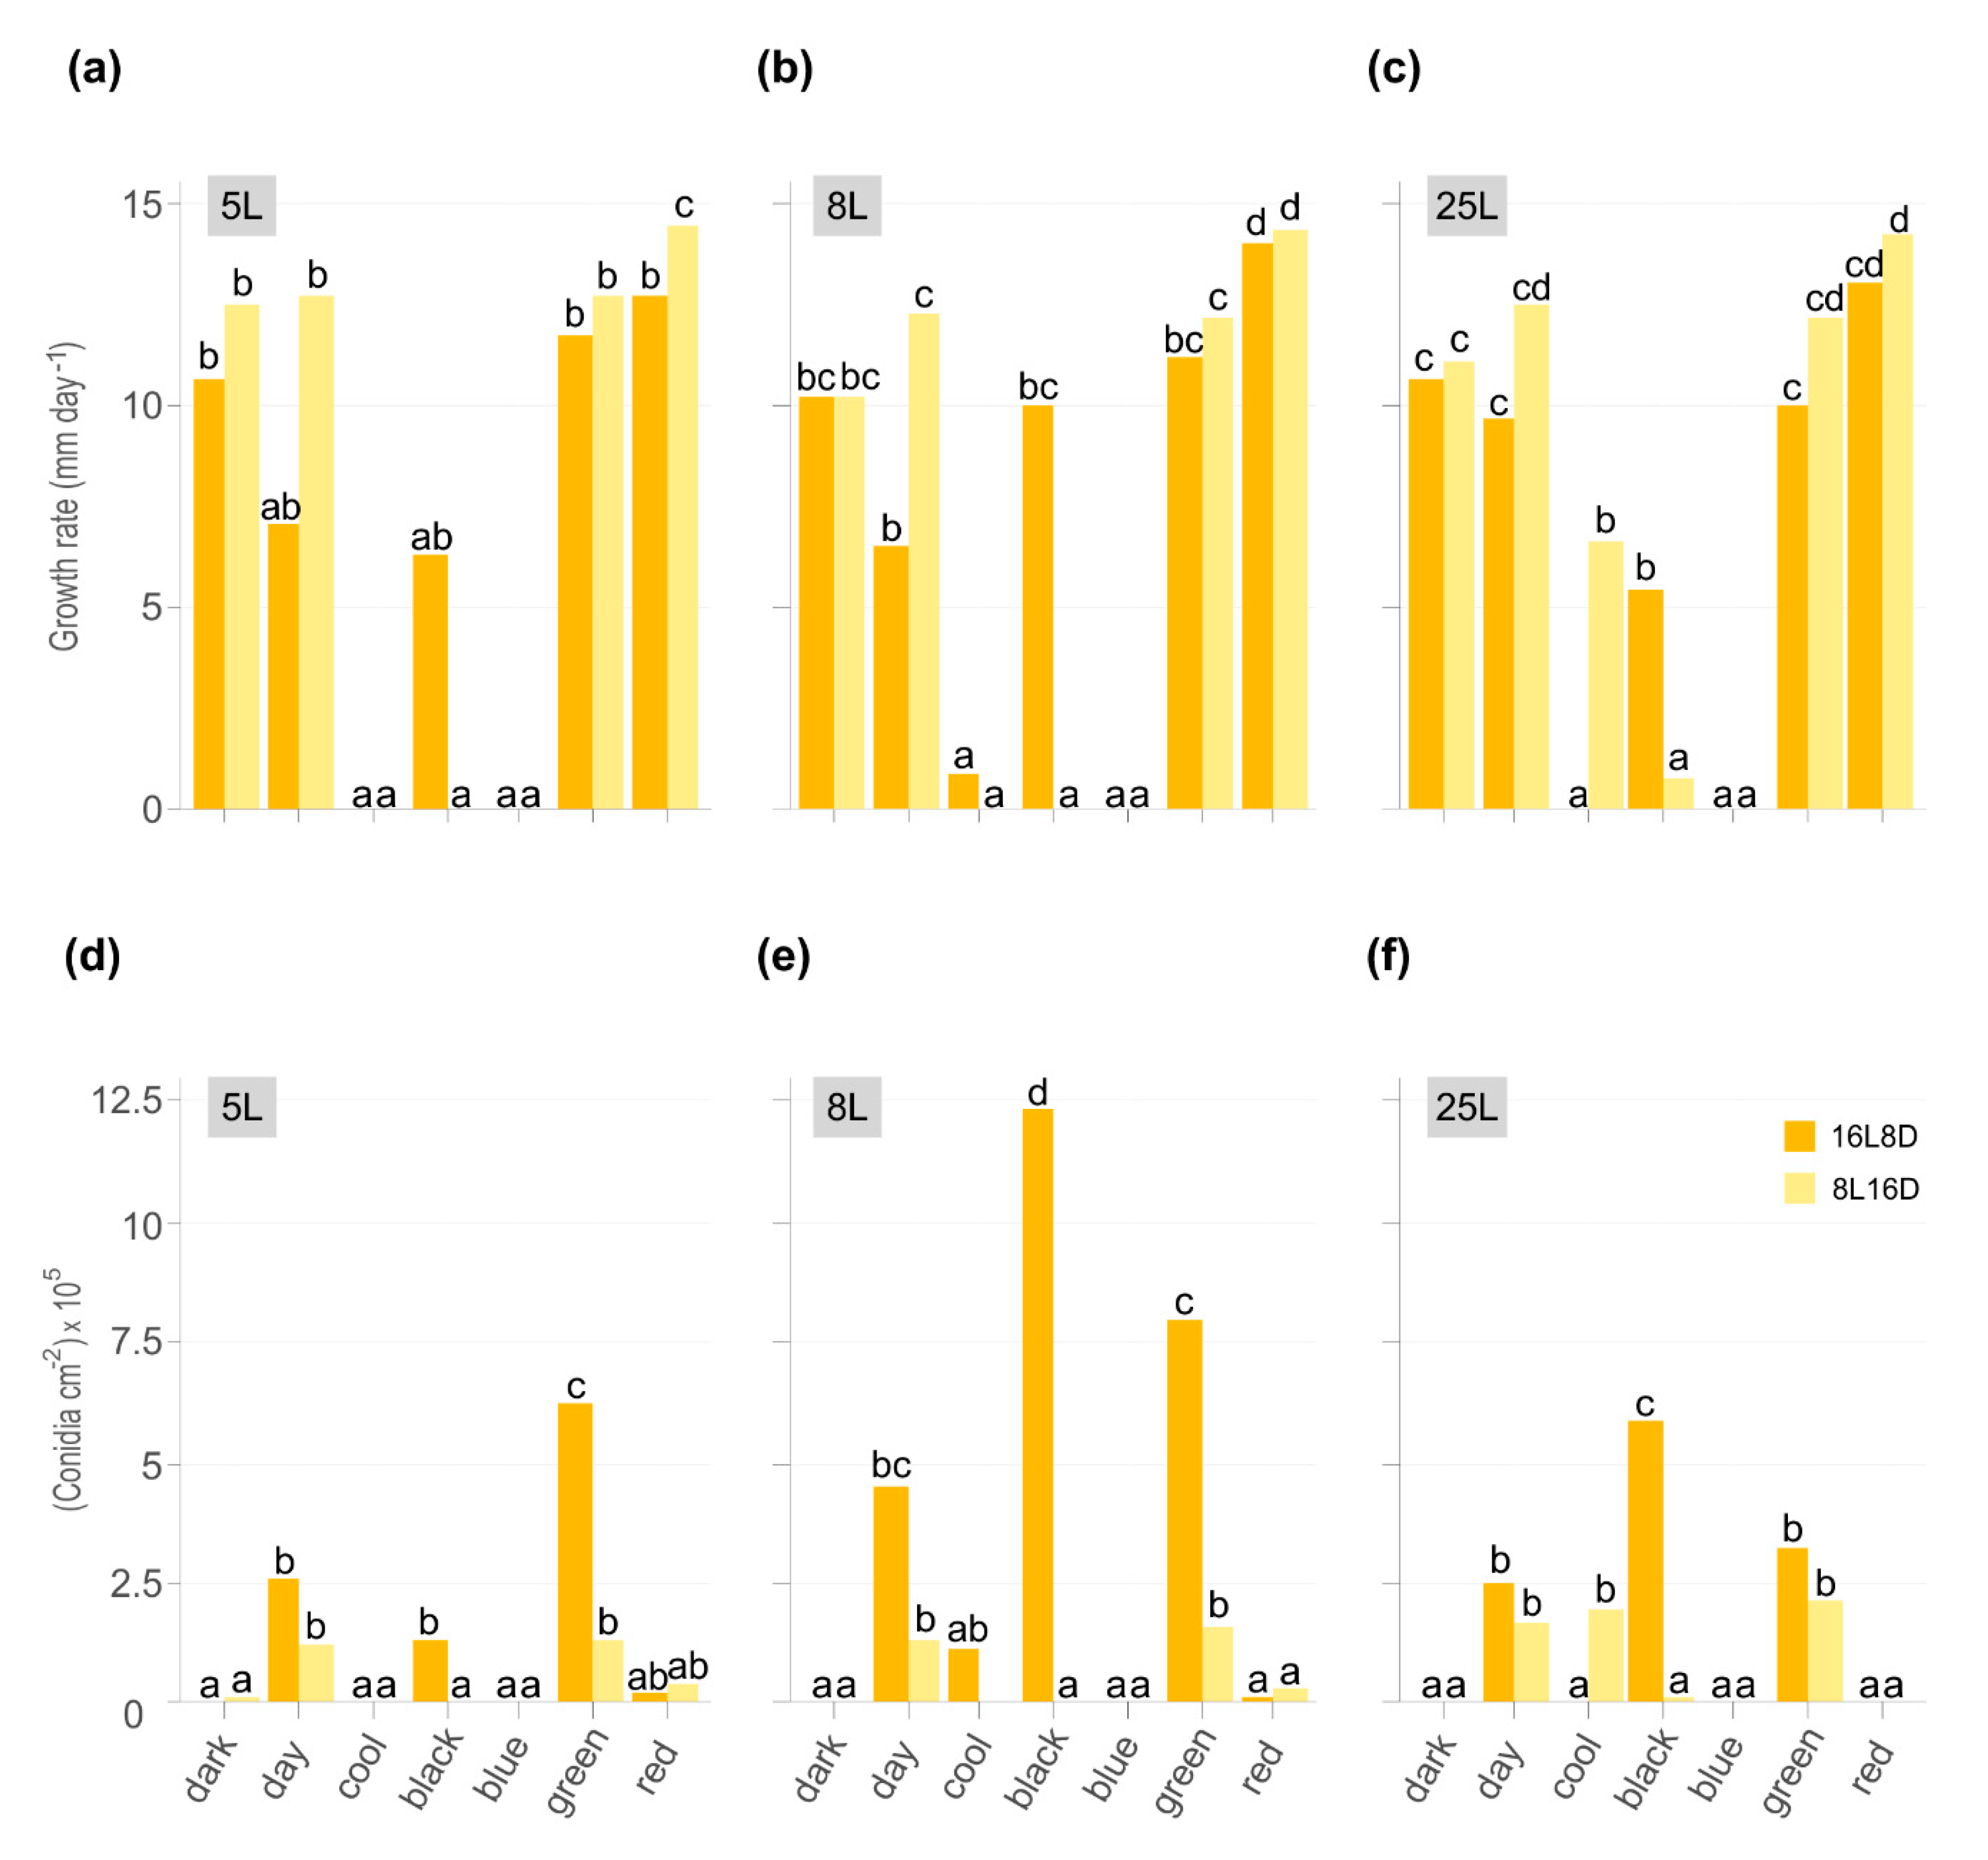
Colonial growth of three M. laxa isolates was evaluated on PDA-T under different light wavelength ranges in two photoperiods and continuous darkness. After seven days of incubation, growth and conidiation were significantly affected by light conditions and photoperiod (Figure 1) as well as colony morphology (Figure 2). Although the pattern of growth is nearly similar between isolates, there are differences in conidia production in some light conditions among them. Importantly, the temperature was monitored to avoid a cross effect due to illumination energy. The average temperatures were 23 and 23.7 for daylight, 24.5 and 26.5 for cool light, 23.5 and 24.5 for blue-light, 24.1 and 25.9 for green-light, 22.9 and 23.3 for red-light, and 23.5 and 23.9 °C for black light (UV-A), 8 h light and 16 h light photoperiods, respectively.
The most significant growth rate was observed under red light in 5L, 8L, and 25L M. laxa isolates, specifically at photoperiod with fewer light hours (8L16D) (Figure 1a–c). All three isolates grew under black light, mainly in the 16L8D photoperiod. At the same light condition, the only significant differences in growth rate were observed between photoperiods in daylight for M. laxa 8L and black light for M. laxa 25L (Figure 1b,c). None of the three M. laxa isolates was able to grow under blue light. In contrast, 8L and 25L grew when they were illuminated with cool white light but at different photoperiods.
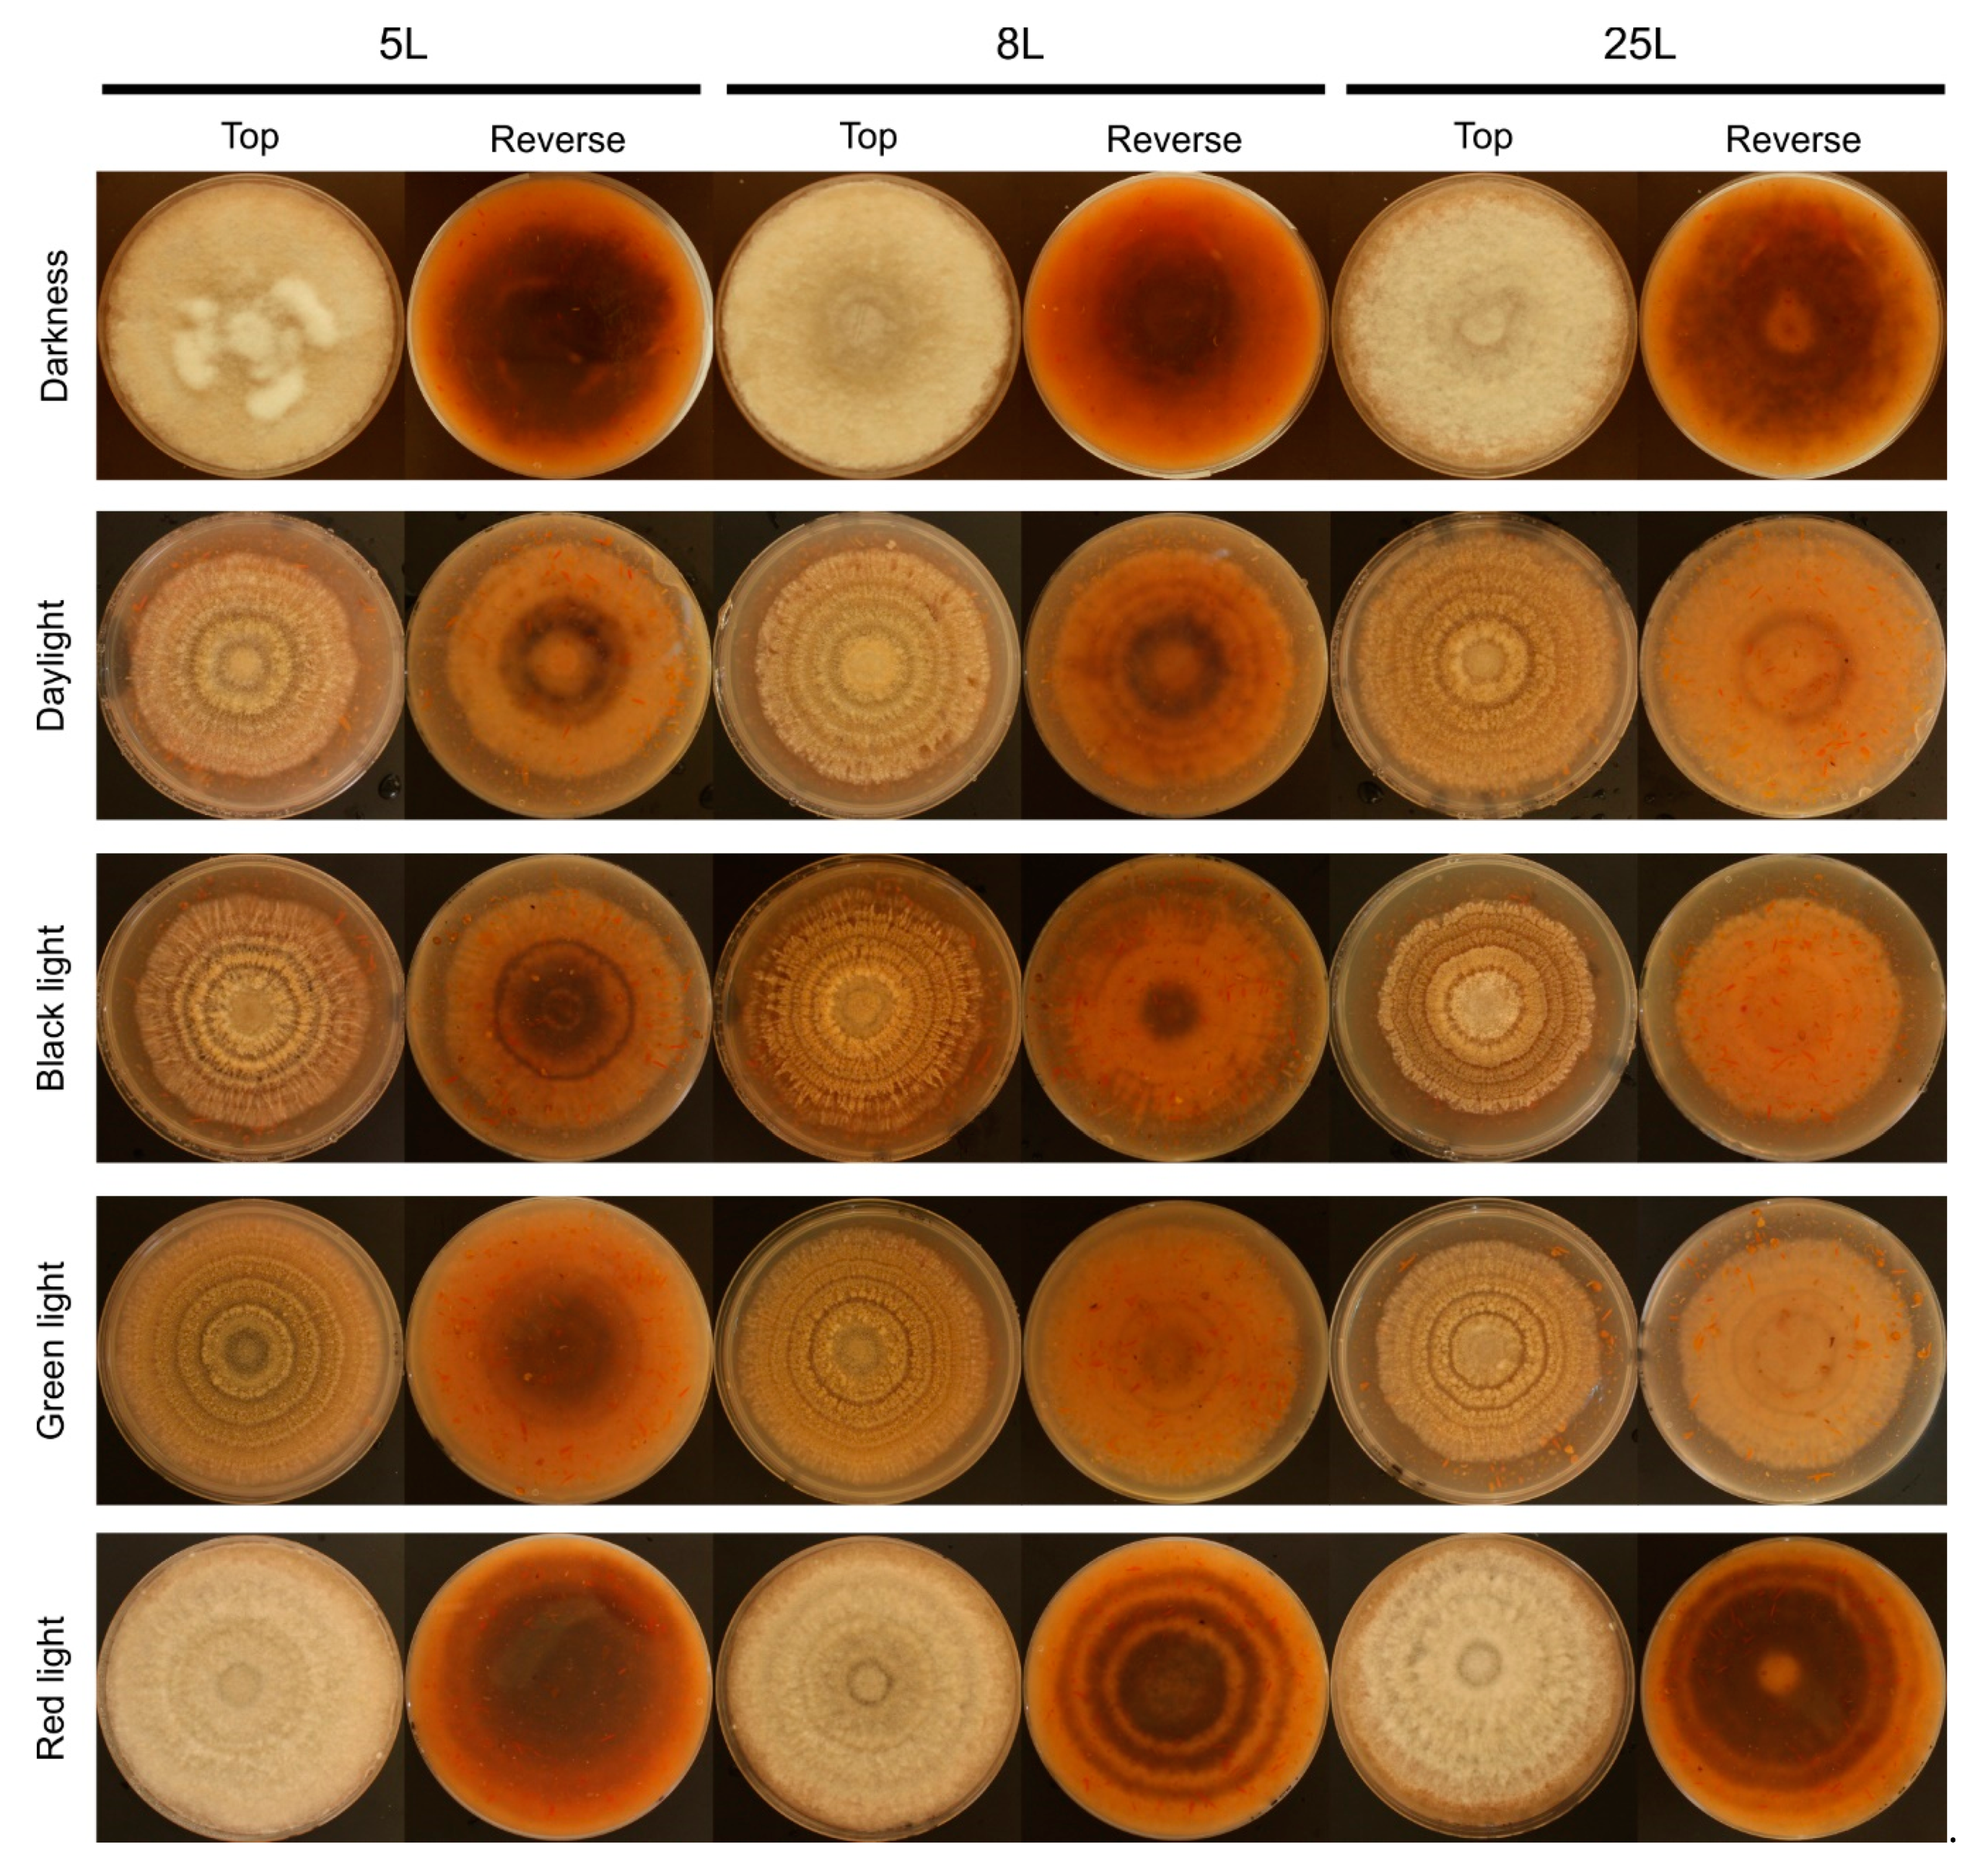
The light wavelength and photoperiod influenced the production of conidia in M. laxa isolates and was favored with 16L8D photoperiod (Figure 1d–f). In all three M. laxa isolates, deficient sporulation was observed in darkness and red light. In the M. laxa 5L and 25L, significant differences were observed in daylight, black light, and green light, with the highest production under green light for 5L and black light in 25L. The isolate that best-produced conidia were 8L, especially under black light, followed by daylight or green light. Concerning the morphological colony features, under red light and darkness, the mycelia of the three M. laxa were fluffy and off-white. In contrast, concentric rings of sporulation and brownish color were observed in the day, black, and green lights for all three M. laxa isolates (Figure 2). Looking at the back of the plates, there are differences in pigmentation between lights, ring-shaped in red light, scattered in darkness, and less pigmentation in daylight, black or green lights (Figure 2).
3.2. Identification of Putative Photoreceptors
Based on the described photoreceptors of B. cinerea B05.10, we used BLASTP searches, Basic Local Alignment Search Tool (BLAST) for protein searches (P), against the M. laxa 8L predicted proteome [32]. As a result, we identified putative orthologous for all the described B. cinerea photoreceptors with identities greater than 69% and coverage over 90% except for velvet4 (Table 1, see also below). All the sequences were verified in a recently M. laxa Mlax316 available genome [33] and compared with M. laxa 8L (Table 1).
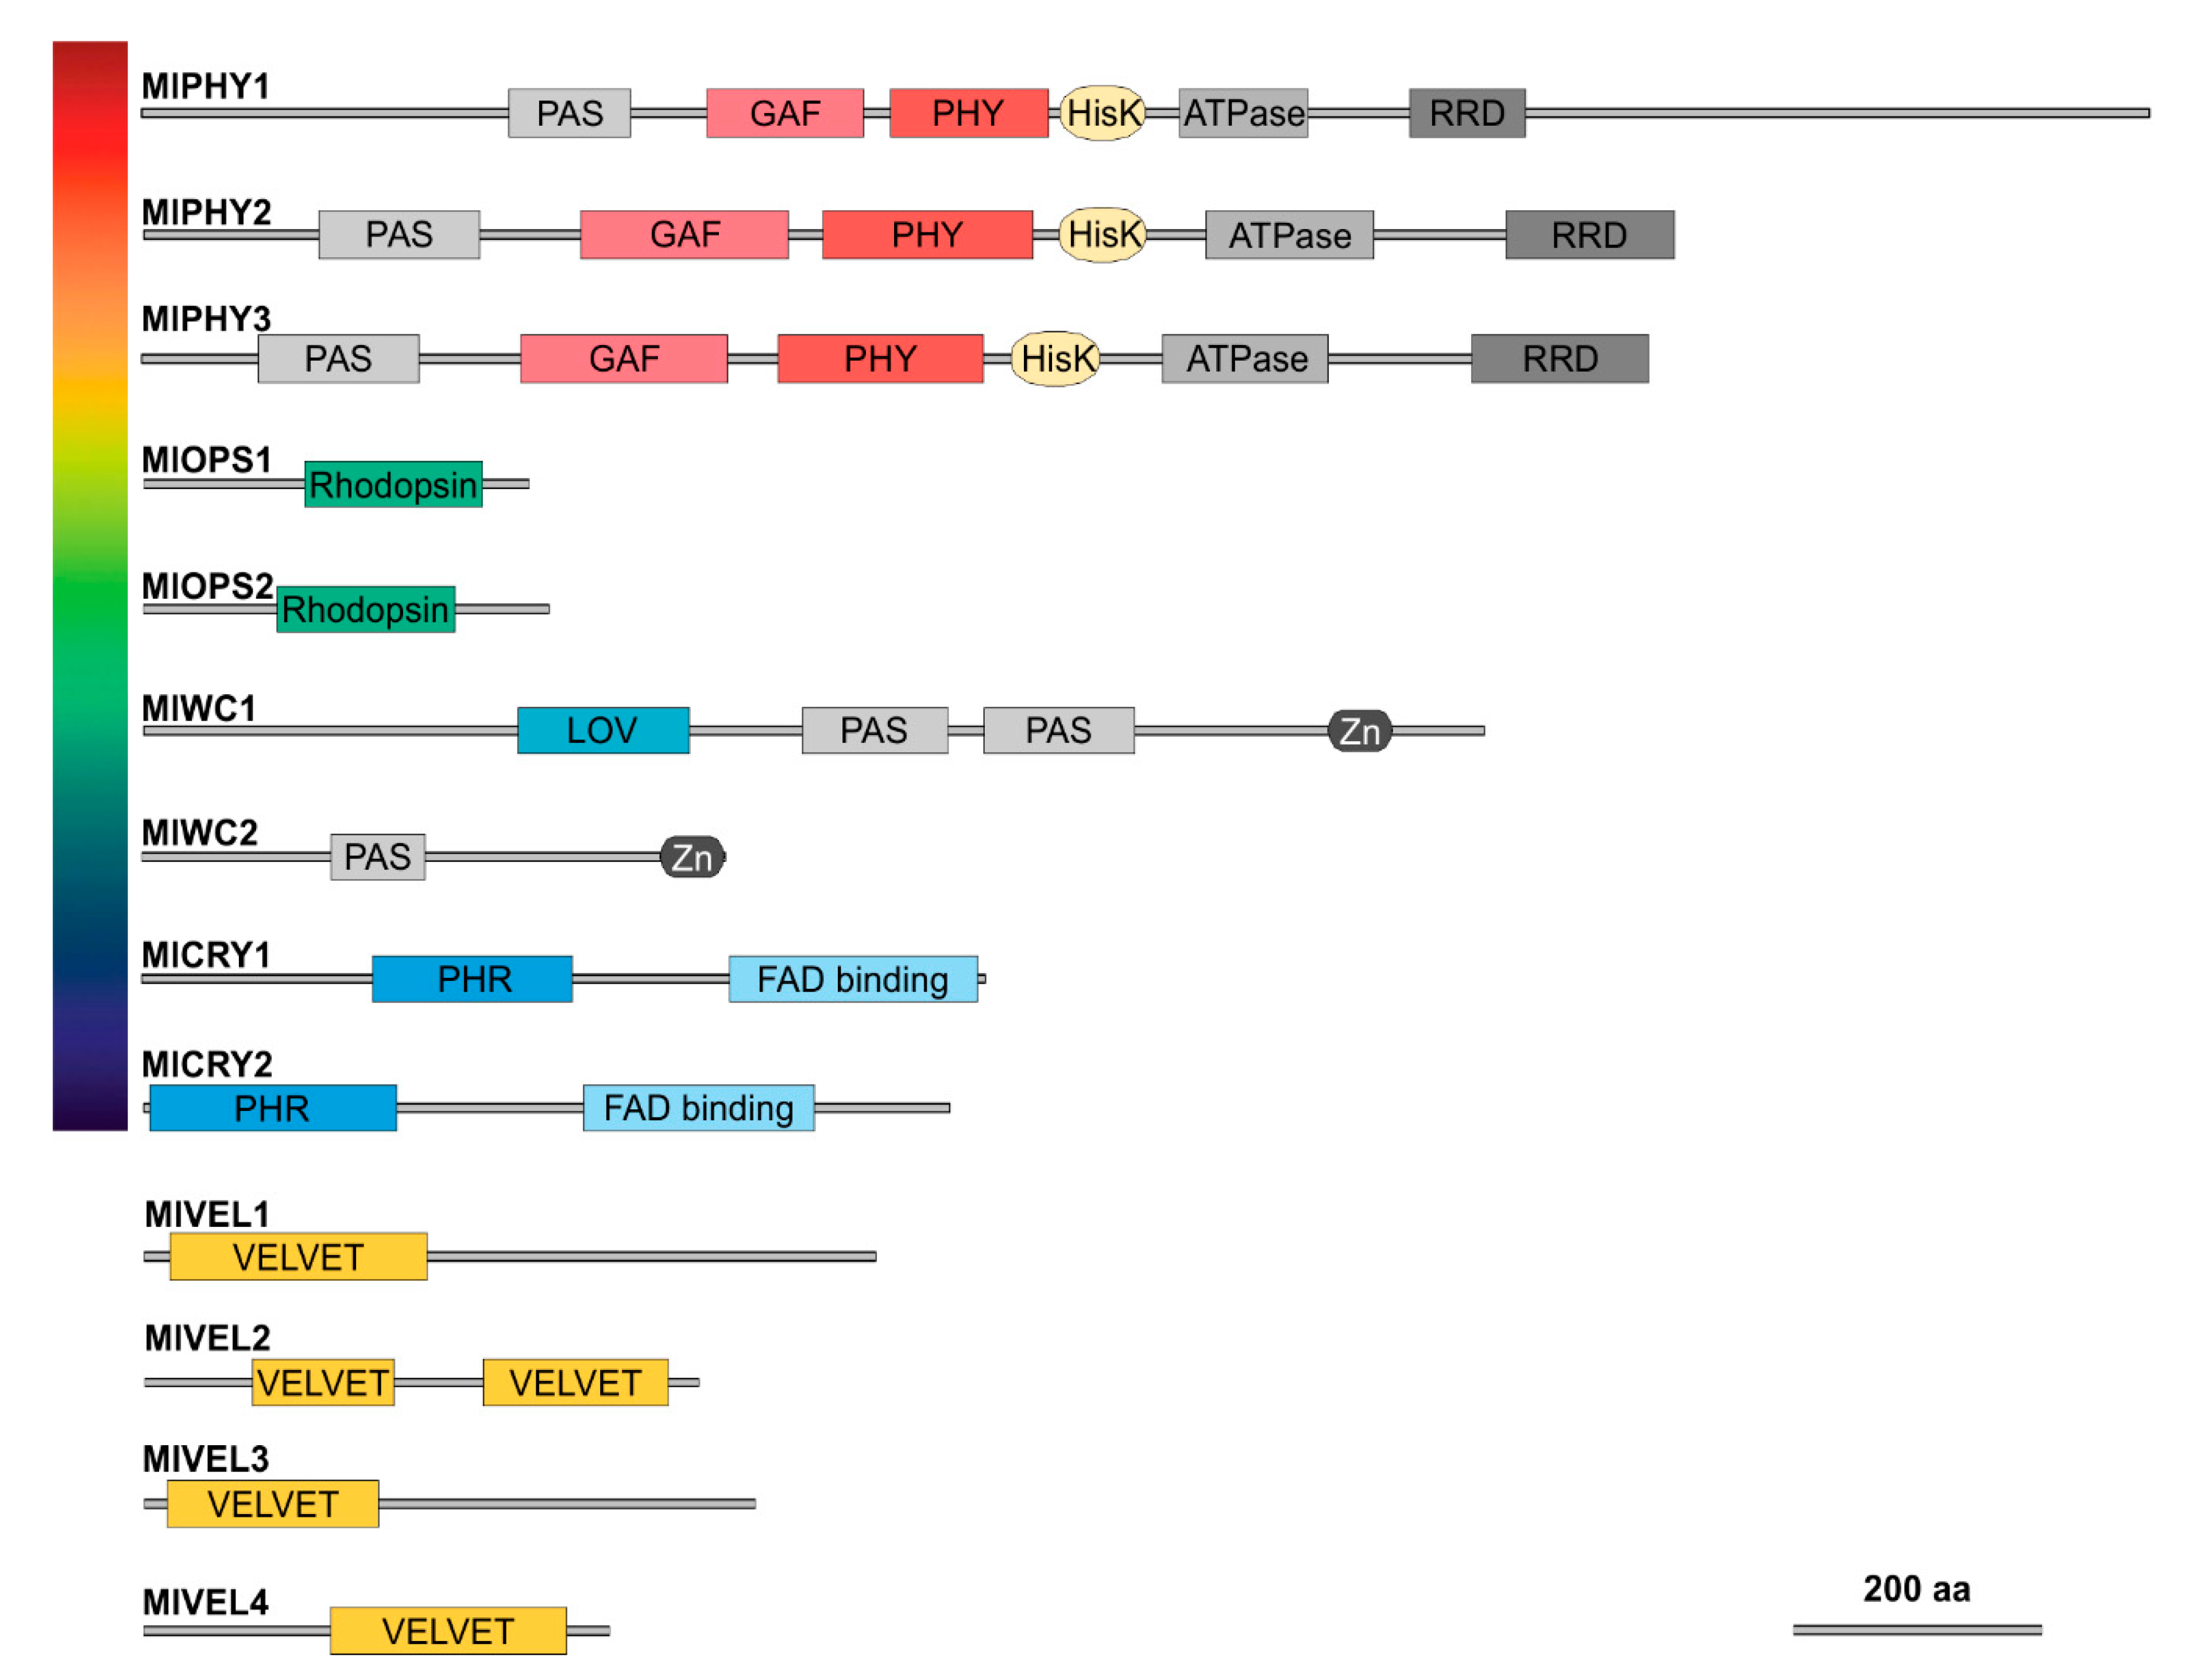
The domain architecture in proteins classified as possible color photoreceptors was as expected according to previous studies in other fungi (Figure 3). The possible red M. laxa receptors vary in length between them; all three phytochromes harbor from the N-terminal to C-terminal part a PAS domain (Per/Arnt/SIM, PF08446), GAF domain (cGMP-specific phosphodiesterase, PF01590), PHY domain (phytochrome-specific domain, PF00360), HisK domain (histidine kinase, PF00512), ATPase domain (PF02518), and RRD domain (response regulator domain, PF00072). Putative green light receptors (Figure 3), opsins, harbor a retinal binding site in the rhodopsin domain (PF01036). As blue light photoreceptors, we found the white-collar proteins and the cryptochromes. The white-collar proteins harbor a PAS domain (PF08447) and a Zing finger domain (Zn, PF00320), and MlWC1 had a LOV domain (light–oxygen–voltage) and a different PAS domain (Figure 3). On the other hand, cryptochromes have different domains than white-collar ones; they harbor a PHR domain (Photolyase homology region, PF08005) and a FAD-binding domain (PF03441) (Figure 3).
Due to the lack of a prediction for the velvet 4 coding gene in the published version of the 8L genome [32], we wanted to verify the absence/presence of velvet4 with specific oligonucleotides to amplify the complete gene of the possible velvet4 homologous region in M. laxa isolates based on the genome sequence of Mlax316 [33]. After performing PCR, obtaining a fragment of the expected size, it was sequenced and proved that this sequence was present in the 8L genome (Figure S1). The prediction of the domain architecture was performed in the same way as the photoreceptors. As expected, MlVEL1, MlVEL3, and MlVEL4 harbor a velvet domain (PF11754), while MlVEL2 had two velvet domains (Figure 3).
3.3. Effect of Light on the Transcriptional Pattern of Velvet Gene Family and Identified Photoreceptors
Considering changes in the conidiation, colony morphology, and growth rates when M. laxa is exposed to different light sources, expression analysis of putative genes implicated in photoresponses and possible photoreceptors were performed.
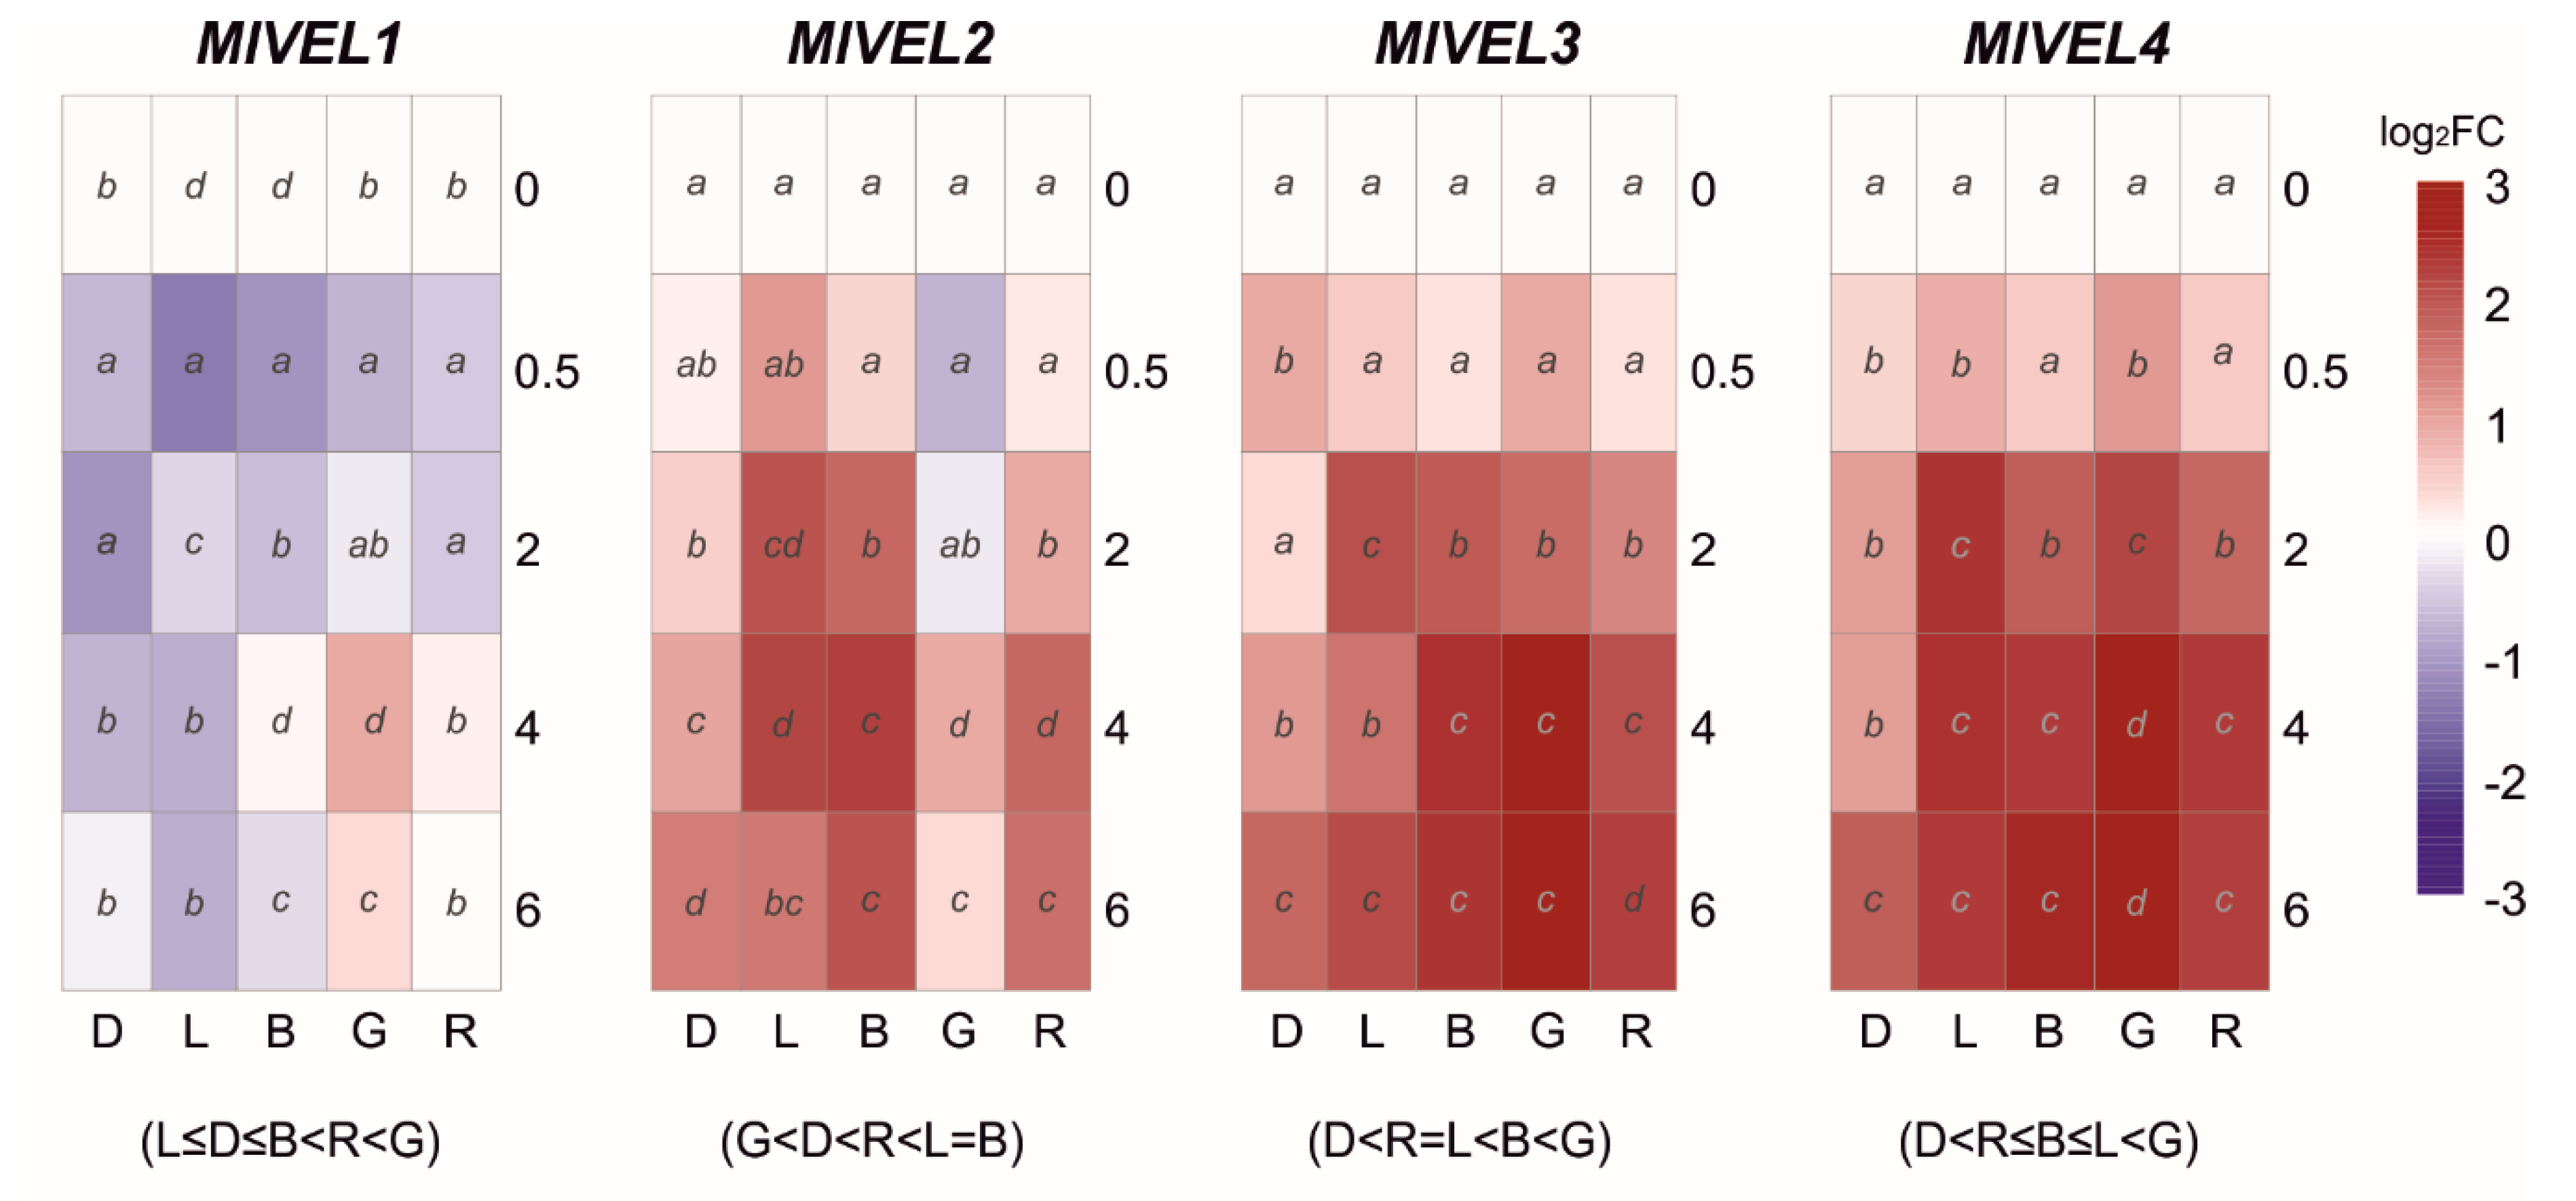
The Velvet family has been described in other fungi as involved in photoresponses and included at least four genes in M. laxa. Therefore, their transcription pattern was analyzed when M. laxa 8L was exposed to white light and blue, green, and red lights, in addition to continuous darkness (Figure 4). Overall, the expression levels of MlVEL1 were downregulated under any light condition, including continuous darkness, with a strong downregulation with a short daylight exposure (0.5 h). Only green light had a positive effect on MlVEL1 with a significative peak at 4 h (Figure 4). On the contrary, green light caused a reduction in MlVEL2 expression than continuous darkness. However, MlVEL2 expressed higher transcript levels under day, blue, and red lights after two hours of exposure (Figure 4). Expression levels of MlVEL3 and MlVEL4 run parallel, increasing after exposure to any light, being the highest levels of expression under green light at 4 h with 6.9–h and 7.1–fold, respectively (Figure 4). Over time there was an increase in expression levels of both genes under continuous darkness.
A subset of representative genes coding for photoreceptors (Figure 3) were also studied under specific illumination conditions. Expression levels of cryptochromes and white-collar genes were studied under blue light, opsins with green light, and phytochromes with red light, in addition to daylight and continuous darkness for all of them.
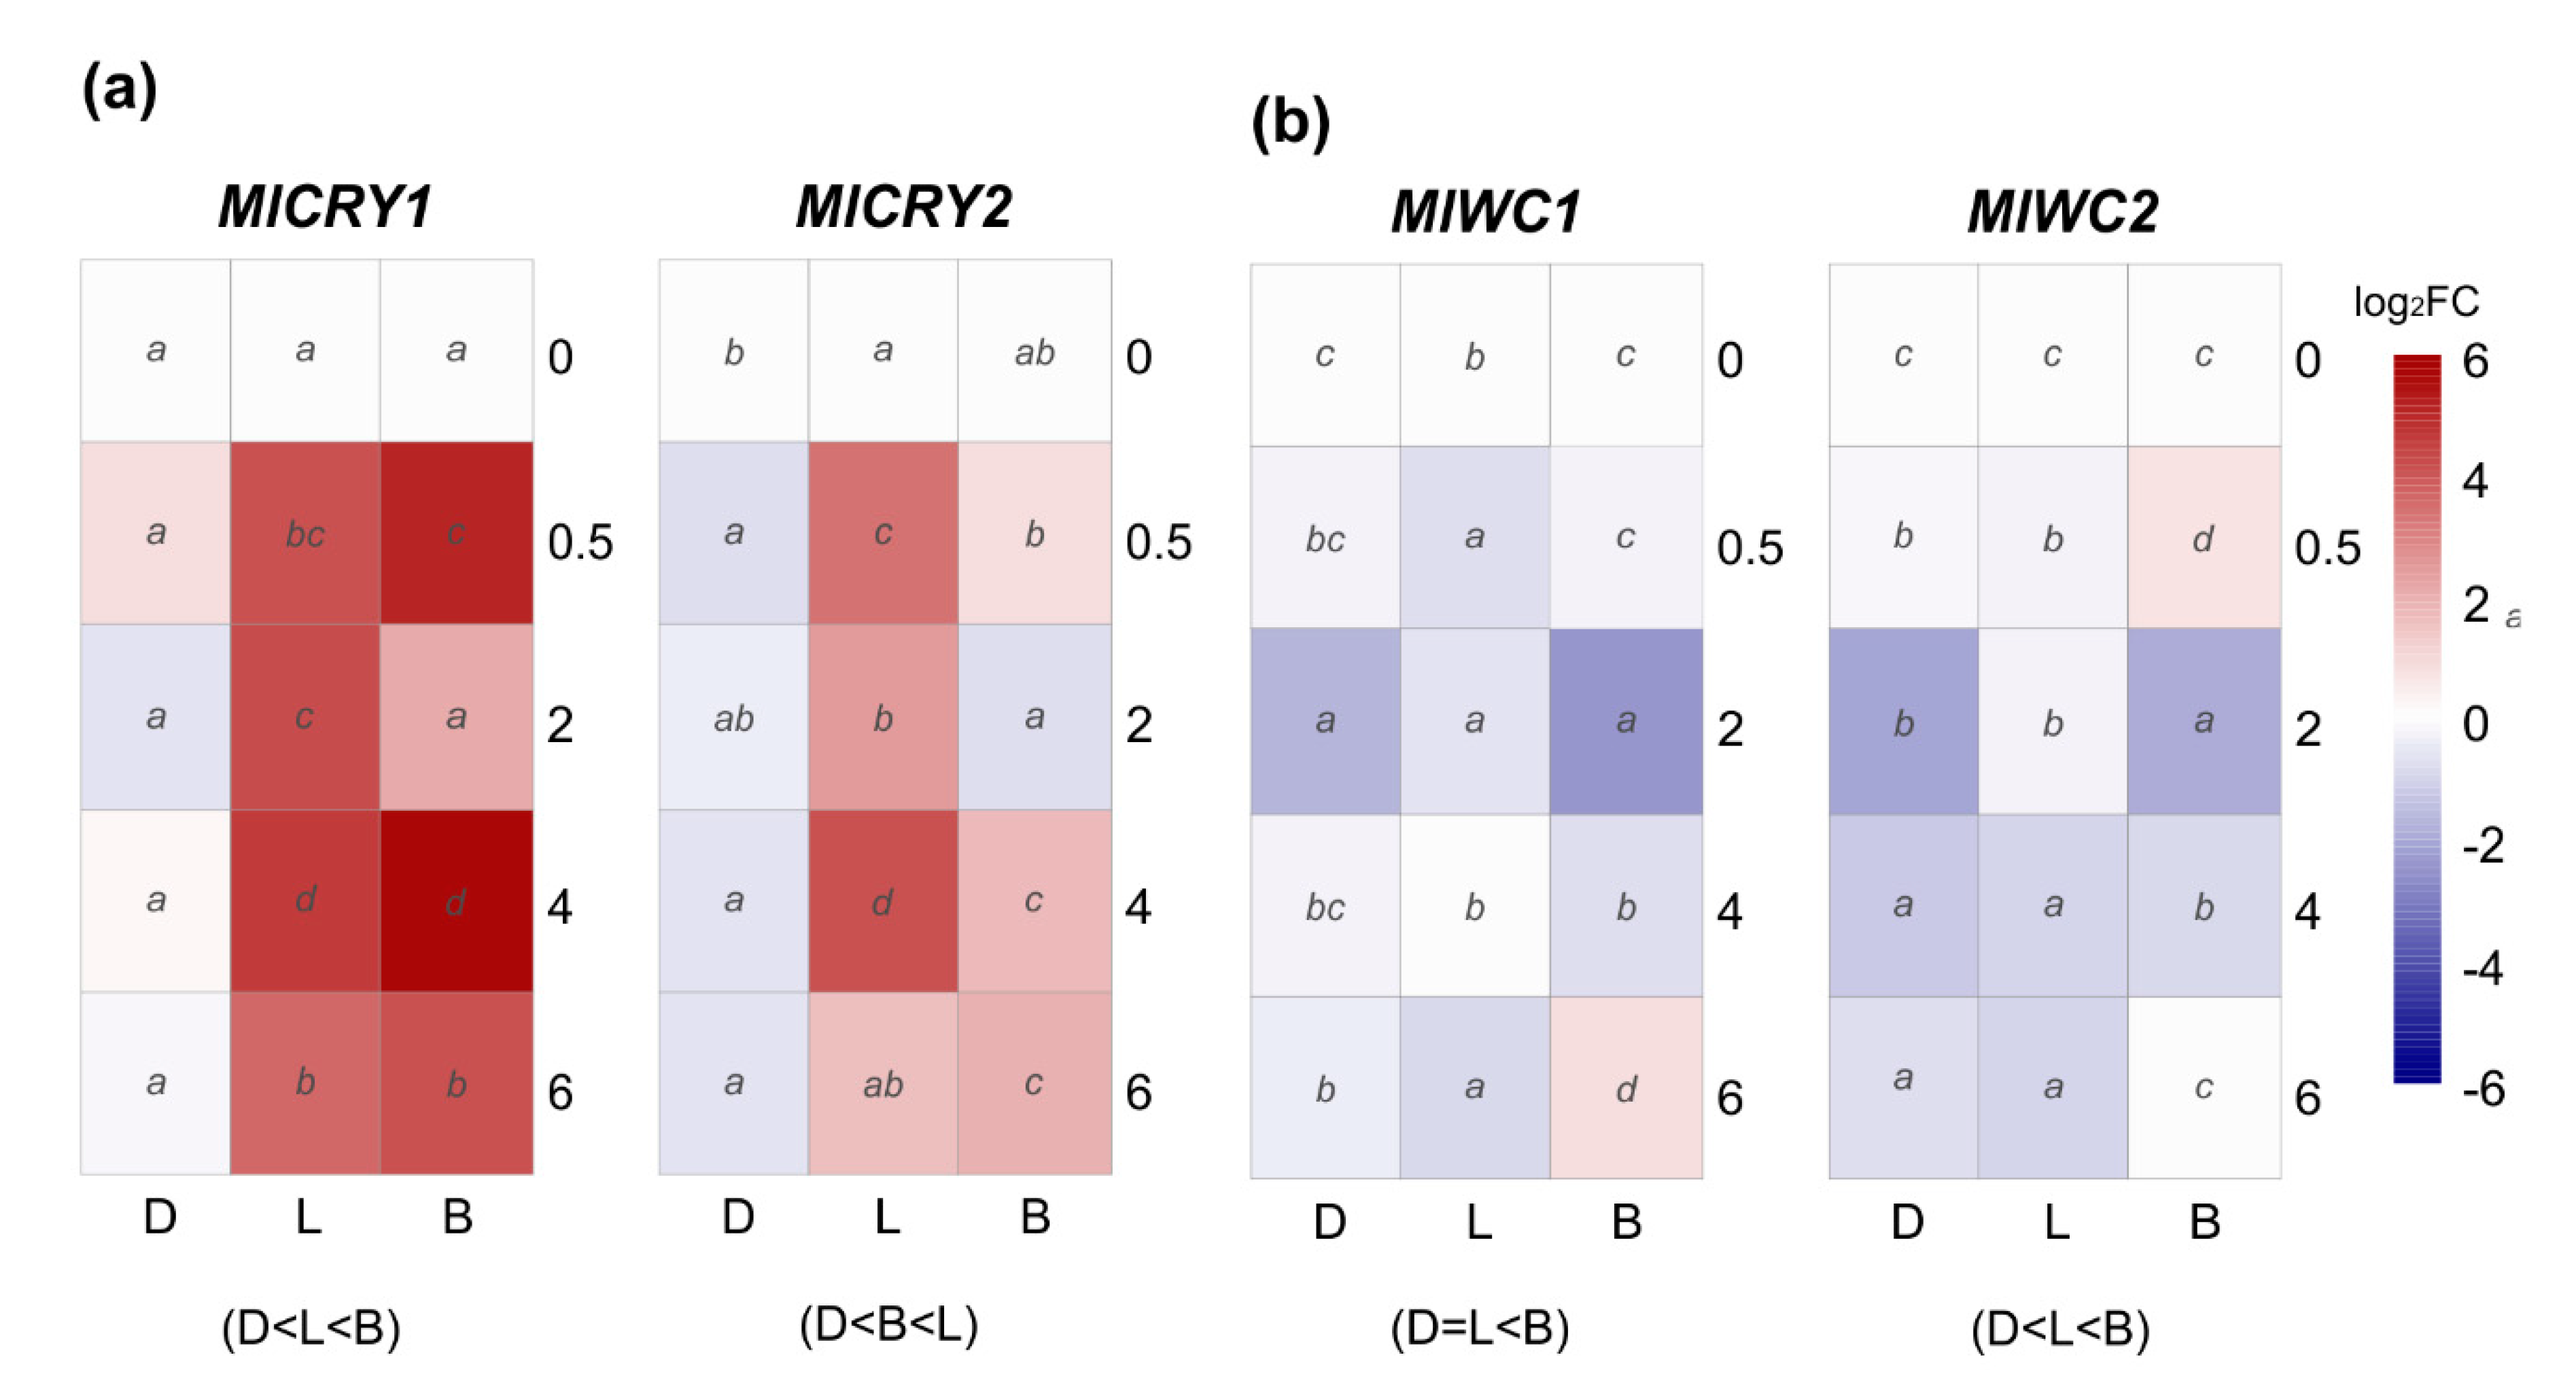
Perception of blue light can be carried out by two different groups of photoreceptors, white-collar and cryptochrome; the latter also senses in the UV range. Thus, we have analyzed the transcription patterns of two genes of each family under continuous darkness, daylight, and blue light. Cryptochromes, MlCRY1 and MlCRY2, were differentially expressed upon light induction, and the transcription of both genes remained downregulated in constant darkness (Figure 5a). In both genes, MlCRY1 and MlCRY2, daylight positively affected expression peaking at 4 h with 24.5–fold and 17.1–fold, respectively. However, blue light had a more significant effect than daylight in MlCRY1, which oscillates in time with immediate effect at 30 min (32.8–fold) and later at 4 h (52.4–fold) (Figure 5a).
On the other hand, we studied the white-collar encoding genes MlWC1 and MlWC2 as putative blue light photoreceptors. qRT-PCR results demonstrated a completely different pattern under day or blue light exposure than cryptochromes MlCRY1 and MlCRY2 (Figure 5b). Comparing the expression pattern among the three conditions revealed that only blue light triggered a significant upregulation of MlWC1 at a long exposure of 6 h and MlWC2 at a short time of 0.5 h. Likewise, both MlWC1 and MlWC2 were found significantly repressed in continuous darkness and daylight (Figure 5b).
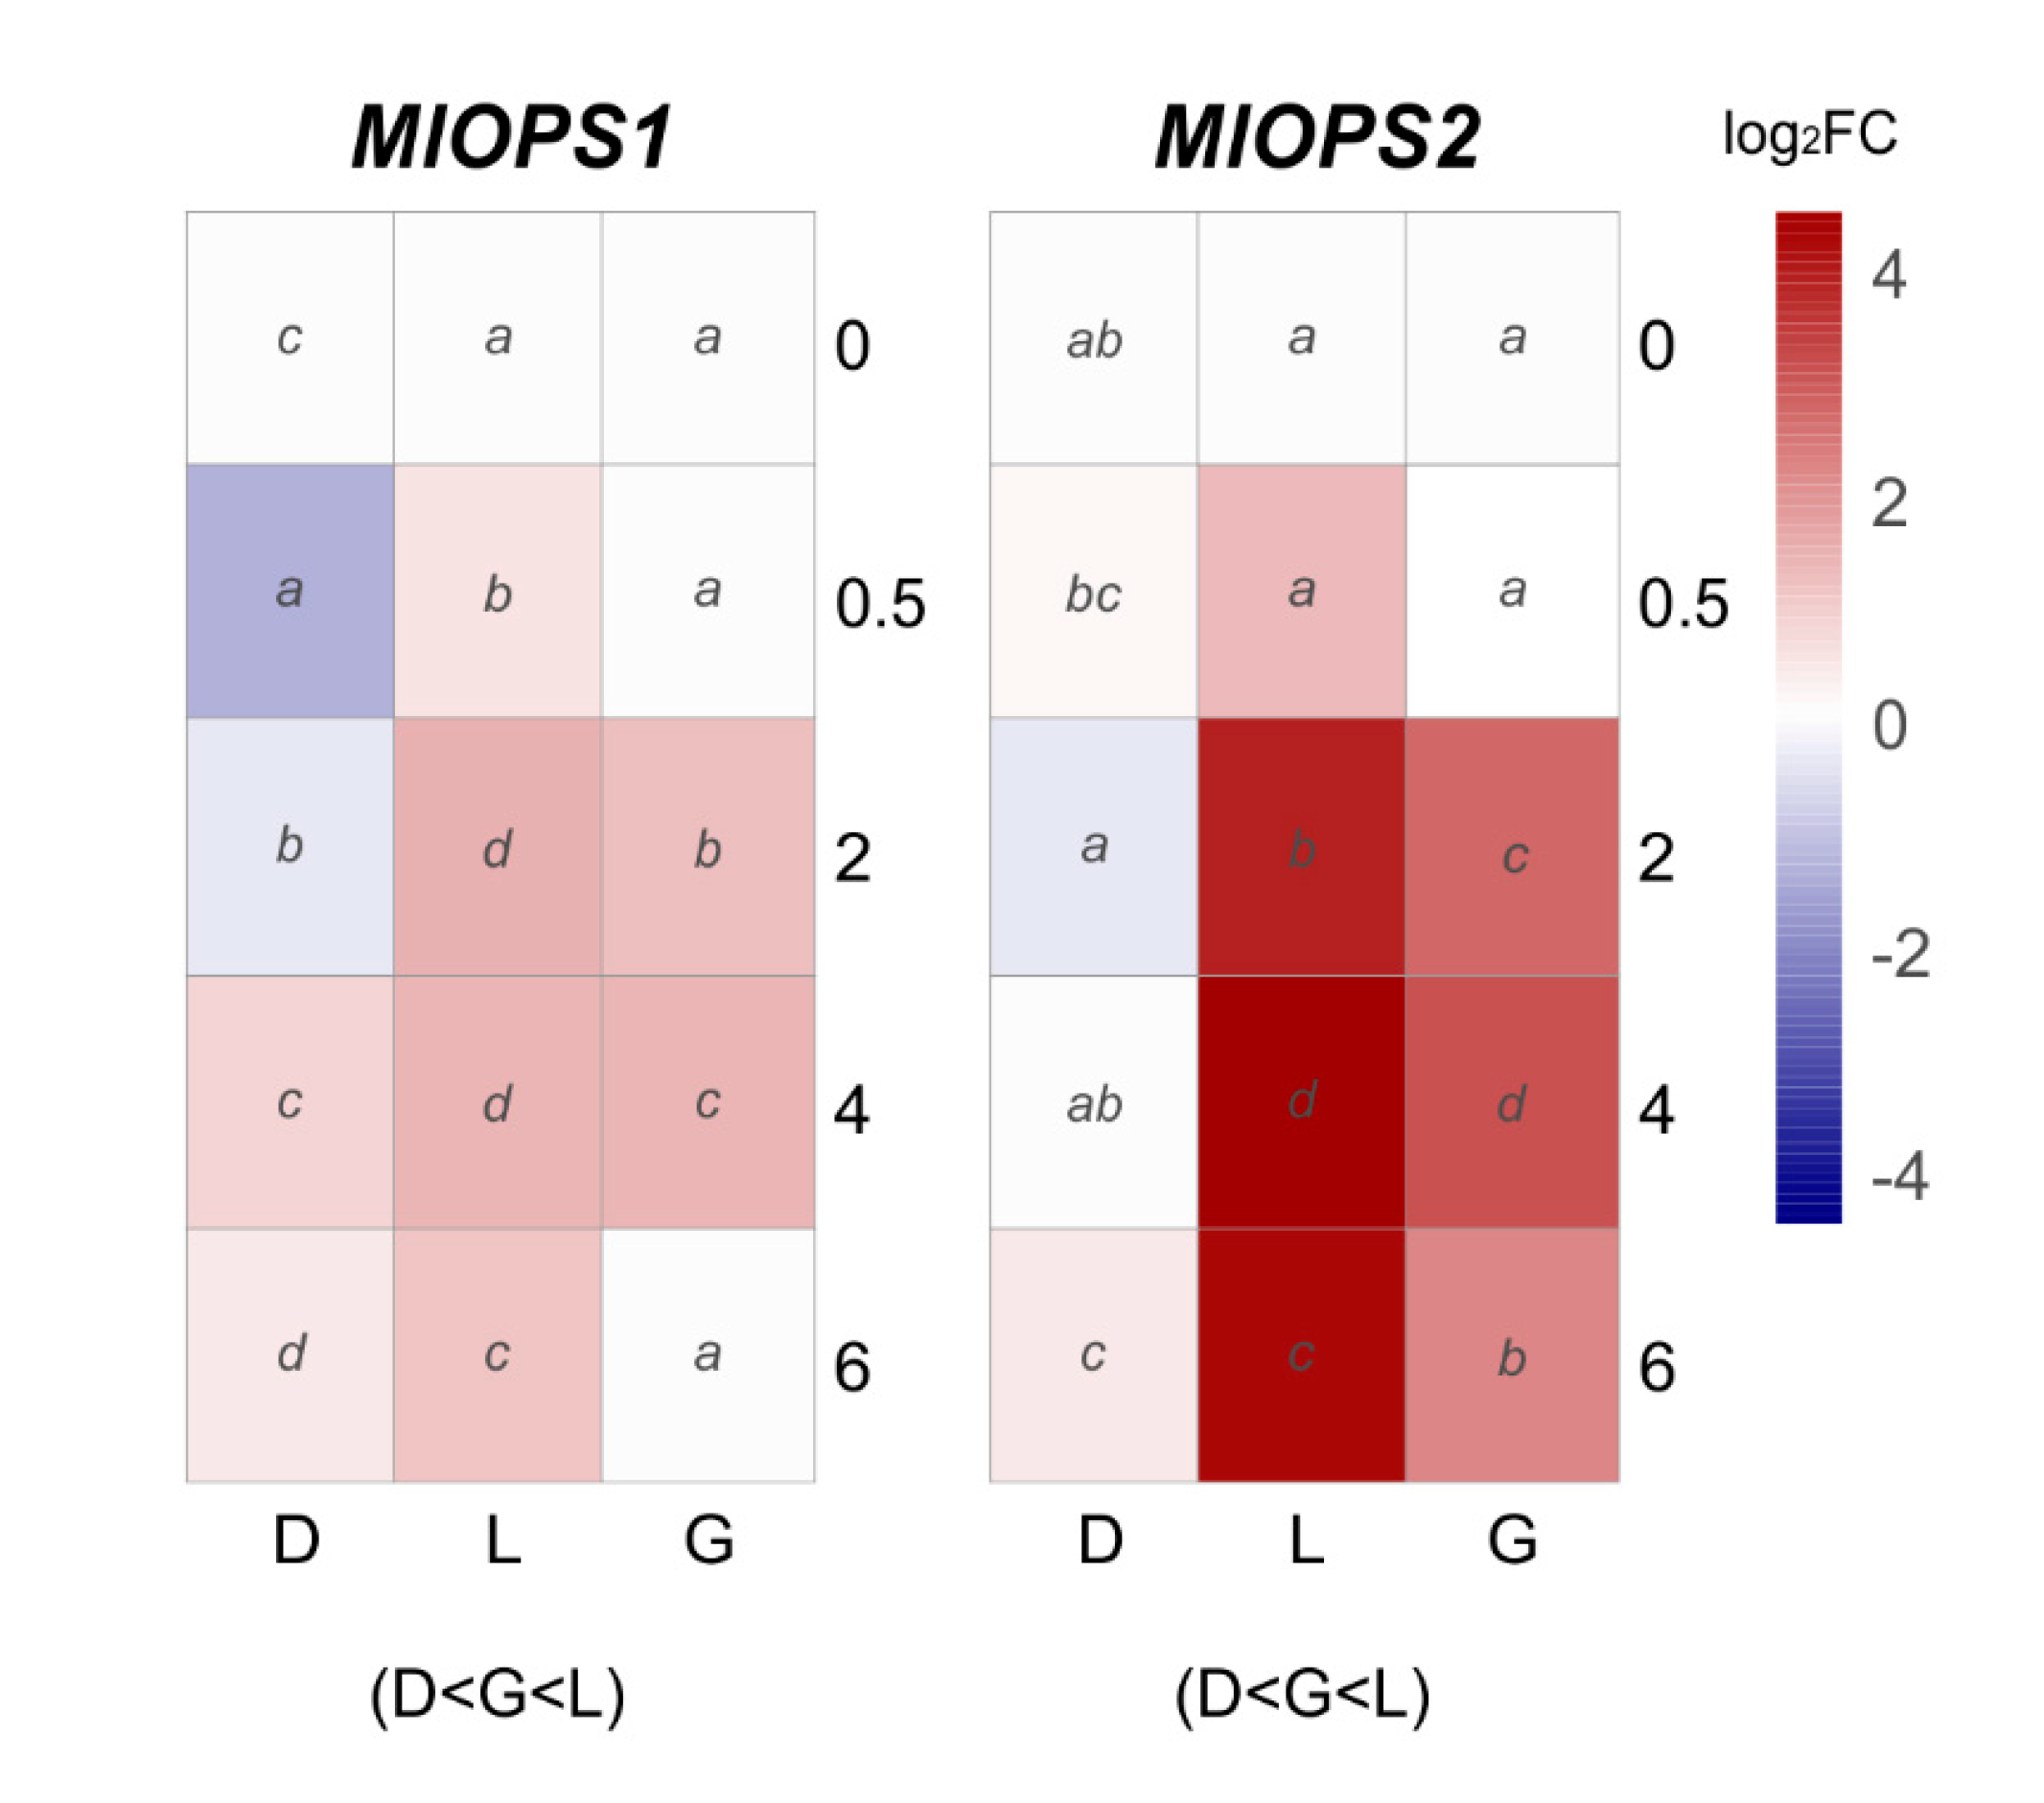
Regarding putative green light photoreceptors, two opsin encoding genes were analyzed: MlOPS1 and MlOPS2 (Figure 6). MlOPS1 under daylight exposure showed significant upregulation in the interval 0.5–6 h, while a short period of induction was observed under green light exposure (2–4 h). By contrast, MlOPS1 under continuous darkness showed a short-term downregulation (Figure 6). The expression levels of MlOPS2 gradually increased under green or daylight with significant upregulation after 2 h of exposure, peaked at 4 h in daylight (23–fold) and green light (8.5–fold), meanwhile remained almost at a basal level compared to control in constant darkness (Figure 6).
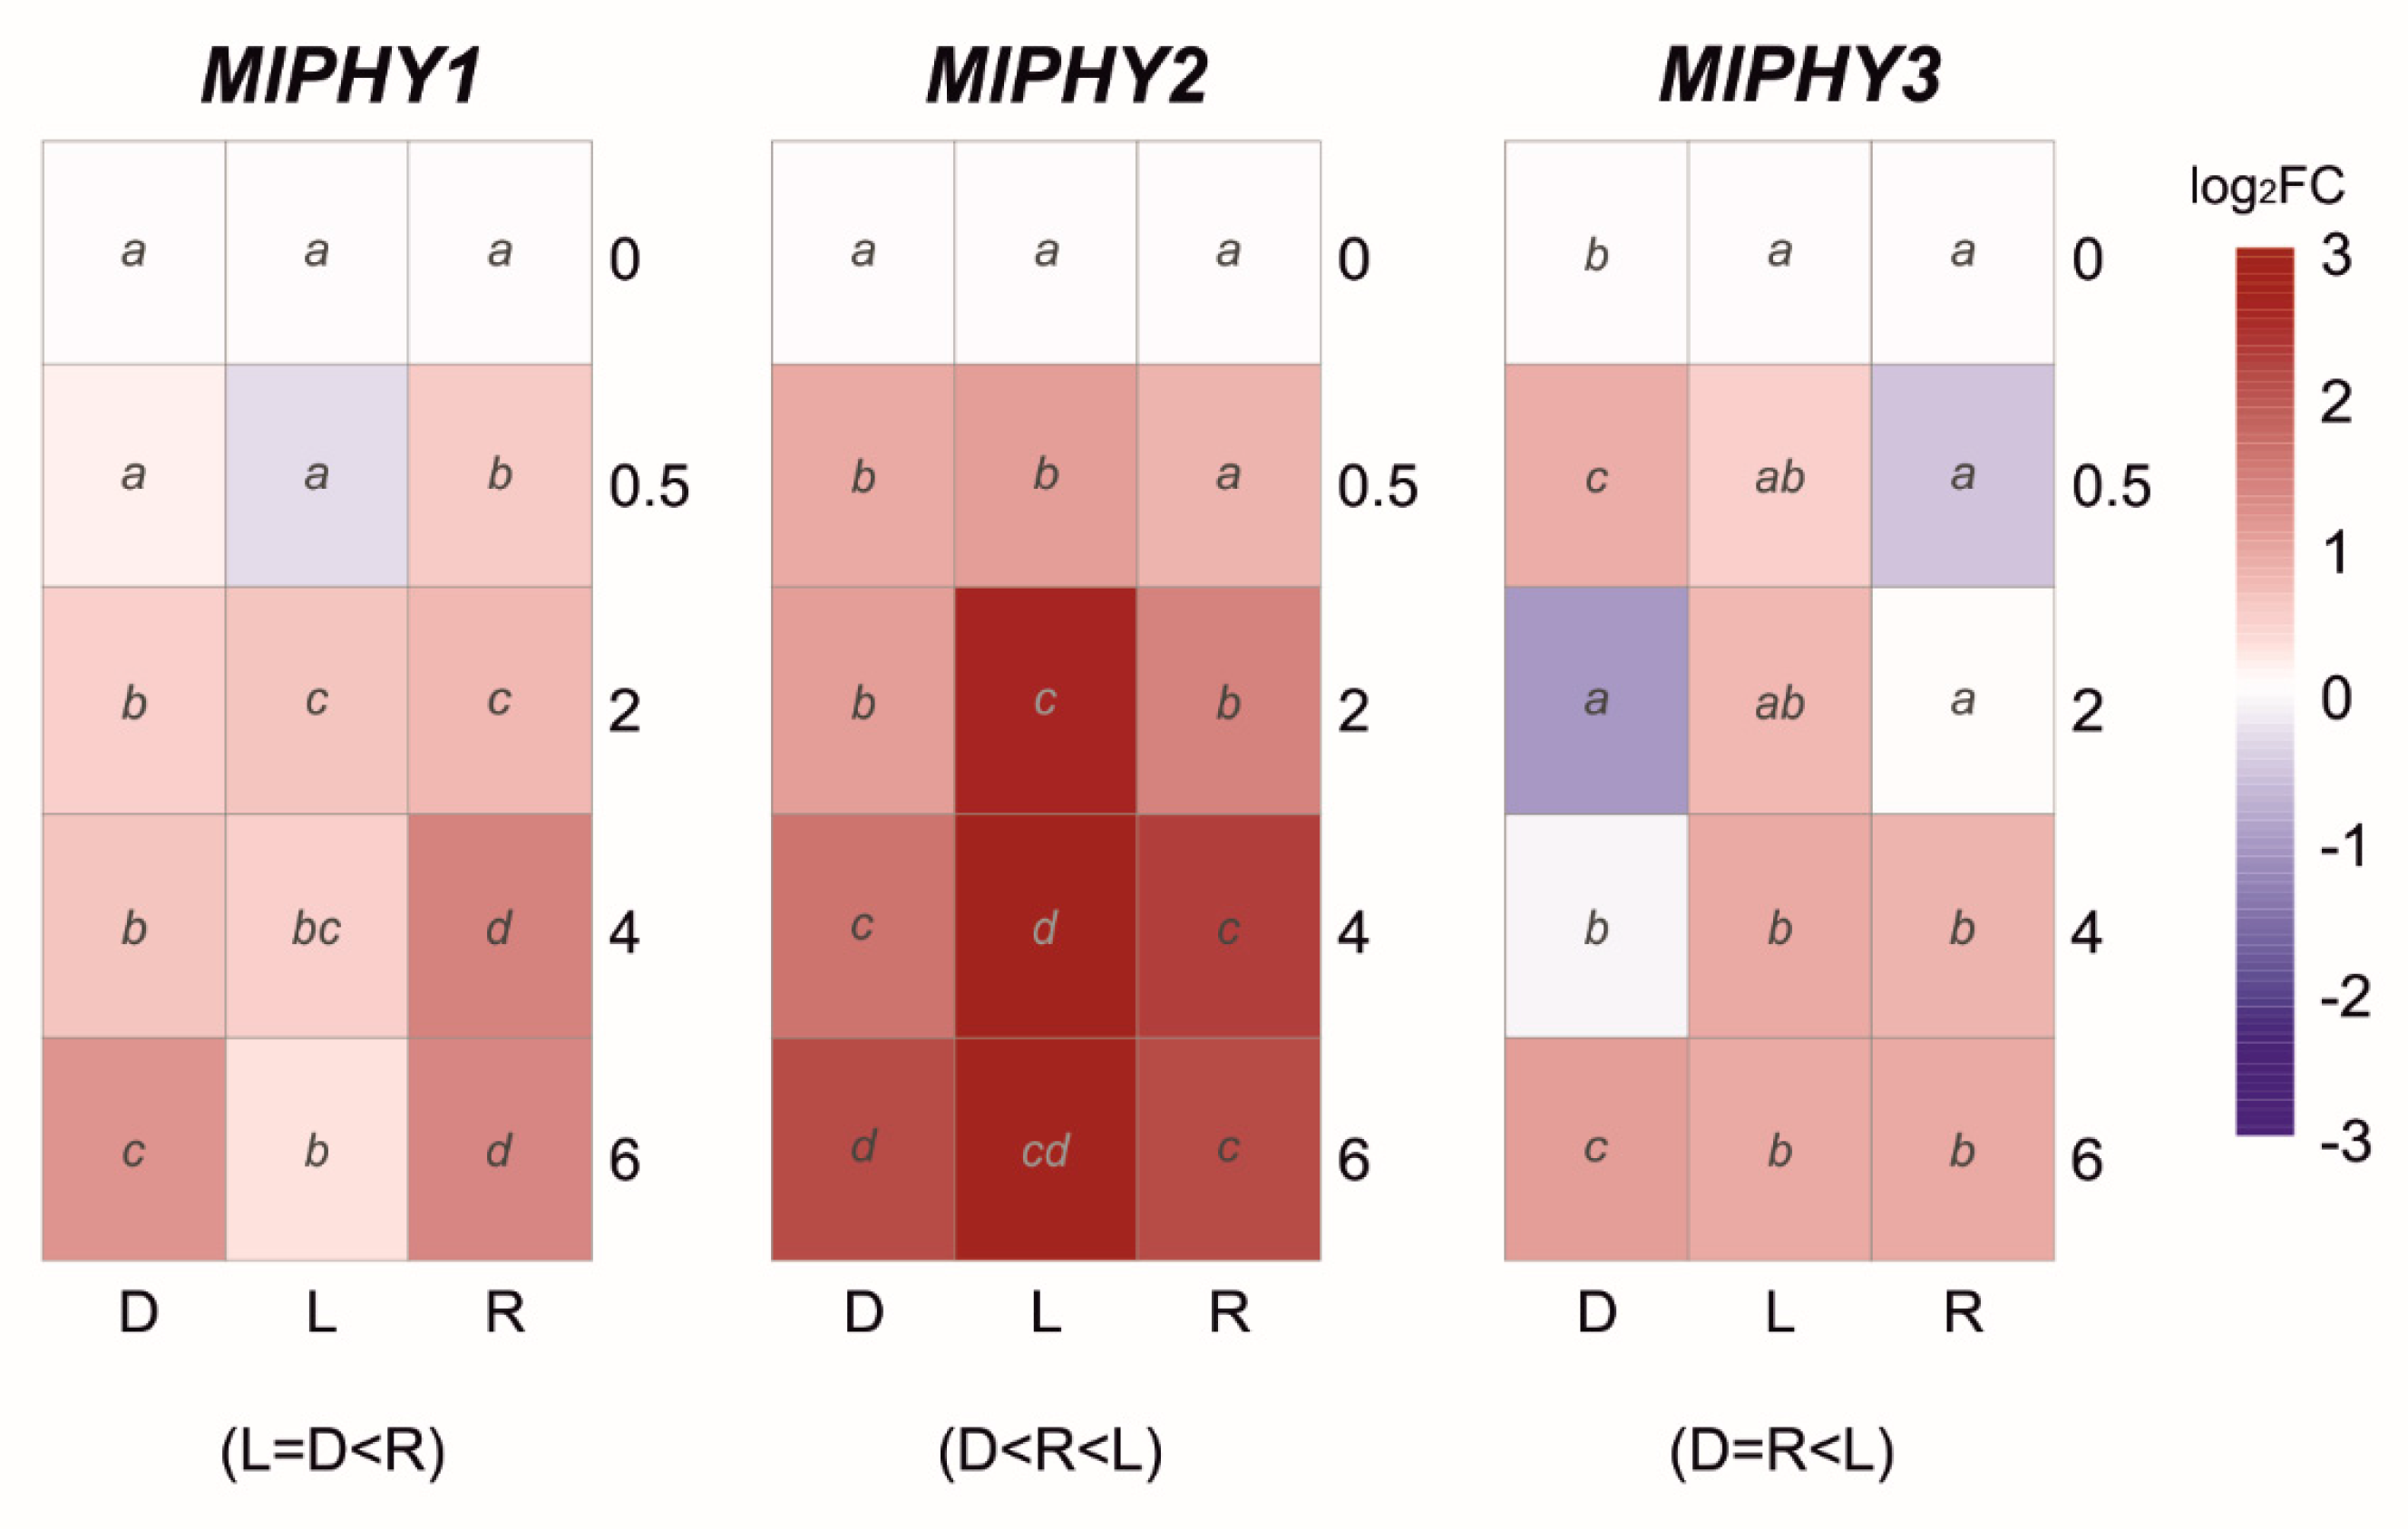
In the case of the red light photoreceptors, the phytochrome group showed different expression profiles for each member (Figure 7). The transcript levels of MlPHY1 and MlPHY2 showed a slight upregulation in continuous darkness. However, the red light triggered a significantly higher upregulation in MlPHY1 and daylight in MlPHY2. Finally, the expression profile of the last member of the group MlPHY3 was variable with up- and downregulation waves in continuous darkness. At the same time, red or daylight produced a slight late response (Figure 7).
4. Discussion
Monilinia laxa is an airborne plant pathogen subjected to different abiotic environmental factors, such as temperature, humidity, wind, and sunlight, that influence brown rot development. Multiple studies have described the importance of temperature and humidity factors for the successful infection in the field [4,37], its influence on the presence of latent infections [2], or even in postharvest fruit management [38,39]. However, few have taken into account the influence of light cycles, quantity, or quality of light in Monilinia spp. behavior [5,15,40]. Recently, it has been shown that M. laxa is a light-responsive fungal pathogen. Brown rot development is influenced by duration, intensity, and quality of light [16]. Here, we investigated whether M. laxa modifies growth and conidiation characteristics in response to different light conditions. In connection, M. laxa genome characterization also allowed us to depict potential light receptors and regulatory genes and their transcriptional patterns during light exposure.
The three M. laxa strains used in this work have been shown to be photoresponsive. Diverse effects in growth, conidiation, or morphology were observed when changing the photoperiod or light wavelengths. Asexual reproduction is a primary source of M. laxa dispersion in Spain [4]. Consequently, knowing the mechanisms mediating the induction of the conidiation process is of importance to understand the spread of brown rot. M. fructigena strains have the ability to sense and react to light, e.g., sporulation is more abundant in light–dark cycles than continuous darkness [40]. Therefore, it seems that diurnal patterns trigger conidiation in M. fructigena [5] and increases their concentration with greater light exposure in M. laxa [16]. The presence of a complete set of velvet genes in the genome of M. laxa 8L isolate and in other strains, corroborated by sequencing, predict a fully functional velvet-dependent light-sensing machinery in this fungus. “Blind” strains of closely related B. cinerea and A. nidulans displaying light-independent conidiation had been shown to carry a mutation in a velvet gene, BcVEL1 and veA, respectively [25,41]. Thus, future searches for blind strains in M. laxa envisage the identification of mutations in photoreceptor and light-dependent regulatory systems.
Environmental light condition is a source of information, including signals of space, time, or stress [18]. It is essential to distinguish and anticipate favorable conditions for fungal development [42]. Red light exposure caused the highest growth rate and low conidia production in all three M. laxa isolates, especially in the shorter photoperiod, as previously described in B. cinerea [13,43]. A significant increase in the brown rot incidence and severity on nectarines caused by M. laxa under red light compared to fruit incubated under white light has been identified. Furthermore, similar to the photoresponsive strains of B. cinerea [10], M. laxa showed deficient conidiation and a high vegetative growth rate under continuous darkness. Such repression in conidia production and mycelial growth promotion could be an adjustment of M. laxa’s behavior to signals of low or absence of light [16]. B. cinerea achieves its maximum virulence against Arabidopsis thaliana at dusk by regulating its circadian machinery [44,45] and when plant defenses against necrotrophic pathogens are lower [46,47]. Promotion of vegetative growth in the dark could also be interpreted as a reflection of the colonization inside the fruit, where no illumination is expected, and Monilinia spp. grows vegetatively and only sporulates on fruit surface [1].
In contrast, green and daylight enhanced both growth rate and conidiation in M. laxa, showing a higher production of conidia with more hours of exposure to light. The role of green light was less characterized in most fungi [30]; for example, in N. crassa, it promotes sexual reproduction [48]. As mentioned above, light is necessary for B. cinerea conidiation [10], but the exposure of this pathogen to green light has reversed effects to those described here for M. laxa, such as inhibiting germination, growth, and conidiation [14,43].
As we observed in M. laxa, the promotion of conidiation through the near-ultraviolet light is extended among fungi, for example, B. cinerea [13,49], Alternaria tomato [50], and Trichoderma viride [51], which could be a general reaction to the stress of damaging UV radiation [17,18]. Red and blue lights play an opposite effect during conidiation of A. alternata or B. cinerea as in other fungi [43,52]. In addition, blue light causes a negative phototropism in the germination of B. cinerea [53] and a delay in A. nidulans germination [54]. Here we showed a strong inhibitory effect of blue light on plate culture conditions, which was not recorded in M. laxa-nectarine infection process [16]; a possible unexplored explanation is that rugosity of fruit surface may contribute to protection to light. Thus, further studies should be done to confirm the possible inhibitory effect of blue light on M. laxa. A negative effect had been reported in brown rot development under cool white light that could be due to a combination of high irradiance with temperature [16,55].
The results presented herein demonstrated that M. laxa reacts to light–dark cycles and presents diverse behaviors to different light wavelengths, confirming and extending previous reports. Therefore, searches in M. laxa 8L genome [32] allowed the identification of velvet regulatory family and photoreceptors already described in the closely related B. cinerea [30], except for MlVEL4, which had to rely on other M. laxa genome for verification [33]. The domain architecture of all the predicted proteins based on the analysis of orthologous genes was expected to be functionally active as photoreceptors. To further investigate the role of the different photoreceptors and the velvet regulatory family, the mycelium samples of our model M. laxa 8L were exposed to daylight, different ranges of light wavelengths, and continuous darkness to analyze time-course transcriptional patterns of some of them.
Members of the velvet regulatory family are involved in light-dependent fungal differentiation and have an essential role in coordinating the development and secondary metabolism [27,56]. When analyzing the velvet transcription profile during the light interaction, a general downregulation of MlVEL1 was observed for both the continuous darkness and different light conditions. The role of the VEL1 in conidiation has been demonstrated, but its function is dependent on the formation of velvet complex with VEL2 and the secondary metabolism regulator LAEA in both B. cinerea and A. nidulans [11,57], suggesting that temporal synchronization of these three is necessary for their function. In this sense, the expression of MlVEL2 was triggered by exposure to blue, red, and daylight, but it also increased in both darkness and green light with time-course.
On the other hand, MlVEL3 and MlVEL4 showed higher transcriptional expression under daylight, blue, and specifically green light. Although the role of the latter two is less studied, the fungal development is affected since the absence of VEL3 in B. cinerea causes the production of both conidia and sclerotia in darkness [58]. It would be interesting to investigate the relationships between velvet-complex components and with phytochromes and white-collar proteins as described for B. cinerea and A. nidulans, among others [11,59]. In addition, the implications of velvet complex in the virulence process of M. laxa is important since it could regulate efficient production and secretion of CAZymes and peptidases and subsequently the degradation of host tissues, as shown before in Aspergillus flavus and B. cinerea, respectively [58,60]. In fact, both virulence-related fungal strategies, tissue acidification, and cell wall degrading enzyme secretion, have been previously described as important factors in Monilinia spp.-fruit interaction [61,62].
Blue light sensing is one of the most widespread light senses in filamentous fungi [20]. Since the description of white-collar (wc1) as the first related blue light-sensing gene in N. crassa [63], blue sensing has been studied in fungal biology [17,21]. No immediate light-triggered effect was observed on the transcripts of M. laxa white-collar genes. Similarly, both genes remained practically stable in B. cinerea regardless of light exposure or continuous darkness. However, the absence of one affects other photoreceptors, such as opsin and cryptochrome, suggesting regulation by white-collar [10]. In this sense, in N. crassa, a primary light effect has been described as the formation of a complex between the proteins derived from both genes, white collar 1 and 2, and subsequently activating the transcription of specific light-responsive genes through direct binding to their promoters [20]. Cryptochromes compose another blue-light-receptor group and are also connected with UV sensing [18,29]. Transcription of MlCRY1 and MlCRY2 of M. laxa has a strong light-dependence, being upregulated under day and blue lights but downregulated in continuous darkness. In agreement, both cryptochromes are induced by blue or white light in B. cinerea in a WC1 dependent way, although the role of CRY1 is not clear, and CRY2 is a negative regulator of conidiation [64].
Opsins are a widespread fungal photoreceptor related to green light-sensing composed of a retinal chromophore, although their functional role remains undetermined [65]. The expression of M. laxa opsins was triggered by daylight, especially MlOPS2, and slightly in green light. Daylight full light spectrum could have an additive effect in the opsins transcription; it has been described that they can also be activated by blue light [66], although the effect of blue light alone has not been studied here. On the contrary, N. crassa opsin1 (ops-1) is highly expressed in asexual cultures and is a late-stage conidiation gene, which is under light-independent control of white-collar 2 and related to the developmental stage [67]. Therefore, suggesting a more complex control than direct light activation.
Response to red light does not seem to be so generalized among the filamentous fungi; on the one hand, phytochrome FphA of A. nidulans acts as a potential red-light sensor and represses sexual development [68]. On the other hand, expression levels of both phytochromes encoded in the N. crassa genome are not light-dependent, showing no correlation with exposures to either red, far-red, or daylight exposure [69]. In our study, M. laxa MlPHY1 and MlPHY2 phytochromes were red and daylight upregulated, respectively, but light-dependent regulation of MlPHY3 was imprecise. Similar behavior has been described for BcPHY2 of B. cinerea, which was higher expressed under light exposure than BcPHY1 or BcPHY3 [30].
5. Conclusions
Taken together, our study provides a general approach to phenotype changes and molecular evidence of transcriptional responses to light in M. laxa. The overall picture was that light cycles promote conidiation, but vegetative growth promotion varied under different light conditions. Besides, light transcription patterns support the assumption of M. laxa as photoresponsive fungi. Clear responses to light triggered gene expression in MlVEL2, MlPHY2, MlOPS2, and MlCRY2, and color light was a positive induction in MlVEL3, MlVEL4, MlPHY1, and MlCRY1. The basis for the induction of conidiation or vegetative growth promotion is so far undescribed in M. laxa. Further exploration of the contribution of each gene and the transduction pathways involved would be interesting to understand how the adaptative responses take place in M. laxa, especially red light photoreceptors, which could be responsible for the increased incidence and severity caused by M. laxa on nectarines [16].
Supplementary Materials
The following are available online at https://0-www-mdpi-com.brum.beds.ac.uk/2309-608X/7/1/32/s1, Figure S1: Alignment of velvet4 gene from M. laxa isolates 5L, 8L, and 25L with velvet4 from B. cinerea B05.10 and M. laxa Mlax316 using Clustal W 1.81., Table S1: Quantitative real-time polymerase chain reaction (RT-qPCR) primer set for the analysis of genes implicated in photoresponses and potential photoreceptors of M. laxa and primer set for velvet4 sequencing.
Author Contributions
Conceptualization, E.A.E. and A.D.C.; methodology, S.R.-P. and N.R.; software, S.R.-P.; validation, S.R.-P.; formal analysis, S.R.-P.; investigation, E.A.E., S.R.-P., and A.D.C.; resources, A.D.C.; data curation, E.A.E. and A.D.C.; writing—original draft preparation, S.R.-P.; writing—review and editing, E.A.E. and A.D.C.; supervision, E.A.E., P.M., and A.D.C.; project administration, P.M. and A.D.C.; funding acquisition, P.M. and A.D.C. All authors have read and agreed to the published version of the manuscript. Please turn to the CRediT taxonomy for the term explanation. Authorship must be limited to those who have contributed substantially to the work reported.
Funding
This study was funded by grants AGL2014-55287-C2-1-R, RTI2018-094263-B-I00, and AGL2017-84389-C2-2-R from the Ministry of Science, Innovation and Universities (MCIU, Spain), Agencia Estatal de Investigación (AEI), and the Fondo Europeo de Desarrollo Regional (FEDER, EU). S. Rodríguez-Pires received a Ph.D. fellowship from the Ministry of Science, Innovation and Universities (Spain).
Data Availability Statement
The data presented in this study are available in this article and Supplementary Materials.
Acknowledgments
We thank R. Castillo for his technical support and M. López-Delacalle for her practical assistance with the heat maps.
Conflicts of Interest
The authors declare no conflict of interest.
References
- Byrde, R.J.W.; Willetts, H.J. The Brown Rot Fungi of Fruit: Their Biology and Control; Pergamon Press: London, UK, 1977. [Google Scholar]
- Gell, I.; de Cal, A.; Torres, R.; Usall, J.; Melgarejo, P. Conidial density of Monilinia spp. on peach fruit surfaces in relation to the incidences of latent infections and brown rot. Eur. J. Plant Pathol. 2009, 123, 415–424. [Google Scholar] [CrossRef]
- Villarino, M.; Melgarejo, P.; Usall, J.; Segarra, J.; Lamarca, N.; de Cal, A. Secondary inoculum dynamics of Monilinia spp. and relationship to the incidence of postharvest brown rot in peaches and the weather conditions during the growing season. Eur. J. Plant Pathol. 2012, 133, 585–598. [Google Scholar] [CrossRef]
- Villarino, M.; Melgarejo, P.; Usall, J.; Segarra, J.; de Cal, A. Primary inoculum sources of Monilinia spp. in Spanish peach orchards and their relative importance in brown rot. Plant Dis. 2010, 94, 1048–1054. [Google Scholar] [CrossRef] [PubMed] [Green Version]
- Bannon, F.; Gort, G.; van Leeuwen, G.; Holb, I.; Jeger, M. Diurnal patterns in dispersal of Monilinia fructigena conidia in an apple orchard in relation to weather factors. Agric. For. Meteorol. 2009, 149, 518–525. [Google Scholar] [CrossRef]
- Xu, X.-M.; Guerin, L.; Robinson, J.D. Effects of temperature and relative humidity on conidial germination and viability, colonization and sporulation of Monilinia fructigena. Plant Pathol. 2001, 50, 561–568. [Google Scholar] [CrossRef]
- Idnurm, A.; Crosson, S. The photobiology of microbial pathogenesis. PLoS Pathog. 2009, 5, 11–13. [Google Scholar] [CrossRef] [Green Version]
- Roden, L.C.; Ingle, R.A. Lights, rhythms, infection: The role of light and the circadian clock in determining the outcome of plant-pathogen interactions. Plant. Cell 2009, 21, 2546–2552. [Google Scholar] [CrossRef] [Green Version]
- Carvalho, S.D.; Castillo, J.A. Influence of light on plant–phyllosphere interaction. Front. Plant. Sci. 2018, 9, 1482. [Google Scholar] [CrossRef] [Green Version]
- Canessa, P.; Schumacher, J.; Hevia, M.A.; Tudzynski, P.; Larrondo, L.F. Assessing the effects of light on differentiation and virulence of the plant pathogen Botrytis cinerea: Characterization of the white collar complex. PLoS ONE 2013, 8, e84223. [Google Scholar] [CrossRef] [Green Version]
- Schumacher, J.; Simon, A.; Cohrs, K.C.; Traeger, S.; Porquier, A.; Dalmais, B.; Viaud, M.; Tudzynski, B. The VELVET complex in the gray mold fungus Botrytis cinerea: Impact of BcLAE1 on differentiation, secondary metabolism, and virulence. Mol. Plant Microbe Interact. 2015, 28, 659–674. [Google Scholar] [CrossRef] [Green Version]
- Lyu, X.; Shen, C.; Fu, Y.; Xie, J.; Jiang, D.; Li, G.; Cheng, J. The microbial opsin homolog sop1 is involved in Sclerotinia sclerotiorum development and environmental stress response. Front. Microbiol. 2016, 6. [Google Scholar] [CrossRef] [PubMed] [Green Version]
- Tan, K.K. Interaction of near-ultraviolet, blue, red, and far-red light in sporulation of Botrytis cinerea. Trans. Br. Mycol. Soc. 1975, 64, 215–222. [Google Scholar] [CrossRef]
- Zhu, P.; Zhang, C.; Xiao, H.; Wang, Y.; Toyoda, H.; Xu, L. Exploitable regulatory effects of light on growth and development of Botrytis cinerea. J. Plant Pathol. 2013, 95, 509–517. [Google Scholar] [CrossRef]
- De Cal, A.; Melgarejo, P. Effects of long-wave UV light on Monilinia growth and identification of species. Plant Dis. 1999, 83, 62–65. [Google Scholar] [CrossRef] [PubMed] [Green Version]
- Rodríguez-Pires, S.; Garcia-Companys, M.; Espeso, E.A.; Melgarejo, P.; de Cal, A. Influence of light on the Monilinia laxa–stone fruit interaction. Plant Pathol. 2020. [Google Scholar] [CrossRef]
- Fischer, R.; Aguirre, J.; Herrera-Estrella, A.; Corrochano, L.M. The complexity of fungal vision. In The Fungal Kingdom; ASM Press: Washington, DC, USA, 2017; pp. 441–461. [Google Scholar]
- Fuller, K.K.; Loros, J.J.; Dunlap, J.C. Fungal photobiology: Visible light as a signal for stress, space and time. Curr. Genet. 2015, 61, 275–288. [Google Scholar] [CrossRef] [Green Version]
- Rodriguez-Romero, J.; Hedtke, M.; Kastner, C.; Müller, S.; Fischer, R. Fungi, hidden in soil or up in the air: Light makes a difference. Annu. Rev. Microbiol. 2010, 64, 585–610. [Google Scholar] [CrossRef] [Green Version]
- Corrochano, L.M. Light in the fungal world: From photoreception to gene transcription and beyond. Annu. Rev. Genet. 2019, 53, 149–170. [Google Scholar] [CrossRef]
- Yu, Z.; Fischer, R. Light sensing and responses in fungi. Nat. Rev. Microbiol. 2019, 17, 25–36. [Google Scholar] [CrossRef] [PubMed]
- Bayram, Ö.; Braus, G.H.; Fischer, R.; Rodriguez-Romero, J. Spotlight on Aspergillus nidulans photosensory systems. Fungal Genet. Biol. 2010, 47, 900–908. [Google Scholar] [CrossRef] [PubMed]
- Chen, C.H.; Dunlap, J.C.; Loros, J.J. Neurospora illuminates fungal photoreception. Fungal Genet. Biol. 2010, 47, 922–929. [Google Scholar] [CrossRef] [PubMed] [Green Version]
- Dasgupta, A.; Fuller, K.K.; Dunlap, J.C.; Loros, J.J. Seeing the world differently: Variability in the photosensory mechanisms of two model fungi. Environ. Microbiol. 2016, 18, 5–20. [Google Scholar] [CrossRef] [PubMed] [Green Version]
- Mooney, J.L.; Yager, L.N. Light is required for conidiation in Aspergillus nidulans. Genes Dev. 1990, 4, 1473–1482. [Google Scholar] [CrossRef] [PubMed] [Green Version]
- Stinnett, S.M.; Espeso, E.A.; Cobeño, L.; Araújo-Bazán, L.; Calvo, A.M. Aspergillus nidulans VeA subcellular localization is dependent on the importin α carrier and on light. Mol. Microbiol. 2007, 63, 242–255. [Google Scholar] [CrossRef] [PubMed]
- Calvo, A.M. The VeA regulatory system and its role in morphological and chemical development in fungi. Fungal Genet. Biol. 2008, 45, 1053–1061. [Google Scholar] [CrossRef]
- Etxebeste, O.; Otamendi, A.; Garzia, A.; Espeso, E.A.; Cortese, M.S. Rewiring of transcriptional networks as a major event leading to the diversity of asexual multicellularity in fungi. Crit. Rev. Microbiol. 2019, 45, 548–563. [Google Scholar] [CrossRef] [PubMed]
- Idnurm, A.; Verma, S.; Corrochano, L.M. A glimpse into the basis of vision in the kingdom Mycota. Fungal Genet. Biol. 2010, 47, 881–892. [Google Scholar] [CrossRef] [Green Version]
- Schumacher, J. How light affects the life of Botrytis. Fungal Genet. Biol. 2017, 106, 26–41. [Google Scholar] [CrossRef]
- Angelini, R.M.d.M.; Abate, D.; Rotolo, C.; Gerin, D.; Pollastro, S.; Faretra, F. De novo assembly and comparative transcriptome analysis of Monilinia fructicola, Monilinia laxa and Monilinia fructigena, the causal agents of brown rot on stone fruits. BMC Genom. 2018, 19, 1–21. [Google Scholar] [CrossRef]
- Naranjo-Ortíz, M.A.; Rodríguez-Pires, S.; Torres, R.; de Cal, A.; Usall, J.; Gabaldón, T. Genome sequence of the brown rot fungal pathogen Monilinia laxa. Genome Announc. 2018, 6, 1–2. [Google Scholar] [CrossRef] [Green Version]
- Landi, L.; Pollastro, S.; Rotolo, C.; Romanazzi, G.; Faretra, F.; Angelini, R.M.d.M. Draft genomic resources for the brown rot fungal pathogen Monilinia laxa. Mol. Plant Microbe Interact. 2020, 33, 145–148. [Google Scholar] [CrossRef] [PubMed] [Green Version]
- Rodríguez-Pires, S.; Melgarejo, P.; de Cal, A.; Espeso, E.A. Pectin as carbon source for Monilinia laxa, exoproteome and expression profiles of related genes. Mol. Plant Microbe Interact. 2020. [Google Scholar] [CrossRef] [PubMed]
- Schmittgen, T.D.; Livak, K.J. Analyzing real-time PCR data by the comparative CT method. Nat. Protoc. 2008, 3, 1101–1108. [Google Scholar] [CrossRef] [PubMed]
- Snedecor, G.W.; Cochran, W.G. Statistical Methods, 7th ed.; Iowa State University Press: Ames, IA, USA, 1980. [Google Scholar]
- Biggs, A.R. Early and late-season susceptibility of peach fruits to Monilinia fructicola. Plant Dis. 1988, 72, 1070. [Google Scholar] [CrossRef]
- Casals, C.; Viñas, I.; Torres, R.; Griera, C.; Usall, J. Effect of temperature and water activity on in vitro germination of Monilinia spp. J. Appl. Microbiol. 2010, 108, 47–54. [Google Scholar] [CrossRef]
- Bernat, M.; Segarra, J.; Navas-Cortés, J.A.; Casals, C.; Torres, R.; Teixidó, N.; Usall, J. Influence of temperature and humidity on the survival of Monilinia fructicola conidia on stone fruits and inert surfaces. Ann. Appl. Biol. 2018, 173, 63–70. [Google Scholar] [CrossRef]
- Van Leeuwen, G.; van Kesteren, H.A. Delineation of the three brown rot fungi of fruit crops (Monilinia spp.) on the basis of quantitative characteristics. Can. J. Bot. 1998, 76, 2042–2050. [Google Scholar] [CrossRef]
- Schumacher, J.; Pradier, J.M.; Simon, A.; Traeger, S.; Moraga, J.; Collado, I.G.; Viaud, M.; Tudzynski, B. Natural variation in the VELVET gene bcvel1 affects virulence and light-dependent differentiation in Botrytis cinerea. PLoS ONE 2012, 7, e47840. [Google Scholar] [CrossRef] [Green Version]
- Tisch, D.; Schmoll, M. Light regulation of metabolic pathways in fungi. Appl. Microbiol. Biotechnol. 2010, 85, 1259–1277. [Google Scholar] [CrossRef] [Green Version]
- Tan, K.K.; Epton, H.A.S. Effect of light on the growth and sporulation of Botrytis cinerea. Trans. Br. Mycol. Soc. 1973, 61, 145–157. [Google Scholar] [CrossRef]
- Hevia, M.A.; Canessa, P.; Müller-Esparza, H.; Larrondo, L.F. A circadian oscillator in the fungus Botrytis cinerea regulates virulence when infecting Arabidopsis thaliana. Proc. Natl. Acad. Sci. USA 2015, 112, 8744–8749. [Google Scholar] [CrossRef] [Green Version]
- Hevia, M.A.; Canessa, P.; Larrondo, L.F. Circadian clocks and the regulation of virulence in fungi: Getting up to speed. Semin. Cell Dev. Biol. 2016, 57, 147–155. [Google Scholar] [CrossRef] [PubMed]
- Goodspeed, D.; Chehab, E.W.; Min-Venditti, A.; Braam, J.; Covington, M.F. Arabidopsis synchronizes jasmonate-mediated defense with insect circadian behavior. Proc. Natl. Acad. Sci. USA 2012, 109, 4674–4677. [Google Scholar] [CrossRef] [PubMed] [Green Version]
- Shin, J.; Heidrich, K.; Sanchez-Villarreal, A.; Parker, J.E.; Davis, S.J. TIME FOR COFFEE represses accumulation of the MYC2 transcription factor to provide time-of-day regulation of jasmonate signaling in Arabidopsis. Plant. Cell 2012, 24, 2470–2482. [Google Scholar] [CrossRef] [PubMed] [Green Version]
- Wang, Z.; Wang, J.; Li, N.; Li, J.; Trail, F.; Dunlap, J.C.; Townsend, J.P. Light sensing by opsins and fungal ecology: NOP-1 modulates entry into sexual reproduction in response to environmental cues. Mol. Ecol. 2018, 27, 216–232. [Google Scholar] [CrossRef]
- Tan, K.R.; Epton, H.A.S. Ultraviolet-absorbing compounds associated with sporulation in Botrytis cinerea. Trans. Br. Mycol. Soc. 1974, 63, 157–167. [Google Scholar] [CrossRef]
- Kumagai, T. Temperature and mycochrome system in near-UV light inducible and blue light reversible photoinduction of conidiation in Alternaria tomato. Photochem. Photobiol. 1989, 50, 793–798. [Google Scholar] [CrossRef]
- Betina, V. Photoinduced conidiation in Trichoderma viride. Folia Microbiol. 1995, 40, 219–224. [Google Scholar] [CrossRef]
- Igbalajobi, O.; Yu, Z.; Fischer, R. Red-and blue-light sensing in the plant pathogen Alternaria alternata depends on phytochrome and the white-collar protein LreA. mBio 2019, 10. [Google Scholar] [CrossRef] [Green Version]
- Islam, S.Z.; Honda, Y.; Sonhaji, M. Phototropism of conidial germ tubes of Botrytis cinerea and its implication in plant infection processes. Plant Dis. 1998, 82, 850–856. [Google Scholar] [CrossRef] [Green Version]
- Röhrig, J.; Kastner, C.; Fischer, R. Light inhibits spore germination through phytochrome in Aspergillus nidulans. Curr. Genet. 2013, 59, 55–62. [Google Scholar] [CrossRef] [PubMed]
- Marquenie, D.; Lammertyn, J.; Geeraerd, A.H.; Soontjens, C.; van Impe, J.F.; Nicola, B.M.; Michiels, C.W. Inactivation of conidia of Botrytis cinerea and Monilinia fructigena using UV-C and heat treatment. Int. J. Food Microbiol. 2002, 74, 27–35. [Google Scholar] [CrossRef]
- Bayram, Ö.; Braus, G.H. Coordination of secondary metabolism and development in fungi: The velvet family of regulatory proteins. FEMS Microbiol. Rev. 2012, 36, 1–24. [Google Scholar] [CrossRef] [PubMed] [Green Version]
- Bayram, Ö.; Krappmann, S.; Ni, M.; Jin, W.B.; Helmstaedt, K.; Valerius, O.; Braus-Stromeyer, S.; Kwon, N.J.; Keller, N.P.; Yu, J.H.; et al. VelB/VeA/LaeA complex coordinates light signal with fungal development and secondary metabolism. Science 2008, 320, 1504–1506. [Google Scholar] [CrossRef] [PubMed]
- Müller, N.; Leroch, M.; Schumacher, J.; Zimmer, D.; Könnel, A.; Klug, K.; Leisen, T.; Scheuring, D.; Sommer, F.; Mühlhaus, T.; et al. Investigations on VELVET regulatory mutants confirm the role of host tissue acidification and secretion of proteins in the pathogenesis of Botrytis cinerea. New Phytol. 2018, 219, 1062–1074. [Google Scholar] [CrossRef] [Green Version]
- Purschwitz, J.; Müller, S.; Kastner, C.; Schöser, M.; Haas, H.; Espeso, E.A.; Atoui, A.; Calvo, A.M.; Fischer, R. Functional and physical interaction of blue- and red-light sensors in Aspergillus nidulans. Curr. Biol. 2008, 18, 255–259. [Google Scholar] [CrossRef] [Green Version]
- Duran, R.M.; Gregersen, S.; Smith, T.D.; Bhetariya, P.J.; Cary, J.W.; Harris-Coward, P.Y.; Mattison, C.P.; Grimm, C.; Calvo, A.M. The role of Aspergillus flavus veA in the production of extracellular proteins during growth on starch substrates. Appl. Microbiol. Biotechnol. 2014, 98, 5081–5094. [Google Scholar] [CrossRef]
- De Cal, A.; Sandín-España, P.; Martinez, F.; Egüen, B.; Chien-Ming, C.; Lee, M.H.; Melgarejo, P.; Prusky, D. Role of gluconic acid and pH modulation in virulence of Monilinia fructicola on peach fruit. Postharvest Biol. Technol. 2013, 86, 418–423. [Google Scholar] [CrossRef]
- Rodríguez-Pires, S.; Melgarejo, P.; de Cal, A.; Espeso, E.A. Proteomic studies to understand the mechanisms of peach tissue degradation by Monilinia laxa. Front. Plant. Sci. 2020, 11. [Google Scholar] [CrossRef]
- Ballario, P.; Vittorioso, P.; Magrelli, A.; Talora, C.; Cabibbo, A.; Macino, G. White collar-1, a central regulator of blue light responses in Neurospora, is a zinc finger protein. EMBO J. 1996, 15, 1650–1657. [Google Scholar] [CrossRef]
- Cohrs, K.C.; Schumacher, J. The two cryptochrome/photolyase family proteins fulfill distinct roles in DNA photorepair and regulation of conidiation in the gray mold fungus Botrytis cinerea. Appl. Environ. Microbiol. 2017, 83. [Google Scholar] [CrossRef] [PubMed] [Green Version]
- Corrochano, L.M. Fungal photoreceptors: Sensory molecules for fungal development and behaviour. Photochem. Photobiol. Sci. 2007, 6, 725–736. [Google Scholar] [CrossRef] [PubMed]
- Panzer, S.; Brych, A.; Batschauer, A.; Terpitz, U. Opsin 1 and opsin 2 of the corn smut fungus Ustilago maydis are green light-driven proton pumps. Front. Microbiol. 2019, 10, 735. [Google Scholar] [CrossRef] [PubMed]
- Bieszke, J.A.; Li, L.; Borkovich, K.A. The fungal opsin gene nop-1 is negatively-regulated by a component of the blue light sensing pathway and influences conidiation-specific gene expression in Neurospora crassa. Curr. Genet. 2007, 52, 149–157. [Google Scholar] [CrossRef]
- Blumenstein, A.; Vienken, K.; Tasler, R.; Purschwitz, J.; Veith, D.; Frankenberg-Dinkel, N.; Fischer, R. The Aspergillus nidulans phytochrome FphA represses sexual development in red light. Curr. Biol. 2005, 15, 1833–1838. [Google Scholar] [CrossRef]
- Froehlich, A.C.; Noh, B.; Vierstra, R.D.; Loros, J.; Dunlap, J.C. Genetic and molecular analysis of phytochromes from the filamentous fungus Neurospora crassa. Eukaryot. Cell 2005, 4, 2140–2152. [Google Scholar] [CrossRef] [Green Version]
Figure 1.
Effect of different light conditions on Monilinia laxa growth rate (mm day−1) (a–c) and sporulation (conidia cm−2 105) (d–f) on PDA-T plates inoculated with three M. laxa isolates: 5L (a,d), 8L (b,e), and 25L (c,f). All plates were incubated for 7 days under two white lights (daylight and cool) and black, blue, green, and red lights for photoperiods of 16 h light/8 h darkness (orange) and 8 h light/16 h darkness (yellow). As indicated in materials and methods, the continuous dark condition was subjected to both photoperiods. Data represent the average of two independent experiments, and letters denote significant differences according to the analysis of variance (ANOVA) to Duncan’s multiple range test.

Figure 2.
Effect of different light conditions on Monilinia laxa colony growth (top and reverse view) on PDA-T plates inoculated with 5L, 8L, and 25L M. laxa isolates after 7 days under continuous darkness and illuminated with daylight, black, green, and red lights for 16 h light/8 h darkness.
Figure 2.
Effect of different light conditions on Monilinia laxa colony growth (top and reverse view) on PDA-T plates inoculated with 5L, 8L, and 25L M. laxa isolates after 7 days under continuous darkness and illuminated with daylight, black, green, and red lights for 16 h light/8 h darkness.

Figure 3.
Domain architecture of potential photoreceptors (top) and velvet family (bottom) proteins in M. laxa. PAS (Per/Arnt/SIM, PF08446); GAF (cGMP-specific phosphodiesterase, PF01590); PHY (phytochrome-specific domain, PF00360); HisK (histidine kinase, PF00512), ATPase domain; RRD (response regulator domain, PF00072); rhodopsin domain (PF01036); LOV (light–oxygen–voltage); Zn (Zing finger domain, PF00320); PHR (Photolyase homology region, PF08005); FAD-binding domain (PF03441); and velvet domain (PF11754).

Figure 4.
The heat maps represent changes in the relative gene expression of four velvet (VEL) coding genes under continuous darkness (D), daylight (L), blue (B), green (G), or red (R) light at different time points. The scale is log2 of fold change mean values after normalization against 0 h post illumination using the 2−ΔΔCT method. Red color represents a higher relative expression than 0 h post illumination, and blue color represents a lower relative expression. Data were analyzed between light sources containing all times (shown at the bottom between brackets), and by light source between times (letters) by analysis of variance; the mean values with the same letter are not significantly different (p ≤ 0.05) according to Duncan’s multiple range test.

Figure 5.
The heat maps represent changes in the relative gene expression of (a) two cryptochromes (CRY) and (b) two white-collar (WC) coding genes under continuous darkness (D), daylight (L), or blue (B) light at different time points. The scale is log2 of fold change mean values after normalization against 0 h post illumination using the 2−ΔΔCT method. Red color represents a higher relative expression than 0 h post illumination, and blue color represents a lower relative expression. Data were analyzed between light sources containing all times (shown at the bottom between brackets), and by light source between times (letters) by analysis of variance; the mean values with the same letter are not significantly different (p ≤ 0.05) according to Duncan’s multiple range tests.

Figure 6.
The heat maps represent changes in the relative gene expression of two opsins (OPS) coding genes under continuous darkness (D), daylight (L), or green (G) light at different time points. The scale is log2 of fold change mean values after normalization against 0 h post illumination using the 2−ΔΔCT method. Red color represents a higher relative expression than 0 h post illumination, and blue color represents a lower relative expression. Data were analyzed between light sources containing all times (shown at the bottom between brackets), and by light source between times (letters) by analysis of variance; the mean values with the same letter are not significantly different p ≤ 0.05) according to Duncan’s multiple range test.

Figure 7.
The heat maps represent changes in the relative gene expression of three phytochromes (PHY) coding genes under continuous darkness (D), daylight (L), or red (R) light at different time points. The scale is log2 of fold change mean values after normalization against 0 h post illumination using the 2−ΔΔCT method. Red color represents a higher relative expression than 0 h post illumination, and blue color represents a lower relative expression. Data were analyzed between light sources containing all times (shown at the bottom between brackets), and by light source between times (letters) by analysis of variance; the mean values with the same letter are not significantly different (p ≤ 0.05) according to Duncan’s multiple range test.


Table 1.
Proteins implicated in photoresponses and potential photoreceptors of Monilinia laxa 8L.
| Gene Name | Gene/Protein ID a | GenBank Accession | Putative Protein Function b | Predicted Protein Length c | B. cinerea B05.10 d | % Identity | % Coverage | M. laxa Mlax316 e | % Identity | % Coverage |
|---|---|---|---|---|---|---|---|---|---|---|
| Putative near-UV/blue light sensors | ||||||||||
| MlCRY1 | Monilinia__090370 | BK014380 | putative deoxyribodipyrimidine photo-lyase | 679 | Bcin05g08060 | 77.80 | 90.27 | EYC80_003544 | 99.68 | 100 |
| MlCRY2 | Monilinia__028340 | BK014381 | DASH family cryptochrome protein | 649 | Bcin09g01620 | 86.59 | 95.13 | EYC80_007030 | 99.82 | 91.84 |
| Blue light sensing | ||||||||||
| MlWC1 | Monilinia__016540 | BK014382 | putative white collar-1 protein | 1094 | Bcin02g07400 | 69.52 | 93.61 | EYC80_007313 | 99.50 | 100 * |
| MlWC2 | Monilinia__092390 | BK014383 | putative white collar-2 protein | 483 | Bcin05g05530 | 72.94 | 91.36 | EYC80_003689 | 100 | 100 |
| MlVVD1 | Monilinia__019850 | BK014384 | vivid PAS VVD protein | 237 | Bcin13g01270 | 83.10 | 96.98 | EYC80_009309 | 100 | 100 |
| MlLOV3 | Monilinia__014120 | BK014393 | similar to Bclov3 | 836 | Bcin10g03870 | 78.98 | 96.50 | EYC80_002606 | 99.88 | 100 |
| MlLOV4 | Monilinia__012050 | BK014394 | regulator of G protein | 588 | Bcin02g04390 | 79.93 | 98.65 | EYC80_003150 | 100 | 100 |
| Green light sensing | ||||||||||
| MlOPS1 | Monilinia__070650 | BK014385 | putative opsin-1 protein | 310 | Bcin02g02670 | 85.26 | 99.36 | EYC80_005142 | 100 | 100 |
| MlOPS2 | Monilinia__055890 | BK014386 | putative opsin-like protein | 327 | Bcin01g04540 | 79.35 | 96.45 | EYC80_010258 | 100 | 100 |
| Red light sensing | ||||||||||
| MlPHY1 | Monilinia__010410 | BK014390 | PHY1, histidine kinase-group VIII protein | 1616 | Bcin13g04690 | 79.18 | 98.71 | EYC80_009624 | 99.94 | 100 |
| MlPHY2 | Monilinia__052440 | BK014391 | PHY2, histidine kinase-group VIII protein | 1222 | Bcin01g09230 | 75.24 | 99.51 | EYC80_005619 | 96.97 | 100 |
| MlPHY3 | Monilinia__088010 | BK014392 | PHY3, histidine kinase-group VIII protein | 1196 | Bcin06g01290 | 79.24 | 98.84 | EYC80_000954 | 98.16 | 96.46 |
| Proteins implicated in photoresponses | ||||||||||
| MlVEL1 | Monilinia__005480 | BK014387 | velvet complex subunit 1 | 589 | Bcin15g03390 | 75.17 | 99.48 | EYC80_008048 | 99.66 | 95.77 |
| MlVEL2 | Monilinia__093380 | BK014388 | velvet complex subunit 2 | 446 | Bcin01g02730 | 89.02 | 93.79 | EYC80_005890 | 100 | 100 |
| MlVEL3 | Monilinia__072950 | BK014389 | velvet 3 | 492 | Bcin03g06410 | 78.64 | 98.00 | EYC80_000111 | 100 | 100 |
| MlVEL4 | Monilinia__100000 | MW349131 | velvet 4 | 375 | Bcin07g05880 | 92.70 | 95.41 | EYC80_003351 | 98.70 | 95.66 |
| Proteins implicated in the circadian clock | ||||||||||
| MlFRQ1 | Monilinia__081690 | BK014395 | putative frequency clock protein | 968 | Bcin02g08360 | 71.25 | 98.55 | EYC80_007367 | 97.93 | 100 |
a Gene/protein unique identifier in 8L M. laxa genome. b Putative protein function based on functional annotation. c Predicted protein length in 8L M. laxa proteome. d Gene unique identifier in Botrytis cinerea genome; BLASTP coverage and BLASTP identity. e Gene unique identifier in Mlax316 M. laxa genome; BLASTP coverage and BLASTP identity. * M. laxa entry EYC80_007313 (705 aa) partial align with Monilinia__016540 (1094 aa).
Publisher’s Note: MDPI stays neutral with regard to jurisdictional claims in published maps and institutional affiliations. |
© 2021 by the authors. Licensee MDPI, Basel, Switzerland. This article is an open access article distributed under the terms and conditions of the Creative Commons Attribution (CC BY) license (http://creativecommons.org/licenses/by/4.0/).
Share and Cite
MDPI and ACS Style
Rodríguez-Pires, S.; Espeso, E.A.; Rasiukevičiūtė, N.; Melgarejo, P.; De Cal, A. Light-Photoreceptors and Proteins Related to Monilinia laxa Photoresponses. J. Fungi 2021, 7, 32. https://0-doi-org.brum.beds.ac.uk/10.3390/jof7010032
AMA Style
Rodríguez-Pires S, Espeso EA, Rasiukevičiūtė N, Melgarejo P, De Cal A. Light-Photoreceptors and Proteins Related to Monilinia laxa Photoresponses. Journal of Fungi. 2021; 7(1):32. https://0-doi-org.brum.beds.ac.uk/10.3390/jof7010032
Chicago/Turabian StyleRodríguez-Pires, Silvia, Eduardo A. Espeso, Neringa Rasiukevičiūtė, Paloma Melgarejo, and Antonieta De Cal. 2021. "Light-Photoreceptors and Proteins Related to Monilinia laxa Photoresponses" Journal of Fungi 7, no. 1: 32. https://0-doi-org.brum.beds.ac.uk/10.3390/jof7010032
Note that from the first issue of 2016, this journal uses article numbers instead of page numbers. See further details here.