Article

The Kinetics of Single-Walled Carbon Nanotube Aggregation in Aqueous Media Is Sensitive to Surface Charge

Department of Pharmaceutical Sciences, University of Michigan, 428 Church Street, Ann Arbor, MI 48109, USA
*
Author to whom correspondence should be addressed.
Current Address: Department of Chemistry, Stanford University, 333 Campus Drive, Stanford, CA 94305, USA
Submission received: 10 November 2015 / Revised: 13 January 2016 / Accepted: 1 February 2016 / Published: 19 February 2016
(This article belongs to the Special Issue Surface Modification of Carbon Nanotubes)

Abstract

:
Single-walled carbon nanotubes (SWCNTs) dispersed in aqueous media have many potential applications in chemistry, biology and medicine. To disperse SWCNTs into aqueous media, it is often necessary to modify the surface of SWCNTs by either covalent or noncovalent methods. As a result of this modification, the properties of SWCNTs may be profoundly influenced by the nature of the surface modification. Here, by using SWCNTs dispersed with single-stranded DNA of different lengths, we show that the kinetics of SWCNTs’ aggregation in aqueous media is strongly dependent on the status of the overall surface charge. SWCNTs with a greater number of surface charges showed faster aggregation. The difference in the rate of aggregation can differ by more than ten-fold among different conditions tested. AFM imaging of the discrete time points along the aggregation process suggests that aggregation starts with the formation of microfilaments, which can further grow to form bigger aggregates. The formation of bigger aggregates also renders it more difficult to redisperse them back into the aqueous media. The concentration of counterions required to trigger SWCNT aggregation also shows a dependence on the concentration of KCl in the aqueous solution, which supports that electrostatic interactions instead of van der Waals interactions dominate the interactions among these individually-dispersed SWCNTs in aqueous media.

Graphical Abstract

1. Introduction

Due to its unique electrical, mechanical and thermal properties, SWCNTs [1,2] are considered as some of the most versatile nano-materials with potential applications in nano-electronics [3,4], cancer treatment [5], drug and molecule delivery [6]. Extensive use of SWCNTs especially for their biological applications requires effective dispersion in aqueous media [7,8,9,10,11,12]. However, dispersed SWCNTs likely aggregate upon interactions with various electrolytes that are abundant in the biological milieu. Therefore, it is important to understand the mechanisms of SWCNT aggregation in an attempt to control their aggregation status in aqueous media. To date, several studies on SWCNT aggregation and the control of their aggregation status have been reported [13,14,15,16,17,18,19,20,21,22]. However, only a handful of studies focuses on the kinetics of carbon nanotube aggregation [23,24,25,26,27,28]. The kinetics of this process may offer valuable information on the mechanisms of SWCNT aggregation. On the other hand, the knowledge of SWCNT aggregation kinetics may help understand SWCNT toxicity and clearance in vivo. The objective of this paper is to conduct a study on the kinetics of SWCNT aggregation in aqueous media and to investigate how this process may be influenced by charges on the SWCNT surface and the electrolytes in solution. AFM imaging of the discrete time points during the aggregation process is also conducted in order to understand the mechanism of its aggregation. By systematically studying SWCNT aggregation as a function of monovalent salt concentration in the aqueous solution, we reveal the surprising similarity between SWCNT aggregation and DNA condensation.

2. Experimental Section

2.1. SWCNT Sample Preparation

Arc-discharge SWCNTs (Helix Materials Solution, Richardson, TX, USA) were dispersed in distilled and de-ionized water (ddH2O, Synergy UV, Millipore, MA, USA) with a 1-h bath sonication (Ultrasonic Processor S-4000, Misonix, Farmingdale, NY, USA, ~15 W) in the presence of (dT)30 (30-mer DNA, Integrated DNA Technologies, Coralville, IA, USA), 200-mer single-stranded DNA of a random base sequence (200-mer DNA, Integrated DNA Technologies, Coralville, IA, USA) or calf thymus single-stranded DNA (Calf Thymus DNA, Sigma-Aldrich, St. Louis, MO, USA, CAT#D8899, average length ~ 50 kb), respectively. The temperature during sonication was kept at 0 °C by adding ice to the water bath. Dispersed SWCNTs were centrifuged for 1 h at 17,000 g (Sorvall Legend Micro 17, Thermo Fisher Scientific, Waltham, MA, USA) at room temperature, and supernatants were collected. Carboxylated SWCNTs (P3-SWNT, Carbon solutions, Riverside, CA, USA, SWCNT-COOH) were dispersed in ddH2O with the same sonication and centrifugation procedure described above. The concentrations of dispersed SWCNTs were adjusted to ~0.1 µg/µL based on UV-Vis absorbance for consistency throughout the experiments. The zeta potential of each dispersed SWCNT sample was measured directly as an output parameter from a Zetasizer Nano ZS90 (Malvern, U.K.).

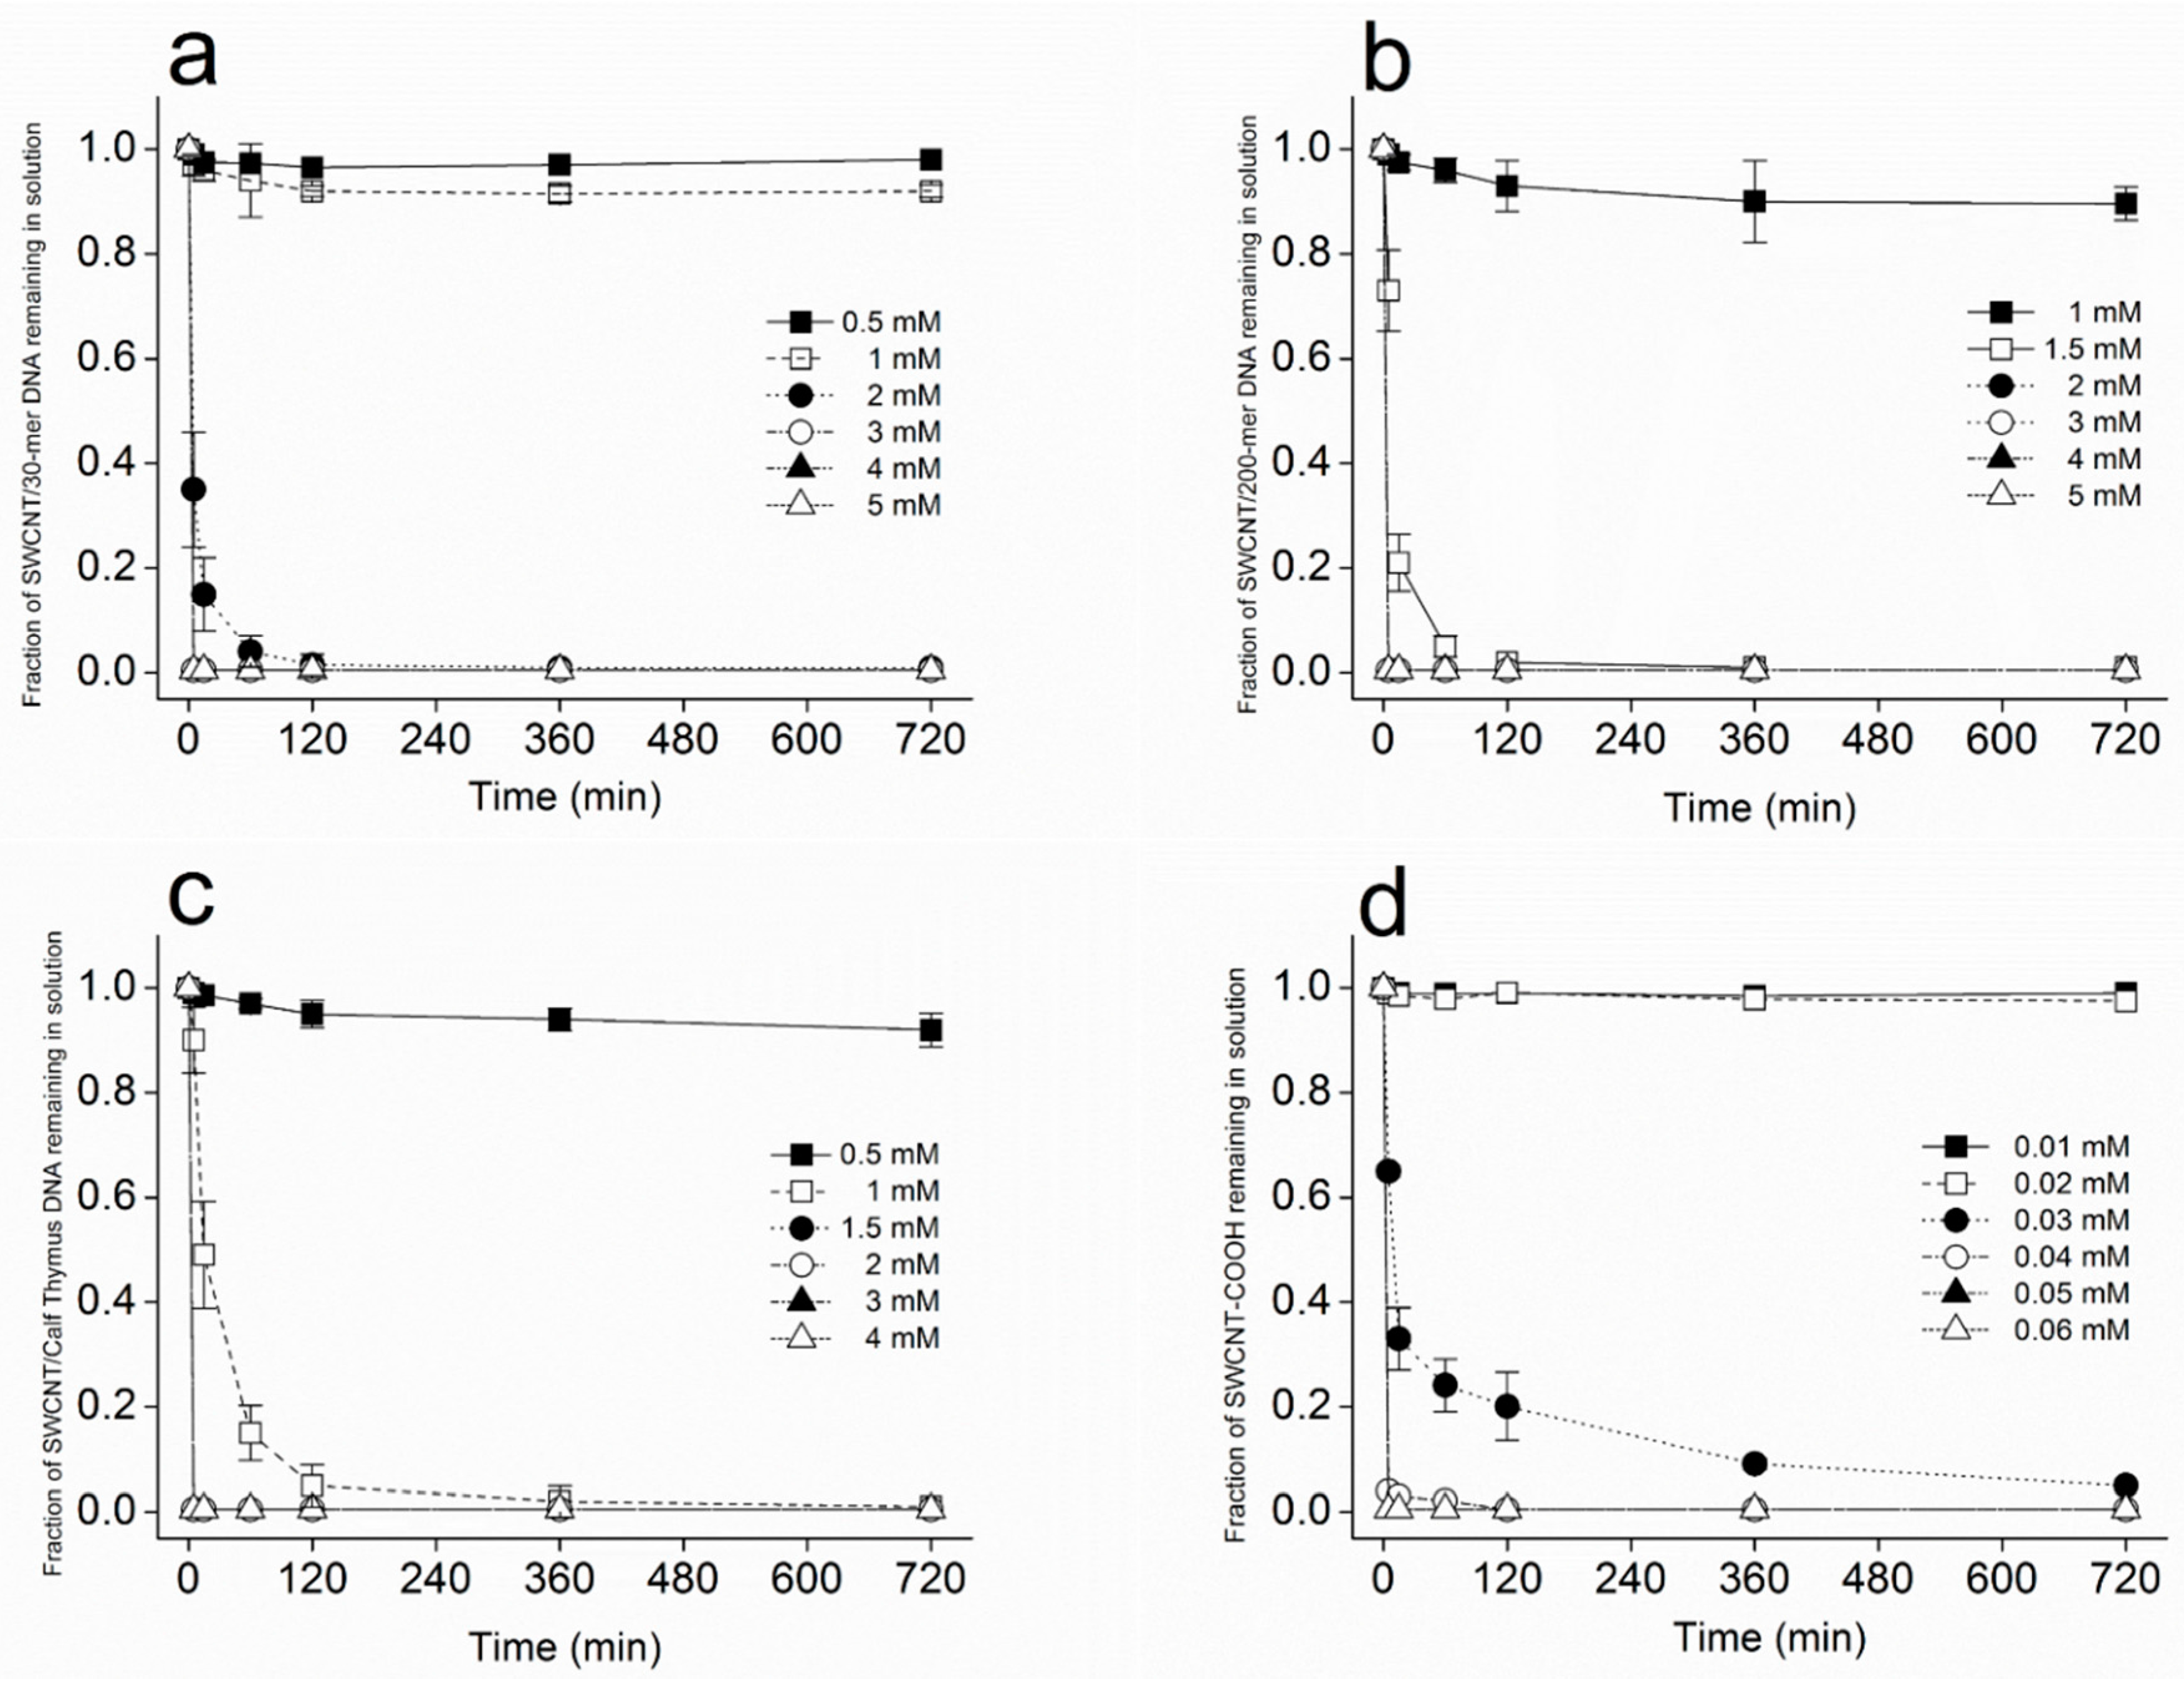
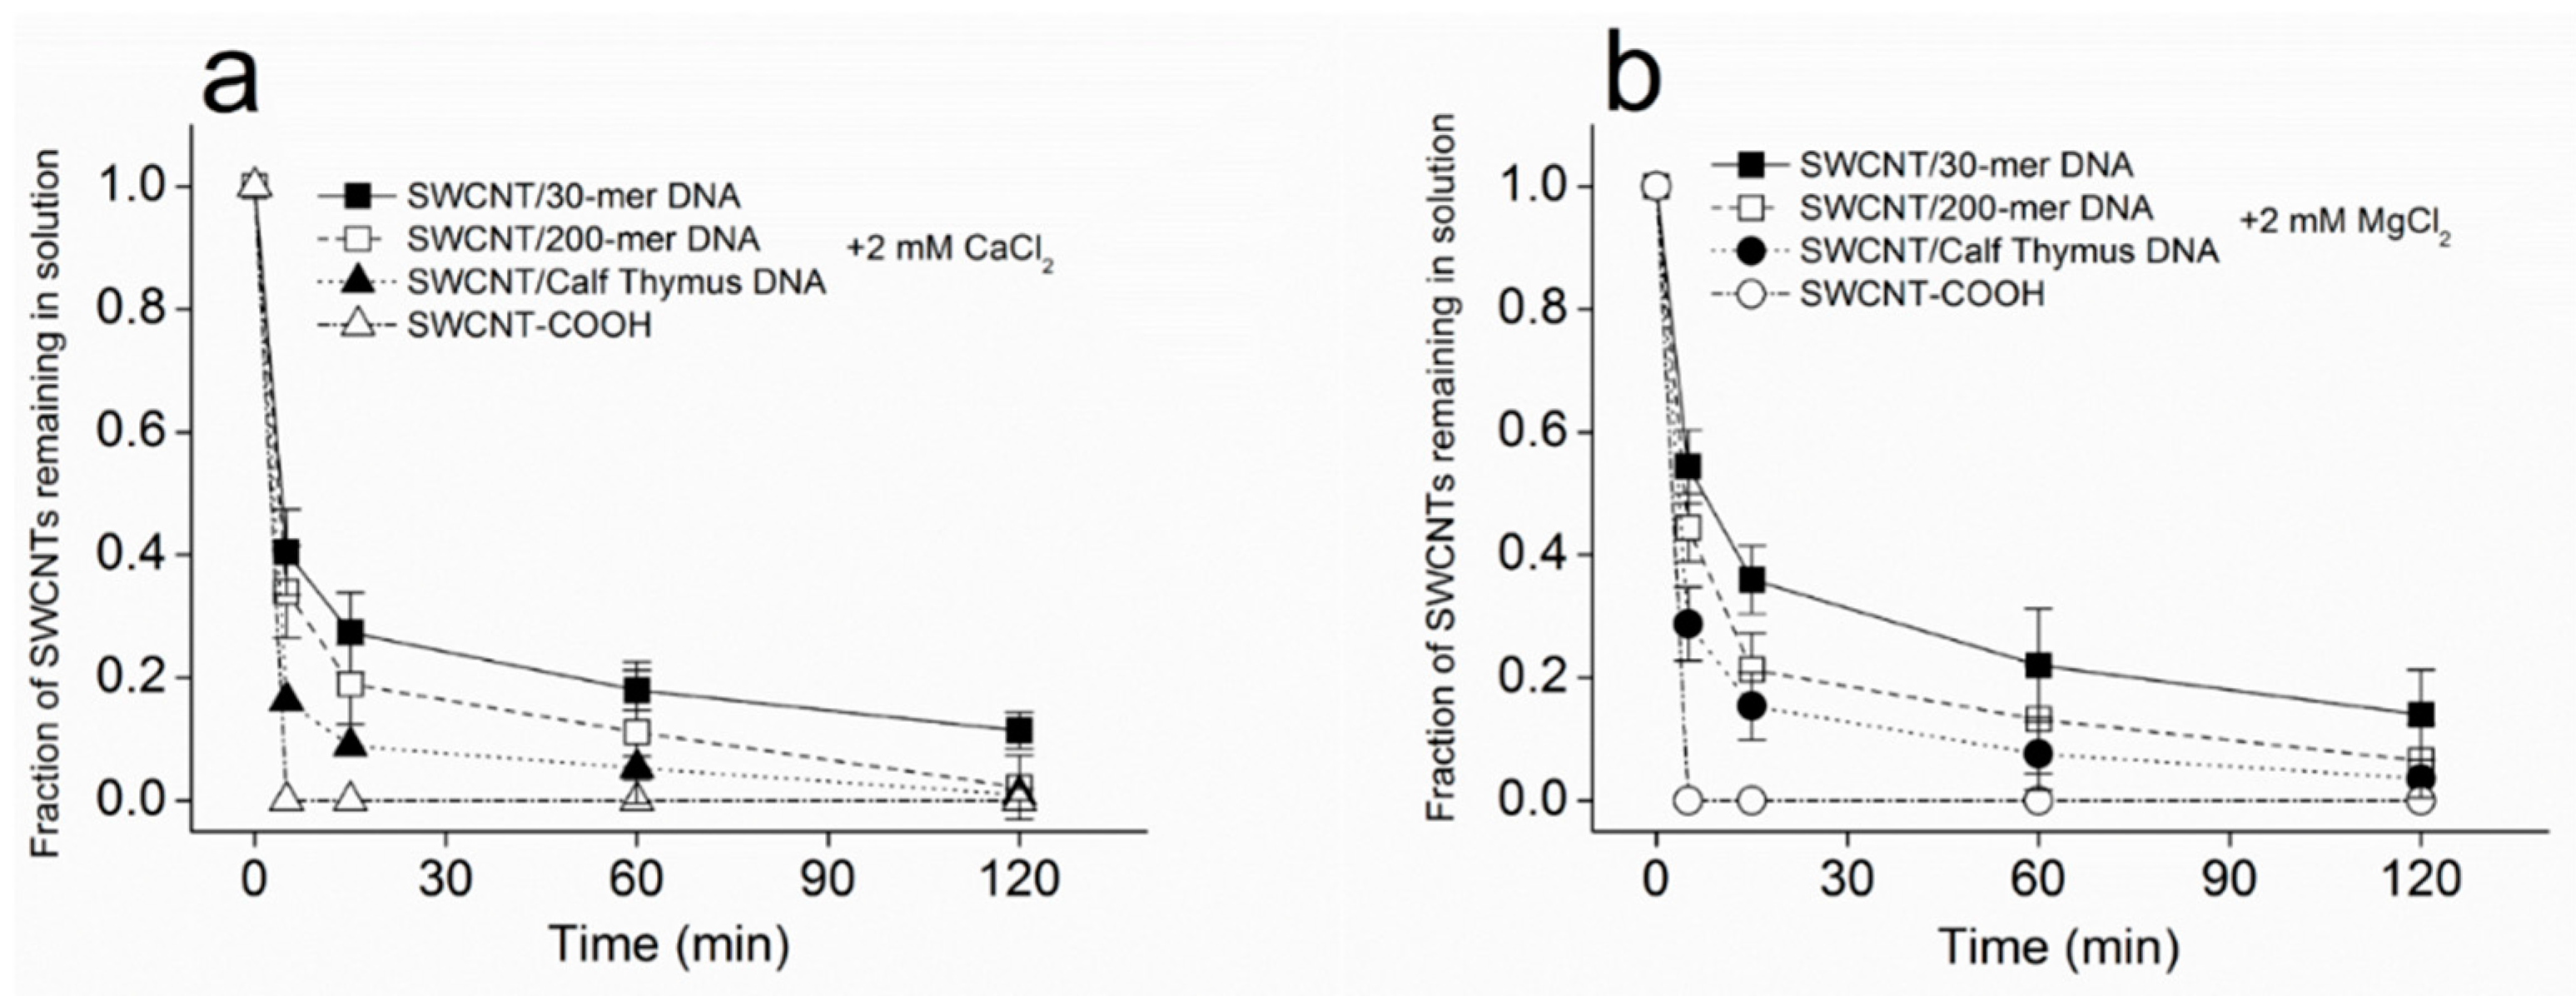
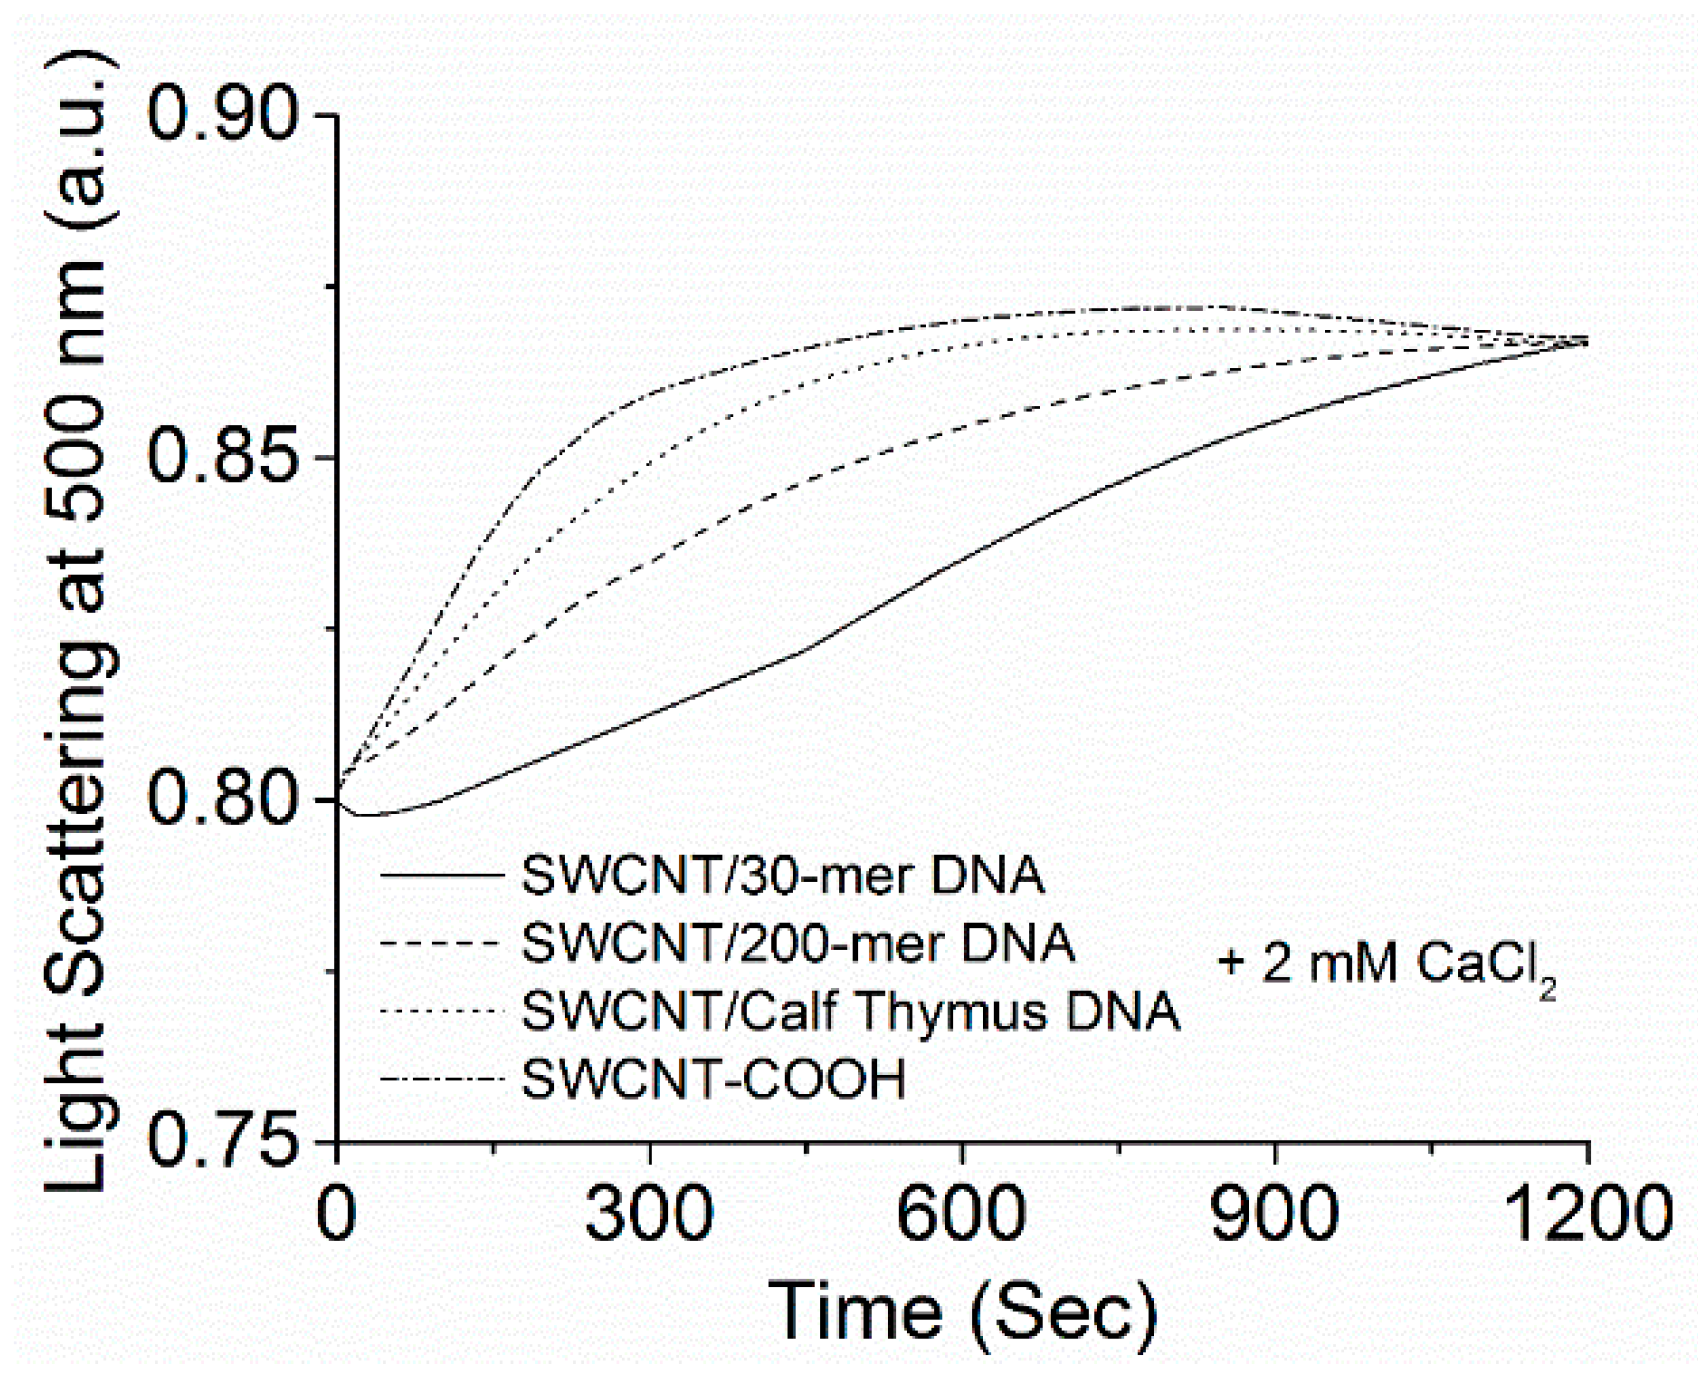
2.2. Kinetics of SWCNT Aggregation Induced by Divalent Cations

For experiments in Figure 1, 36 μL of CaCl2 solution were added to 3.564 mL of SWCNT/30-mer DNA, SWCNT/200-mer DNA, SWCNT/calf thymus DNA or SWCNT-COOH, respectively, to reach a final concentration of 0.01–5 mM and incubated at room temperature. The room temperature is 20 ± 2 °C throughout, unless specified otherwise. After designated time points (5, 15, 60, 120, 360 and 720 min), samples were briefly vortexed, and 600 μL of the incubated samples were collected and centrifuged for 1 h at 17,000 g in order to remove all aggregated SWCNTs. Fractions of individual SWCNTs remaining in solution were measured relative to the concentration of SWCNTs before incubation by taking IR absorbance at 1023 nm using a UV-Vis spectrophotometer. (Shimadzu UV-1800, Kyoto, Japan). For experiments reported in Figure 2, 6 μL of 200 mM CaCl2 or MgCl2 were added to 594 μL of SWCNT dispersed with 30-mer, 200-mer or calf thymus DNA to reach a final concentration of 2 mM for CaCl2 or MgCl2 and incubated at room temperature. After the designated time point, samples were collected, and fractions of individual SWCNTs in solution were measured by taking IR absorbance at 1023 nm. For experiments reported in Figure 3, 1 μL of 200 mM of CaCl2 was added to 99 μL of SWCNTs (CaCl2 final concentration 2 mM); the mixture was vortexed briefly and then transferred to the UV-Vis spectrophotometer (Shimadzu UV-1800) for measurement of the aggregation as a function of time. The aggregation of SWCNT was monitored by measuring the light scattering at 500 nm every 5 s in a quartz cuvette.

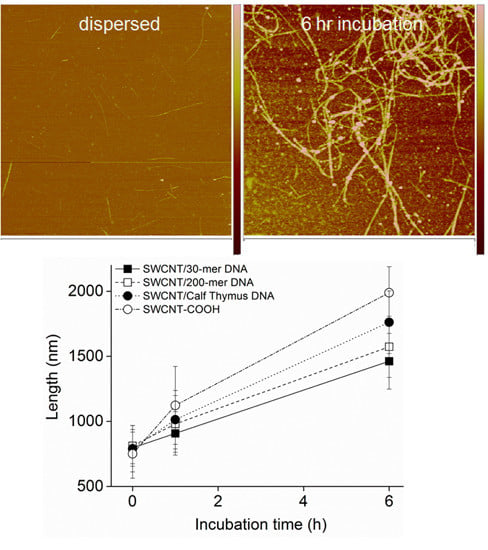
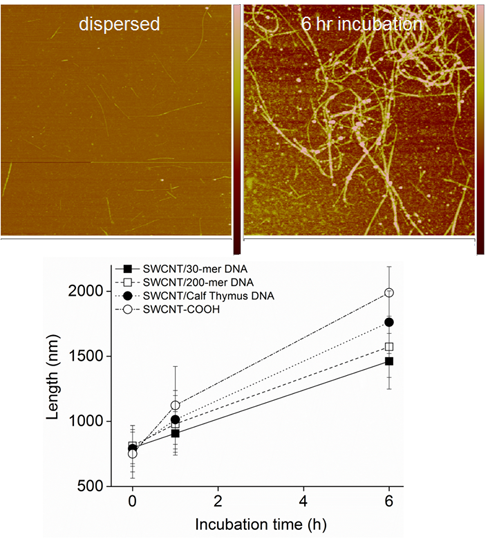
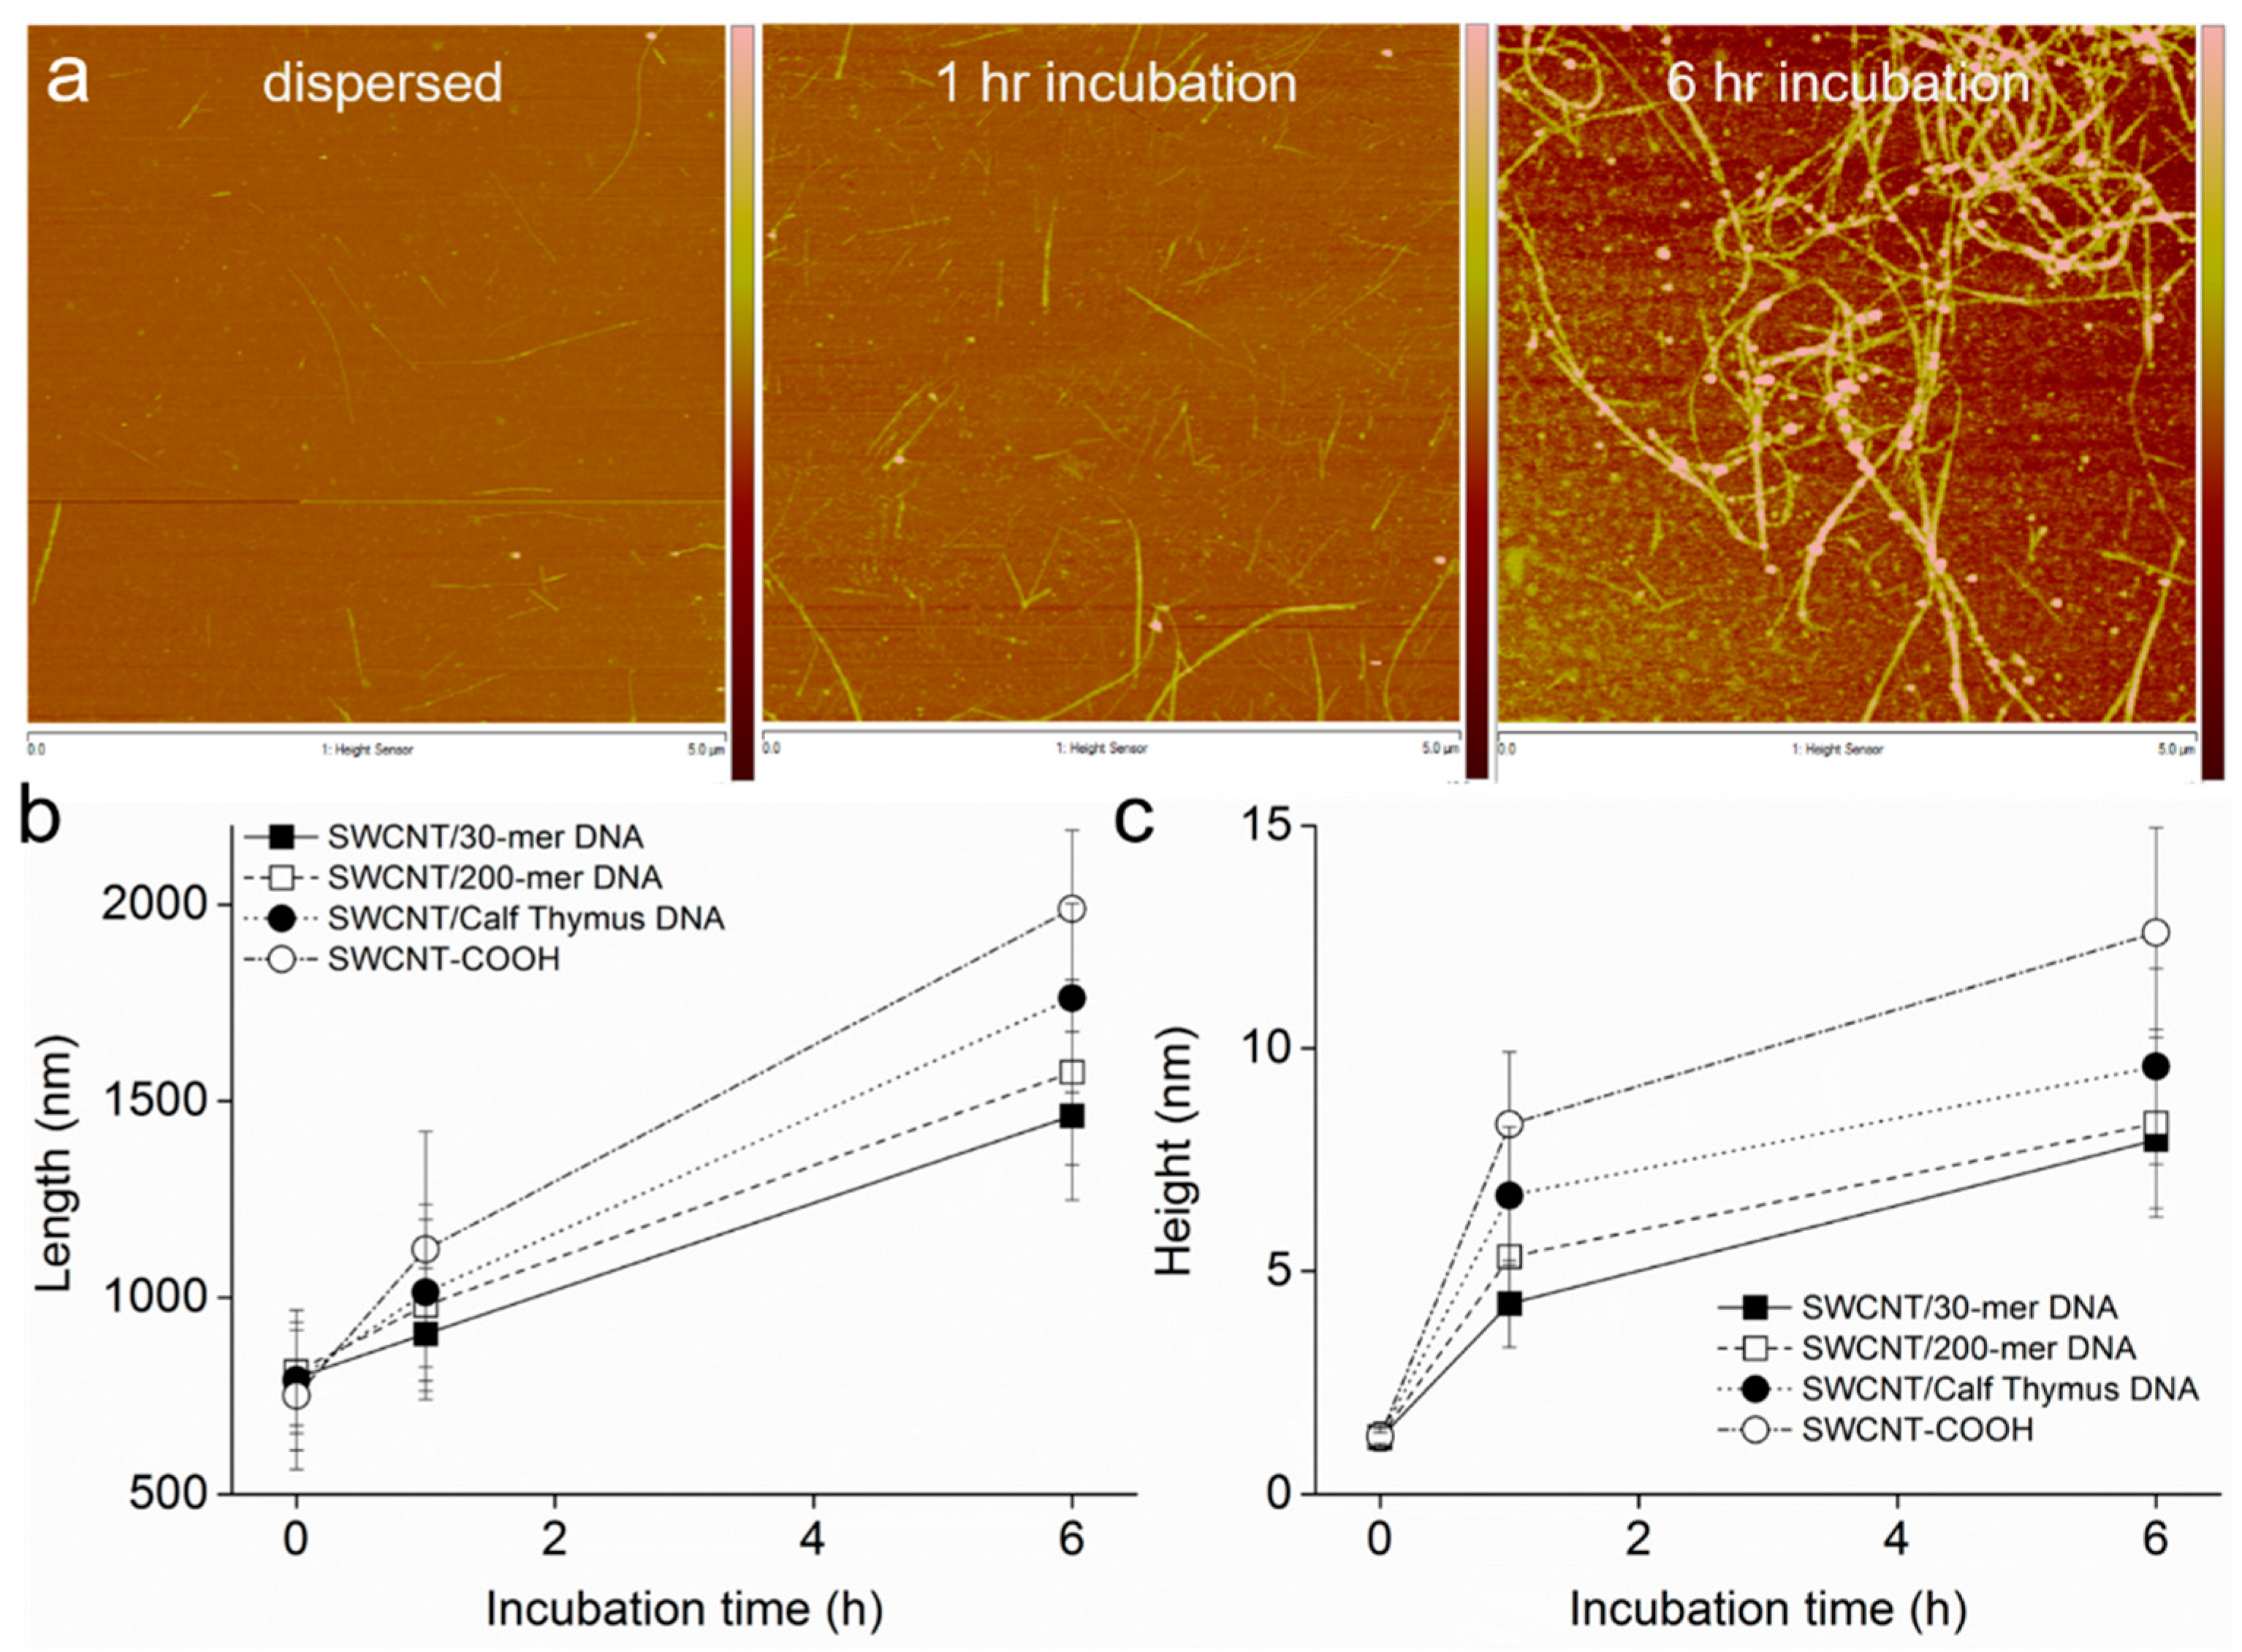
2.3. AFM Imaging of the SWCNT Aggregation Process

SWCNTs dispersed by 30-mer, 200-mer or calf thymus DNA in ddH2O were incubated for 1 and 6 h in the presence of 1 mM of CaCl2 and then centrifuged at 17,000 g for 10 min. Fifteen microliters of supernatants after this brief centrifugation were deposited onto a poly-l-lysine (PLL)-treated mica surface, further incubated for 15 min, washed with 500 μL of ddH2O 3 times and then air-dried with nitrogen gas. Samples were analyzed with tapping-mode atomic force microscopy (AFM, Veeco Dimension Icon, Veeco, Plainview, NY, USA) with a silicon AFM probe (RTESP, Veeco, Plainview, NY, USA). The AFM images were analyzed using Nanoscope analysis software (Veeco, Plainview, NY, USA).

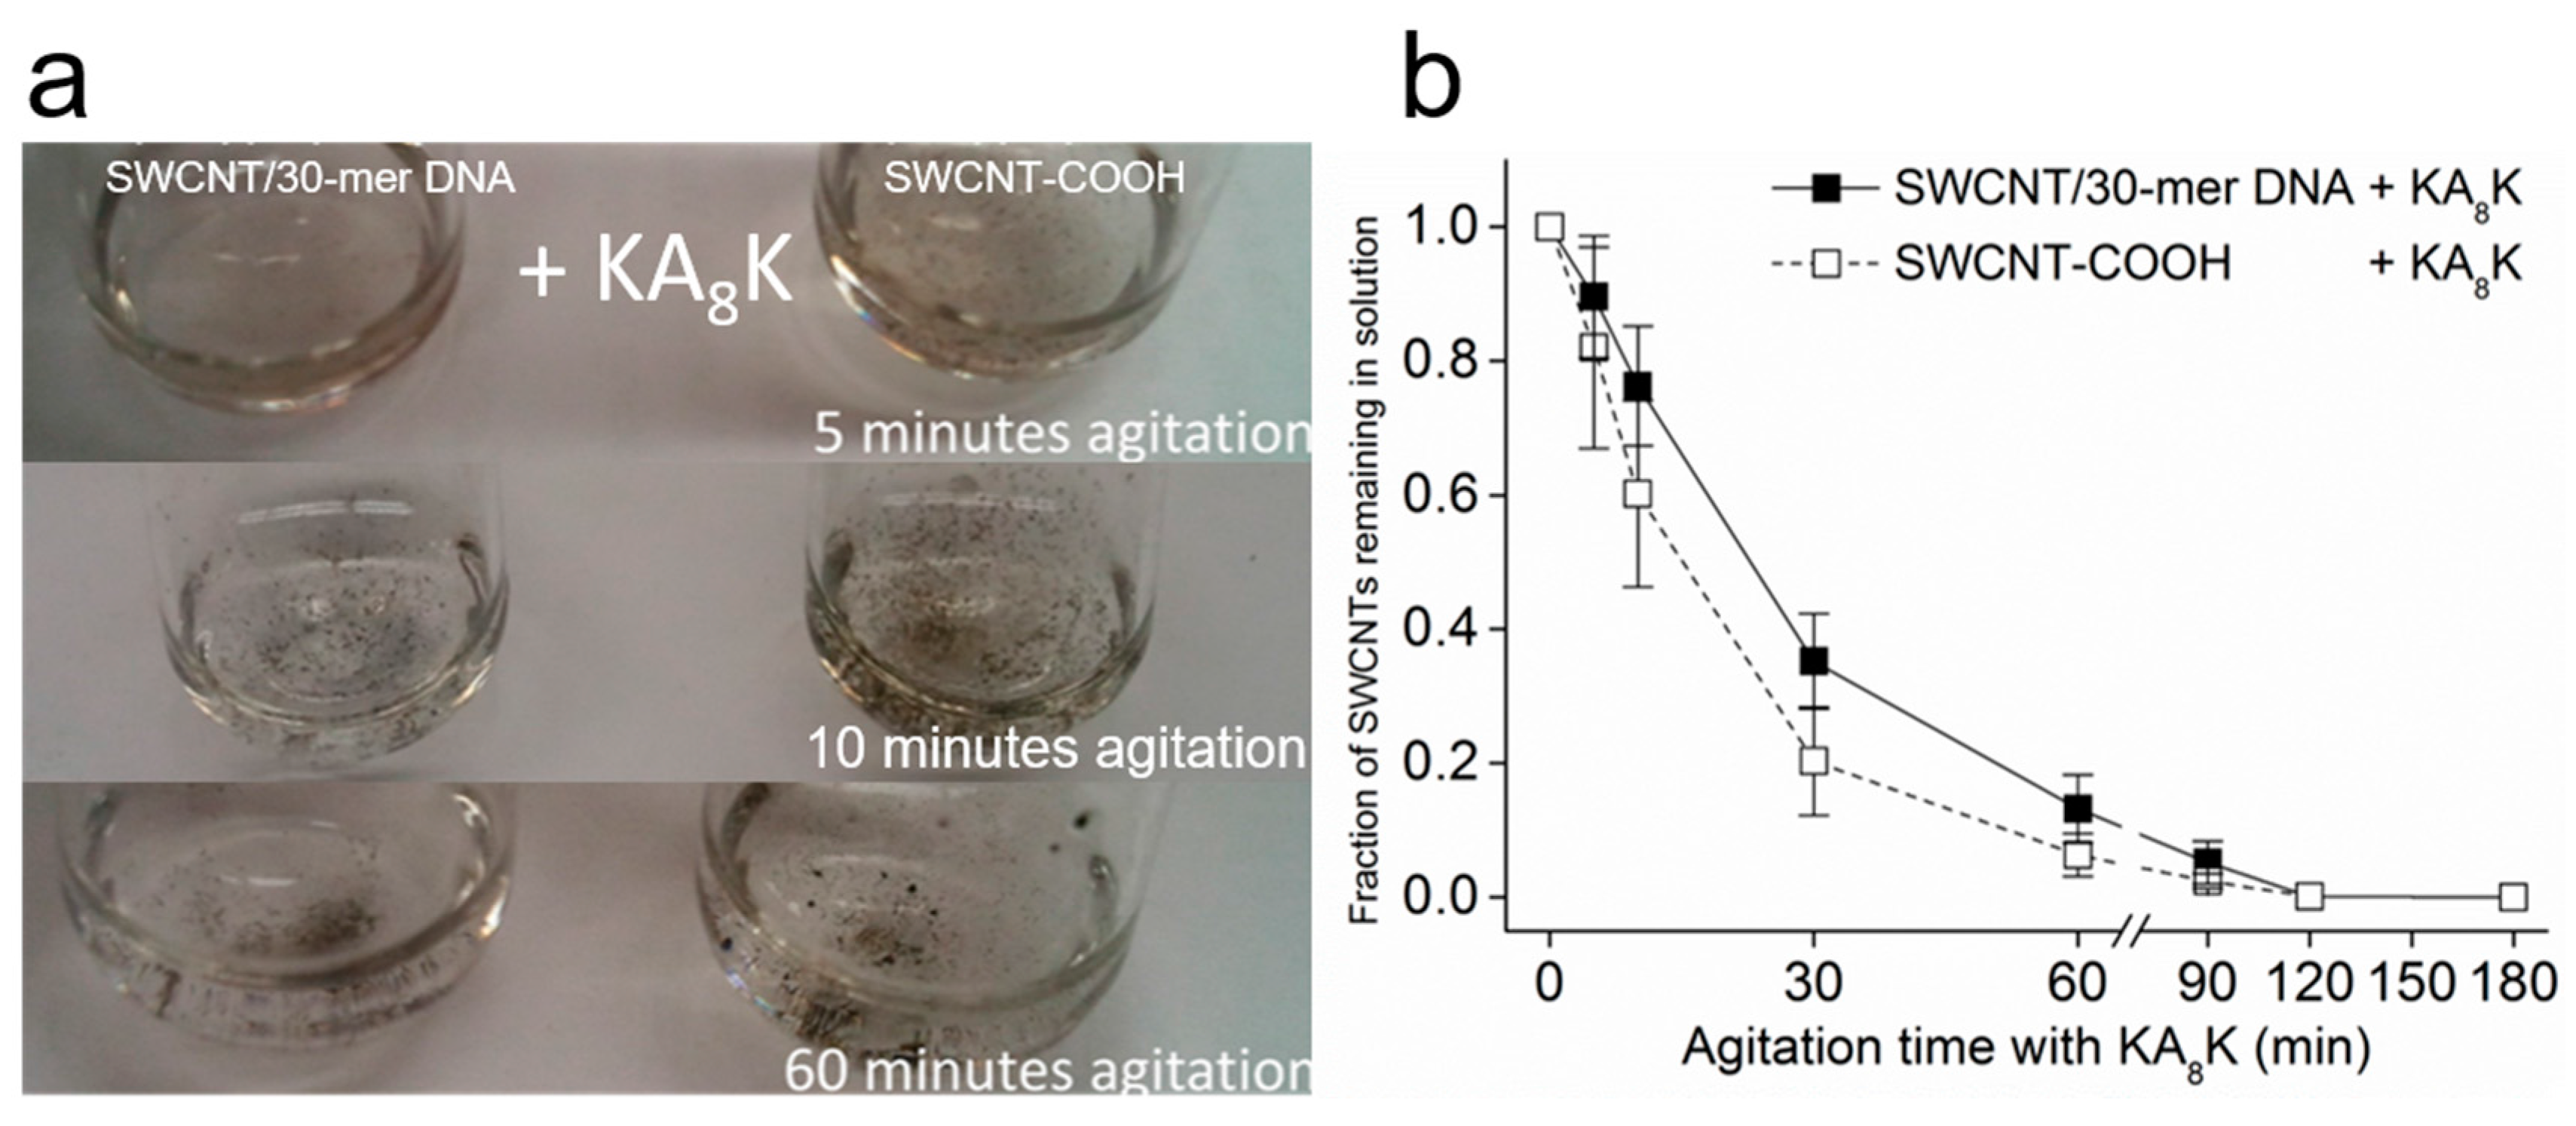
2.4. Oligopeptide-Mediated SWCNT Aggregation and Its Redispersion

One hundred twenty microliters of 20 mM 8-mer oligopeptide (amino acid sequence as follows: lysine-alanine-alanine-alanine-alanine-alanine-alanine-alanine-alanine-lysine; abbreviated as KA8K) were added to 2.28 mL of SWCNT/30-mer DNA or SWCNT-COOH in ddH2O to reach a final concentration of 1 mM KA8K. Samples were agitated at 150 rpm (Excella E-24R benchtop incubator shakers, New Brunswick Scientific Co, NJ, USA) at room temperature for the designated time (5, 10, 30 and 60 min). After various time points, 600 μL of agitated samples were collected and centrifuged at 17,000 g for 1 h. Supernatants were collected, and absorbance at 1023 nm was measured to quantitate the fractions of SWCNTs remaining in aqueous media. For redispersion of the above aggregates by trypsin digestion, 600 μL of completely aggregated SWCNT/30-mer DNA or SWCNT-COOH (after 3 h of incubation with KA8K) were agitated at 150 rpm in a benchtop incubator shaker with 0.1% trypsin. After the designated time of agitation with trypsin (15, 30, 60, 120, 300 min), 100 μL of SWCNTs were collected and centrifuged for 1 h at 17,000 g, and supernatants were collected. Absorbance of the supernatants at 1023 nm was measured to quantitate the fractions of SWCNTs remaining in aqueous media.

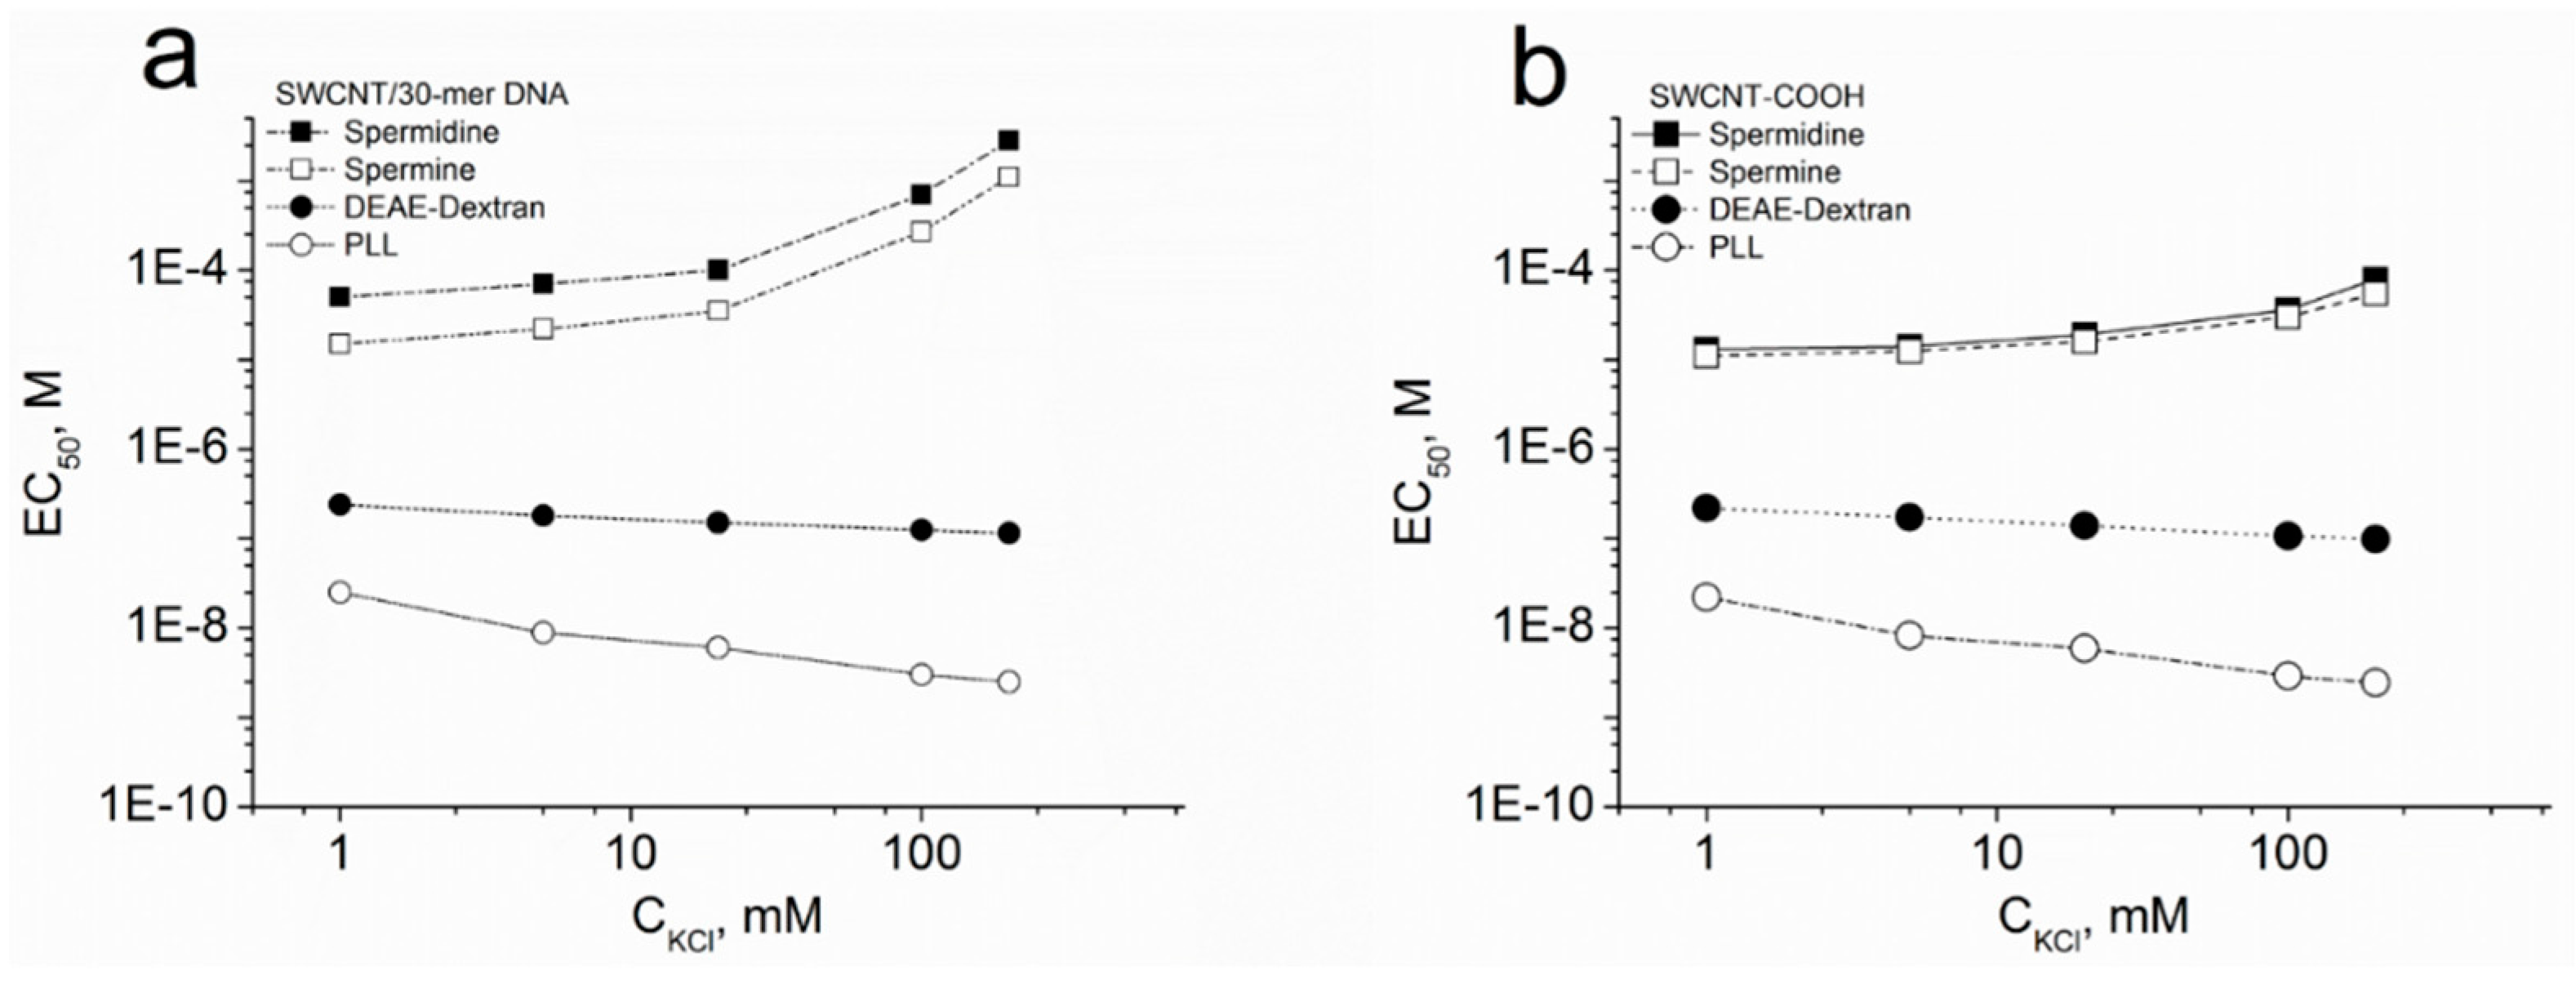
2.5. EC50 of SWCNT Aggregation

SWCNT/30-mer DNA and SWCNT-COOH dispersed in ddH2O were incubated with designated concentrations of spermidine, spermine, PLL or diethylaminoethyl-dextran (DEAE-dextran) in the presence of various concentrations of KCl for 30 min at room temperature with agitation at 150 rpm. The percentage of SWCNT aggregation, relative to the initial fully-dispersed SWCNTs, was quantified by taking an IR absorbance measurement at 1023 nm after inducing aggregation and centrifugation for 1 h at 17,000 g. The concentration of the cationic ligand to induce 50% of the initial dispersed SWCNTs to form aggregates is defined as EC50. All reagents were purchased from Sigma-Aldrich (MO), unless specified otherwise.

3. Results and Discussion

3.1. Kinetics of SWCNT Aggregation

SWCNTs dispersed by single-stranded DNA of different lengths (30-mer DNA, 200-mer DNA, calf thymus DNA) in ddH2O were prepared. The single-stranded DNA is expected to wrap around individual SWCNTs as demonstrated previously by Campbell et al. [23]. Because these single-stranded DNA molecules are of different lengths, they may thus cover the SWCNT surface with slightly different pitches [23] that results in different surface charge densities. We measured the zeta potential for these SWCNTs dispersed with different DNA molecules, and the results are shown in Table 1 together with that for SWCNT-COOH. Interestingly, there are indeed slight differences in the resulting zeta potential measurement. In the order of descending zeta potential mean values, it follows that SWCNT/30-mer DNA > SWCNT/200-mer DNA > SWCNT/calf thymus DNA > SWCNT-COOH. This result indicates that the density of single-stranded DNA on SWCNTs may be different, which resulted in differences in the mean values of the zeta potential. We would like to examine next how the kinetics of SWCNT aggregation may differ among these SWCNT dispersions.
SWCNT/30-mer DNA, SWCNT/200-mer DNA, SWCNT/calf thymus DNA and SWCNT-COOH were agitated with varying concentrations of CaCl2 ([CaCl2]), and the kinetics of aggregation was monitored (Figure 1). For all pf these SWCNTs, as we systematically increased [CaCl2], we clearly observed a transition from most SWCNTs being dispersed to most SWCNTs being aggregated, suggesting that there is a critical condition at which these SWCNTs aggregate. Interestingly, the [CaCl2] at which these transitions occur differs. We observed this transition at 2 mM of CaCl2 for SWCNT/30-mer DNA, 1.5 mM for SWCNT/200-mer DNA, 1 mM for SWCNT/calf thymus DNA and 30 µM for SWCNT-COOH, which is the lowest [CaCl2] among all. This trend agrees with the order we observed from zeta potential measurement (Table 1), with a positive correlation coefficient of 0.95 between the critical concentrations of CaCl2 at which SWCNT aggregation occurs and the measured zeta potential values, and suggests that a more negatively-charged surface (SWCNT-COOH) requires less [CaCl2] to reach the critical condition for SWCNT aggregation compared to SWCNTs dispersed with different lengths of DNA (Figure 1). All SWCNTs aggregated almost instantly above the critical concentration of [CaCl2]. One possible explanation for the difference in the critical [CaCl2] is that a more negatively-charged SWCNT surface can bind with cations in solution more efficiently. This more efficient binding by cations ensures that even a lower [CaCl2] can neutralize the SWCNT surface beyond the threshold of the zeta potential required for SWCNT aggregation, which leads to SWCNT aggregation as we described recently [29].
The critical [CaCl2] to induce SWCNT aggregation is not affected by the initial concentration of the dispersed SWCNTs in aqueous media, as shown in Figure S1. The critical [CaCl2] to induce 50% aggregation of SWCNT/30-mer DNA remains around 1.5 mM, despite the fact that the concentration of the initial SWCNTs has increased five-fold. To further compare the kinetics of aggregation for SWCNTs dispersed with different DNA molecules, we conducted a side-by-side comparison among them. This comparison was done at 2 mM CaCl2 or MgCl2, where the kinetics of aggregation was measured for SWCNT/30-mer DNA, SWCNT/200-mer DNA, SWCNT/calf thymus DNA and SWCNT-COOH, respectively. As shown in Figure 2a for CaCl2, SWCNT-COOH displays the fastest aggregation, followed by SWCNT/calf thymus DNA, SWCNT/200-mer DNA and SWCNT/30-mer DNA (Figure 2a). The same trend was observed in 2 mM MgCl2 (Figure 2b), although the kinetics were overall slower than those in CaCl2. This difference between CaCl2 and MgCl2 might be explained by the fact that Ca2+ has a smaller ion radius than Mg2+ and, thus, permits a more efficient binding to a negatively-charged SWCNT surface.
The experiments shown in Figure 2 were done by collecting samples at discrete time points after the addition of CaCl2 or MgCl2 to induce aggregation. To lend further support to this experiment, we measured the SWCNT aggregation in real time after the addition of 2 mM CaCl2, by monitoring the amount of light scattered at 500 nm in a UV-Vis spectrophotometer. As SWCNT aggregation proceeds, the light scattered will increase with time due to the formation of aggregates that will scatter more light. As shown in Figure 3, for all SWCNTs, they all displayed a time-dependent increase in light scattering, however with a marked difference in the kinetics of these progress curves. Over the ~20-min time course, SWCNT-COOH showed the fastest aggregation followed by SWCNT/calf thymus DNA, SWNCT/200-mer DNA and SWCNT/30-mer DNA (Figure 3), the order of which coincides with previous results (Figure 2a). These results altogether revealed that the kinetics of SWCNT aggregation in aqueous media is sensitive to surface modifications, and likely, the difference in kinetics is directly related to the differences in surface charge density, as reflected by the zeta potential measurement.

3.2. Intermediates of SWCNT Aggregates Imaged by AFM

The progress curves of SWCNT aggregation shown in Figure 3 indicate that the aggregation of SWCNT in aqueous media follows an ordered process. To reveal the potential intermediates in this process, we induced the aggregation of individually-dispersed SWCNTs with the addition of 1 mM CaCl2 and then used tapping mode AFM to image the material that remains in the supernatant after a brief centrifugation. Interestingly, at discrete time points after the induction of the aggregation, we clearly observed SWCNT bundles on the mica surface, whose size apparently increases with time, as shown in Figure 4a for SWCNT/30-mer DNA after 1 or 6 h of incubation in the presence of 1 mM CaCl2. We quantitated these SWCNT bundles in terms of both height and length. As shown in Figure 4b,c, for SWCNT dispersed with various DNA molecules, they all show this trend of increasing bundle height and length with time. At the same time points, SWCNT-COOH showed the largest aggregates formed, followed by SWCNT/calf thymus DNA, SWCNT/200-mer DNA and SWCNT/30-mer DNA (Figure 4b,c). This order is consistent with our kinetic experiments to monitor aggregate formation and suggests that the SWCNT aggregation process starts with micro-bundle formation between individual SWCNTs, which build up with time to form bigger and longer bundles. During this process, the overall surface charge on individual SWCNTs appears to dictate the kinetics of this process. A higher surface charge density affords tighter binding with counterions. Based on our previous studies [29], the partial neutralization of SWCNT surface charge directly leads aggregation. Our current experiments suggest that this process starts with the formation of bundles among individual tubes, and these bundles grow in both size and length with time. The kinetics of this process depends on surface charge density. Along a similar vein, Fedorov et al. [22] previously showed that the size of SWCNT aggregates in organic solvent can be possibly controlled by varying salt concentration.
This difference in kinetics of SWCNT aggregation is visually clear when we compare the aggregation of SWCNT/30-mer DNA to that of SWCNT-COOH. As shown in Figure 5a, for the different snapshots taken after the addition of the oligopeptide KA8K to the dispersed SWCNTs, the small aggregates are clearly visible after 5 min for SWCNT-COOH, but not for SWCNT/30-mer. The progress of the aggregation as a function of time was quantitated by measuring the fraction of SWCNTs that remained in the aqueous media. As shown in Figure 5b, the aggregation of SWCNT-COOH is noticeably faster than that of SWCNT/30-mer DNA, although both can reach complete aggregation by the end of 3 h. These trends are consistent with the differences between SWCNT/30-mer and SWCNT-COOH in zeta potential measurement (Table 1) and also consistent with their differences in gel mobility, as shown in Figure S2.
Previously, we have shown that SWCNT aggregates formed upon the addition of KA8K oligopeptide can be reversed by the addition of trypsin to digest the peptide that crosslinks individual tubes [29]. Because the kinetics of bundle formation depends on the overall surface charge of individual SWCNTs, we reasoned that the kinetics of the redispersion of SWCNTs may also depend on the history when these aggregates were formed. To test this, we added trypsin to the completely aggregated SWCNT samples to digest the peptide and induce the redispersion. As shown in Figure S3, for the aggregates formed with SWCNT/30-mer DNA, the addition of trypsin resulted in faster redispersion of the aggregates. In contrast, the aggregates formed with SWCNT-COOH were redispersed at a much slower rate. This result suggests that the aggregates formed by SWCNT-COOH may adopt a more packed structure than that by SWCNT/30-mer DNA, so that the peptide is less accessible to cleavage by trypsin.

3.3. Dependence of SWCNT Aggregation on KCl Concentration

Previously, Korolev et al. [30,31] reported the condensation of plasmid DNA with oligocations and the dependence of this condensation on the concentration of monovalent salt (KCl) present in the solution. Since the SWCNT aggregation we studied here has a major contribution from electrostatic interactions, the presence of monovalent salt in the media may quantitatively change the concentrations of cations needed for the induction of SWCNT aggregation. To test this, we induced the aggregation of SWCNT/30-mer DNA or SWCNT-COOH in the presence of both monovalent salt KCl and multivalent cations (spermidine, spermine, PLL and DEAE-dextran) and monitored the aggregation of SWCNTs. Figure S4 shows the aggregation of SWCNT/30-mer DNA induced by the addition of spermidine, spermine, PLL or DEAE-dextran, respectively, in the presence of various concentrations of KCl. Similarly, Figure S5 shows the aggregation of SWCNT-COOH induced by the addition of spermidine, spermine, PLL or DEAE-dextran, respectively, in the presence of various concentrations of KCl. From these progress curves, we can determine the concentrations of the respective cationic molecules required for 50% aggregation of SWCNTs (the midpoint of aggregation), EC50, which are plotted as a function of KCl concentration for SWCNT/30-mer DNA (Figure 6a) and SWCNT-COOH (Figure 6b), respectively. For SWCNT/30-mer, the aggregation induced by either spermidine or spermine shows a clear dependence on KCl, with larger EC50 values at higher concentrations of KCl. The values of EC50 are relatively independent of the KCl concentration for aggregation induced by either PLL or DEAE-dextran. Similarly, for SWCNT-COOH, the aggregation induced by either spermidine or spermine shows a dependence on KCl, with larger EC50 values at higher concentrations of KCl, although this trend is more subtle compared to that of SWCNT/30-mer DNA. The values of EC50 induced by either PLL or DEAE-dextran are relatively independent of the KCl concentration. These data are consistent with our model that aggregation of either SWCNT/30-mer DNA or SWCNT-COOH is mediated by direct binding of cations to the negatively-charged surface of SWCNT [29]. For spermidine or spermine, which have fewer positive charges per molecule compared to PLL or DEAE-dextran, their binding affinity towards the SWCNT surface will face significant competition from the monovalent K+, although monovalent cations are rather inefficient in neutralizing the SWCNT surface [29]. As a result, for both SWCNT/30-mer and SWCNT-COOH, their aggregation by either spermidine or spermine shows a dependence on KCl concentration. This dependence is more subtle for SWCNT-COOH due to a more negatively-charged surface and, thus, a tighter binding of multivalent cations. For both SWCNT/30-mer and SWCNT-COOH, their aggregation by either PLL or DEAE-dextran shows little dependence on the KCl concentration, due to the superior binding of these cationic ligands to the SWCNT surface regardless of KCl concentration, as evidenced by the EC50 values, which are much lower than those for either spermidine or spermine. These observations are qualitatively similar to what Korolev et al. [30,31] observed with DNA condensation in the presence of both monovalent and multivalent cations: that multivalent cations with >10 valencies compete with KCl to bind to the DNA, while multivalent cations with >30 valencies preferentially bind to the DNA, inducing condensation without being affected by the concentration of KCl. Thus, our results here suggest a mechanistic similarity in the SWCNT aggregation that we studied here and the DNA condensation. Both processes are mediated by the direct binding of counterions to the polyelectrolyte molecule, either individually-dispersed SWCNTs or DNA themselves.

3.4. Potential Mechanisms of SWCNT Aggregation

Based on our previous studies [29], the SWCNT aggregation as studied above is likely due to simple electrostatic interactions mediated by ions, but not due to displacement of the DNA, because this aggregation is fully reversible under certain conditions. For SWCNT aggregation mediated by divalent cations, such as Ca2+, this aggregation can be completely reversed by the addition of EDTA, which chelates Ca2+. As a matter of fact, the UV-Vis absorbance spectra of the SWCNT/30-mer before and after aggregation are almost superimposable [29], suggesting that it is electrostatic interactions mediated by ions. If DNA displacement is the cause of the aggregation, we do not expect this process to be reversible, as described, because it would require sonication in the presence of DNA in order to disperse the tubes. Moreover, we showed that this reversible aggregation can be mediated by chain molecules that can crosslink between individual SWCNT tubes through electrostatic interactions, and chain breaking mechanism, such as the reduction of the disulfide bond or protease cleavage, can lead to redispersion of aggregated SWCNTs [29]. These phenomena are consistent with simple ion-mediated electrostatic interactions that drive the aggregation instead of the DNA displacement that causes the aggregation. From studies that we conducted previously on the thermodynamic stability of these DNA dispersed SWCNTs, binding of DNA to these tubes is very stable [10], which also argues against the displacement of DNA upon the addition of the counterions.

4. Conclusions

In this work, we have investigated the kinetics of SWCNT aggregation in aqueous media. By using SWCNTs dispersed with single-stranded DNA of different lengths, we show that the kinetics of SWCNTs’ aggregation in aqueous media is strongly influenced by the status of overall surface charge. Faster aggregation is correlated with a greater density of surface charges. AFM imaging of the discrete time points along the aggregation process suggests that aggregation starts with the formation of microfilaments, which can further grow to form bigger aggregates. The formation of bigger aggregates also renders it more difficult to redisperse them back into the aqueous media. The concentration of counterions required to trigger SWCNT aggregation also shows a dependence on the concentration of KCl in the aqueous solution. All of these results support that electrostatic interactions instead of van der Waals interactions dominate the interactions among these individually-dispersed SWCNTs in aqueous media and that SWCNT surface charge plays a critical role in determining the aggregation status of SWCNTs. These mechanisms may help to understand the aggregation of SWCNTs in a biological milieu, such as serum, where abundant serum proteins may carry charges and mediate electrostatic interactions. On the other hand, the kinetics of SWCNT aggregation may be different when it occurs in non-aqueous media [32], because the electrostatic interactions among SWCNTs will be altered due to the change in the dielectric constants of the media, the quantitative dependence of which remains a subject of future study.

Supplementary Materials

Supplementary materials can be found at https://0-www-mdpi-com.brum.beds.ac.uk/2311-5629/2/1/6/s1.

Acknowledgements

This work is supported by a 3M non-tenured faculty grant (260-03-A-05, Wei Cheng). Wei Cheng is a recipient of the 2011 NIH Director’s New Innovator Award (1DP2OD008693).

Author Contributions

Byumseok Koh and Wei Cheng conceived of and designed the experiments. Byumseok Koh the performed experiments. Byumseok Koh and Wei Cheng analyzed the data and wrote the paper.

Conflicts of Interest

The authors declare no conflict of interest. The founding sponsors had no role in the design of the study; in the collection, analyses or interpretation of data; in the writing of the manuscript; nor in the decision to publish the results.

References

  1. Iijima, S.; Ichihashi, T. Single-Shell Carbon Nanotubes of 1-nm Diameter. Nature 1993, 363, 603–605. [Google Scholar] [CrossRef]
  2. Bethune, D.S.; Kiang, C.H.; Devries, M.S.; Gorman, G.; Savoy, R.; Vazquez, J.; Beyers, R. Cobalt-Catalysed Growth of Carbon Nanotubes with Single-Atomic-Layer Walls. Nature 1993, 363, 605–607. [Google Scholar] [CrossRef]
  3. Chen, R.J.; Bangsaruntip, S.; Drouvalakis, K.A.; Kam, N.W. S.; Shim, M.; Li, Y.M.; Kim, W.; Utz, P.J.; Dai, H. Noncovalent Functionalization of Carbon Nanotubes for Highly Specific Electronic Biosensors. Proc. Natl. Acad. Sci. USA 2003, 100, 4984–4989. [Google Scholar] [CrossRef] [PubMed]
  4. Dang, X.; Yi, H.; Ham, M.-H.; Qi, J.; Yun, D.S.; Ladewski, R.; Strano, M.S.; Hammond, P.T.; Belcher, A.M. Virus-Templated Self-Assembled Single-Walled Carbon Nanotubes for Highly Efficient Electron Collection in Photovoltaic Devices. Nat. Nanotechnol. 2011, 6, 377–384. [Google Scholar] [CrossRef] [PubMed]
  5. Kam, N.W.S.; O’Connell, M.; Wisdom, J.A.; Dai, H. Carbon Nanotubes as Multifunctional Biological Transporters and Near-Infrared Agents for Selective Cancer Cell Destruction. Proc. Natl. Acad. Sci. USA 2005, 102, 11600–11605. [Google Scholar] [CrossRef] [PubMed]
  6. Wu, W.; Wieckowski, S.; Pastorin, G.; Benincasa, M.; Klumpp, C.; Briand, J.-P.; Gennaro, R.; Prato, M.; Bianco, A. Targeted Delivery of Amphotericin B to Cells by Using Functionalized Carbon Nanotubes. Angew. Chem. Int. Ed. 2005, 44, 6358–6362. [Google Scholar] [CrossRef] [PubMed]
  7. Zheng, M.; Jagota, A.; Semke, E.D.; Diner, B.A.; McLean, R.S.; Lustig, S.R.; Richardson, R.E.; Tassi, N.G. DNA-Assisted Dispersion and Separation of Carbon Nanotubes. Nat. Mater. 2003, 2, 338–342. [Google Scholar] [CrossRef] [PubMed]
  8. Backes, C.; Schmidt, C.D.; Hauke, F.; Boettcher, C.; Hirch, A. High Population of Individualized SWCNTs through the Adsorption of Water-Soluble Perylenes. J. Am. Chem. Soc. 2009, 131, 2172–2184. [Google Scholar] [CrossRef] [PubMed]
  9. Koh, B.; Park, J.B.; Ximiao, H.; Cheng, W. Comparative Dispersion Studies of Single-Walled Carbon Nanotubes in Aqueous Solution. J. Phys. Chem. B 2011, 115, 2627–2633. [Google Scholar] [CrossRef] [PubMed]
  10. Koh, B.; Kim, G.; Yoon, H.; Park, J.B.; Kopelman, R.; Cheng, W. Fluorophore and Dye-Assisted Dispersion of Carbon Nanotubes in Aqueous Solution. Langmuir 2012, 28, 11676–11686. [Google Scholar] [CrossRef] [PubMed]
  11. Fagan, J.A.; Bauer, B.J.; Hobbie, E.K.; Becker, M.L.; Hight Walker, A.R.; Simpson, J.R.; Chun, J.; Obrzut, J.; Bajpai, V.; Phelan, F.R.; et al. Carbon Nanotubes: Measuring Dispersion and Length. Adv. Mater. 2011, 23, 338–348. [Google Scholar] [CrossRef] [PubMed]
  12. Itkis, M.E.; Perea, D.E.; Niyogi, S.; Richard, S.M.; Hamon, M.A.; Hu, H.; Zhao, B.; Haddon, R.C. Purity Evaluation of As-Prepared Single-Walled Carbon Nanotube Soot by Use of Solution-Phase Near-IR Spectroscopy. Nano Lett. 2003, 3, 309–314. [Google Scholar] [CrossRef]
  13. Wang, D.; Chen, L. Temperature and pH-Responsive Single-Walled Carbon Nanotube Dispersions. Nano Lett. 2007, 7, 1480–1484. [Google Scholar] [CrossRef] [PubMed]
  14. Nepal, D.; Geckeler, K.E. pH-Sensitive Dispersion and Debundling of Single-Walled Carbon Nanotubes: Lysozyme as a Tool. Small 2006, 2, 406–412. [Google Scholar] [CrossRef] [PubMed]
  15. Chen, S.; Jiang, Y.; Wang, Z.; Zhang, X.; Dai, L.; Smet, M. Light-Controlled Single-Walled Carbon Nanotubes Dispersions in Aqueous Solution. Langmuir 2008, 24, 9233–9236. [Google Scholar] [CrossRef] [PubMed]
  16. Nobusawa, K.; Ikeda, A.; Kikuchi, J.; Kawano, S.; Fujita, N.; Shinkai, S. Reversible Solubilization and Precipitation of Carbon Nanotubes through Oxidation-Reduction Reactions of a Solubilizing Agent. Angew. Chem. Int. Ed. 2008, 47, 4577–4580. [Google Scholar] [CrossRef] [PubMed]
  17. Liang, S.; Chen, G.; Peddle, J.; Zhao, Y. Reversible Dispersion and Releasing of Single-Walled Carbon Nanotubes by Stimuli-Responsive TTFV-Phenylacetylene Polymers. Chem. Commun. 2012, 48, 3100–3102. [Google Scholar] [CrossRef] [PubMed]
  18. Ding, Y.; Chen, S.; Xu, H.; Wang, Z.; Zhang, X.; Ngo, T.H.; Smet, M. Reversible Dispersion of Single-Walled Carbon Nanotubes Based on a CO2-Responsive dispersant. Langmuir 2010, 26, 16667–16671. [Google Scholar] [CrossRef] [PubMed]
  19. Zhang, Z.; Che, Y.; Smaldone, R.A.; Xu, M.; Bunes, B.R.; Moore, J.S.; Zang, L. Reversible Dispersion and Release of Carbon Nanotubes Using Foldable Oligomers. J. Am. Chem. Soc. 2010, 132, 14113–14117. [Google Scholar] [CrossRef] [PubMed]
  20. Niyogi, S.; Boukhalfa, S.; Chikkannanavar, B.; McDonald, T.J.; Heben, M.J.; Doorn, S.K. Selective Aggregation of Single-Walled Carbon Nanotubes via Salt Addition. J. Am. Chem. Soc. 2007, 129, 1898–1899. [Google Scholar] [CrossRef] [PubMed]
  21. Niyogi, S.; Densmore, C.G.; Doorn, S.K. Electrolyte Tuning of Surfactant Interfacial Behavior for Enhanced Density-Based Separation of Single-Walled Carbon Nanotubes. J. Am. Chem. Soc. 2009, 131, 1144–1153. [Google Scholar] [CrossRef] [PubMed]
  22. Fedorov, M.V.; Arif, R.N.; Frolov, A.I.; Kolar, M.; Romanova, A.O.; Rozhin, A.G. Salting out in Organic Solvents: A New Route to Carbon Nanotube Bundle Engineering. Phys. Chem. Chem. Phys. 2011, 13, 12399–12402. [Google Scholar] [CrossRef] [PubMed]
  23. Campbell, J.F.; Tessmer, I.; Holden Thorp, H.; Erie, D.E. Atomic Force Microscopy Studies of DNA–Wrapped Carbon Nanotube Structure and Binding to Quantum Dots. J. Am. Chem. Soc. 2008, 130, 10648–10655. [Google Scholar] [CrossRef] [PubMed]
  24. Saleh, N.B.; Pfefferle, L.D.; Elimelech, M. Aggregation Kinetics of Multiwalled Carbon Nanotubes in Aquatic Systems: Measurements and Environmental Implications. Environ. Sci. Technol. 2008, 42, 7963–7969. [Google Scholar] [CrossRef] [PubMed]
  25. Bouchard, D.; Zhang, W.; Powell, T.; Rattanaudompol, U. Aggregation Kinetics and Transport of Single-Walled Carbon Nanotubes at Low Surfactant Concentrations. Environ. Sci. Technol. 2012, 46, 4458–4465. [Google Scholar] [CrossRef] [PubMed]
  26. Ju, L.; Zhang, W.; Wang, X.; Hu, J.; Zhang, Y. Aggregation Kinetics of SDBS-Dispersed Carbon Nanotubes in Different Aqueous Suspensions. Colloids Surf. A 2012, 409, 159–166. [Google Scholar] [CrossRef]
  27. Sano, M.; Okamura, J.; Shinkai, S. Colloidal Nature of Single-Walled Carbon Nanotubes in Electrolyte Solution: The Schulze-Hardy Rule. Langmuir 2001, 17, 7172–7173. [Google Scholar] [CrossRef]
  28. Forney, M.W.; Anderson, J.S.; Ameen, A.L.; Poler, J.C. Aggregation Kinetics of Single-Walled Carbon Nanotubes in Nonaqeous Solvents: Critical Coagulation Concentrations and Transient Dispersion Stability. J. Phys. Chem. C 2011, 115, 23267–23272. [Google Scholar] [CrossRef]
  29. Koh, B.; Cheng, W. Mechanisms of Carbon Nanotube Aggregation and the Reversion of Carbon Nanotube Aggregates in Aqueous Medium. Langmuir 2014, 30, 10899–10909. [Google Scholar] [CrossRef] [PubMed]
  30. Korolev, N.; Berezhnoy, N.V.; Eom, K.D.; Tam, J.P.; Nordenskiöld, L. A Universal Description for the Experimental Behavior of Salt-(In)dependent Oligocation-Induced DNA Condensation. Nucleic Acids. Res. 2009, 37, 7137–7150. [Google Scholar] [CrossRef] [PubMed]
  31. Korolev, N.; Lyubartsev, A.P.; Nordenskiöld, L. Cation-Induced Polyelectrolyte-Polyelectrolyte Attraction in Solutions of DNA and Nucleosome Core Particles. Adv. Colloid Interface Sci. 2010, 158, 32–47. [Google Scholar] [CrossRef] [PubMed]
  32. Giordano, A.N.; Chaturvedi, H.; Poler, J.C. Critical coagulation concentrations for carbon nanotubes in nonaqueous solvent. J. Phys. Chem. C 2007, 111, 11583–11589. [Google Scholar] [CrossRef]
Figure 1. Kinetics of SWCNT aggregation induced by the addition of CaCl2 for (a) SWCNT/30-mer DNA, (b) SWCNT/200-mer DNA, (c) SWCNT/calf thymus DNA and (d) SWCNT-COOH. Error bars represent the standard deviation from 3 independent repeats of the same experiments.
Carbon 02 00006 g001
Figure 2. Side-by-side comparison of the kinetics of SWCNT aggregation monitored at discrete time points after the addition of 2 mM (a) CaCl2 and (b) MgCl2. Error bars represent the standard deviation from 3 independent repeats of the same experiments.
Carbon 02 00006 g002
Figure 3. The kinetics of SWCNT aggregation monitored in real time upon the addition of 2 mM CaCl2 to SWCNTs dispersed with 30-mer, 200-mer or calf thymus DNA and SWCNT-COOH. Average values of light scattering from three independent repeats of the same experiments are shown in the graph.
Carbon 02 00006 g003
Figure 4. Kinetics of SWCNT aggregation monitored by AFM imaging. (a) AFM images of SWCNT/30-mer DNA after the designated time of incubation with CaCl2. (b,c), SWCNT height (b) and length (c) changes upon incubation with CaCl2. Each data point in (b) and (c) represents the average height and length after the designated incubation time, from 89, 72, 53 and 78 samples for SWCNT/30-mer DNA, SWCNT/200-mer DNA, SWCNT/calf thymus DNA and SWCNT-COOH, respectively. Error bars represent the standard deviation from three independent repeats of the same experiments.
Carbon 02 00006 g004
Figure 5. Kinetics of SWCNT aggregation induced by oligopeptides. (a) The growth of SWCNT aggregates depends on agitation time with the oligopeptide (b) time courses of SWCNT aggregation upon the addition of the oligopeptide, KA8K. Error bars represent the standard deviation from three independent repeats of the same experiments.
Carbon 02 00006 g005
Figure 6. The dependence of SWCNT aggregation on KCl concentration. The EC50 values derived from SWCNT aggregation curves as a function of KCl concentration are plotted for SWCNT/30-mer DNA (a) and SWCNT-COOH (b), respectively.
Carbon 02 00006 g006
Table 1. Zeta potentials on individually-dispersed SWCNTs. Errors represent the standard deviation from 3 independent repeats of the same experiments.
SWCNT/30-mer DNASWCNT/200-mer DNASWCNT/Calf Thymus DNASWCNT-COOH
Zeta Potential (mV)−37.7 ± 8.8−38.9 ± 9.3−40.1 ± 7.6−48.9 ± 11.2

