Preparation of Synthesis Gas from CO2 for Fischer–Tropsch Synthesis—Comparison of Alternative Process Configurations


VTT Technical Research Centre of Finland Ltd., P.O. Box 1000, FI-02044 VTT Espoo, Finland
*
Author to whom correspondence should be addressed.
C 2020, 6(3), 55; https://0-doi-org.brum.beds.ac.uk/10.3390/c6030055
Submission received: 21 August 2020
/
Revised: 15 September 2020
/
Accepted: 16 September 2020
/
Published: 18 September 2020
(This article belongs to the Special Issue CO2 Capture and Valorization)
Abstract
:We compare different approaches for the preparation of carbon monoxide-rich synthesis gas (syngas) for Fischer–Tropsch (FT) synthesis from carbon dioxide (CO2) using a self-consistent design and process simulation framework. Three alternative methods for suppling heat to the syngas preparation step are investigated, namely: allothermal from combustion (COMB), autothermal from partial oxidation (POX) and autothermal from electric resistance (ER) heating. In addition, two alternative design approaches for the syngas preparation step are investigated, namely: once-through (OT) and recycle (RC). The combination of these alternatives gives six basic configurations, each characterized by distinctive plant designs that have been individually modelled and analyzed. Carbon efficiencies (from CO2 to FT syncrude) are 50–55% for the OT designs and 65–89% for the RC designs, depending on the heat supply method. Thermal efficiencies (from electricity to FT syncrude) are 33–41% for configurations when using low temperature electrolyzer, and 48–59% when using high temperature electrolyzer. Of the RC designs, both the highest carbon efficiency and thermal efficiency was observed for the ER configuration, followed by POX and COMB configurations.
Keywords:
CCU; CO2 utilization; electrofuels; power-to-fuels; synfuels; reforming; rWGS; POX; resistance heating; Fischer–Tropsch1. Introduction
The global transportation energy use is currently dominated by fossil fuels, whose combustion releases annually over 7 Gt of carbon dioxide (CO2), adding to the greenhouse gas effect [1]. As the world’s governments strive to meet the ambitious targets of the Paris Agreement, decarbonization of transport will present particular challenges [2]. Deep reductions in transport emissions can be accomplished by decarbonizing vehicle technologies, fuels or both, but tight coupling between the vehicle fleet and refueling infrastructure presents major impediment for any large-scale introduction of sustainable alternatives.
Major breakthroughs have taken place in electric mobility, where electric car sales have grown annually by over 40% for several years. In 2019, the global market share of newly registered electric vehicles (EVs) reached a new record of 2.6%. However, the global EV stock only recently exceeded seven million units in circulation, and currently represents 1% of the global car stock. In the IEA’s sustainable development scenario (SDS), 13% of the global car fleet is electric by 2030, requiring annual average growth of 36% per year between 2019 and 2030. [3].
Biofuels have been promoted as one possible solution to decarbonize transport. Global biofuel production was 96 Mtoe in 2019 and is forecasted to pass the 100 Mtoe mark in 2020, representing 4% share of the world’s road transport fuel demand [3]. The production of biofuels is currently dominated by “first generation” fuel ethanol from corn and sugarcane. In Europe, the attention has shifted towards “advanced” biofuels derived from non-edible lignocellulosic residues and wastes, as they can potentially offer significant volumes of sustainable fuels while avoiding many concerns associated with first-generation biofuels [4]. The commercialization of advanced biofuels has been slow, however, and a twenty-five-fold scale-up in production would be necessary over 2020–25 to achieve 1.6 EJ contribution to the 2 °C scenario in 2025 [5].
Substantial reductions in the cost of wind and solar power during the past decade have created interest towards the production of sustainable fuels via chemical conversion of CO2 and water, using electricity to drive the process [6,7,8,9]. Interest in such “electrofuels” is also motivated by the increased penetration of variable renewable energy (VRE) sources in the electricity grid, which has led to low or even negative power prices (e.g., in Germany) for short periods of time and created demand for balancing services [10]. Interest in electrofuels is also tied to the potential for using large volumes of CO2 [11]. When coupled with carbon-free energy, CO2 conversion to fuels is promoted as a climate change mitigation measure, as it would reduce the need to unearth and burn fossil carbon resources [12]. In many countries, discussions have largely shifted from carbon capture and storage (CCS) to carbon capture utilization and storage (CCUS), but implications of such a shift are only slowly being debated and the potential scale of utilization has been questioned [13].
A large number of techno-economic studies of CO2-to-fuel processes are available in the literature [14]. As electrofuel technologies are still emerging and some process steps remain in the R&D phase, cost levels are currently uncertain. A very broad range of cost estimates from as low as 10 up to as high as to 3500 €2015/MWh (methane 10–640, methanol 60–400, DME 110–170, FT-liquids 50–3500, and petrol 190–590) have been reported in the literature for different electrofuel pathways [14]. The wide range of estimates can be attributed to varying assumptions on the future cost of electrolyzers, electrolyzer stack life and the cost of low-carbon electricity. When operating with high availabilities, the most important factors affecting production costs are the cost of electricity, the electrolyzer capital costs, and stack life. When operating at low capacity factors, the role of plant investment cost becomes more pronounced [15].
As of May 2018, 128 R&D projects have been realized or finished in Europe [16]. The main application of these projects has been the injection of hydrogen or methane into the natural gas grid for storing electricity from variable renewable energy sources. Producing sustainable fuels for transport is another important application where the focus has been on synthetic methane or methanol, and both applications have already seen a megawatt-scale demonstration. A plant in Iceland produces methanol using CO2 and electricity that are both derived from geothermal sources [17]. The production began in 2011, but in 2015 the capacity was expanded from 1.3 to 5 million liters of methanol per year. A similarly sized plant in Germany converts CO2 from a co-located biogas facility to methane with electricity from the grid. The plant began production in 2014 and uses roughly 6 MW of electricity to produce 3.2 MW of synthetic methane [18].
Although hydrogen, methane and methanol are all globally used commodities, their use in transport is impeded by distribution and vehicle-related barriers. Such barriers could be overcome by focusing on the production of “drop-in” transport fuels, i.e., synthetic fuel replacements for fossil diesel, kerosene and petrol. These fuels can be produced via the well-known Fischer–Tropsch (FT) reaction. However, the FT reaction requires carbon monoxide (CO) as reactant instead of CO2, and therefore a CO-rich synthesis gas (syngas) needs to be prepared from CO2 prior to feeding the FT reactor. Several alternative process configurations can be envisioned for the preparation of syngas from CO2, and it is currently unclear what approach delivers the highest efficiency and the lowest cost, considering the overall process.
The aim of this paper is to investigate and compare alternative concepts that prepare syngas from CO2 and H2 for Fischer–Tropsch synthesis. Six basic configurations, characterized by distinctive plant designs, are analyzed based on mass and energy balances, using a self-consistent design and process simulation framework.
2. Technology Overview
The production of liquid hydrocarbons from CO2 requires essentially five technological steps: CO2 capture, water electrolysis, syngas preparation, FT synthesis, and refining of the FT syncrude. Most of the needed technologies are well known and already widely used in various industrial applications. However, synthesis gas preparation from CO2 currently has a low technology readiness level. A fully integrated process is also yet to be demonstrated on a commercial scale, although pilot projects have been announced [19,20,21]. The following sections provide a short overview of these key component technologies.
2.1. Water Electrolysis
Hydrogen can be produced by passing an electric current through two electrodes immersed in water. In the process, water molecules are split to produce oxygen and hydrogen according to the following overall reaction:
2H2O(l) → 2H2(g) + O2(g) ∆H = 285.83 kJ/mol.
The most established and commercially available technology is based on alkaline electrolyzers (AEC), while proton exchange membrane (PEM) electrolysis and solid-oxide electrolysis cells (SOEC) are examples of more advanced and emerging systems [22]. AEC and PEM electrolyzers both use liquid water as feedstock and operate at 50–90 °C temperature with 46–60% nominal system efficiencies (based on hydrogen’s lower heating value, LHV). SOEC electrolyzers operate at 700–900 °C temperature with 76–81% efficiency when water is fed to the system in liquid form [23].
The product hydrogen and oxygen can both be assumed to be of 100% purity due to the very low concentration of contaminants in the feedstock water. In this work, we use 60% nominal system efficiency for the AEC and PEM technologies, and 90% for the SOEC technology. In the latter case, it is assumed that water is fed to the electrolysis as steam, which is generated by recovering heat from the Fischer–Tropsch exotherm. In this way, electricity is not needed for the vaporization of water, contributing to improved nominal system efficiency.
2.2. Synthesis Gas Preparation
The preparation of syngas traditionally involves reactions between an oxidizing agent and a carbonaceous feedstock under elevated temperature to form a mixture of hydrogen, carbon monoxide, carbon dioxide, and unconverted reactants. Their relative concentrations at the reactor outlet are governed by the water-gas shift (WGS) reaction:
CO + H2O ↔ CO2 + H2 ∆H = −41.2 kJ/mol.
For the preparation of syngas from CO2 and H2, however, the reverse of reaction (2) is needed to form CO. Such reverse water-gas shift (rWGS) reaction appears as a prominent candidate technology for converting CO2 to CO, as competing technologies suffer from low rates (photocatalysis) and high capital investments (solar-thermo-chemical cycles) [24].
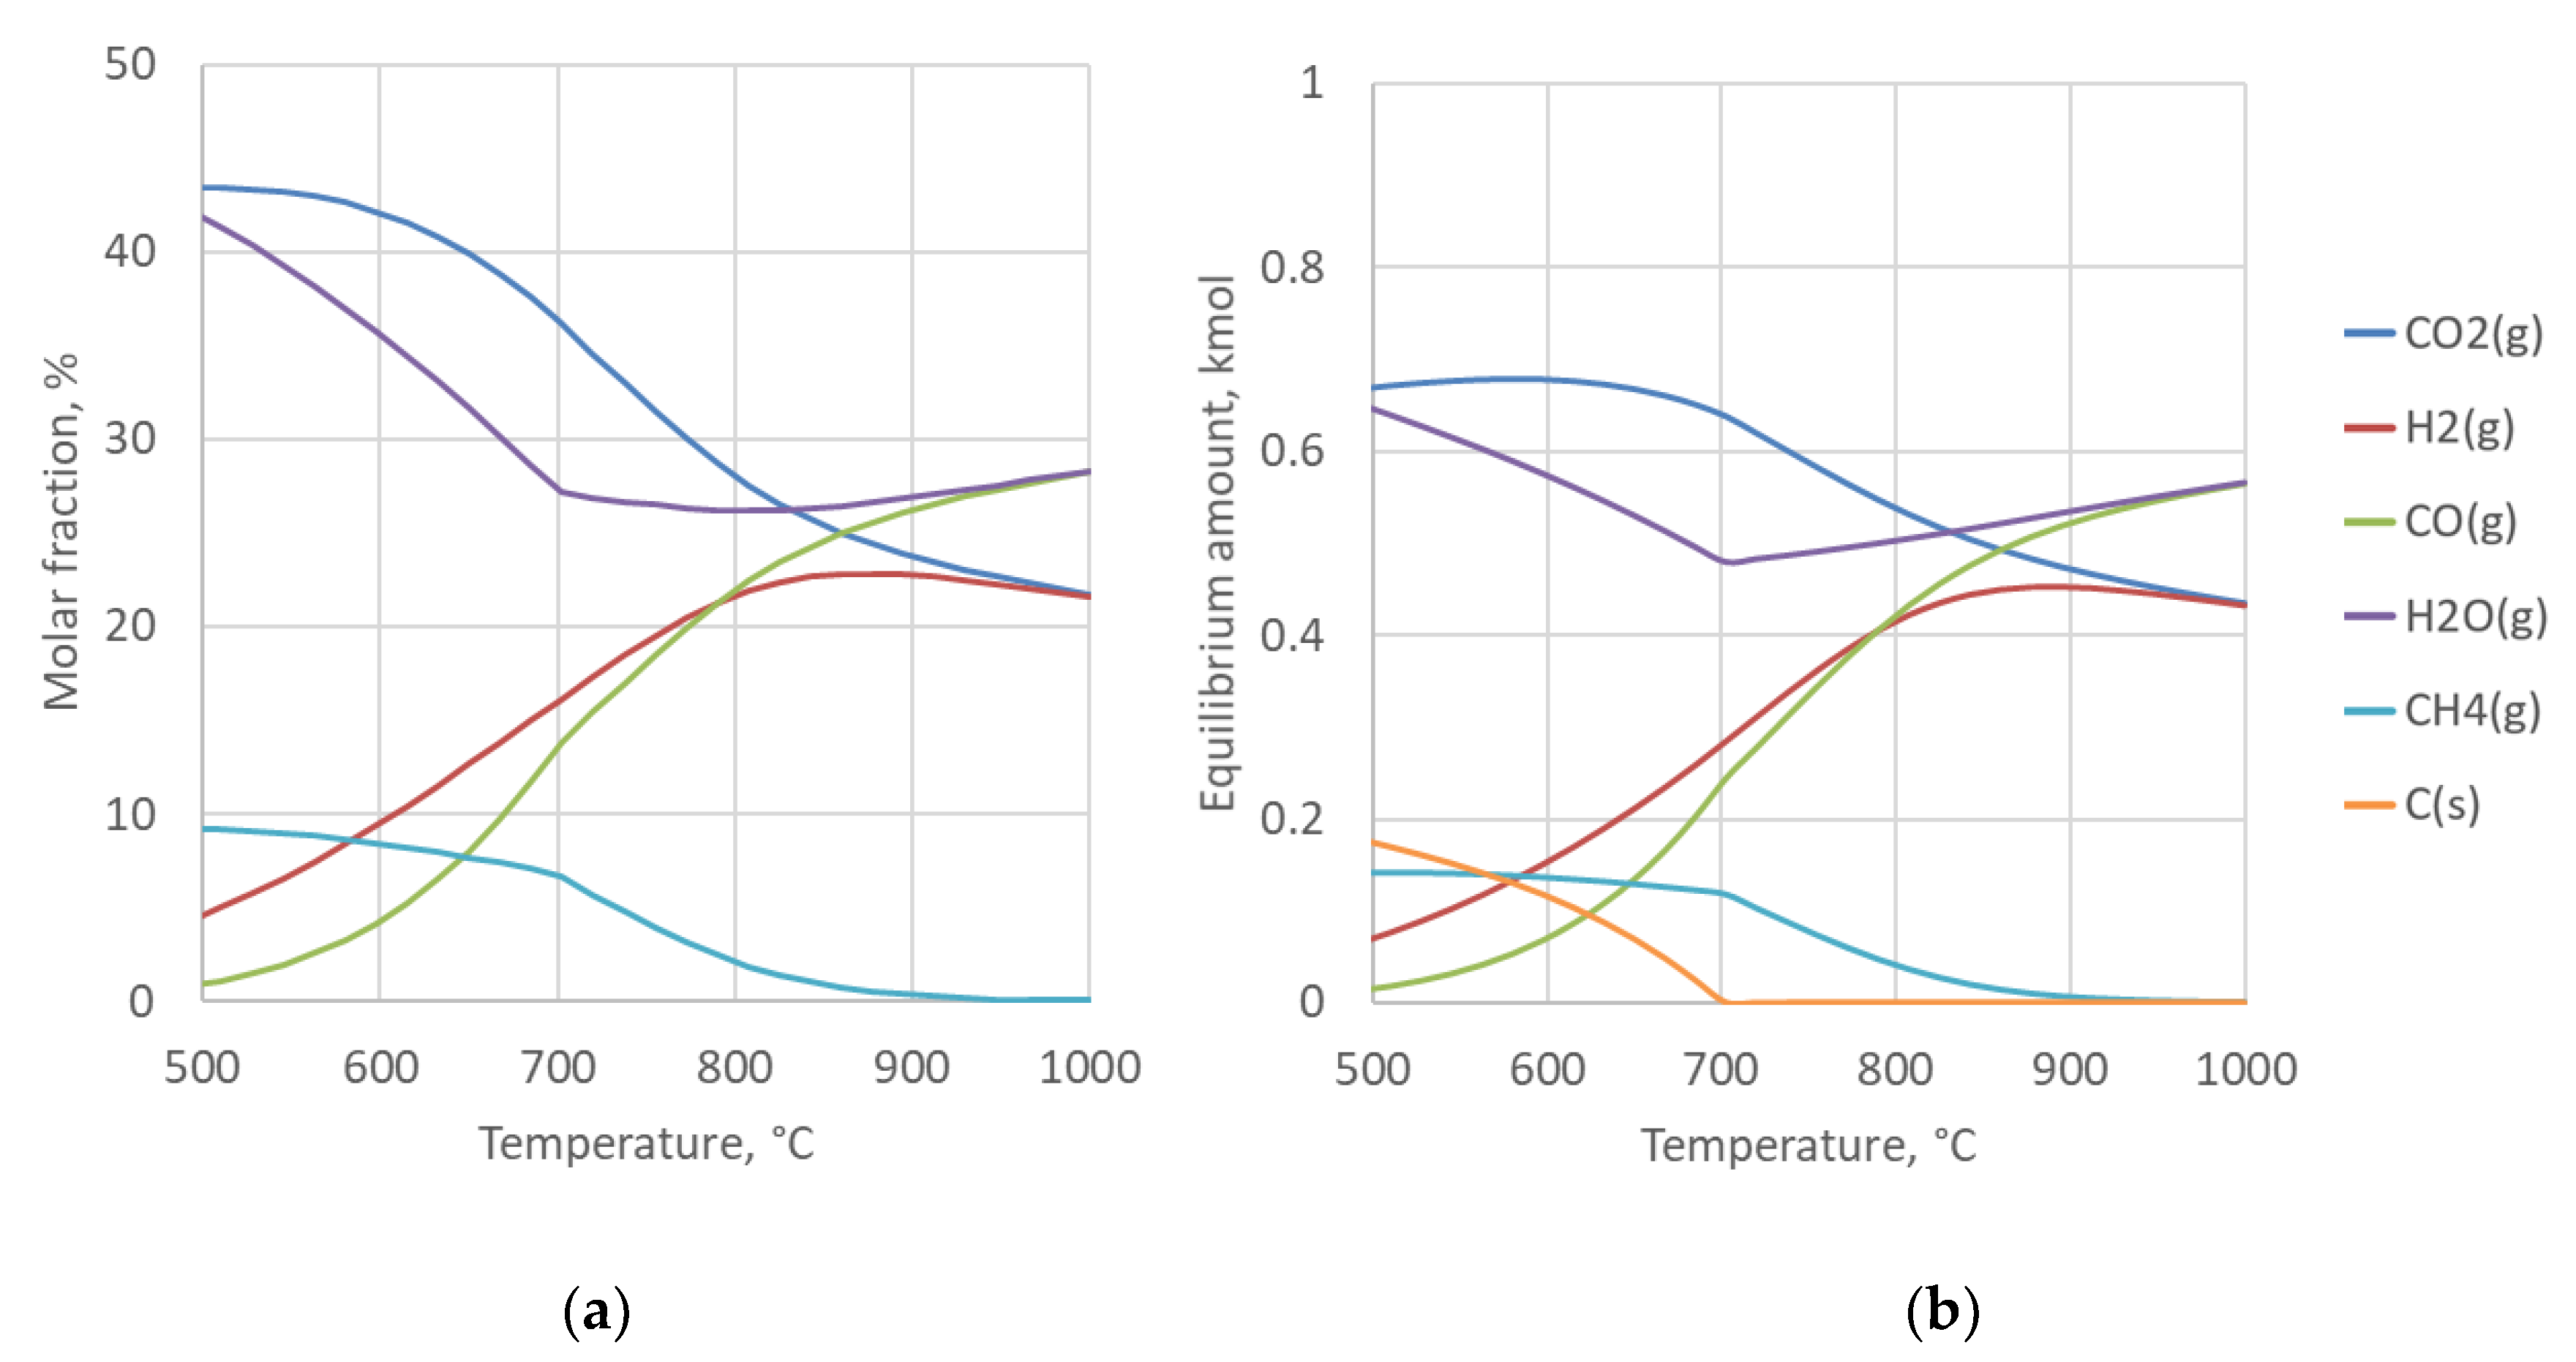
The rWGS reaction is thermodynamically favored at high temperatures. When the reactor is operated at atmospheric pressure and below 600 °C, methanation reaction (3) will also occur and the formation of solid carbon is possible via reactions (4) and (5) [25]. As the downstream FT synthesis is operated at 20 bar pressure, it is practical to also pressurize the rWGS reactor as significant savings can be obtained by compressing CO2 instead of the synthesis gas [26]. However, at higher pressures more methane is produced at a given temperature, which has an impact on the overall energy balance of the process. At 20 bar pressure the carbon formation limit also increases to 700 °C, as illustrated by thermodynamic calculations in Figure 1.
CO + 3H2 ↔ CH4 + H2O ∆H < 0
2CO ↔ C + CO2 ∆H > 0
CH4 ↔ C + 2H2 ∆H < 0
When FT off-gases are recycled in front of the syngas preparation reactor, it operates similarly to a steam reformer, i.e., hydrocarbons in the off-gas are steam (and dry) reformed to syngas components. The presence of hydrocarbons in the reactor further increases the temperature limit under which carbon is formed. This again favors choosing a high operation temperature for the reactor, e.g., 800–900 °C.
Several supported metal catalysts have been studied for use in rWGS, such as Ni, Pt, and Rh, in addition to Cu at low temperature [24]. Out of these catalysts, Ni and Rh have been successfully used in both steam reforming and partial oxidation of hydrocarbons containing gas [27]. The rWGS reaction mechanism is specific to the catalyst used.
To comply with the stoichiometric requirements of the FT reaction, a synthesis gas with a molar H2/CO ratio of about 2.0 should be aimed at when using cobalt-based FT catalyst. With iron-based FT catalyst, a lower ratio can be accepted at the FT reactor inlet as iron also catalyzes the WGS reaction. The H2/CO ratio can be controlled via reaction (2) by adjusting the reactor temperature and the extent of hydrogen supply into the reactor.
2.3. Fischer–Tropsch Synthesis
Hydrocarbons can be synthesized from carbon monoxide and hydrogen via the Fischer–Tropsch reaction:
where (CH2) represents a product segment of mainly paraffinic hydrocarbons of variable chain lengths [28]. This raw product from the FT synthesis, called syncrude, is recovered from the reactor effluent and refined to produce marketable hydrocarbon liquids. In addition to fuels, raw materials for various products in the chemical industry can also be produced, such as base oils, paint resins, cosmetics and detergents.
CO + 2H2 → (CH2) + H2O ∆H = −165 kJ/mol,
The product distribution obeys a relationship called the Anderson-Schulz-Flory-distribution (ASF-distribution), which can be described using a simple statistical model that predicts a linear relation between the logarithm of the molar amount of a paraffin and its carbon number [29]. According to Anderson [30], the mathematic expression can be written as:
where Cn is the mole fraction of a hydrocarbon with chain length n and chain growth probability α independent of n. The α determines the total carbon number distribution of FT products and its range depends on the reaction conditions and catalyst type, which can be designed and controlled with a specific refining objective in mind [31].
Cn = (1 − α) × αn−1 ΔH < 0,
The implication of the ASF-distribution is that the FT process will yield either large amounts of gaseous hydrocarbons, such as methane or products that have a very wide carbon number distribution. In addition to light gases, the only product fraction that can be produced with high selectivity is heavy paraffin wax. Therefore, to produce desired fractions that boil in specific ranges such as petrol, kerosene or gas oil, the wax needs to be upgraded. This can be accomplished by selectively hydrocracking the heaviest compounds into narrow-carbon-number fractions [32].
Out of the most common catalyst metals for Fischer–Tropsch (Fe, Co, Ni and Ru), only iron and cobalt are available today for industrial application. Iron catalysts are more sensitive to H2O partial pressure than cobalt catalysts, thus industrial reactors with an iron catalyst are operated at low conversion levels [33]. Cobalt catalysts are used when the objective is to maximize the yield of the C5+ fraction and minimize the amount of olefins. Cobalt, unlike iron, does not catalyze water-gas shift reaction (2), thus the H2/CO ratio at the inlet of the FT reactor needs to be already close to the stoichiometric requirement.
As the FT reaction is highly exothermic, efficient removal of heat is essential in the design of the reactor. In general, three types of reactor design have been commercially used: fixed-bed reactor, fluidized-bed reactor, and slurry-bed reactor. Fluidized-bed reactors were developed for high temperature (>320 °C) FT synthesis to produce low molecular gaseous hydrocarbons and petrol. However, to maximize high molecular weight linear alkanes, lower temperatures (<250 °C) are needed [34]. Fixed-bed reactors were originally used for this purpose, but slurry-bed reactors are nowadays considered state-of-the-art technology due to their better temperature control and higher conversion [35]. However, for smaller scales, fixed-bed microchannel reactor designs are currently being offered and operated at around 20 bar and 200 °C conditions, which we have adopted as a basis for our own FT design [36].
Pressure mainly affects productivity, while changes in the composition of the syngas during synthesis affect the products and are involved in the deactivation of the catalyst [34]. The Fischer–Tropsch reaction (3) produces water as a by-product. Some water can also enter the reactor with syngas, if the gas is not dried upstream. The overall impact of water on the cobalt catalyst has been studied widely, and is shown to depend on the catalyst support, pore size and active metal particle size [37]. In the examined configurations, an FT catalyst that tolerates water is assumed and therefore the syngas does not require being dried before feeding to the reactor.
Downstream from the FT reactor, the produced syncrude (C5+ fraction) is recovered by condensation while lighter products (C1–C4) and unconverted syngas can be either combusted or recycled back to the synthesis reactor to maximize the overall yield to C5+ fraction. The aqueous product fraction (recovered during condensation) contains water and a small amount of oxygenated hydrocarbon residues, and is treated as wastewater.
3. Materials and Methods
3.1. Plant Configurations
All plant configurations analyzed in this work feature the preparation of CO-rich syngas from CO2 and electrolytic hydrogen, followed by subsequent catalytic conversion to Fischer–Tropsch syncrude. From the process design perspective, relevant design choices regarding syngas preparation pertain both to its placement in the process chain and the method of heat supply. In this work, we consider three approaches for providing heat to the syngas preparation step:
- Allothermal from combustion;
- Autothermal from partial oxidation;
- Autothermal from electric resistance.
In addition to two approaches related to the placement of the syngas preparation step:
- once-through design (i.e., placement outside the FT recycle loop);
- recycle design (i.e., placement inside the FT recycle loop).
The combination of these alternatives gives six basic configurations, each characterized by distinctive plant designs that are summarized in Table 1. Each process configuration is modelled individually using ASPEN Plus® (Aspen) process simulation software. Design assumptions and modelling parameters related to the process configurations are discussed in the following sections.
3.1.1. Designs Based on Allothermal Heating from Combustion (OT-COMB and RC-COMB)
The syngas preparation step in the OT-COMB and RC-COMB designs is heated allothermally from combustion. The reactions take place in tubes that are packed with catalyst and placed inside a furnace. Heat from combustion is transferred through the tubes and the remaining heat is recovered from flue gas via heat exchange.
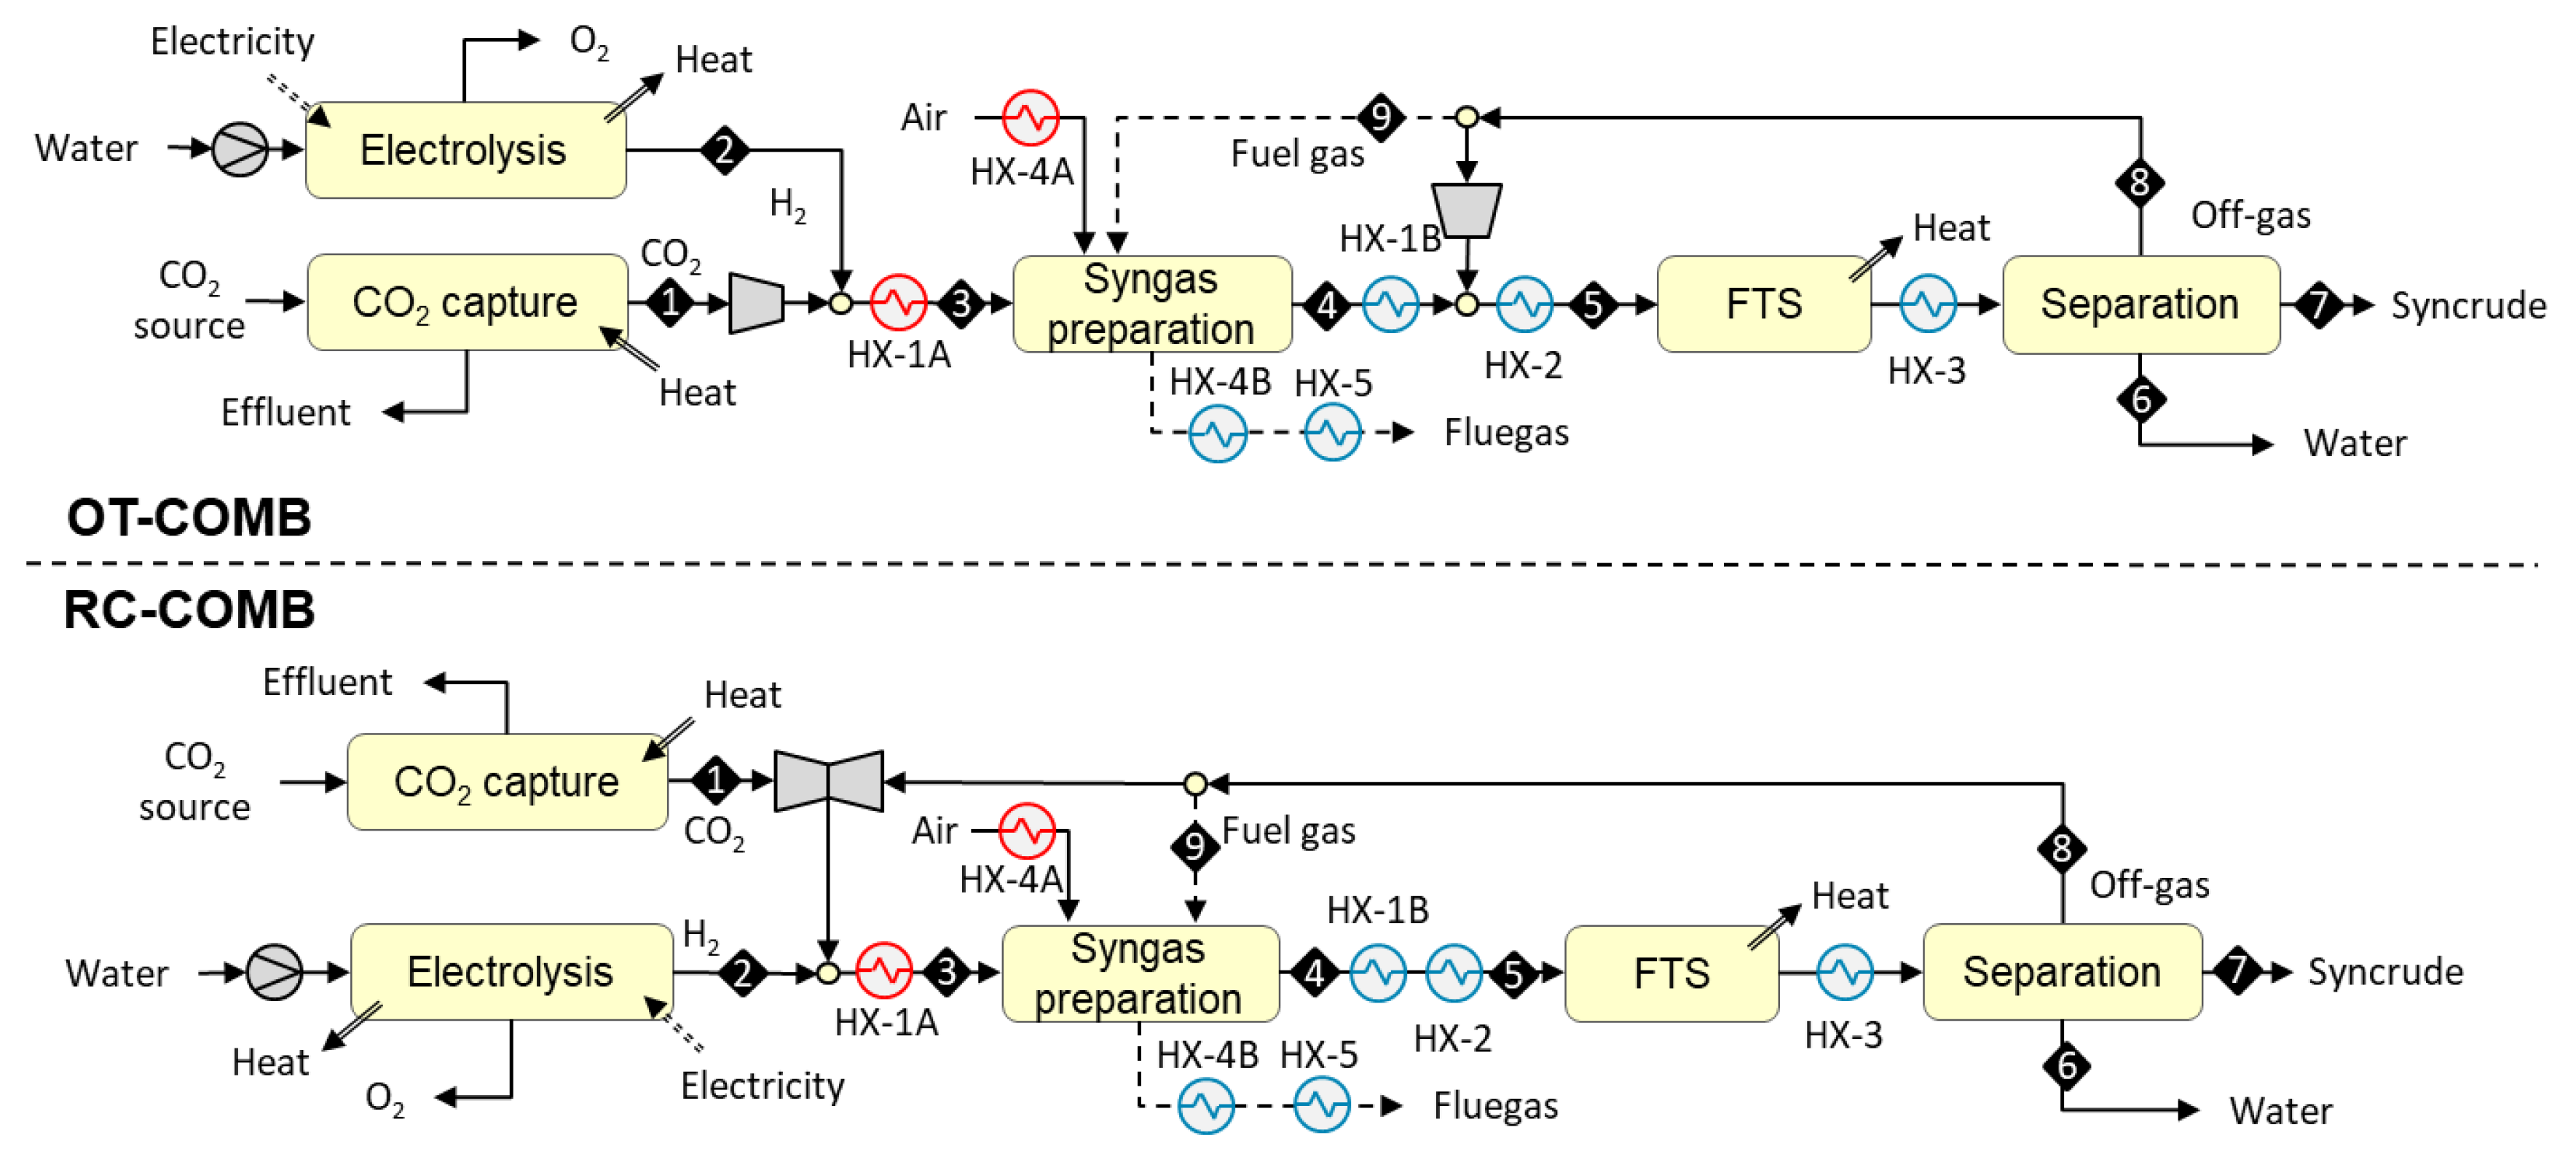
In the OT-COMB design, syngas is prepared outside the FT recycle loop (see upper part of Figure 2). The process begins with the compression of a concentrated stream of carbon dioxide [stream 1 in the figure] to 20 bar, admixing with hydrogen [S2] from 20 bar electrolysis, and preheating [HX-1A] to 550 °C. The mixture [S3] is then fed to a catalytic syngas preparation reactor operating at 900 °C, where the reverse of reaction (2) and a minor formation of methane via reaction (3) will take place. The required heat is supplied indirectly by combusting part of the FT off-gas [9] in the reactor furnace. The remaining sensible heat in the flue gas is used to preheat combustion air [HX-4A and HX-4B] to 200 °C, followed by further cooling of flue gas [HX-5] to 150 °C. The hot CO-rich reaction products [S4] (syngas) are cooled [HX-1B] against the feed stream and mixed with the surplus (remaining after use as fuel gas) FT off-gas. The combined stream is cooled down [HX-2] to 200 °C and conveyed to an FT reactor where it [S5] is catalytically converted to a mixture of paraffinic hydrocarbons. The mixture is cooled down [HX-3] to 40 °C and both the reaction water [S6] and C5+ hydrocarbon fraction [S7] (syncrude) are recovered via condensation. Part of the gaseous fraction [S8] (unconverted syngas and C1–C4 hydrocarbons) is used as fuel gas [S9], and the surplus is recycled back into the FT reactor.
The disadvantage of the OT-COMB design is that in the absence of recycling, an equilibrium-limited shift reaction leads to incomplete conversion of CO2 during the syngas preparation step. In the RC-COMB design (see lower part of Figure 2), this problem is solved by placing the syngas preparation step inside the FT recycle loop, thus allowing the recirculation of unconverted CO2 back to syngas preparation. In addition to CO2, the recycle gas includes the C1–C4 hydrocarbon fraction (off-gas) from syncrude recovery. These hydrocarbons are converted in the syngas preparation reactor according to the dry reforming reaction (8), alongside with the reverse of reaction (2).
[CmHn] + m CO2 ↔ 2m CO + n/2 H2 ΔH > 0
The RC-COMB process begins with the compression of a concentrated stream of carbon dioxide [S1] to 20 bar, followed by admixing with surplus (remaining after use as fuel gas) FT off-gas, and hydrogen [S2] from 20 bar electrolyzer. The mixture is preheated [HX-1A] to 550 °C and fed [S3] to a catalytic syngas preparation reactor operating at 900 °C. The required heat is supplied indirectly by combusting part of the FT off-gas [S9] in the reactor furnace. The remaining sensible heat in the flue gas is used to preheat combustion air [HX-4A and HX-4B] to 200 °C, followed by further cooling of flue gas [HX-5] to 150 °C. The hot CO-rich syngas [S4] is cooled down [HX-1B and HX-2] to 200 °C and conveyed to an FT rector where it [S5] is catalytically converted to a mixture of hydrocarbons. The mixture is cooled down [HX-3] to 40 °C and both the reaction water [S6] and C5+ hydrocarbon fraction [S7] are recovered via condensation. The remaining gaseous fraction [S8] is partly used as fuel gas [S9], and the surplus is recycled back in front of the syngas preparation reactor.
3.1.2. Designs Based on Autothermal Heating from Partial Oxidation (OT-POX and RC-POX)
The syngas preparation step in the OT-POX and RC-POX designs is heated autothermally from partial oxidation. The reactions take place in a tube reactor packed with catalyst. Heat is introduced by feeding oxygen with other feed gases that result in partial combustion of the feed. In the case of once-through design, the reverse of reaction (2) is catalyzed and hydrogen, being the only feed component available for combustion, is partially oxidized according to reaction:
H2 + 1/2 O2 → H2O ΔH < 0.
In the case of recycle design, hydrocarbons from the downstream FT synthesis are also present in the syngas preparation step where the reverse of reaction (2) is catalyzed, and hydrocarbons are partially oxidized to syngas according to reaction (10). In addition, CO2 reforming reaction (8) and steam reforming reaction (11) may take place when water is formed via reaction (9) or reverse of reaction (2). At high temperatures, hydrocarbons can undergo direct thermal cracking (12) and carbon forming reactions (13), which should be minimized to ensure trouble-free operation of the reactor. As reactions 10–13 are all endothermic, the role of hydrogen oxidation (9) is to supply the needed heat for the overall system.
[CmHn] + m/2 O2 ↔ m CO + n/2 H2 ΔH < 0
[CmHn] + m H2O ↔ m CO + (n/2+m) H2 ΔH < 0
[CmHn] → CxHy + zH2 ΔH < 0
[CmHn] → Cx + zH2 ΔH < 0
The POX reactors benefit from the elimination of expensive heat transfer surfaces of allothermally-heated reactors, but expensive oxygen is needed for the combustion instead of air to avoid the introduction of nitrogen diluent into the process. In the examined POX-configurations, however, oxygen is “freely” available from the electrolyzer as a by-product of hydrogen production, and can be utilized in the POX-reactor at a low cost if no other valuable use for the oxygen can be identified.
In the OT-POX design, syngas is prepared outside the FT recycle loop (see upper part of Figure 3). The process begins with the compression of a concentrated stream of carbon dioxide [S1] to 20 bar, followed by admixing with oxygen from a 20 bar electrolyzer. Hydrogen from the electrolyzer and the mixture of carbon dioxide and oxygen are both preheated [HX-1A] to 550 °C before they [S2 and S3] are fed to a catalytic syngas preparation reactor operating at 900 °C. The hot CO-rich reaction products [S4] are cooled [HX-1B] against the feed stream and mixed with the FT off-gas. The combined stream is cooled down [HX-2] to 200 °C and conveyed to an FT reactor where it [S5] is catalytically converted to a mixture of paraffinic hydrocarbons. The mixture is cooled down [HX-3] to 40 °C and both the reaction water [S6] and C5+ hydrocarbon fraction [S7] are recovered via condensation. The gaseous fraction [S8] is fully recycled back into the FT reactor, as there is no need for fuel gas. To avoid the build-up of inerts in the recycle loop, a small amount of gas (containing 2% of the inlet hydrogen) is continuously purged from the loop. The purge gas [S9] can be used as fuel in a possibly co-located process.
In the RC-POX design, syngas is prepared inside the FT recycle loop (see lower part of Figure 3). The process begins with the compression of a concentrated stream of carbon dioxide [S1] to 20 bar, followed by admixing with oxygen from a 20 bar electrolyzer. Hydrogen from the electrolyzer is mixed with FT off-gas. Both feed streams [S2 and S3] are preheated [HX-1A] to 550 °C before they are fed to a catalytic syngas preparation reactor operating at 900 °C. The hot CO-rich reaction products [S4] are cooled [HX-1B and HX-2] down to 200 °C and conveyed to an FT reactor where it [S5] is catalytically converted to a mixture of paraffinic hydrocarbons. The mixture is cooled down [HX-3] to 40 °C and both the reaction water [S6] and C5+ hydrocarbon fraction [S7] are recovered via condensation. The gaseous fraction [S8] is recycled fully back in front of the syngas preparation reactor. To avoid the build-up of inerts in the recycle loop, a small amount of gas (containing 2% of the inlet hydrogen) is continuously purged [S9] from the loop.
3.1.3. Designs Based on Autothermal Heating from Electric Resistance (OT-ER and RC-ER)
The syngas preparation step in the OT-ER and RC-ER designs is heated autothermally from electricity. The reactions take place in tubes that are packed with catalyst and placed inside a reactor. The direct resistive heating of the reactor tubes is accomplished by applying an electric current along the tube. The intimate contact between the electric heat source and the reaction site drives the reaction close to thermal equilibrium and allows compact reactor designs [38].
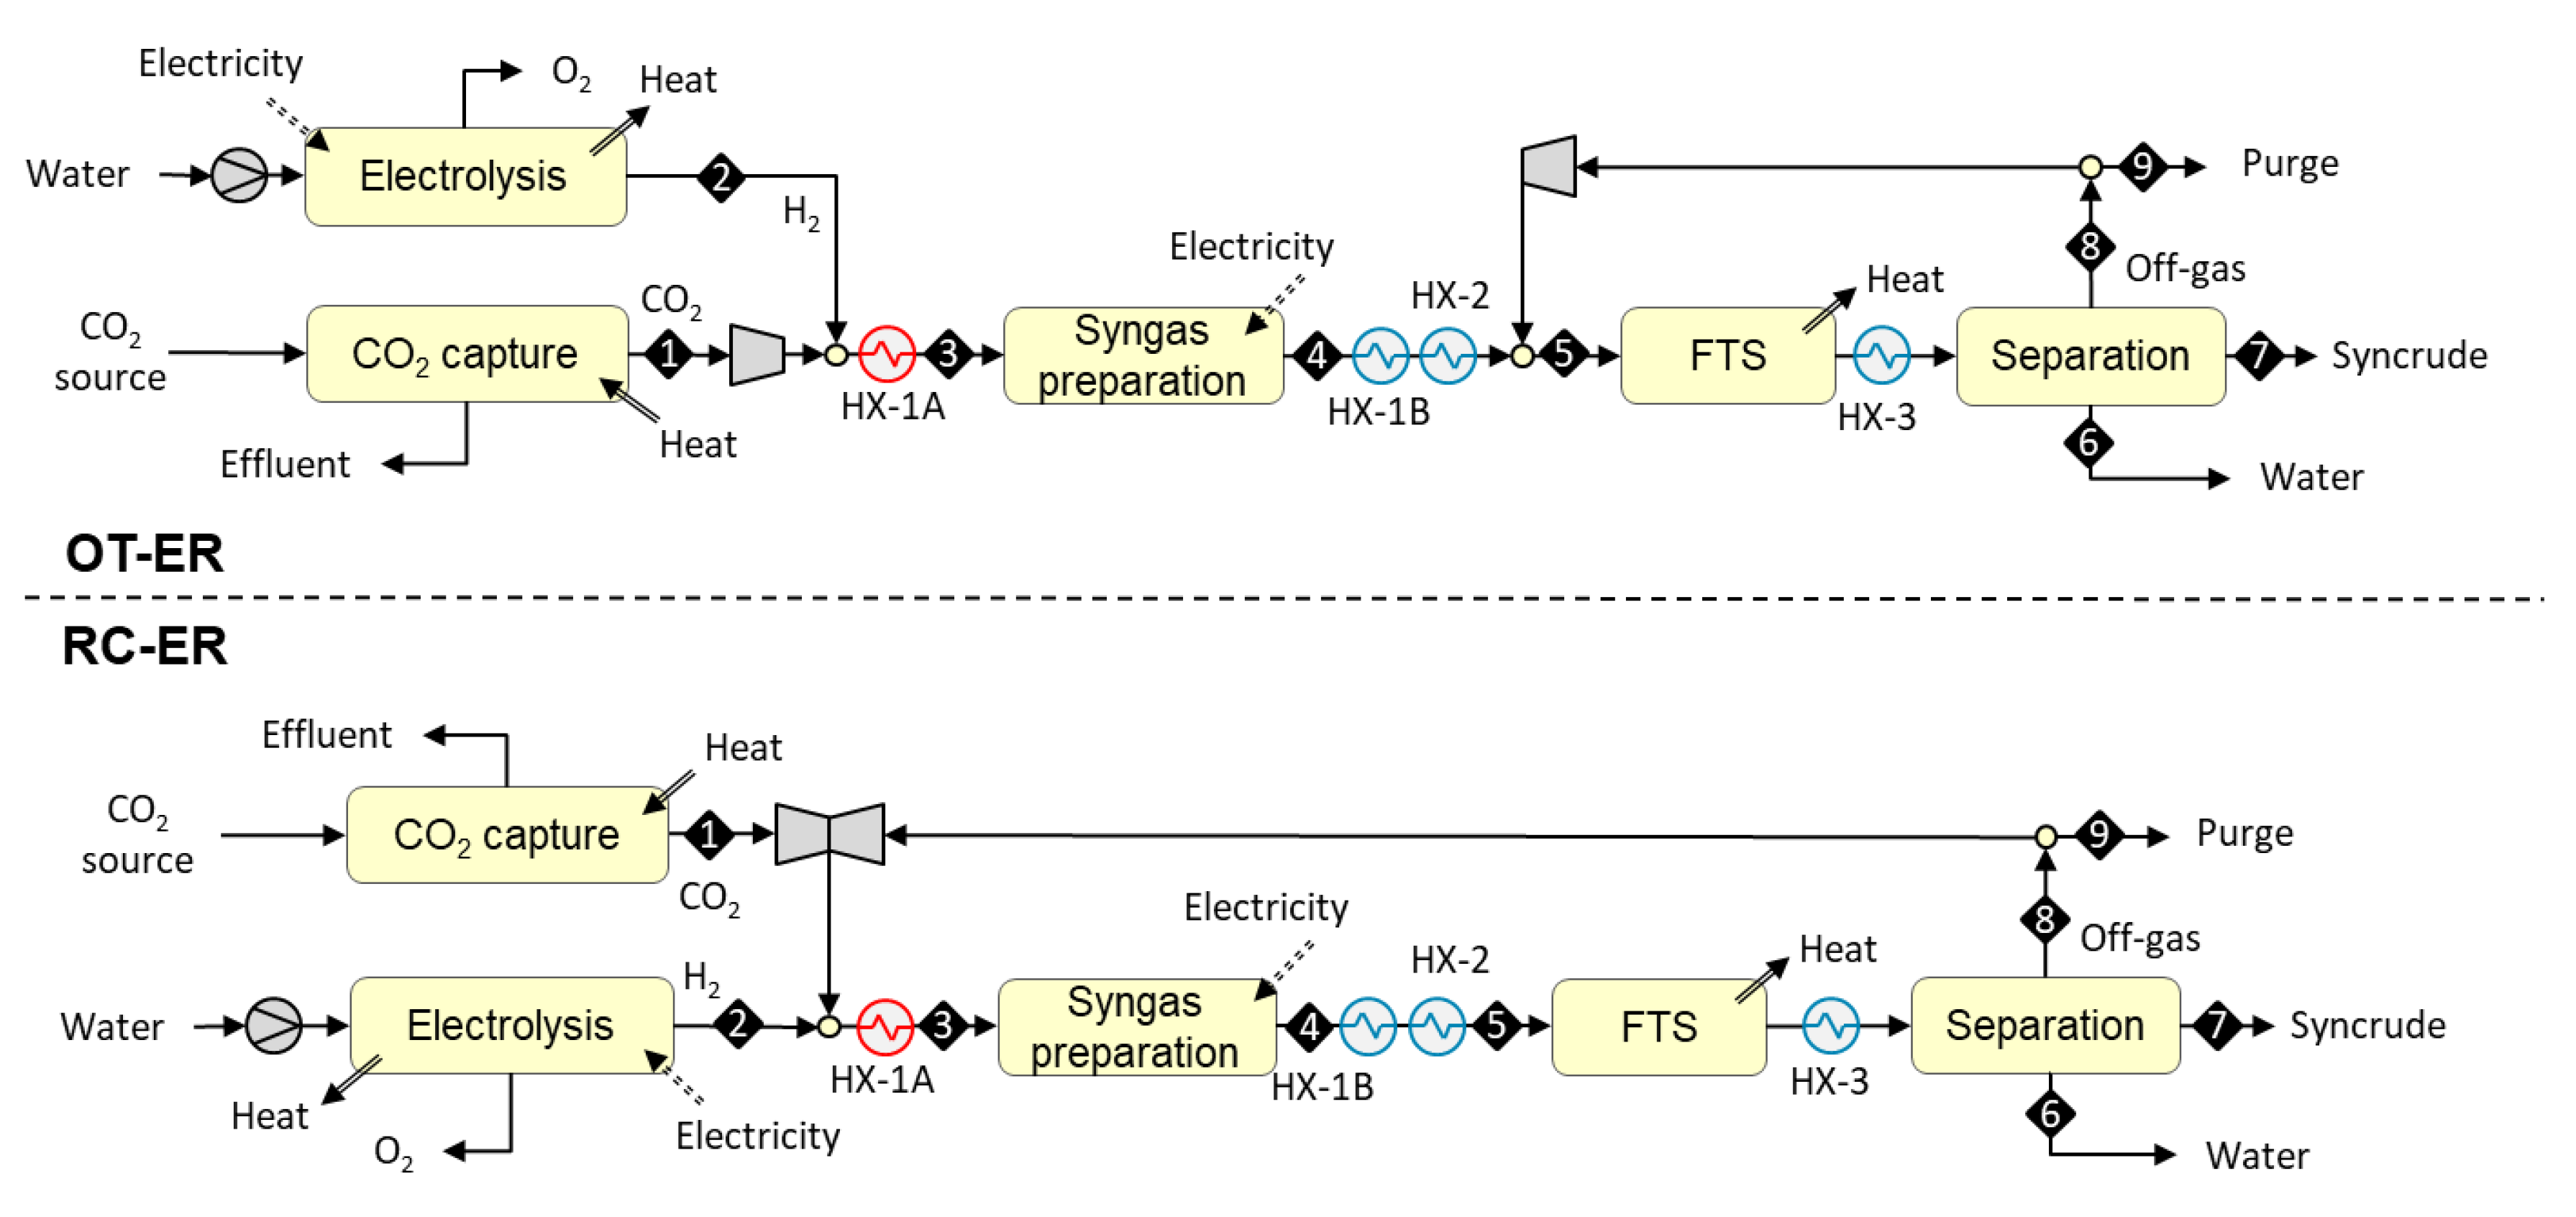
In the OT-ER design, syngas is prepared outside the FT recycle loop (see upper part of Figure 4). The process begins with the compression of a concentrated stream of carbon dioxide [S1] to 20 bar, admixing with hydrogen [S2] from 20 bar electrolysis, and preheating [HX-1A] to 550 °C. The mixture [S3] is then fed to a catalytic syngas preparation reactor operating at 900 °C. The required heat is supplied directly to the reactor tubes via resistance heating by applying AC current along the tubes. The hot CO-rich reaction products [S4] are cooled against the feed stream and mixed with the FT off-gas. The combined stream is cooled down [HX-2] to 200 °C and conveyed to an FT reactor where it [S5] is catalytically converted to a mixture of paraffinic hydrocarbons. The mixture is cooled down [HX-3] to 40 °C and both the reaction water [S6] and C5+ hydrocarbon fraction [S7] are recovered via condensation. The gaseous fraction [S8] is fully recycled back into the FT reactor. To avoid the build-up of inerts in the recycle loop, a small amount of gas (containing 2% of the inlet hydrogen) is continuously purged [S9] from the loop.
In the RC-ER design, syngas is prepared inside the FT recycle loop (see lower part of Figure 4). The process begins with the compression of a concentrated stream of carbon dioxide [S1] to 20 bar, followed by admixing with FT off-gas, and hydrogen [S2] from 20 bar electrolyzer. The mixture is preheated [HX-1A] to 550 °C and fed [S3] to a catalytic syngas preparation reactor operating at 900 °C. The required heat is supplied directly to the reactor tubes via resistance heating by applying AC current along the tubes. The hot CO-rich syngas [S4] is cooled down [HX-1B and HX-2] to 200 °C and conveyed to an FT rector where it [S5] is catalytically converted to a mixture of hydrocarbons. The mixture is cooled down [HX-3] to 40 °C and both the reaction water [S6] and C5+ hydrocarbon fraction [S7] are recovered via condensation. The gaseous fraction [S8] is recycled fully back in front of the syngas preparation reactor. To avoid the build-up of inerts in the recycle loop, a small amount of gas (containing 2% of the inlet hydrogen) is continuously purged [S9] from the loop.
3.2. Evaluation Metrics and Design Parameters
We use two main metrics to evaluate and compare the examined plant configurations. These are carbon efficiency from CO2-to-syncrude:
where denotes molar flow (mol/s). Although flue gas is not formed in the POX and ER designs (purge gas is considered as a by-product), combustion of purge is modelled to calculate ηCO2. Additionally, thermal efficiency from electricity-to-syncrude:
where denotes mass flow (kg/s), H lower heating value (MJ/kg), and electricity the combined work input (MWe) required to operate the overall conversion process. Main design parameters used in the modelling of the examined plant configurations are summarized in Table 2.
4. Results and Discussion
4.1. Mass and Energy Balances
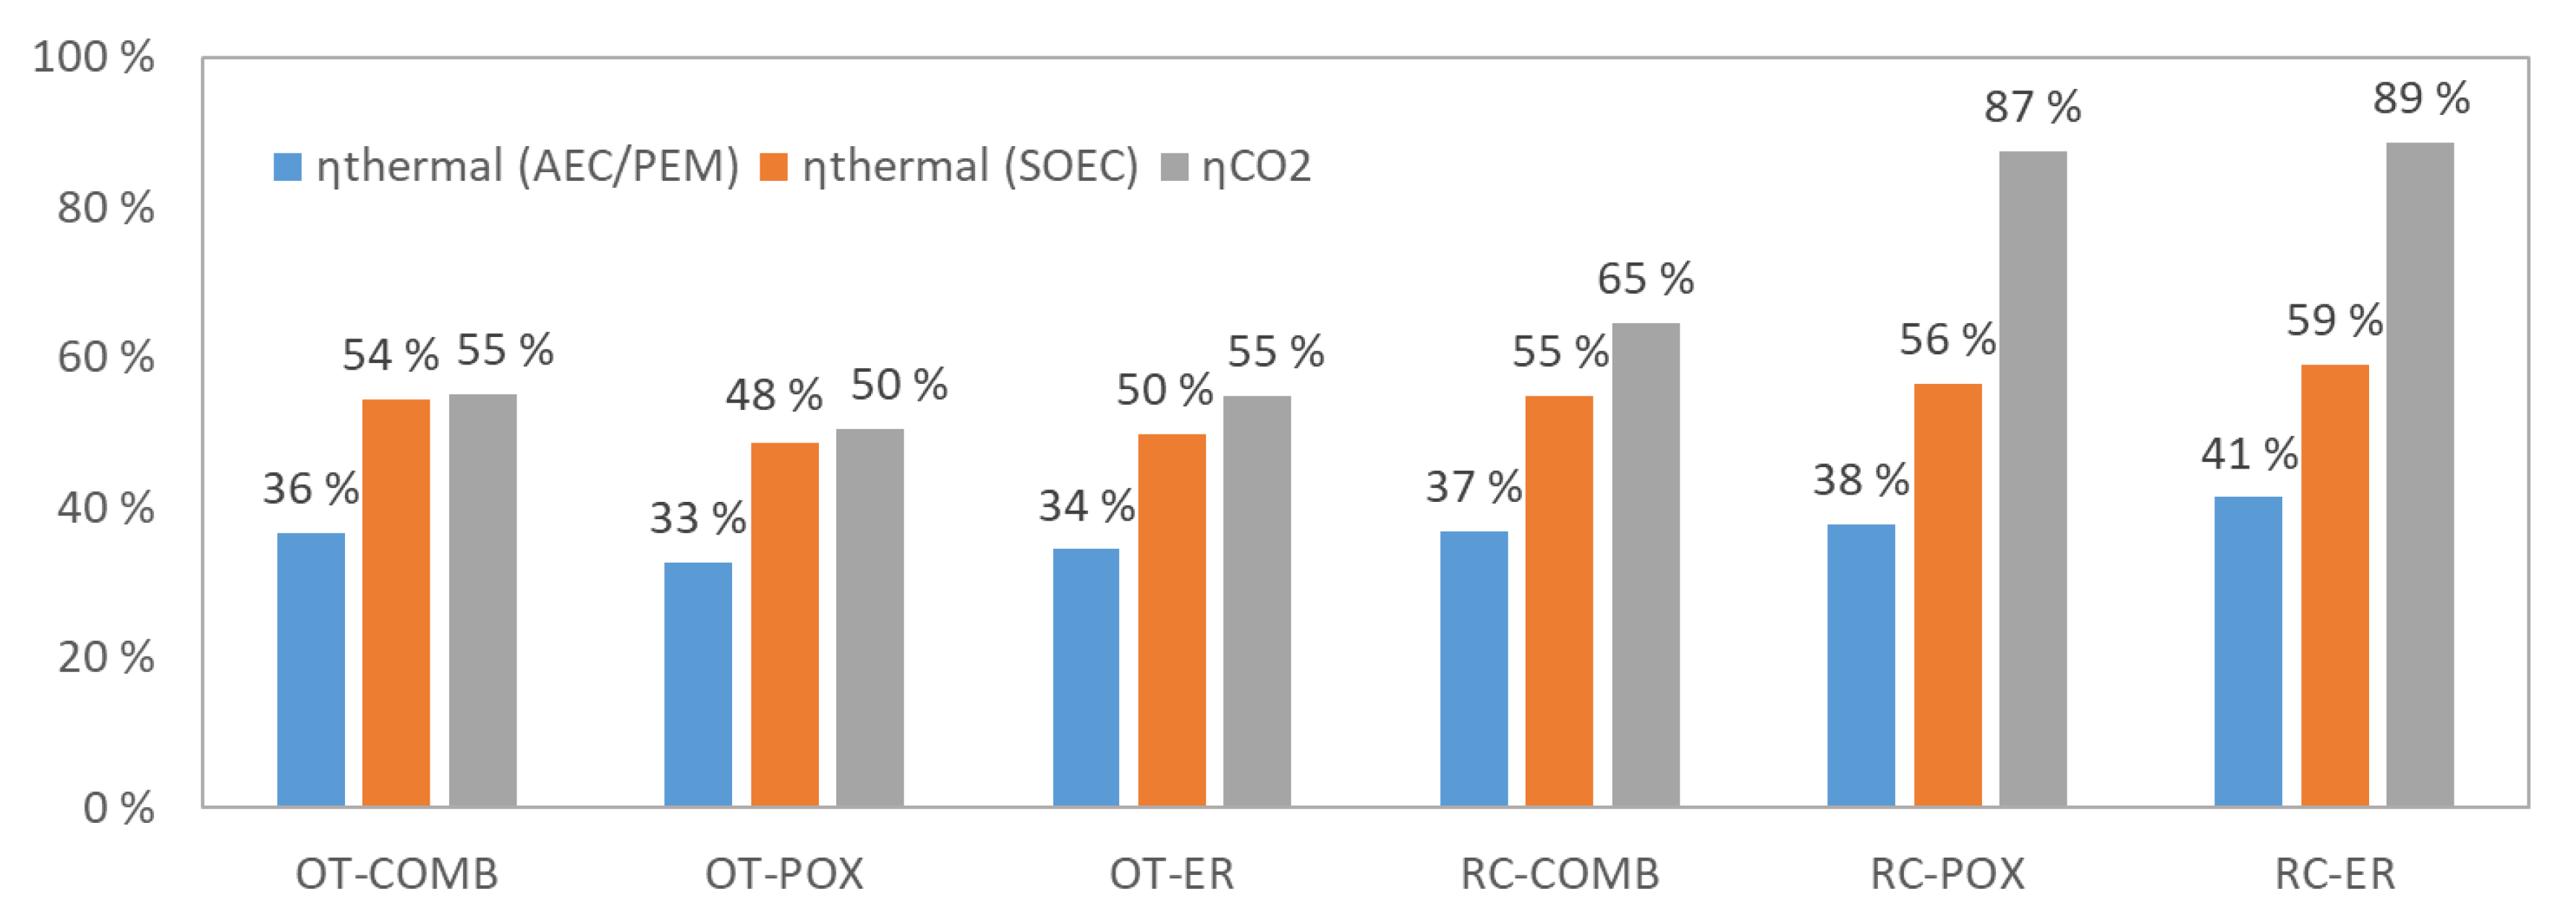
Carbon dioxide input was set to 1000 kg/h and syngas preparation temperature to 900 °C for all examined plants. Main results from the simulation are summarized in Table 3, and stream data are given for each configuration in Appendix A. The syncrude output is 162–177 kg/h for plants that feature once-through design (162 kg/h for OT-POX, 176 kg/h for OT-ER and 177 kg/h for OT-COMB), and 208–285 kg/h for plants that feature recycle design (208 kg/h for RC-COMB, 281 kg/h for RC-POX and 285 kg/h for RC-ER). In terms of ηCO2, the results are 50–55% for the OT designs and 65–89% for the RC designs. Similarly, although smaller differences can be observed for ηthermal, being 33–36% for the OTs and 37–41% for the RCs when assuming low temperature AEC or PEM electrolyzer technology. When assuming high temperature SOEC electrolyzer technology, ηthermal is 48–54% for OTs and 55–59% for RCs. The results are illustrated also in Figure 5, where the higher ηCO2 of the RC designs can be clearly observed.
Substantial opportunities for heat recovery have also been observed, and ways to find valuable use for the co-product heat should be explored when actual plants are being built. This is especially the case for low temperature AEC and PEM electrolyzers, where a significant amount of by-product heat is released at 50–90 °C temperature level, which would be suitable for most space heating purposes. With SOEC technology, the higher system efficiency to hydrogen leads to markedly lower by-product heat release, rendering heat integration with surrounding systems less important. A significant amount of steam can be generated from the FT reactor’s exotherm, which in terms of mass flow is a good match with the SOEC electrolyzer’s water requirements.
In all examined cases, the electrolyzer clearly dominates electricity use, representing 97–99% of total work input for COMB and POX designs and 85–93% for ER designs where the share of electric resistance accounts for 4–8% of total electricity use.
4.2. Sensitivity to Syngas Preparation Temperature
To analyze the robustness of our results, we studied the impact of syngas preparation temperature on both ηthermal and ηCO2. Since recycle designs fared better than once-through designs on both metrics, we only illustrated results for the RC designs in Figure 6.
The results are plotted against syngas preparation temperature over the range of 750–950 °C. Temperatures below this range were considered impractical due to low CO2 conversion limited by thermodynamic equilibrium, while higher temperatures were considered impractical from the materials point of view, considering a pressurized reactor operating at 20 bar.
As discussed in Section 2.2., the rWGS reaction is thermodynamically favored at high temperatures, and one would therefore expect the ηCO2 to increase along with the increasing temperature. According to our results (Figure 6a), an increase in temperature from 750 to 950 °C indeed increases carbon efficiency from 68% to 89% for the RC-POX and from 71% to 91% for the RC-ER, but somewhat surprisingly decreases it from 78% to 62% for the RC-COMB.
The observed behavior of the RC-COMB configuration could be explained by the complex interaction between temperature, methane conversion and fuel gas demand. As syngas preparation temperature increases, more methane (being most voluminous of the C1–C4 hydrocarbons formed during FT synthesis) is converted to syngas (CO and H2), which reduces the methane content in the recycle stream. As methane reforming is an endothermic reaction, higher temperature not only requires more fuel gas to supply the sensible heat but also to drive the increased amount of reactions. However, the fuel gas now has lower heating value (as it contains less methane) and therefore a larger amount of gas needs to be burned, leading to more carbon lost in the form of fuel gas and therefore lower carbon efficiency (to syncrude).
Similar behavior can be observed (Figure 6b) also for the ηthermal. When syngas preparation temperature increases from 750 °C to 950 °C, thermal efficiency increases from 31% to 38% for RC-POX and from 34% to 42% for RC-ER but decreases from 38% to 36% for RC-COMB. These results could be explained by the need to control the build-up of methane in the recycle loop. In the RC-COMB configuration, the use of fuel gas for heat supply simultaneously disposes methane that would otherwise gradually build-up in the recycle loop. In contrast, to limit the build-up of methane in the RC-POX and RC-ER designs, part of the recycle gas needs to be deliberately purged, as these configurations do not feature combustion of fuel gas. As methane cannot be removed from the system selectively, syngas components are also lost along with methane, which contributes to lower thermal efficiency (to syncrude). However, with the increasing syngas preparation temperature, the amount of methane circulating in the loop decreases and less gas needs to be purged leading to reduced losses and higher efficiency. This could explain why increasing syngas preparation temperature improves ηthermal for the RC-POX and RC-ER designs but reduces it for RC-COMB.
From a purely energetic point of view, an optimal syngas preparation temperature for the RC-COMB design would therefore be one where the energy flow of methane closely matches the heat duty of the syngas preparation step. At lower temperatures, methane content in the recycle loop increases while heat demand for syngas preparation decreases, leading to methane surplus in the system. At higher temperatures, methane content in the loop decreases while energy demand for syngas preparation increases, leading to methane deficit in the system that needs to be compensated by combusting more syngas components for energy that otherwise could be converted to fuel.
Based on the results, changes in preparation temperature does not affect ηCO2 and ηthermal linearly across the examined range. For the autothermally-heated RC-POX and RC-ER, increase in temperature initially leads to clear improvements in both ηCO2 and ηthermal but benefits start to level off beyond 850 °C, being more pronounced for ηthermal where gains start to stabilize after 875 °C and plateau for RC-POX after 900 °C. For RC-COMB, ηCO2 declines gradually across the studied temperature range, while ηthermal remains constant until 800 °C before starting to decline.
Based on the results, RC-COMB achieves highest thermal efficiency within a temperature range of 750–810 °C, but autothermal configurations are more efficient above 810 °C. The higher efficiency (from electricity to syncrude) of RC-ER over RC-POX can be explained by the more efficient conversion of electricity to high-temperature heat via electric resistance, as in the POX-configuration electrical energy is first converted to chemical energy at 60% efficiency before combustion.
However, the optimal choice of reaction temperature is not only a matter of energetic considerations, as also other factors such as reaction kinetics and smooth trouble-free operation need to be taken into account. At higher temperatures, reactions proceed more quickly, and smaller reactors can therefore be used to reach the same output.
As discussed in Section 2.2., solid carbon can form inside the reactor at certain temperature regions. Without the presence of hydrocarbons, and at atmospheric pressure, the carbon limit temperature is below 600 °C, but increases to around 700 °C when operating at 20 bar pressure. In recycle configurations, where hydrocarbons from the downstream FT synthesis are present in the reactor, formation of solid carbon can become a severe problem for smooth operation. Such coking problems can however be alleviated by increasing the reaction temperature to around 900 °C and by using oxygen feed [27].
Taking the above considerations into account, the results favor the use of RC-ER and RC-POX designs over RC-COMB. However, although our modelling reveals insights into the behavior of the examined configurations, supplemental studies and experimental data are needed to further guide the selection of optimal operation temperature.
5. Conclusions
Simulation results for alternative process designs, based on catalytic preparation of CO-rich syngas for Fischer–Tropsch synthesis, have been presented.
As expected, the recycle (RC) designs demonstrated a higher carbon (ηCO2) and thermal efficiency (ηthermal) than once-through (OT) designs, where only a single pass of gas through the equilibrium limited syngas preparation reactor is possible.
Differences caused by alternative heat delivery methods were also observed. These deviations could be explained by the close interaction between operation temperature, methane conversion and fuel gas demand, and the efficiency of converting electrical energy to high-temperature heat.
In terms of thermal efficiency, the RC-COMB design was observed to have highest ηthermal below 810 °C, but it is surpassed by RC-ER at temperatures higher than 810 °C and by RC-POX at temperatures higher than 870 °C. The RC-ER design was observed to attain 2–4% points higher thermal efficiency than RC-POX over the examined temperature range, with the difference widening in favor of RC-ER along with the increasing temperature.
In terms of carbon efficiency, the RC-COMB design was observed to have highest ηCO2 below 780 °C, but it is surpassed by RC-ER at temperatures higher than 780 °C and by RC-POX at temperatures higher than 790 °C. The carbon efficiencies are very similar for the autothermally heated designs across the studied temperature range, with RC-ER professing only about 0.5% points higher ηCO2.
In general, the results seem to favor the selection of a high (>800 °C) syngas preparation temperature. However, additional considerations such as the role of reaction kinetics and trouble-free operation should also be taken into account, which requires complementary studies and empirical evidence from operating plants.
As expected, the choice of electrolyzer technology was observed to have a major impact on ηthermal due to large differences in nominal system efficiencies. Unfortunately, high efficiency SOEC technology still has low technology readiness level, and commercial deployment is pending. In the near and medium term, and especially for large multi-MW applications, the lower efficiency of the AEC and PEM technologies could be compensated by utilizing their by-product heat for space heating purposes (either directly or via district heating), where decarbonization solutions are currently in high demand.
Previous studies have shown that the economics of electrofuels are dominated by the cost of electricity [39,40,41]. This implies that high ηthermal is the most important indicator of a low production cost, and RC-ER is therefore expected to be the lowest cost alternative among those examined, followed by RC-POX and RC-COMB.
Author Contributions
Conceptualization, I.H., N.K. and P.S.; modelling, I.H.; analysis, I.H.; writing—original draft preparation, I.H.; writing—review and editing, I.H., N.K. and P.S.; visualization, I.H.; project administration, N.K.; funding acquisition, P.S. and N.K. All authors have read and agreed to the published version of the manuscript.
Funding
This research was funded by VTT Technical Research Centre of Finland Ltd. and H2020 project ICO2CHEM, grant number 768543.
Conflicts of Interest
The authors declare no conflict of interest. The funders had no role in the design of the study; in the collection, analyses, or interpretation of data; in the writing of the manuscript, or in the decision to publish the results.
Appendix A

Table A1.
Simulated stream results for OT-COMB.
| Stream | S1 | S2 | S3 | S4 | S5 | S6 | S7 | S8 | S9 | |
|---|---|---|---|---|---|---|---|---|---|---|
| Temperature | C | 113 | 25 | 550 | 900 | 220 | 40 | 40 | 40 | 40 |
| Pressure | bar | 20 | 20 | 19.9 | 19.4 | 19.2 | 18.5 | 18.5 | 18.5 | 18.9 |
| Mole Flows | kmol/hr | 100.0 | 229.2 | 329.2 | 317.2 | 707.3 | 140.4 | 3.6 | 437.3 | 47.2 |
| Mole Fractions | ||||||||||
| CO | 0.206 | 0.119 | 0.048 | 0.048 | ||||||
| CO2 | 1.000 | 0.304 | 0.090 | 0.376 | 0.608 | 0.608 | ||||
| H2 | 1.000 | 0.696 | 0.441 | 0.246 | 0.088 | 0.088 | ||||
| N2 | ||||||||||
| CH4 | 0.019 | 0.138 | 0.234 | 0.234 | ||||||
| H2O | 0.000 | 0.244 | 0.109 | 1.000 | ||||||
| O2 | ||||||||||
| C2H6 | 0.004 | 0.008 | 0.008 | |||||||
| C3H8 | 0.004 | 0.007 | 0.007 | |||||||
| C4H10 | 0.004 | 0.007 | 0.007 | |||||||
| C5+ | 1.000 | |||||||||
| Mass Flows | kg/hr | 4401 | 462 | 4863 | 4863 | 17,725 | 2529 | 779 | 14,418 | 1556 |
| (LHV) Net heating value | MJ/kg | 0 | 119.96 | 11.40 | 11.75 | 9.07 | 0 | 43.89 | 8.06 | 8.06 |
| Duty | MW | 0.0 | 15.4 | 15.4 | 15.9 | 44.7 | 0.0 | 9.5 | 32.3 | 3.5 |
Table A2.
Simulated stream results for OT-POX.
| Stream | S1 | S2 | S3 | S4 | S5 | S6 | S7 | S8 | S9 | |
|---|---|---|---|---|---|---|---|---|---|---|
| Temperature | C | 105 | 25 | 152 | 900 | 220 | 40 | 40 | 40 | 40 |
| Pressure | bar | 20 | 20 | 19.9 | 19.4 | 19.2 | 18.5 | 18.5 | 18.5 | 18.5 |
| Mole Flows | kmol/hr | 100.0 | 234.1 | 116.3 | 327.8 | 689.9 | 156.7 | 3.3 | 414.5 | 52.4 |
| Mole Fractions | ||||||||||
| CO | 0.183 | 0.112 | 0.046 | 0.046 | ||||||
| CO2 | 1.000 | 0.860 | 0.112 | 0.421 | 0.701 | 0.701 | ||||
| H2 | 1.000 | 0.393 | 0.233 | 0.088 | 0.088 | |||||
| N2 | ||||||||||
| CH4 | 0.010 | 0.082 | 0.148 | 0.148 | ||||||
| H2O | 0.302 | 0.144 | 1.000 | |||||||
| O2 | 0.140 | |||||||||
| C2H6 | 0.003 | 0.006 | 0.006 | |||||||
| C3H8 | 0.003 | 0.006 | 0.006 | |||||||
| C4H10 | 0.003 | 0.005 | 0.005 | |||||||
| C5+ | 1.000 | |||||||||
| Mass Flows | kg/hr | 4401 | 472 | 4923 | 5395 | 18,226 | 2824 | 713 | 14,690 | 1858 |
| (LHV) Net heating value | MJ/kg | 0 | 119.96 | 0 | 9.39 | 6.52 | 0 | 43.89 | 5.31 | 5.31 |
| Duty | MW | 0.0 | 15.7 | 0.0 | 14.1 | 33.0 | 0.0 | 8.7 | 21.7 | 2.7 |
Table A3.
Simulated stream results for OT-ER.
| Stream | S1 | S2 | S3 | S4 | S5 | S6 | S7 | S8 | S9 | |
|---|---|---|---|---|---|---|---|---|---|---|
| Temperature | C | 105 | 25 | 550 | 900 | 220 | 40 | 40 | 40 | 40 |
| Pressure | bar | 20 | 20 | 19.9 | 19.4 | 19.2 | 18.5 | 18.5 | 18.5 | 18.5 |
| Mole Flows | kmol/hr | 100.0 | 229.5 | 329.5 | 317.6 | 739.2 | 140.6 | 3.6 | 468.5 | 46.9 |
| Mole Fractions | ||||||||||
| CO | 0.206 | 0.114 | 0.045 | 0.045 | ||||||
| CO2 | 1.000 | 0.303 | 0.090 | 0.387 | 0.611 | 0.611 | ||||
| H2 | 1.000 | 0.697 | 0.442 | 0.239 | 0.086 | 0.086 | ||||
| N2 | ||||||||||
| CH4 | 0.019 | 0.143 | 0.236 | 0.236 | ||||||
| H2O | 0.243 | 0.105 | 1.000 | |||||||
| O2 | ||||||||||
| C2H6 | 0.004 | 0.008 | 0.008 | |||||||
| C3H8 | 0.004 | 0.007 | 0.007 | |||||||
| C4H10 | 0.004 | 0.007 | 0.007 | |||||||
| C5+ | 1.000 | |||||||||
| Mass Flows | kg/hr | 4401 | 463 | 4864 | 4864 | 18,802 | 2533 | 782 | 15,487 | 1549 |
| (LHV) Net heating value | MJ/kg | 0 | 119.96 | 11.41 | 11.76 | 9.01 | 0 | 43.89 | 8.05 | 8.05 |
| Duty | MW | 0.0 | 15.4 | 15.4 | 15.9 | 47.1 | 0.0 | 9.5 | 34.6 | 3.5 |
Table A4.
Simulated stream results for RC-COMB.
| Stream | S1 | S2 | S3 | S4 | S5 | S6 | S7 | S8 | S9 | |
|---|---|---|---|---|---|---|---|---|---|---|
| Temperature | C | 113 | 25 | 550 | 900 | 220 | 40 | 40 | 40 | 40 |
| Pressure | bar | 20 | 20 | 19.9 | 19.4 | 19.2 | 18.5 | 18.5 | 18.5 | 18.5 |
| Mole Flows | kmol/hr | 100.0 | 270.4 | 441.8 | 440.2 | 440.2 | 160.6 | 4.2 | 127.4 | 55.9 |
| Mole Fractions | ||||||||||
| CO | 0.031 | 0.224 | 0.224 | 0.194 | 0.194 | |||||
| CO2 | 1.000 | 0.268 | 0.074 | 0.074 | 0.256 | 0.256 | ||||
| H2 | 1.000 | 0.674 | 0.474 | 0.474 | 0.386 | 0.386 | ||||
| N2 | ||||||||||
| CH4 | 0.025 | 0.032 | 0.032 | 0.156 | 0.156 | |||||
| H2O | 0.197 | 0.197 | 1.000 | |||||||
| O2 | ||||||||||
| C2H6 | 0.001 | 0.003 | 0.003 | |||||||
| C3H8 | 0.000 | 0.003 | 0.003 | |||||||
| C4H10 | 0.000 | 0.003 | 0.003 | |||||||
| C5+ | 1.000 | |||||||||
| Mass Flows | kg/hr | 4401 | 545 | 6400 | 6400 | 6400 | 2892 | 915 | 2593 | 1139 |
| (LHV) Net heating value | MJ/kg | 0 | 119.96 | 13.47 | 13.98 | 13.98 | 0 | 43.89 | 14.32 | 14.32 |
| Duty | MW | 0.0 | 18.2 | 23.9 | 24.9 | 24.9 | 0.0 | 11.2 | 10.3 | 4.5 |
Table A5.
Simulated stream results for RC-POX.
| Stream | S1 | S2 | S3 | S4 | S5 | S6 | S7 | S8 | S9 | |
|---|---|---|---|---|---|---|---|---|---|---|
| Temperature | C | 105 | 25 | 188 | 900 | 220 | 40 | 40 | 40 | 40 |
| Pressure | bar | 20 | 20 | 19.9 | 19.4 | 19.2 | 18.5 | 18.5 | 18.5 | 18.5 |
| Mole Flows | kmol/hr | 100.0 | 352.5 | 131.7 | 628.3 | 628.3 | 247.1 | 5.6 | 176.1 | 19.9 |
| Mole Fractions | ||||||||||
| CO | 0.212 | 0.212 | 0.189 | 0.189 | ||||||
| CO2 | 1.000 | 0.759 | 0.089 | 0.089 | 0.317 | 0.317 | ||||
| H2 | 1.000 | 0.445 | 0.445 | 0.367 | 0.367 | |||||
| N2 | ||||||||||
| CH4 | 0.021 | 0.021 | 0.119 | 0.119 | ||||||
| H2O | 0.234 | 0.234 | 1.000 | |||||||
| O2 | 0.241 | |||||||||
| C2H6 | 0.003 | 0.003 | ||||||||
| C3H8 | 0.003 | 0.003 | ||||||||
| C4H10 | 0.003 | 0.003 | ||||||||
| C5+ | 1.000 | |||||||||
| Mass Flows | kg/hr | 4401 | 711 | 5415 | 9603 | 9603 | 4451 | 1233 | 3920 | 443 |
| (LHV) Net heating value | MJ/kg | 0 | 119.96 | 0 | 12.03 | 12.03 | 0 | 43.89 | 11.48 | 11.48 |
| Duty | MW | 0.0 | 23.7 | 0.0 | 32.1 | 32.1 | 0.0 | 15.0 | 12.5 | 1.4 |
Table A6.
Simulated stream results for RC-ER.
| Stream | S1 | S2 | S3 | S4 | S5 | S6 | S7 | S8 | S9 | |
|---|---|---|---|---|---|---|---|---|---|---|
| Temperature | C | 105 | 25 | 550 | 900 | 220 | 40 | 40 | 40 | 40 |
| Pressure | bar | 20 | 20 | 19.9 | 19.4 | 19.2 | 18.5 | 18.5 | 18.5 | 18.5 |
| Mole Flows | kmol/hr | 100.0 | 297.0 | 537.7 | 555.4 | 555.4 | 189.1 | 5.7 | 157.4 | 16.7 |
| Mole Fractions | ||||||||||
| CO | 0.056 | 0.244 | 0.244 | 0.215 | 0.215 | |||||
| CO2 | 1.000 | 0.244 | 0.062 | 0.062 | 0.220 | 0.220 | ||||
| H2 | 1.000 | 0.641 | 0.489 | 0.489 | 0.338 | 0.338 | ||||
| N2 | ||||||||||
| CH4 | 0.057 | 0.047 | 0.047 | 0.217 | 0.217 | |||||
| H2O | 0.158 | 0.158 | 1.000 | |||||||
| O2 | ||||||||||
| C2H6 | 0.001 | 0.004 | 0.004 | |||||||
| C3H8 | 0.001 | 0.003 | 0.003 | |||||||
| C4H10 | 0.001 | 0.003 | 0.003 | |||||||
| C5+ | 1.000 | |||||||||
| Mass Flows | kg/hr | 4401 | 599 | 7860 | 7860 | 7860 | 3406 | 1255 | 3198 | 338 |
| (LHV) Net heating value | MJ/kg | 0 | 119.96 | 15.17 | 15.89 | 15.89 | 0 | 43.89 | 16.59 | 16.59 |
| Duty | MW | 0.0 | 19.9 | 33.1 | 34.7 | 34.7 | 0.0 | 15.3 | 14.7 | 1.6 |
References
- Sims, R.; Schaeffer, R.; Creutzig, F.; Cruz-Núñez, X.; D’Agosto, M.; Dimitriu, D.; Meza, M.J.F.; Fulton, L.; Kobayashi, S.; Lah, O.; et al. 2014: Transport. In Climate Change 2014: Mitigation of Climate Change. Contribution of Working Group III to the Fifth Assessment Report of the Intergovernmental Panel on Climate Change; Edenhofer, O., Pichs-Madruga, R., Sokona, Y., Farahani, E., Kadner, S., Seyboth, K., Adler, A., Baum, I., Brunner, S., Eickemeier, P., et al., Eds.; Cambridge University Press: Cambridge, UK; New York, NY, USA, 2014. [Google Scholar]
- Hannula, I.; Reiner, D.M. The role of carbon-neutral synthetic fuels and battery electric vehicles in a sustainable transport system. Joule 2019, 3, 2390–2402. [Google Scholar] [CrossRef]
- Tracking Clean Energy Progress—Topics—IEA. Available online: www.iea.org/tcep (accessed on 16 June 2020).
- Mohr, A.; Raman, S. Lessons from first generation biofuels and implications for the sustainability appraisal of second generation biofuels. Energy Policy 2013, 63, 114–122. [Google Scholar] [CrossRef] [PubMed]
- International Energy Agency. Delivering Sustainable Bioenergy, Technology Roadmap, OECD, Paris; IEA: Paris, France, 2017. [Google Scholar]
- Steinberg, M. Synthetic carbonaceous fuels and feedstocks from oxides of carbon and nuclear power. Fuel 1978, 57, 460–468. [Google Scholar] [CrossRef]
- Zeman, F.S.; Keith, D.W. Carbon neutral hydrocarbons. Philos. Trans. R. Soc. A 2008, 366, 3901–3918. [Google Scholar] [CrossRef] [PubMed]
- Dimitriou, I.; Garcia-Gutiérrez, P.; Elder, R.H.; Cuéllar-Franca, R.M.; Azapagic, A.; Allen, R.W.K. Carbon dioxide utilisation for production of transport fuels: Process and economic analysis. Energy Environ. Sci. 2015, 8, 1775–1789. [Google Scholar] [CrossRef] [Green Version]
- Abanades, J.C.; Rubin, E.S.; Mazzotti, M.; Herzog, H.J. On the climate change mitigation potential of CO2 conversion to fuels. Energy Environ. Sci. 2017, 10, 2491–2499. [Google Scholar] [CrossRef]
- Blanco, H.; Faaij, A. A review of the role of storage in energy systems with a focus on Power to Gas and long-term storage. Renew. Sustain. Energ. Rev. 2018, 81, 1049–1086. [Google Scholar] [CrossRef]
- Bushuyev, O.S.; De Luna, P.; Dinh, C.T.; Tao, L.; Saur, G.; van de Lagemaat, J.; Kelley, S.O.; Sargent, E.H. What should we make with CO2 and how can we make it? Joule 2018, 2, 825–832. [Google Scholar] [CrossRef] [Green Version]
- Aresta, M.; Dibenedetto, A.; Quaranta, E. State of the art and perspectives in catalytic processes for CO2 conversion into chemicals and fuels: The distinctive contribution of chemical catalysis and biotechnology. J. Catal. 2016, 343, 2–45. [Google Scholar] [CrossRef]
- Bruhn, T.; Naims, H.; Olfe-Krautlein, B. Separating the debate on CO2 utilisation from carbon capture and storage. Environ. Sci. Policy 2016, 60, 38–43. [Google Scholar] [CrossRef]
- Brynolf, S.; Taljegard, M.; Grahn, M.; Hansson, J. Electrofuels for the transport sector: A review of production costs. Renew. Sustain. Energy Rev. 2018, 81, 1887–1905. [Google Scholar] [CrossRef]
- Graves, C.; Ebbesen, S.D.; Mogensen, M.; Lackner, K.S. Sustainable hydrocarbon fuels by recycling CO2 and H2O with renewable or nuclear energy. Renew. Sustain. Energy Rev. 2011, 15, 1–23. [Google Scholar] [CrossRef]
- Wulf, C.; Linßen, J.; Zapp, P. Review of Power-to-Gas Projects in Europe. Energy Procedia 2018, 155, 367–378. [Google Scholar] [CrossRef]
- CRI—Carbon Recycling International. Available online: www.carbonrecycling.is (accessed on 16 June 2020).
- Otten, R. The First Industrial PtG Plant—Audi E-Gas as Driver for the Energy Turnaround. CEDEC Gas Day Verona Italy. 2014. Available online: http://bit.ly/2zTg5kW (accessed on 16 June 2020).
- Soletair—Sustainable Technologies. Available online: https://soletair.fi (accessed on 16 June 2020).
- Vázquez, F.V.; Koponen, J.; Ruuskanen, V.; Bajamundi, C.; Kosonen, A.; Simell, P.; Ahola, J.; Frilund, C.; Elfving, J.; Reinikainen, M.; et al. Power-to-X technology using renewable electricity and carbon dioxide from ambient air: SOLETAIR proof-of-concept and improved process concept. J. CO2 Util. 2018, 28, 235–246. [Google Scholar] [CrossRef]
- Sunfire—Energy Everywhere. Available online: https://www.sunfire.de/en/ (accessed on 16 June 2020).
- Bertuccioli, L.; Chan, A.; Hart, D.; Lehner, F.; Madden, B.; Standen, E. Study on Development of Water Electrolysis in the EU; FCH JU: Bruxelles, Belgium, 2014. [Google Scholar]
- Buttler, A.; Spliethoff, H. Current status of water electrolysis for energy storage, grid balancing and sector coupling via power-to-gas and power-to-liquids: A review. Renew. Sustain. Energy Rev. 2018, 82, 2440–2454. [Google Scholar] [CrossRef]
- Daza, Y.A.; Kuhn, J.N. CO2 conversion by reverse water gas shift catalysis: Comparison of catalysts, mechanisms and their consequences for CO2 conversion to liquid fuels. RSC Adv. 2016, 6, 49675–49691. [Google Scholar] [CrossRef]
- Kaiser, P.; Unde, R.; Kern, C.; Jess, A. Production of Liquid Hydrocarbons with CO2 as Carbon Source based on Reverse Water—Gas Shift and Fischer—Tropsch Synthesis. Chem. Ing. Tech. 2013, 85, 489–499. [Google Scholar] [CrossRef]
- Hansen, J.B.; Christiansen, N.; Nielsen, J.U. Production of Sustainable Fuels by Means of Solid Oxide Electrolysis. ECS Trans. 2011, 35, 2941–2948. [Google Scholar] [CrossRef]
- Simell, P.; Hannula, I.; Tuomi, S.; Nieminen, M.; Kurkela, E.; Hiltunen, I.; Kaisalo, N.; Kihlman, J. Clean syngas from biomass—Process development and concept assessment. Biomass Convers. Biorefinery 2014, 4, 357–370. [Google Scholar] [CrossRef]
- Sie, S.; Krishna, R. Fundamentals and selection of advanced Fischer-Tropsch reactors. Appl. Catal. A Gen. 1999, 186, 55–70. [Google Scholar] [CrossRef]
- Sie, S.; Senden, M.; Wechem, H.V. Conversion of natural gas to transportation fuels via the shell middle distillate synthesis process (SMDS). Catal. Today 1991, 8, 371–394. [Google Scholar] [CrossRef]
- Anderson, R. Catalysts for the Fischer-Tropsch Synthesis; Van Nostrand-Reinhold: New York, NY, USA, 1956; Volume 4. [Google Scholar]
- De Klerk, A. Fischer-Tropsch fuels refinery design. Energy Environ. Sci. 2011, 4, 1177–1205. [Google Scholar] [CrossRef]
- Eilers, J.; Posthuma, S.; Sie, S. The shell middle distillate synthesis process (smds). Catal. Lett. 1990, 7, 253–269. [Google Scholar] [CrossRef]
- de Klerk, A. Fischer-Tropsch Refining; Wiley-VCH: Weinheim, Germany, 2011. [Google Scholar]
- de Klerk, A.; Li, Y.W.; Zennaro, R. Fischer-Tropsch Technology. In Greener Fischer-Tropsch Processes for Fuels and Feedstocks; Maitlis, P.M., de Klerk, A., Eds.; Wiley-VCH: Weinheim, Germany, 2013. [Google Scholar]
- Rytter, E.; Tsakoumis, N.E.; Holmen, A. On the selectivity to higher hydrocarbons in Co-based Fischer-Tropsch synthesis. Catal. Today 2016, 261, 3–16. [Google Scholar] [CrossRef]
- LeViness, S.; Deshmukh, S.R.; Richard, L.A.; Robota, H.J. Velocys Fischer–Tropsch Synthesis Technology—New Advances on State-of-the-Art. Top. Catal. 2014, 57, 518–525. [Google Scholar] [CrossRef]
- Okoye-Chine, C.G.; Moyo, M.; Liu, X.; Hildebrandt, D. A critical review of the impact of water on cobalt-based catalysts in Fischer-Tropsch synthesis. Fuel Process. Technol. 2019, 192, 105–129. [Google Scholar] [CrossRef]
- Wismann, S.T.; Engbæk, J.S.; Vendelbo, S.B.; Bendixen, F.B.; Eriksen, W.L.; Aasberg-Petersen, K.; Frandsen, C.; Chorkendorff, I.; Mortensen, P.M. Electrified methane reforming: A compact approach to greener industrial hydrogen production. Science 2019, 364, 756–759. [Google Scholar] [CrossRef] [Green Version]
- Hannula, I. Co-production of synthetic fuels and district heat from biomass residues, carbon dioxide and electricity: Performance and cost analysis. Biomass Bioenergy 2015, 74, 26–46. [Google Scholar] [CrossRef]
- Hannula, I. Hydrogen enhancement potential of synthetic biofuels manufacture in the European context: A techno-economic assessment. Energy 2016, 104, 199–212. [Google Scholar] [CrossRef]
- Hombach, L.E.; Doré, L.; Heidgen, K.; Maas, H.; Wallington, T.J.; Walther, G. Economic and environmental assessment of current (2015) and future (2030) use of E-fuels in light-duty vehicles in Germany. J. Clean. Prod. 2019, 207, 153–162. [Google Scholar] [CrossRef]
Figure 1.
Equilibrium gas composition (a) and equilibrium amount (b) at 20 bar pressure as a function of temperature for the reverse water-gas shift (rWGS) reactor feed. Equimolar feed ratio of hydrogen (H2) and carbon dioxide (CO2). Results calculated with HSC Chemistry 9.
Figure 1.
Equilibrium gas composition (a) and equilibrium amount (b) at 20 bar pressure as a function of temperature for the reverse water-gas shift (rWGS) reactor feed. Equimolar feed ratio of hydrogen (H2) and carbon dioxide (CO2). Results calculated with HSC Chemistry 9.

Figure 2.
Block diagrams for the OT-COMB and RC-COMB configurations based on allothermal heating from combustion.
Figure 2.
Block diagrams for the OT-COMB and RC-COMB configurations based on allothermal heating from combustion.

Figure 3.
Block diagrams for the once-through autothermal from partial oxidation (OT-POX) and recycle autothermal from partial oxidation (RC-POX) configurations based on autothermal heating from partial oxidation.
Figure 3.
Block diagrams for the once-through autothermal from partial oxidation (OT-POX) and recycle autothermal from partial oxidation (RC-POX) configurations based on autothermal heating from partial oxidation.
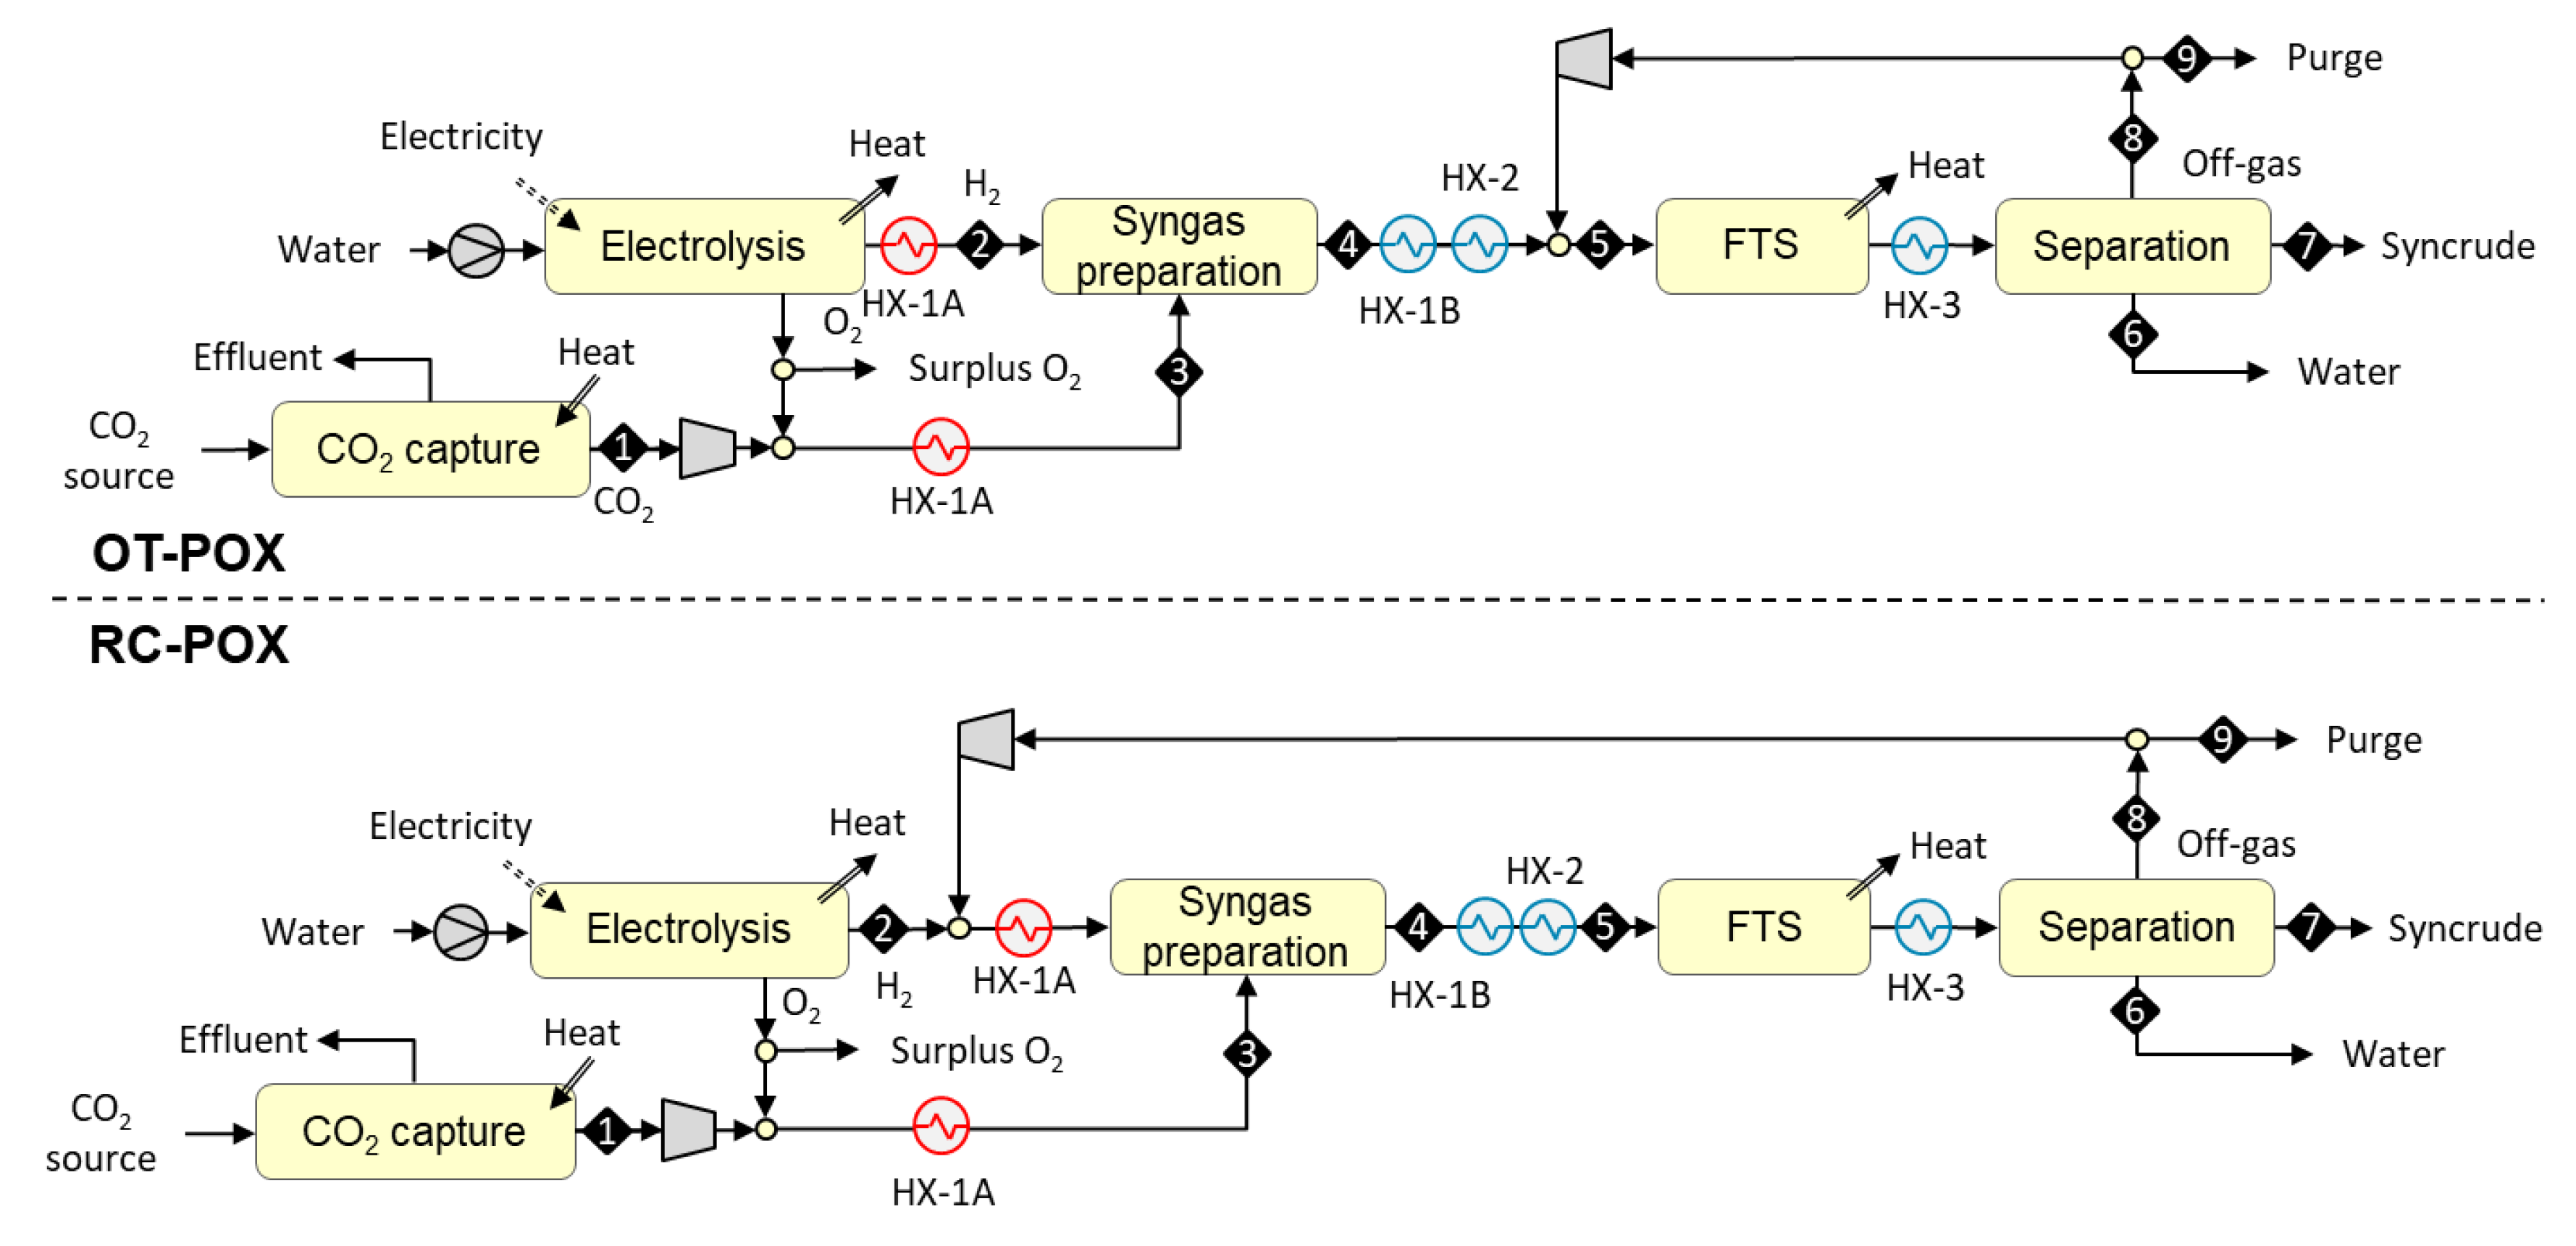
Figure 4.
OT-ER and RC-ER configurations based on autothermal heating from electric resistance.

Figure 5.
Simulated ηthermal and ηCO2 for the examined process configurations when syngas preparation step operated at 900 °C. The ηthermal is calculated separately using two different assumptions on the electrolyzer technology: low temperature electrolyzer (alkaline electrolyzers: AEC/proton exchange membrane: PEM) operating with water at 60% (LHV) net system efficiency, and high temperature electrolyzer (solid-oxide electrolysis cells: SOEC) operating with steam at 90% (LHV) net system efficiency.

Figure 6.
Impact of syngas preparation temperature on ηCO2 (panel a) and ηthermal (panel b) for the examined process configurations assuming low temperature electrolyzer technology operating at 60% net system efficiency.
Figure 6.
Impact of syngas preparation temperature on ηCO2 (panel a) and ηthermal (panel b) for the examined process configurations assuming low temperature electrolyzer technology operating at 60% net system efficiency.
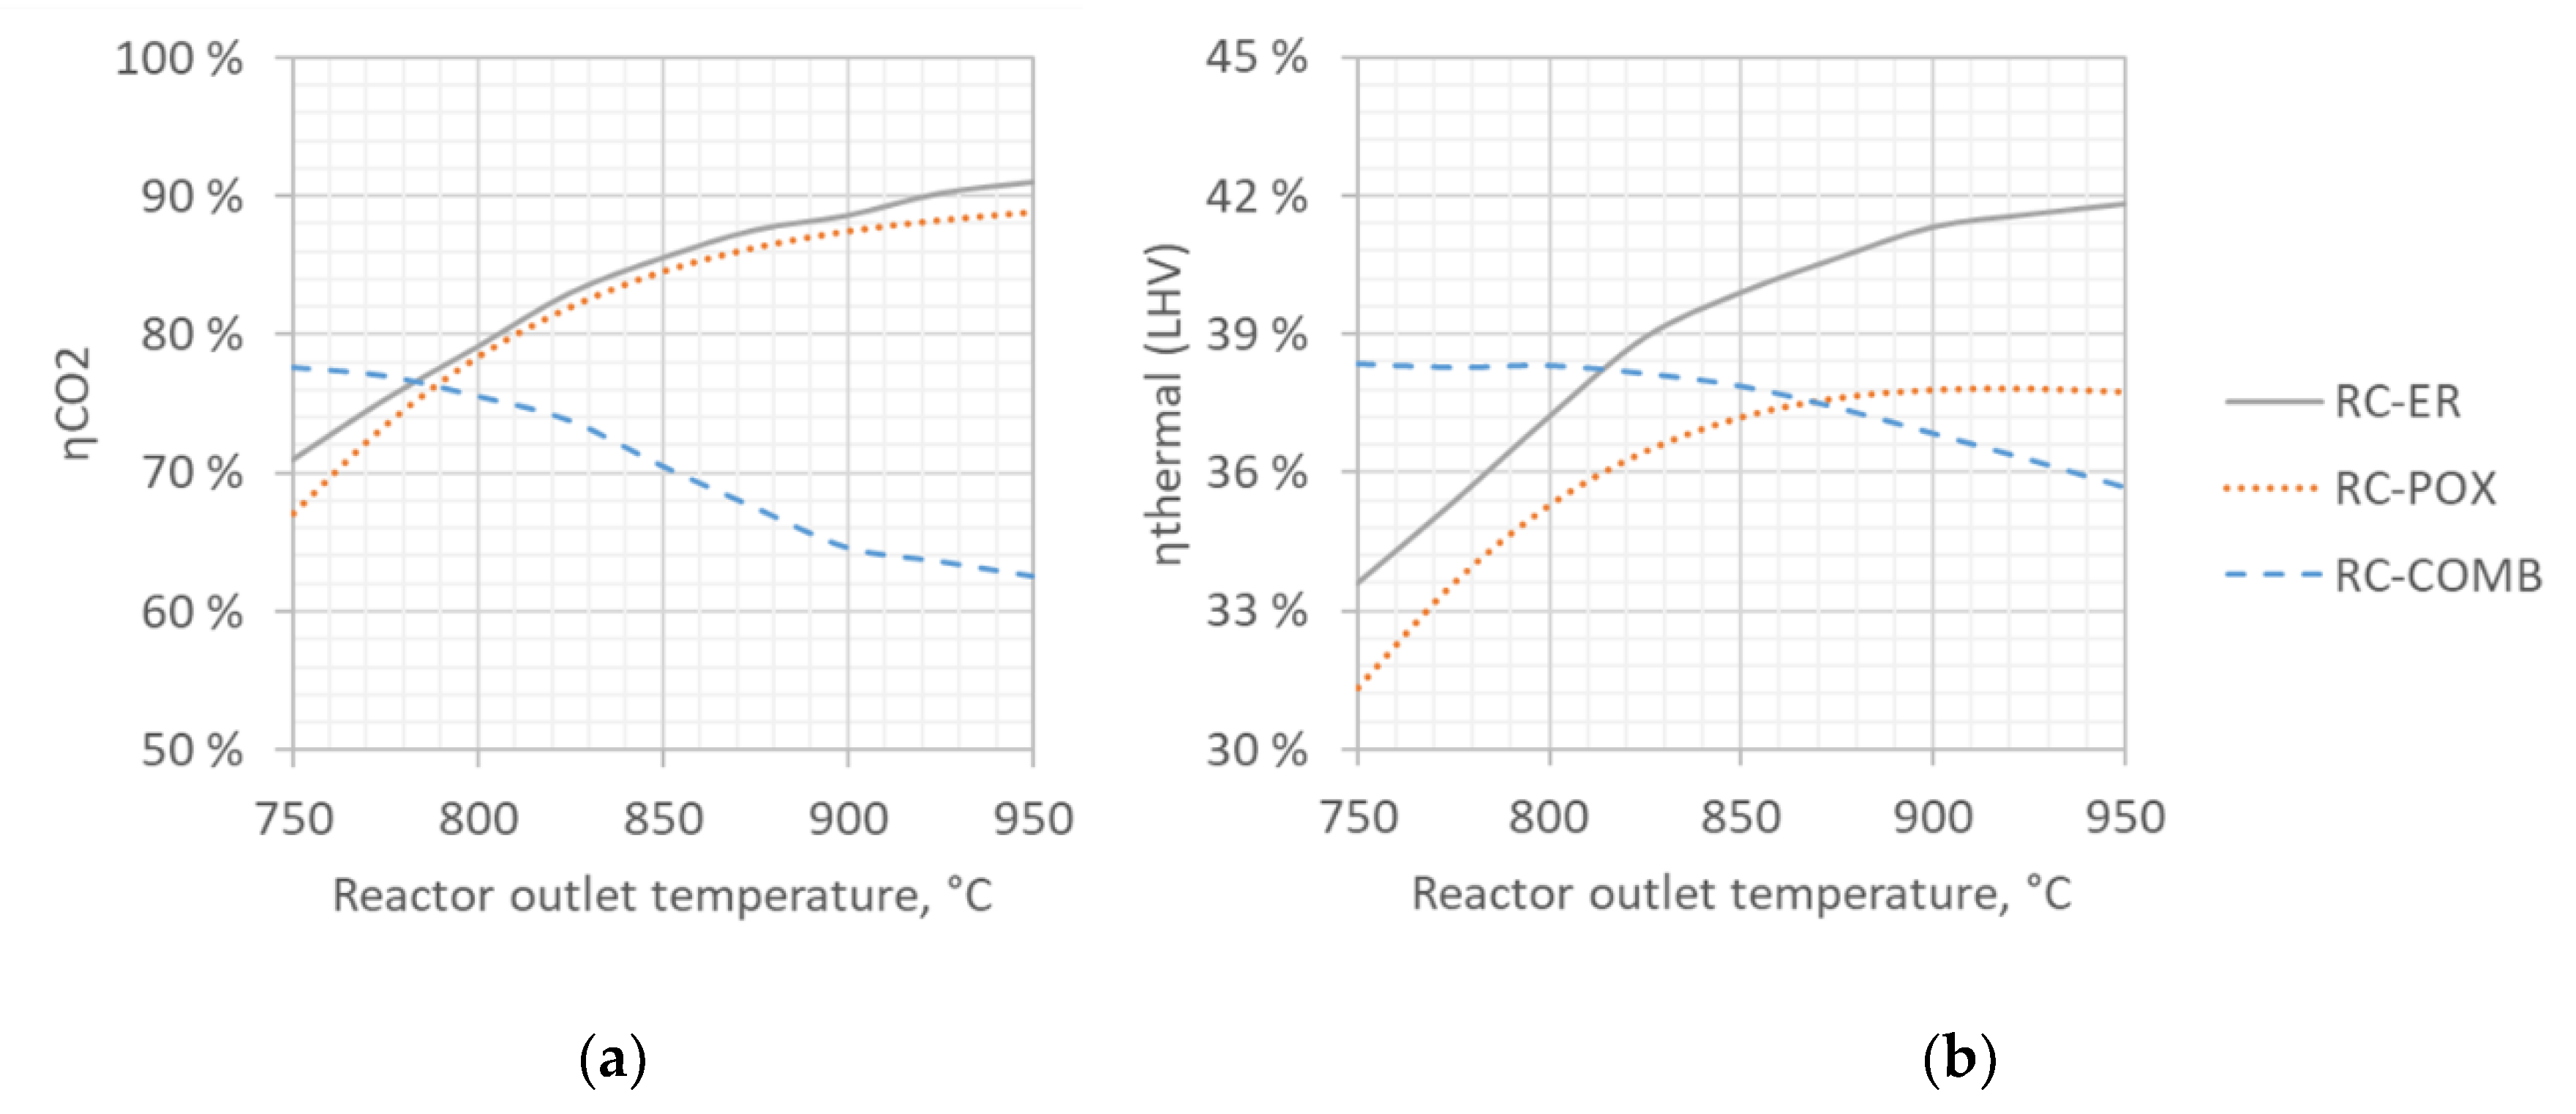
Table 1.
Summary of plant configurations considered in this work. Configurations are identified by two-part acronyms, where first part (once-through: OT or recycle: RC) identifies the placement of the syngas preparation step in the process chain, and the latter part the heat supply method (allothermal from combustion: COMB, partial oxidation: POX or electric resistance: ER).
| Allothermal from Combustion | Autothermal from Partial Oxidation | Autothermal from Electric Resistance | |
|---|---|---|---|
| Once-through | OT-COMB | OT-POX | OT-ER |
| Recycle | RC-COMB | RC-POX | RC-ER |
Table 2.
Summary of process design parameters for Aspen simulations.
| Item | Design Parameters |
|---|---|
| Electrolyser | H2 and O2 purity 100%, Both delivered at 20 bar and 25 °C. Nominal system efficiency from electricity to hydrogen is 60% (LHV) for AEC/PEM and 90% (LHV) for SOEC. |
| Syngas preparation reactor | Reactors modelled with RGibbs using Redlich-Kwong-Soave equation of state with Boston-Mathias modification (RKS-BM). Both phase and chemical equilibrium calculated. All components considered as products. Toutlet = 900 °C, ∆p = −0.5 bar. Target H2/CO ratio at the FT reactor inlet is 2.0 for all examined configurations. |
| Fischer-Tropsch synthesis | Treaction = 220 °C, Pfeed = 19–20 bar, ∆p =−0.5 bar, Boiling-water reactor using cobalt catalysts modelled with RStoic using Redlich-Kwong-Soave equation of state with Boston-Mathias modification (RKS-BM). Carbon monoxide reacts with hydrogen to form n-paraffins at 0.92 α value, with methane selectivity set to 9%. The per-pass CO conversion is set to 75%. Input H2O, CO2, N2 as well as methane, ethane and longer hydrocarbons are considered as inert. For RC-POX and RC-ER configurations, the amount of recycle is chosen to achieve 98% conversion of hydrogen (2% of hydrogen lost in purge). |
| Heat exchangers | ∆p = −0.1 bar, ∆T min = 15 °C (gas-liq), 30 °C (gas-gas). Heat loss = 1% of heat transferred. |
| Compressors | Stage pressure ratio < 2, ηpolytropic = 0.81, ηdriver = 0.90, ηmechanical = 0.98. Tintercooler = 35 °C, ∆p/pintercooler = 1%. |
| Pumps | ηhydraulic = 0.75, ηdriver = 0.90, ηmechanical = 0.98. |
Table 3.
Simulated mass and energy balances for the examined process configurations when syngas preparation step is operated at 900 °C.
Table 3.
Simulated mass and energy balances for the examined process configurations when syngas preparation step is operated at 900 °C.
| CONFIGURATION | OT-COMB | OT-POX | OT-ER | RC-COMB | RC-POX | RC-ER | |
|---|---|---|---|---|---|---|---|
| Feedstocks and intermediates | |||||||
| Captured and concentrated CO2 | kg/h | 1000 | 1000 | 1000 | 1000 | 1000 | 1000 |
| Water for electrolysis | kg/h | 938 | 959 | 936 | 1092 | 1446 | 1216 |
| Electrolytic oxygen | kg/h | 833 | 852 | 831 | 969 | 1285 | 1080 |
| Electrolytic hydrogen | kg/h | 105 | 107 | 105 | 122 | 162 | 136 |
| MW | 3.5 | 3.6 | 3.5 | 4.1 | 5.4 | 4.5 | |
| Products | |||||||
| C5–C12 hydrocarbons | kg/h | 46 | 42 | 46 | 54 | 73 | 74 |
| MW | 0.6 | 0.5 | 0.6 | 0.7 | 0.9 | 0.9 | |
| C13+ hydrocarbons | kg/h | 131 | 120 | 130 | 154 | 208 | 211 |
| MW | 1.6 | 1.5 | 1.6 | 1.9 | 2.5 | 2.6 | |
| Total syncrude (C5+) | kg/h | 177 | 162 | 176 | 208 | 281 | 285 |
| MW | 2.2 | 2.0 | 2.1 | 2.5 | 3.4 | 3.5 | |
| Purge gas | kg/h | 422 | 356 | 97 | 77 | ||
| MW | 0.6 | 0.8 | 0.3 | 0.4 | |||
| Saturated steam | kg/h | 933 | 663 | 762 | 1097 | 1464 | 1500 |
| Condensed water | kg/h | 575 | 642 | 573 | 655 | 1015 | 774 |
| Surplus oxygen | kg/h | 833 | 733 | 831 | 969 | 1053 | 1080 |
| Electricity use | |||||||
| Electrolyser | |||||||
| Low temperature (AEC/PEM) | kW | 5830 | 5961 | 5814 | 6784 | 8989 | 7554 |
| High temperature (SOEC) | kW | 3887 | 3974 | 3876 | 4523 | 5993 | 5036 |
| Syngas preparation | kW | 334 | 774 | ||||
| Main compressor | kW | 74 | 73 | 73 | 77 | 73 | 73 |
| Recycle compressor | kW | 5 | 28 | 26 | 1 | 13 | 11 |
| Combustion air blower | kW | 10 | 12 | ||||
| Water pumps | kW | 1 | 1 | 1 | 2 | 2 | 2 |
| Sum total (AEC/PEM) | kW | 5920 | 6064 | 6249 | 6876 | 9077 | 8415 |
| Sum total (SOEC) | kW | 3976 | 4077 | 4311 | 4615 | 6081 | 5897 |
| Heat recovery | |||||||
| Electrolyser heat (AEC/PEM) | kW | 1846 | 1887 | 1841 | 2148 | 2 846 | 2 392 |
| Syngas cooling | kW | −21 | 274 | 136 | 194 | 418 | 264 |
| Syncrude cooling | kW | 636 | 684 | 610 | 561 | 877 | 671 |
| Flue gas cooling | kW | 404 | 388 | ||||
| FT reaction exotherm | kW | 660 | 469 | 539 | 777 | 1 036 | 1 062 |
© 2020 by the authors. Licensee MDPI, Basel, Switzerland. This article is an open access article distributed under the terms and conditions of the Creative Commons Attribution (CC BY) license (http://creativecommons.org/licenses/by/4.0/).
Share and Cite
MDPI and ACS Style
Hannula, I.; Kaisalo, N.; Simell, P. Preparation of Synthesis Gas from CO2 for Fischer–Tropsch Synthesis—Comparison of Alternative Process Configurations. C 2020, 6, 55. https://0-doi-org.brum.beds.ac.uk/10.3390/c6030055
AMA Style
Hannula I, Kaisalo N, Simell P. Preparation of Synthesis Gas from CO2 for Fischer–Tropsch Synthesis—Comparison of Alternative Process Configurations. C. 2020; 6(3):55. https://0-doi-org.brum.beds.ac.uk/10.3390/c6030055
Chicago/Turabian StyleHannula, Ilkka, Noora Kaisalo, and Pekka Simell. 2020. "Preparation of Synthesis Gas from CO2 for Fischer–Tropsch Synthesis—Comparison of Alternative Process Configurations" C 6, no. 3: 55. https://0-doi-org.brum.beds.ac.uk/10.3390/c6030055
Note that from the first issue of 2016, this journal uses article numbers instead of page numbers. See further details here.