Article

Quality, Yield, and Biomass Efficacy of Several Hydroponic Lettuce (Lactuca sativa L.) Cultivars in Response to High Pressure Sodium Lights or Light Emitting Diodes for Greenhouse Supplemental Lighting

by
Erica Hernandez
1,
Michael B. Timmons
2 and
Neil S. Mattson
1,*
1
School of Integrative Plant Science, Cornell University, Ithaca, NY 14853, USA
2
Department of Biological and Environmental Engineering, Cornell University, Ithaca, NY 14853, USA
*
Author to whom correspondence should be addressed.
Submission received: 27 November 2019 / Revised: 6 January 2020 / Accepted: 19 January 2020 / Published: 27 January 2020
(This article belongs to the Special Issue Advances in Knowledge of Hydroponic and Aquaponic Systems)

Abstract

:
Lettuce is an economically important crop that can be grown either in the field or greenhouse. Different challenges are present in either environment; therefore, cultivar selection is important. For hydroponic greenhouse lettuce there is relatively little published information on cultivar selection under different lighting sources. The objective of phase 1 was to determine the influence of lighting using high pressure sodium (HPS) or light emitting diodes (LED) on plant fresh weight, height, tip burn index, bolting, and Brix. Phase 2 was similar to phase 1 but with fewer cultivars (1) to allow for greater number of replicates per treatment per crop cycle. Each experiment consisted of three crop cycles over time per phase. Light sources were controlled using an algorithm, Light and Shade System Implementation (LASSI), to achieve a constant average daily light integral under each treatment and crop cycle. Electrical consumption and efficacy (fresh weight per kWh) from each treatment was estimated using data collected on power consumption from representative lamps multiplied by the number of fixtures and the hours fixtures were on per crop cycle. In phase 1, the fresh weight of 2 to 3 cultivars was greater under HPS and 1 to 2 cultivars under LED, depending on production cycle. The HPS-grown lettuce tended to have more tip burn and bolting in crop cycles 1 and 2, with cycle 3 showing similar tip burn incidence. Bolting was only consistently observed in one cultivar, ‘Teodore’. The LED array used less than half as much electricity as the HPS array, while producing relatively similar size lettuce, therefore, leading to electrical efficacies two- to three-times higher in LED than in HPS treatments. In phase 2, significant differences in height were found in ‘Greenstar’ and ‘Xandra’, with HPS producing larger plants than LED. Significant differences were also found in diameter in ‘Greenstar’, ‘Xandra’, ‘Locarno’, and ‘Crunchita’, with HPS again being larger than LED.

1. Introduction

Lettuce is a globally important crop, with a combined harvest of over 25 million tons in 2016 [1]. This number has increased steadily since 1995 [1]. Global production occurs on 1.25 million hectares of agricultural land. The United States is one of the top lettuce producers in the world, coming in second behind mainland China. Lettuce is the third most popular vegetable in the U.S. behind potatoes and tomatoes with an annual consumption of 25.5 pounds per capita per year [2]. As a cool-weather crop, lettuce has cooler air temperature requirements than some other popular greenhouse crops [3]. Optimally, day temperatures should be around 23 °C and night temperatures around 17 °C. Bolting begins to be a problem as air temperatures rise and slowing of growth occurs with lower temperatures. Typical growth periods last anywhere from 65 to 80 days in the field, from seed to harvest, for full heads of lettuce during the summer, and up to 130 days during the winter. With this clear seasonal variation, greenhouse growing offers the benefits of stabilized climate and more consistent time to harvest. Beyond climate control, greenhouses also offer the ability to control lighting and shading conditions as well as CO2 enrichment through the use of shading practices or the addition of supplemental lights [4].
Daily light integral (DLI) is an important factor to control to achieve consistent growth rates for vegetable production. There is a direct relationship between the amount of light received and dry matter accumulation in lettuce, which makes DLI control relevant to greenhouse lettuce growers. Research into optimal DLI for lettuce production is well established, as much work has been done examining differing light levels. Both et al. determined that the optimal DLI for lettuce sits at 17 mol·m−2·d−1 after examining 35 different treatments between 8 and 22 mol·m−2·d−1 [4]. Traditionally high-intensity discharge (HID) fixtures such as high pressure sodium (HPS) or metal halide (MH) have been used for supplemental lighting of lettuce in greenhouses. However, as LED cost decrease and efficacy increases, the adoption of LEDs has become more common.
Light emitting diodes (LEDs) are semiconductors that emit light when an electrical current passes through them. By varying the semiconductor materials used, different spectra (i.e., wavebands) can be obtained. The investigation into the use of LEDs for horticultural applications began in the late 1980s and early 1990s. While early studies were conducted with space-based missions in mind, applications on the ground have become more and more economically feasible as the technology progressed. These early studies involved red-only LEDs but have since developed to encompass a wide array of color capabilities [5].
With the advancement of LED technology, there are some advantages of LEDs as compared to existing horticultural lights (HPS and metal halide). Examples include photosynthetically active radiation (PAR) efficacy [6], the ability to target specific wavebands/spectra of light, finer control over light intensity and periodicity of lighting [7], and a lower heat load produced in the direction of the light allowing them to be placed closer to a crop or operated during warm ambient conditions [5,8]. When comparing potential for energy savings in LED over HPS lights the PAR efficacy, light output per unit electricity (units: µmol/j) is used [9]. However, PAR efficacy only tells us about fixture performance and does not account for plant performance under a lighting source. The biomass efficacy refers to the edible fresh weight or dry weight per unit electricity (units: g/kWh) under a given lighting fixture in a specific crop production environment.
A body of information has begun to develop on impacts of HPS versus LED lighting [10]. When grown under HPS lamps and LEDs of the same intensities, net photosynthesis was not affected in lettuce [8]. Regarding morphological effects, under spectrums containing higher percentages of blue and UV light, lettuce heads tend to be more compact but slightly denser [8]. In red leaf lettuce, the red pigment anthocyanin increases in concentration with greater blue light exposure [11]. Leaf area and leaf expansion increases under increasing red light exposure [8]. Some work is currently being done to observe the effects of green light on lettuce and understand the biological mechanisms involved, but as of yet, this system is still not completely understood [12].
While there has been previous research on the use of LEDs for lettuce, many research projects focus their efforts on a few carefully selected lettuce cultivars in order to observe specific responses in those cultivars. As such, there is not much directly comparable research between multiple cultivars when looking at yield, morphology, and sensory analyses. Though previous research has shown that yield and morphology response to spectral quality in lettuce is highly cultivar dependent, it has not been shown whether those responses remain the same within the same type of cultivar, e.g., all red leaf or romaine lettuce react the same under the same spectral treatments [8]. Some LEDs on the market now have greater PAR efficacy than HID [6], but more work is needed to test fixture biomass efficacy, to determine if their adoption will ultimately lead to reduced energy use by the controlled environment agriculture (CEA) industry.
The objectives of this study were to determine the influence of LED and HPS lighting on the yield and morphology of several cultivars of hydroponic lettuce. Finally, we wanted to determine the biomass efficacy of each lighting system. This article contains the cumulative results of two phases of research (each with three crop cycles) to achieve these objectives.

2. Methods and Materials

This project consisted of two separate experimental phases of growth and data collection activities.
Phase 1 growth cycles took place between January and May 2018, and phase 2 growth cycles took place between June and October 2018 in Ithaca, NY (42° N latitude). A 20 channel NFT system (FarmTek, South Windsor, CT, USA) was constructed. The system consisted of 20 nutrient film technique (NFT) channels with alternating plant placement holes, there were 18 per channel with 20.3 cm spacing center to center. This table was split into two 10-chanel tables to separate HPS and LED treatments while maintaining the same nutrient reservoir. The 125-gallon reservoir was prepared with a nutrient solution as described below. The nutrient solution pH and EC were monitored daily and maintained between 5.5 to 6.5 (using 1 M sulfuric acid) and 1.9 and 2.1 dS·m−1 (using the fertilizer recipe described in further detail below. The nutrient solution was prepared with tap water at the beginning of every new production cycle and replaced thereafter every two weeks. Water levels were topped off from municipal tap water once per week to every three days depending on plant age. Prior to transplanting in NFT channels, seeds were sown into 2.5 cm Oasis Horticubes XL (Oasis, Kent, OH, USA) and grown under HPS lamps for approximately 21 days before being moved into the main treatment tables at the fourth leaf.
One table with 10 NFT channels was placed under an array of six 1000-W HPS lights as described in experiment 1. The second table was placed under an array of six LED fixtures (Lumigrow Pro 650e, Emeryville, CA, USA), which were arranged in an identical pattern and height to the HPS, with their intensity adjusted using SmartPAR software (Lumigrow, Emeryville, CA, USA) to match that of the HPS array (180 µmol·m−2·s−1). The LEDs were adjusted to a 20% blue, 80% red ratio of light using the SmartPAR software. A daily light integral (DLI) of 17 mol·m−2·d−1 was chosen. The daily light integral (DLI) under each array was maintained at 17 mol·m−2·d−1 using the Light and Shade System Implementation (LASSI) algorithm [13]. LASSI is a computer algorithm to control DLI in greenhouses with highly variable ambient light conditions [13]. Briefly the LASSI algorithm has inputs for: light intensity that is provided by supplemental lights, minimum dark period (if any), day of the year, time of the day, and a running sum of daily PPFD. The algorithm uses the information to make decisions at each time-step (in this experiment, every half-hour) as to whether lights must be turned on now to reach the DLI target or can the lighting decision be delayed until the next time step. The algorithm is dynamic as “the algorithm drew from no historical weather data and received no advance notice of the weather expected for the day.” [13]. When compared to light threshold strategy (in which lighting decisions are based on instantaneous light levels rather than accumulated light integral), the LASSI algorithm was more accurate at reaching target DLI and exhibited energy savings versus threshold control [14]. In our experiments, a quantum sensor (LI-190R, LI-COR, Lincoln, NE, USA) to measure photosynthetic photon flux density (PPFD) was placed at the canopy level at a representative location under each of the two lighting arrays. The quantum sensors were connected to an Arduino/Raspberry Pi combined microcontroller system which logged PPFD and sent values via a wireless internet signal to a separate Raspberry Pi which ran the LASSI algorithm and every half-hour communicated light decisions to the connected to the greenhouse environmental control system (Argus, Montreal, QC, Canada). Table 1 contains a summary of the average hours per day the light arrays were on for each crop cycle in phase 1 to reach the 17 mol·m−2·d−1 DLI target.
A water sample was taken from the tap supplied to the greenhouse range on 14 September 2017, and analyzed by the Cornell Nutrient Analysis Laboratory (Bradfield Hall, Ithaca, NY, USA). Water was analyzed for Al, As, B, Ba, Be, Ca, Cd, Co, Cr, Cu, Fe, K, Li, Mg, Mn, Mo, Na, P, Pb, S, Si, Sr, V, and Zn. Relevant values are included in Table 2. Elements that tested under 15 mg/L are omitted from the results analysis. The highest values detected are calcium, sodium, magnesium, and sulfur.
Powdered nutrient salts were that were used included a semi-complete hydroponic fertilizer (Ultrasol 3-15-28 Hydroponic, SQM North America, Atlanta, GA, USA) supplemented with calcium nitrate Calcinite 15.5-0-0, YaraLiva, Tampa, FL, USA) at the label rate of 1.0 g/L Ultrasol 3-5-28 and 0.8 g/L of Calcinite 15.5-0-0. Table 3 compares the nutrient concentration of Ultrasol plus Calcinite with a modified Sonneveld’s solution typically used by Cornell CEA projects.
Phase 1 consisted of 13 cultivars of lettuce that were grown in each of the three crop cycles. The 13 cultivars were: ‘Rex’, ‘Teodore’, ‘Locarno’, ‘Xandra’, ‘Rouxai’, ‘Big Star’ (referred to as ‘Greenstar’), ‘Rocky Row’, ‘Carmessi’, ‘Crunchita’, ‘Lotus’, ‘Seurat’, ‘Aquino’, and ‘Barlach’. The experiment was arranged as a randomized complete block design with two blocks of 5–6 replicates per cultivars per block per lighting treatment with a total of three production cycles. Due to their large size, the romaine cultivars were spaced to contain one empty plant slot between each head. For all three crop cycles data was collected on lettuce head fresh weight (with head separated from roots just above the NFT channel). In the second replicate, Brix data was collected. In the third replicate, data were also collected on plant height (from the severed base to the highest part of the plant) and width (diameter of the widest part of the plant).
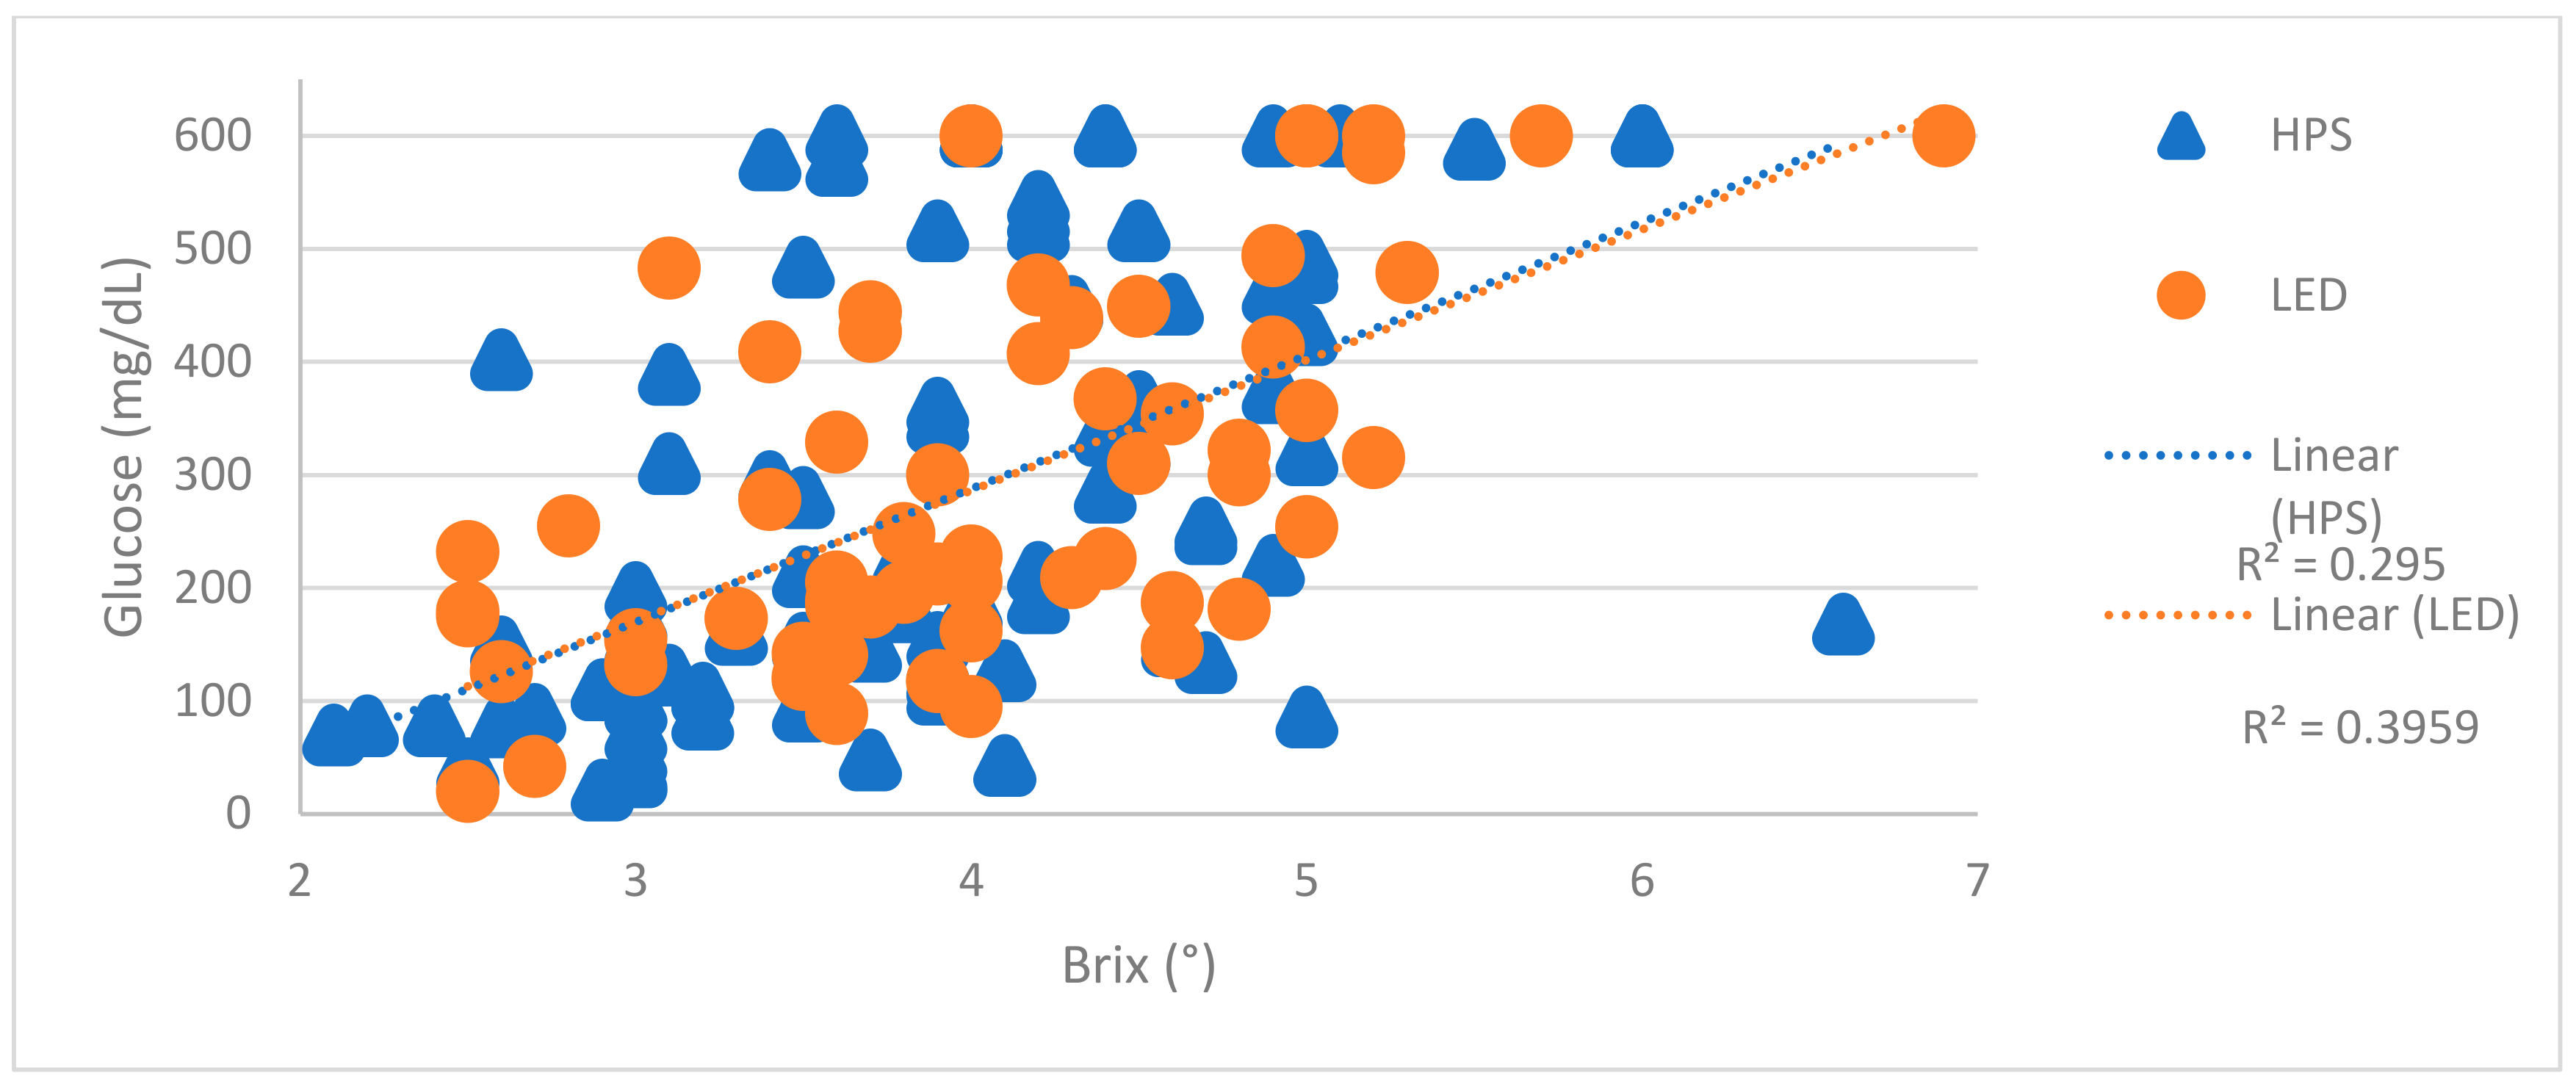
Brix and glucose were recorded in crop cycle two in an attempt to collect some quantitative data which may be associated with flavor. We developed a protocol whereby 2 to 4 recently mature leaves from each lettuce head were placed in a quart-size freezer bag and placed in a freezer (−18 °C) for one week. Once frozen, samples were removed from the freezer, crushed and ground, and allowed to defrost. Juice was allowed to collect in the bags before being read with a handheld refractometer (SIM Supply, Hibbing, MN, USA). Glucose measurements from 159 samples per cultivar were also taken using a One Touch (LifeScan, Inc., Milpitas, CA, USA) blood glucose monitor to measure the same liquid samples used for Brix measurement. The range of the meter used was 0 to 600 mg·L−1. Brix testing was specifically requested by the company sponsors, while glucose was not.
Electrical Efficacy—To estimate the biomass efficacy of each lighting treatment (g edible fresh weight/kWh electricity) we summed the harvestable fresh weight from each treatment and then divided this by estimated electricity consumption. Electricity consumption was estimated by using logged data on the number of hours lighting arrays were on for each crop cycle and multiplying this by the instantaneous electricity use of each array (W). The instantaneous use of each array was estimated by plugging select fixtures into an electricity usage monitor. There are several qualifying statements that need to be made about biomass efficacy estimates. First, it is merely an estimate, as every light was not measured individually to check for electrical usage. Secondly, the HPS bulbs had already been used for several thousand hours while the LED fixtures were new. Third, no effort was made to quantify the amount of unused light lost to the perimeters of the growing area. Nevertheless, we feel studies with food crops and lighting should report biomass efficacy as observed under their experimental conditions.
Due to fairly large plant to plant variability noted in phase 1, we decided to conduct three additional growth cycles with five select cultivars, to allow for more replicates per cultivar per lighting treatment (Phase 2). The three crop cycles took place during June to October 2018, and the crop cycle length was 55, 55, and 53, days for crop cycles 1, 2, and 3, respectively.
Statistical analyses were performed in R (RStudio, Version 1.1.414, the R Foundation) by employing analysis of variance (ANOVA) tables and mixed effect linear models. The experiment was set up in a randomized block design through experiments II and III, with random effects of harvest cycle and block taken into consideration. Fixed effects of light and cultivar, and interactions between light and cultivar, were factored in. After controlling for fixed effects and their interaction, a mean separation comparison was conducted to compare cultivars using a post hoc Tukey’s Honestly Significant Difference (HSD) at α = 0.05.

3. Results

3.1. Phase 1

3.1.1. Fresh Weight

For 12 of the 13 cultivars, lighting treatment did not significantly impact fresh weight (Table 4). In the case of ‘Teodore’ plants under LED were smaller than HPS. However, it should be noted that ‘Teodore’ heads were almost always bolting at harvest and this was more prominent under HPS.
In comparing the fresh weight of cultivars to each other mean fresh weight varied from 53.42 to 227.7 g (Table 4). The largest cultivars produced were ‘Greenstar’ (HPS: 189.79 ± 20.99 g) and ‘Rocky Row’ (HPS: 227.70 ± 20.8 g), both of which were field cultivars provided by Dole. The smallest cultivars were ‘Locarno’ (HPS: 53.42 ± 20.83 g) and ‘Carmessi’ (57.33 ± 20.83 g). The consistency of plants within a cultivar is indicated by the standard error. While ‘Greenstar’ and ‘Rocky Row’ were our largest cultivars, they also had the widest range of possible final harvest sizes. This variability could make difficult to reach a consistent harvest size by a given date. Our cultivars with the least variability across harvests were ‘Carmessi’ and ‘Rex’, though many of the smaller cultivars were fairly consistent producers.

3.1.2. Brix and Glucose

Brix and glucose values were taken in crop cycle 1. Table 5 lists the mean and p value measured for each cultivar (sample loss and inconsistency of glucose test strips meant that not every plant was measured for Brix and glucose).
Brix values averaged between 2 to 5. ‘Greenstar’ and ‘Rouxai’ were the only two cultivars that had average brix values higher under HPS; all other cultivars averaged higher brix under LED (Table 5). The cultivar with the highest average brix was ‘Greenstar’, with an average of 5.19 brix, while the lowest was ‘Barlach’, with an average brix of 2.74.
A statistical model for brix results was designed incorporating lights, cultivar, position within tables, and the interaction factor between cultivar and lights. No statistically significant differences were found to an alpha of 0.1, although this may be attributed to a small sample size being used. As seen with height and width data, significant differences were found once sample size was increased from 60 total to 216 total per cultivar. Brix data collection was only performed once, for a max sample size of 20 total per each cultivar, with half of the samples being under each treatment. Some cultivars approached an alpha of 0.1, but none were less than 0.14.
A Tukey’s multiple comparison test was performed to identify which cultivars under which treatments were significantly different from each other or could be grouped together. Five separate groups were identified, though most cultivars and treatments were included in three or more groups.
Because personal glucose monitors are available inexpensively in the medical market, we wished to determine if lettuce glucose (as measured using test strips) correlated with brix. There was a slight positive correlation between glucose and brix with an R2 of 0.295 for HPS and 0.396 for LED (Figure 1).
A statistical model for glucose results was designed to look at the relationship between brix and glucose, including the factors of lights, cultivar, position within tables, and the interaction between lights and cultivar. No significant differences were detected to an alpha of 0.1, but sample size was not consistent among cultivars or treatments. Again, only one harvest cycle was used to record measurements, for a max sample size of 20 total. Due to equipment failures and sample loss, some cultivars under individual lighting treatments had as few as two samples, and up to as many as 10.
To analyze the relationship between glucose and brix values, an analysis of variance was run on the glucose model to determine if there was a significant relationship with brix, cultivar, light, brix × light, and cultivar × light (Table 6). Two terms were found to be significant predictors of glucose values: brix and cultivar. These results indicate that observed brix values most likely correlate strongly to glucose (sugar) results, and that the results are strongly cultivar-dependent. Importantly, light treatment did not appear to affect results. Given the previously discussed data issues, however, we would avoid drawing any strong conclusions without gathering more data to increase sample size. Future work in this area could be done using better equipment with a larger number of plants.

3.1.3. Height

Data was collected on height for the third crop cycle. At an alpha of 0.05, significant differences between HPS and LED lettuce were noted in two cultivars: ‘Lotus’ and ‘Rocky Row’ (Table 7). In both cases, HPS plants were taller than LED. Both cultivars belong to the Romaine group and are two of the tallest cultivars grown. At α = 0.1, ‘Greenstar’, was also taller under HPS than LED.

3.1.4. Diameter

Data on plant diameter data (width at widest point) were also collected from the third crop cycle in experiment 2. At an alpha of 0.05, there were no statistically significant differences observed within our data plants (Table 8). At an alpha of 0.1, only one cultivar, ‘Rouxai’, had a significantly different diameter in response to light treatment.

3.1.5. Biomass Efficacy

As the phase 1 crop cycles progressed (from the winter to spring season) decreased need for supplemental lighting was required to reach the 17 mol·m−2·d−1 DLI target. This is reflected in the total kWh used and average daily kWh decreased substantially as crop cycles progressed from 1 to 3 (Table 9). When comparing light sources, electricity consumption was greater under HPS than LED (Table 9). Edible mass is defined as the total head weight of lettuce. For harvest 1, HPS lights produced a total of 7.67 g edible mass per estimated kWh electricity, while LEDs produced a total of 18.57 g. For harvest 2, HPS produced 13.83 g, while LED produced 42.42 g. For harvest 3, HPS produced 25.70 g, while LED produced 66.04 g. Therefore, under the conditions of our experiment, the LED treatment led to a 2.4 to 3.1 times biomass efficacy than HPS. As noted in the materials and methods, several cautions must be taken with these estimates, such as age of lights, electrical use variations, and wasted light.

3.2. Phase 2

3.2.1. Fresh Weight

In phase 2, we grew only six cultivars of lettuce to increase our sample size per cultivar. Even at an alpha of up to 0.1, there were no significant differences found in fresh weight between HPS and LED treatments (Table 10).

3.2.2. Height

Significant differences were detected in both ‘Greenstar’ and ‘Xandra’ (Table 11). The HPS ‘Greenstar’ diameter mean was 1.87 cm larger than LED (13.66 ± 0.4 HPS versus 11.79 ± 0.66 LED), while LED ‘Xanda’ was 3.72 cm larger than HPS ‘Xandra’ (15.65 ± 0.48 LED versus 11.93 ± 0.66). All other cultivars had no significant differences between groups. Both fresh weight and height of ‘Locarno’ were highly variable, suggesting it is not a reliable cultivar under the environmental conditions of our experiment.

3.2.3. Diameter

Cultivars ‘Crunchita’, ‘Greenstar’, ‘Locarno’, and ‘Xandra’ exhibited significant differences in means between HPS-grown and LED-grown plants (Table 12). The HPS ‘Crunchita’ plants were 1.2 cm larger than LED plants. HPS ‘Greenstar’ plants were 1.8 cm larger than LED plants. The HPS ‘Locarno’ plants were 1.21 cm larger than LED plants. The HPS ‘Xandra’ plants were 1.77 cm larger than LED plants.

4. Discussion

Growing lettuce in greenhouses often requires supplemental lighting during off-season production as ambient light levels drop, depending on geographical location of greenhouses. As such, the debate over what type of supplemental lighting to use continues to evolve as technology rapidly changes. Interestingly, in 2014, the electrical efficacy of evaluated LED fixtures was no better than the best HPS fixtures [15]. However, by 2016, the best evaluated LED fixture was 40% more efficacious than HPS [6]. Historically, HID fixtures have been used for supplemental lighting, but LED adoption is increasing within the greenhouse industry. A difficulty with LED is the high initial capital investment. In 2014, LED fixtures tended to cost five to 10 times more than HPS [15]. Earlier studies with HPS and LED have also observed significant energy saving when using HPS over LED lights in the production of lettuce [10].
The results of this study indicate that similar growth and appearance is achievable through the use of LEDs, which comes with a significant savings in electrical operations cost. Our study found few yield or morphological effects of light source. Martineau et al., found a similar result with Boston lettuce, but there was no inclusion of red leaf cultivars [10]. This study also combined ambient sunlight with supplemental HPs and LED fixtures, using red and blue LEDs comparable to those used in the current study. Another study published in 2017 compared the differences in growth of one type of green head lettuce grown in the field under different colored shade clothes and did find significant differences between red and blue colors when comparing head weights and diameters [16]. Lettuce diameter is affected by leaf expansion, and the 2017 study observed greater leaf area and larger diameters under red shade cloths. In the current study only once sample size was increased two-fold did difference begin to become significant: taller and wider heads were observed in several cultivars under HPS lighting as opposed to the LED treatment, which contained a higher proportion of blue light. Though these results were significant, the practical significance with differences of 1–2 cm can be argued.
The relatively minor impact of light treatment in our experiment and those previous may also be because our experiment as in a greenhouse with a background of sunlight. The spectral differences in HPS versus LED fixtures appears to have been minimized by ambient sunlight. It should be noted that as our phase 1 experiment progressed from cycle 1 to cycle 3 less need for supplemental light was required (Table 1). Therefore, while there was not a statistically significant effect of light source on FW of 12 cultivars, it is possible that if the experiment was conducted only under winter conditions there would be more apparent differences.
Anthocyanin production in response to blue light is a well quantified response in certain lettuce cultivars. Working with red leaf lettuce, Stutte et al. [11] found that wavelength of light provided in a sole source lighting environment had a dramatic effect on anthocyanin production as well as total plant growth when compared to fluorescent lighting of the same intensity. A red-blue spectrum produced four times as much anthocyanin content as a red spectrum alone, when grown at the same intensities. However, although these are large differences, the work was conducted in growth chambers, under sole-source lighting.
HPS and LED lights have a significant difference in distribution patterns that can make the choice between the two of them very application-dependent. LEDs tend to have a narrower focus in lighting area, better lending them to use in greenhouses that have aisles, benches, or walk ways. HPS lights have a broader distribution, enabling them to better cover wider areas more evenly [15]. These distribution pattern differences will lead to a difference in hanging distribution of lights and potentially affect the number of lights a grower will need for even coverage. The present study has shown that LEDs can offer a significant savings in electrical consumption while producing the same quality of lettuce, but the grower must still decide if the start-up costs are worth the savings over time. A thorough study of lights required should be conducted for each operation individually.

5. Conclusions

In conclusion, cultivar selection for hydroponic lettuce production within a greenhouse must take several factors into account, but lighting may have less of an impact on yield and morphology than some growers are aware of. Large savings in electrical consumption can be achieved through light selection, control, and distribution, while still producing lettuce of consistent size and appearance.

Author Contributions

E.H. conducted the main bulk of the data collection and analysis, as well as initially designing the experiment and deciding which factors to focus on for analysis, and drafted the manuscript. M.B.T. assisted with the editing, reviewing, and analyzing of data collected during the research project. N.S.M. assisted with the experimental design and facilitated communication between the lab and the company sponsors. Editing and revision of the manuscript was also provided, as well as analysis and interpretation of experimental results. All authors have read and agreed to the published version of the manuscript.

Funding

Financial support was received from the USDA National Institute of Food and Agriculture, Multistate Research Project NE-1335: Resource Management in Commercial Greenhouse Production; CEA Fresh Farms in the form of equipment donation in the form of production tables, nutrient supplies, and seed stock; Lumigrow provided the lighting equipment; Mike Rutzke supplied knowledge on fertilizer use and analytical services for water and nutrient samples.

Conflicts of Interest

The authors declare no conflicts of interest.

References

  1. FAO Stat. Available online: http://www.fao.org/faostat/ (accessed on 6 November 2018).
  2. Bentley, J. Potatoes and Tomatoes Account for Over Half of US Vegetable Availability. 2015; USDA Economic research service. Available online: https://www.ers.usda.gov/amber-waves/2015/september/potatoes-and-tomatoes-account-for-over-half-of-us-vegetable-availability/ (accessed on 10 November 2018).
  3. Smith, R.; Cahn, M.; Daugovish, O.; Koike, S.; Natwick, E.; Smith, H.; Subbarao, K.; Takele, E.; Turini, T. Leaf lettuce production in California. Vegetable Production Series. University of California Agriculture and Natural Resources Publication 7216. 2011. Available online: https://anrcatalog.ucanr.edu/pdf/7216.pdf (accessed on 10 November 2018).
  4. Both, A.; Albright, L.; Langhans, R. Coordinated management of daily par integral and carbon dioxide for hydroponic lettuce production. Acta Hortic. 1998, 456, 45–52. [Google Scholar] [CrossRef]
  5. Morrow, R.C. LED Lighting in Horticulture. HortScience 2008, 43, 1947–1950. [Google Scholar] [CrossRef] [Green Version]
  6. Wallace, C.; Both, A. Evaluating operating characteristics of light sources for horticultural applications. Acta Hortic. 2016, 1134, 435–444. [Google Scholar] [CrossRef]
  7. Davis, P.A.; Burns, C. Photobiology in protected horticulture. Food Energy Secur. 2016, 5, 223–238. [Google Scholar] [CrossRef]
  8. Ouzounis, T.; Rosenqvist, E.; Ottosen, C.-O. Spectral Effects of Artificial Light on Plant Physiology and Secondary Metabolism: A Review. HortScience 2015, 50, 1128–1135. [Google Scholar] [CrossRef] [Green Version]
  9. Both, A.-J.; Bugbee, B.; Kubota, C.; Lopez, R.G.; Mitchell, C.; Runkle, E.S.; Wallace, C. Proposed Product Label for Electric Lamps Used in the Plant Sciences. HortTechnology 2017, 27, 544–549. [Google Scholar] [CrossRef] [Green Version]
  10. Martineau, V.; Lefsrud, M.; Naznin, M.T.; Kopsell, D.A. Comparison of Light-emitting Diode and High-pressure Sodium Light Treatments for Hydroponics Growth of Boston Lettuce. HortScience 2012, 47, 477–482. [Google Scholar] [CrossRef] [Green Version]
  11. Stutte, G.W.; Edney, S.; Skerritt, T. Photoregulation of Bioprotectant Content of Red Leaf Lettuce with Light-emitting Diodes. HortScience 2009, 44, 79–82. [Google Scholar] [CrossRef] [Green Version]
  12. Kim, H.-H.; Goins, G.D.; Wheeler, R.M.; Sager, J.C. Green-light Supplementation for Enhanced Lettuce Growth under Red- and Blue-light-emitting Diodes. HortScience 2004, 39, 1617–1622. [Google Scholar] [CrossRef] [PubMed] [Green Version]
  13. Albright, L.D.; Both, A.-J.; Chiu, A.J. Controlling greenhouse light to a consistent daily integral. Trans. ASAE 2000, 43, 421–431. [Google Scholar] [CrossRef]
  14. Harbick, K.; Albright, L.D.; Mattson, N.S. Electrical savings comparison of supplemental lighting control systems in greenhouse environments. In Proceedings of the 2016 ASABE Annual International Meeting. American Society of Agricultural and Biological Engineers, Orlando, FI, USA, 17–20 July 2016; p. 8. [Google Scholar] [CrossRef]
  15. Nelson, J.A.; Bugbee, B. Economic Analysis of Greenhouse Lighting: Light Emitting Diodes vs. High Intensity Discharge Fixtures. PLoS ONE 2014, 9, e99010. [Google Scholar] [CrossRef] [PubMed] [Green Version]
  16. Ilić, S.; Milenković, L.; Dimitrijević, A.; Stanojević, L.; Cvetković, D.; Kevrešan, Ž.; Fallik, E.; Mastilović, J. Light modification by color nets improve quality of lettuce from summer production. Sci. Hortic. 2017, 226, 389–397. [Google Scholar] [CrossRef]
Figure 1. Recorded glucose responses graphed against recorded brix values. Data are raw responses of individual plants that were read for both brix and glucose. Orange dots represent LED-grown plants, and blue triangles represent HPS-grown plants. Linear regression lines are overlaid.
Horticulturae 06 00007 g001
Table 1. Mean ± standard deviation of number of hours each lighting array was on each day during phase 1, broken down by harvest cycle.
Daily on HoursHPSLED
Cycle 119.8 ± 5.4118.2 ± 5.6
Cycle 215.5 ± 6.5913.0 ± 7.89
Cycle 39.8 ± 6.659.9 ± 5.54
Temperature set points were 21/17 °C day temperature/night temperature.
Table 2. Water analysis of greenhouse tap water, with values listed in mg/L.
Concentration (mg/L)
CaKMgNaPSSi
63.91.614.150.10.412.01.3
Table 3. Nutrient concentration (mg/L) of two fertilizer solutions. This lettuce study used a combination of Ultrasol + Calcinit and is compared to the Sonneveld’s solution as a reference used by Cornell Controlled Environment Agriculture program in other projects.
Concentration (mg/L)
ElementUltrasol + CalcinitSonneveld’s
N155150
P4831
K190132
Ca154210
Mg5124
S8818
Fe2.921
Mn0.970.25
Zn0.390.13
Cu0.0680.023
B0.490.16
Mo0.0970.024
Table 4. Fresh weight (FW, g) of thirteen cultivars of lettuce in phase 1 in which plants were grown under HPS or LED greenhouse supplemental lights with a target DLI of 17 mol·m−2·d−1. Data are means ± standard error (SE) of circa 36 plants from three crop cycles. A t-test was used to compare the FW of HPS versus LED within a cultivar (p-value) and Tukey’s Honestly Significant Difference at α = 0.05 was used to compare cultivars with the HPS or LED treatment.
CultivarHPS FW (g)LED FW (g)p-ValueTukey’s HPSTukey’s LED
Aquino71.2 ± 20.866.3 ± 20.90.677ABCAB
Barlach102.8 ± 20.8103 ± 20.80.990CBCDEFBCDEF
Carmessi57.3 ± 20.864.4 ± 20.80.544AAB
Crunchita133.0 ± 20.8143 ± 20.90.393DEFGFGH
Greenstar189.8 ± 21.0183.8 ± 20.80.619IJKHIJ
Locarno53.4 ± 20.862.7 ± 20.80.430AAB
Lotus166.5 ± 20.8165 ± 20.80.895GHIGHI
Rex111.3 ± 20.8111.1 ± 20.80.981CDEFCDEF
Rocky Row227.7 ± 20.8225.6 ± 20.80.856KJK
Rouxai70.1 ± 20.870.7 ± 20.80.958ABCABC
Seurat94.1 ± 21.090.3 ± 20.80.751ABCDEABCD
Teodore171.1 ± 22.2140.1 ± 21.70.042GHIEFGHI
Xandra93.4 ± 20.886.1 ± 20.80.529ABCDEABC
Table 5. Brix (°) of 13 cultivars of lettuce in phase 1 in which plants were grown under HPS or LED greenhouse supplemental lights with a target daily light integral of 17 mol·m−2·d−1. Data are means ± standard error (SE) of circa 36 plants from three crop cycles. A t-test was used to compare the HPS versus LED within a cultivar (p-value) and Tukey’s Honestly Significant Difference at α = 0.05 was used to compare cultivars with the HPS or LED treatment.
CultivarHPS BrixLED Brixp-ValueTukey’s HPSTukey’s LED
Aquino3.02 ± 0.293.65 ± 0.30.149ABABCDE
Barlach2.74 ± 0.293.17 ± 0.290.310AABC
Carmessi4.25 ± 0.284.85 ± 0.290.146ABCDEDE
Crunchita4.79 ± 0.294.78 ± 0.310.985CDECDE
Greenstar5.16 ± 0.294.62 ± 0.290.202EBCDE
Locarno4.43 ± 0.294.91 ± 0.280.236ABCDEDE
Lotus3.8 ± 0.293.87 ± 0.290.864ABCDEABCDE
Rex3.42 ± 0.293.48 ± 0.290.883ABCDABCDE
Rocky Row4.31 ± 0.294.93 ± 0.290.143ABCDEDE
Rouxai3.44 ± 0.292.88 ± 0.290.187ABCDA
Seurat3.43 ± 0.293.52 ± 0.270.827ABCDABCD
Teodore3.48 ± 0.354.2 ± 0.280.116ABCDEABCDE
Xandra3.48 ± 0.293.95 ± 0.290.257ABCDEABCDE
Table 6. Analysis of Variance table for significant glucose correlation to brix, cultivar, light, brix × light, and cultivar × light. Asterisks indicate p-value significant at 0.001.
NumDFF Valuep Value
Brix132.9266.73 × 10−8***
Cultivar125.9204.24 × 10−8***
Light10.0810.776
Cultivar × Light120.5840.852
Brix × Light10.1490.700
Table 7. Plant height (cm) of 13 cultivars of lettuce in phase 1, in which plants were grown under HPS or LED greenhouse supplemental lights with a target DLI of 17 mol·m−2·d−1. Data are means ± standard error (SE) of circa 36 plants from three crop cycles. A t-test was used to compare HPS versus LED within a cultivar (p-value) and Tukey’s Honestly Significant Difference at α = 0.05 was used to compare cultivars with the HPS or LED treatment.
CultivarHPS Height (cm)LED Height (cm)p-ValueTukey’s HPSTukey’s LED
Aquino11.45 ± 0.7311.18 ± 0.730.793ABA
Barlach14.5 ± 0.7313.68 ± 0.730.432ABCDABC
Carmessi16.73 ± 0.7315.86 ± 0.730.407CDECDE
Crunchita18.8 ± 1.0918.59 ± 0.730.874DEFE
Greenstar25.95 ± 0.7324.18 ± 0.730.089GHIGHI
Locarno13.75 ± 0.7715.23 ± 0.730.167ABCBCDE
Lotus26 ± 0.7322.82 ± 0.730.002GHIFG
Rex13.14 ± 0.7313.09 ± 0.730.965ABCABC
Rocky Row29.32 ± 0.7327.09 ± 0.730.033IHI
Rouxai17.77 ± 0.7317.68 ± 0.730.930DEDE
Seurat14.73 ± 0.7314.68 ± 0.730.965ABCDABCD
Xandra16.14 ± 0.7315.09 ± 0.730.315CDEBCDE
Table 8. Plant shoot diameter of 13 cultivars of lettuce in phase 1, in which plants were grown under HPS or LED greenhouse supplemental lights with a target DLI of 17 mol·m−2·d−1. Data are means ± standard error (SE) of circa 36 plants from three crop cycles. A t-test was used to compare HPS versus LED within a cultivar (p-value) and Tukey’s Honestly Significant Difference at α = 0.05 was used to compare cultivars with the HPS or LED treatment.
CultivarHPS Width (cm)LED Width (cm)p-ValueTukey’s HPSTukey’s LED
Aquino18.64 ± 1.8817.73 ± 1.880.737AA
Barlach23.22 ± 1.8821.98 ± 1.880.645ABCDABC
Carmessi24.99 ± 1.8823.65 ± 1.880.621ABCDABCD
Crunchita29.4 ± 2.7126.06 ± 1.880.321ABCDABCD
Greenstar31.67 ± 1.8831.66 ± 1.880.998BCDBCD
Locarno19.46 ± 1.9220.85 ± 1.880.611AAB
Lotus28.01 ± 1.8827.98 ± 1.880.992ABCDABCD
Rex21.37 ± 1.8820.34 ± 1.880.703ABCA
Rocky Row32.27 ± 1.8834.12 ± 1.880.494CDD
Rouxai24.64 ± 1.8820.56 ± 1.880.138ABCDA
Seurat20.45 ± 1.8820.52 ± 1.880.980AA
Xandra27.66 ± 1.8824.53 ± 1.880.252ABCDABCD
Table 9. Electrical use and biomass efficacy of lettuce in phase 1 in which plants were grown under HPS or LED greenhouse supplemental lights with a target DLI of 17 mol·m−2·d−1. Total kilowatt hours (kWh) used and total edible biomass produced in grams (g) were used to calculate biomass efficacy (g/kWh), a measure of edible mass produced per unit energy consumed.
Cycle 1Cycle 2Cycle 3
HPSLEDHPSLEDHPSLED
Watts per Array240094824009482400948
Total kWh Used16185861119369754301
Average Daily kWh47173712239
g Edible Mass Produced12,41210,88815,47515,67819,39419,922
g Edible Mass/kWh7.6718.5713.8342.4225.766.04
Table 10. Fresh weight of the six lettuce cultivars in phase 2 under HPS versus LED greenhouse supplemental lights. Data are means ± standard error (SE) of circa 72 plants from three crop cycles. A t-test was used to compare the FW of HPS versus LED within a cultivar (p-value). Tukey’s HSD was omitted as all cultivars and treatments fell within the same group.
CultivarHPS FW (g)LED FW (g)p-Value
Crunchita109.1 ± 14.7101.1 ± 14.70.397
Greenstar115.1 ± 14.7108.9 ± 14.70.902
Locarno152.3 ± 14.7103.0 ± 16.60.699
Rex151.4 ± 14.7101.1 ± 16.50.272
Rouxai59.2 ± 14.773.7 ± 15.10.875
Xandra62.0 ± 14.768.5 ± 15.10.542
Table 11. Height of the six lettuce cultivars in phase 2 under HPS versus LED greenhouse supplemental lights. Data are means ± standard error (SE) of circa 72 plants from three crop cycles. A t-test was used to compare the FW of HPS versus LED within a cultivar (p-value) and Tukey’s Honestly Significant Difference at α = 0.05 was used to compare cultivars with the HPS or LED treatment.
CultivarHPS Height (cm)LED Height (cm)p-ValueTukey’s HPSTukey’s LED
Crunchita18.59 ± 0.422.36 ± 0.410.567AA
Greenstar13.66 ± 0.411.79 ± 0.660.010BA
Locarno18.25 ± 0.414.8 ± 0.410.366AA
Rex13.45 ± 0.4117.08 ± 0.480.726AA
Rouxai24.19 ± 0.4114.25 ± 0.410.882AA
Xandra11.93 ± 0.6615.65 ± 0.480.047BA
Table 12. Diameter of the six lettuce cultivars in phase 2 under HPS versus LED greenhouse supplemental lights. Data are means ± standard error (SE) of circa 72 plants from three crop cycles. A t-test was used to compare the FW of HPS versus LED within a cultivar (p-value) and Tukey’s Honestly Significant Difference at α = 0.05 was used to compare cultivars with the HPS or LED treatment.
CultivarHPS Width (cm)LED Width (cm)p-ValueTukey’s HPSTukey’s LED
Crunchita24.91 ± 0.423.71 ± 0.40.035BA
Greenstar28.09 ± 0.4126.24 ± 0.40.001BA
Locarno17.9 ± 0.416.69 ± 0.410.037BA
Rex19.21 ± 0.418.46 ± 0.40.192AA
Rouxai22.33 ± 0.6921.4 ± 0.690.342AA
Xandra22.81 ± 0.4921.04 ± 0.490.011BA

