Article

Deficit Irrigation and Arbuscular Mycorrhiza as a Water-Saving Strategy for Eggplant Production

1
Plant Nutrition Department, National Research Centre, Giza 12622, Egypt
2
Vegetable Research Department, National Research Centre, Giza 12622, Egypt
3
Institute of Plant Sciences and Resource Conservation, Division of Horticultural Sciences, University of Bonn, 53111 Bonn, Germany
*
Author to whom correspondence should be addressed.
Submission received: 15 July 2020 / Revised: 5 August 2020 / Accepted: 6 August 2020 / Published: 11 August 2020
(This article belongs to the Special Issue Soil, Water and Nitrates Management in Horticultural Production)

Abstract

:
Crop production in arid regions requires continuous irrigation to fulfill water demand throughout the growing season. Agronomic measures, such as roots-soil microorganisms, including arbuscular mycorrhizal (AM) fungi, have emerged in recent years to overcome soil constraints and improve water use efficiency (WUE). Eggplant plants were exposed to varying water stress under inoculated (AM+) and non-inoculated (AM−) to evaluate yield performance along with plant physiological status. Plants grown under full irrigation resulted in the highest fruit yield, and there were significant reductions in total yield and yield components when applying less water. The decline in fruit yield was due to the reduction in the number of fruits rather than the weight of the fruit per plant. AM+ plants showed more favorable growth conditions, which translated into better crop yield, total dry biomass, and number of fruits under all irrigation treatments. The fruit yield did not differ between full irrigation and 80% evapotranspiration (ET) restoration with AM+, but a 20% reduction in irrigation water was achieved. Water use efficiency (WUE) was negatively affected by deficit irrigation, particularly at 40% ET, when the water deficit severely depressed fruit yield. Yield response factor (Ky) showed a lower tolerance with a value higher than 1, with a persistent drop in WUE suggesting a lower tolerance to water deficits. The (Ky) factor was relatively lower with AM+ than with AM− for the total fruit yield and dry biomass (Kss), indicating that AM may enhance the drought tolerance of the crop. Plants with AM+ had a higher uptake of N and P in shoots and fruits, higher stomatal conductance (gs), and higher photosynthetic rates (Pn), regardless of drought severity. Soil with AM+ had higher extractable N, P, and organic carbon (OC), indicating an improvement of the fertility status in coping with a limited water supply.

1. Introduction

The search for additional water resources and improving the effective use of available water is an imperative strategy to overcome rising energy costs and water shortages in many parts of the world. This approach is challenging, especially in arid and semi-arid regions, which highlights an urgent solution for innovative irrigation strategies and optimized irrigation water management. Food production in the future needs efforts to understand the mechanisms of plant adaptation and tolerance of abiotic stress like water shortage, as these events are expected to intensify in the coming years [1]. Plants cope with drought stress by drought avoidance or drought tolerance, which include osmotic adjustment, the regulation of stomatal conductance and photosynthesis, and the regulation of water uptake and flow in their tissues [2]. Water-saving irrigation strategies, such as deficit irrigation (DI), may allow the optimization of water productivity, stabilizing the yield and improving the quality [3]. However, water productivity can be improved by developing DI strategies based on scientific principles while attempting to produce near-maximum yields even with a lesser water volume than that required to produce maximum productivity [4].
Strategies to sustain vegetative development and ecological succession against drought stress can be enhanced by associations between roots and soil microorganisms [5,6], water management [7,8], and arbuscular mycorrhizal (AM) fungi [9,10]. This association may include a suite of interrelated plant processes, primarily alleviating drought stress via direct water uptake and transport through fungal hyphae to the host plants [11] and enhanced nutrient uptake [10,12]. AM fungi can also change root hydraulic properties [13] that increase water supply to shoots and increase net photosynthetic rates under water stress conditions [14,15]. AM plants often have higher stomatal conductance at lower soil moisture [16] and sometimes regulate stomatal closure [17] in ways that may optimize the response to soil moisture content.
Crop production right now depends mainly on providing essential plant nutrients in the form of mineral fertilizers, which become significant components of modern agriculture. Research priorities for agricultural science are currently based on developing alternative methods of sustaining plant nutrition with lower inputs of mineral fertilizers [18]. One such possibility is to replace mineral fertilizers by organic inputs and to supplement plants with specific root-associated microbes. AM can be integrated into sustainable soil management, reducing environmental problems by decreasing the use of chemical fertilizers [19,20]. Since P diffusion is severely limited in dry soil [21], AM contributions to plant P may be especially acute under drought [22] or non-drought conditions [23,24]. Enhanced P nutrition by AM fungi during times of water deficit has been proposed as an essential factor for upgrading host plant drought tolerance [25,26]. These beneficial functions may have great importance relative to climate change [27,28], particularly with water in areas of agricultural expansion, especially in arid and semi-arid regions.
Eggplant is an economically important vegetable crop, with 51.288 million tons produced worldwide. Egyptian production ranks third place worldwide, with 1.194 metric tons from 0.485 million ha, and produces 2.3% of the world production [29]. Irrigation water availability has been identified as one of the major limiting factors of eggplant productivity, especially during the hot and dry summer periods in arid regions. Eggplant is relatively susceptible to drought stress, as especially in the reproductive phase [30], the susceptible period to water stress is extended, and a water shortage negatively and markedly affects all yield components. Lovelli et al. [31] demonstrated that eggplant sensitivity to water stress was expressed in high marketable yield decrements and a drop in water productivity.
The objective of this study was to examine the interaction of varying water stress levels and arbuscular mycorrhizal fungus on vegetative growth, reproductive behavior, fruit yield, water status, nutrient uptake, and soil fertility of field-grown eggplant in an arid region. The main scientific hypothesis of this study was that the inclusion of AM fungi in the soil/plant system would increase crop yield under deficit irrigation, and thus result in higher water use efficiency.

2. Materials and Methods

2.1. Location and Growth Conditions

Field experiments were conducted at the Main Research Station, National Research Center located in Nubaria province west of the Nile Delta of Egypt during the summer growing season (March-June) of 2017 and 2018 using a drip irrigation system. The site is situated in an arid climate at an altitude of 24 m above mean sea level and is intersected by 30°30 N latitude and 30°20 E longitude. The area has hot and dry summer months with little or no rain during the entire year. The mean monthly evapotranspiration (ET) ranged from 3.7 to 6.7 mm in the respective cropping seasons. The climatic parameters were taken from the Nubaria meteorological station according to the official data from the Egyptian Ministry of Agriculture. The detailed climatic parameters recorded in 2017 and 2018 from March to June during the growing season are summarized in Table 1.
The soil of the experimental site is sandy in texture (Entisol-Typic Torripsamments), composed of 86.5% sand, 9.2% silt, and 4.3% clay, with an alkaline pH of 8.2, electrical conductivity of 0.85 dS/m, 1.5% CaCO3, and 0.42% organic matter in the upper 0–20 cm soil layer. The available N, P, and K were 12, 3, and 38 mg kg−1 soil, respectively, before the initiation of the experiment. The average soil water content at field capacity from the surface soil layer down to a depth of 80 cm at 20-cm intervals was 9.8%, and the permanent wilting point for the corresponding depths was 4.6%.

2.2. Experimental Design and Treatments

The experiment was conducted in a factorial randomized block design and included four irrigation treatments (100%, 80%, 60%, and 40% of crop ET, or ET1.0, ET0.8, ET0.6, and ET0.4) as the main factor and two arbuscular mycorrhizal treatments defined as (AM–) and (AM+) as the sub-main factor with three replications in 3.0 m wide × 10.0 m long plots of each treatment. Transplants of eggplant hybrid ‘Black Moon’ were grown from sterilized seeds in the nursery greenhouse for eight weeks. Vermiculite-based mycorrhizal inoculum carrying arbuscular mycorrhizal fungus (Glomus intraradices) was applied in an eggplant nursery at a rate of 100 g m−2 just before sowing seeds. The inoculum was supplied by the Microbiology Lab of the Soil, Water and Environment Research Institute, Agriculture Research Center, Egypt. The AM was originally cultured in roots of maize, which carried the propagules (spores, infected roots, soil) for three months before the beginning of the experiment. Non-mycorrhizal plant nurseries were maintained separately. Eggplant roots were tested for mycorrhizal colonization at the end of the last four weeks after inoculation (28 days after sowing). After the establishment of the symbiosis, all plants were transferred to the main field and transplanted at a spacing of 40 cm between plants and 100 cm between rows (25,000 plants per hectare) in early March 2017 and 2018. The plants were arranged in north-south-oriented soil beds, which had previously received 20 t ha−1 of organic manure for all treatments. Before cultivation of eggplants, drip tubing (twin-wall GR, 15 mm inner diameter, 40 cm dripper spacing delivering 2.5 L h−1 at an operating pressure 100 kPa) were placed on the soil surface beside each plant row at the center of the soil beds. All treatments received the same amount of nitrogen 300 kg ha−1 (as ammonium nitrate), phosphorus at 120 kg ha−1 (as phosphoric acid), and potassium at 250 kg ha−1 (as potassium sulphate) for the season. The total amount of NPK at variable levels was injected directly into the mainline of the drip system in a water-soluble form using a venturi-tube injector. Nitrogen and potassium fertilizers were applied at 6-day intervals in 15 equal doses of N starting two weeks after planting and stopped 30 days before the end of the cropping period while P was injected weekly, from the first week after planting until the last week of April.

2.3. Estimation of Crop Water Requirement

Reference evapotranspiration (ET0) was calculated daily using Penman–Monteith’s semi-empirical formula [32]. The actual evapotranspiration was estimated by multiplying reference evapotranspiration with crop coefficient (Kc) values (ETc = ET0 × Kc) for different months based on crop growth stages. Eggplant is about a 130-day-duration crop, which may be divided into four stages, (initial, 30 days; developmental, 40 days; middle, 40 days; and fruit maturity, 20 days.
The crop coefficient during the crop season was 0.45, 0.75, 1.15, and 0.80 at the initial, developmental, middle, and fruit maturity stages, respectively [32]. The total actual volumes of irrigation water applied at full irrigation during the entire season were 480 mm and 494 for 2017 and 2018, respectively. During the initial stage of growth, plants were irrigated daily to encourage establishment, but after that irrigation frequency was every two days. The irrigation treatments started at 14 days after transplanting (DAT) and ended at 120 DAT, respectively (15 days before the last harvest).
Seasonal values of the yield response factor (Ky) were calculated for each experimental year as follows:
1 ( Ya Ym ) = K y   ( 1 ETa ETm ) ,
where Ym (kg ha−1) and Ya (kg ha−1) are the maximum (that obtained from the fully irrigated treatment) and actual yield, respectively. ETm (mm ha−1) and ETa (mm ha−1) are the maximum (that obtained from the fully irrigated treatment) and actual ET, respectively, and Ky is the yield response factor, defined as the decrease in yield per unit decrease in ET [33]. According to the Ky calculation, Kss was calculated by Equation (1) replacing Ym with the maximum total dry biomass (SSm) and Ya with the actual total dry biomass (SSa) as follows:
1 ( SSa SSm ) = K s s   ( 1 ETa ETm ) ,
where Kss indicates the biomass response factor, which is the correlation between the relative total dry biomass loss and relative ET reduction.

2.4. Physiological Measurements and Sampling

Monitoring of the diurnal change of stomatal conductance (gs) and photosynthetic rate (Pn) were measured on the youngest fully-expanded leaves from the top of the canopy in each replicate with a portable photosynthesis system (ADC Bio-Scientific, UK). Measurements were taken on the central section of the youngest fully expanded leaf between 12:00 and 14:00 h (when the temperature reached the maximum at midday) about 4 h before the end of the irrigation cycle at the flowering stage on two plants per replicate.

2.5. Measurements of Crop Parameters

The fruits were harvested five times when they had attained full size depending on the end of the physiological maturity stage. Total fruit yield was recorded during the harvest on at least 25 plants in a row in each treatment in all the replications and data were presented as tons per hectare. Fruit parameters, such as the weight of fresh fruits, the number of fruits, and the average weight of the fruit per plant, were estimated until the final harvest in each picking period. Total dry biomass was evaluated by harvesting three representative plants per replicate of each treatment at the final harvest and shoot, and fruit tissues were weighed in the field (fresh weight), and then subsamples were dried at 70 °C to a constant mass in a forced-air oven for subsequent nutrient analysis. Water use efficiency (WUE) was calculated from the total fruit yield (kg ha−1) divided by the seasonal crop water applied for each irrigation treatment during the growing season and expressed as kg ha−1 mm−1. Seasonal N and P uptake were derived from the whole plant sample data (see below), and the amount of uptake was calculated as the product of crop dry weight and the N concentrations in the plant tissues. Postharvest fertilizer recovery was calculated using the following equation:
F   recovery = ( Ft F 0 F ) × 100 ,
where Ft equals the total nutrient uptake (shoots + fruits) under treatment, F0 equals the total nutrient uptake of the unfertilized treatment, and F equals the total amount of nutrient applied during the whole season. The average crop N and P uptake from the unfertilized field plots (F0) were 14 and 4 kg N and P ha−1, respectively, for the whole growing season.

2.6. Plant and Soil Analysis

Total N and P contents of the shoot and fruit tissues were determined for each year at the Analytical Research Lab (National Research Center, Cairo, Egypt) using standard methods of analysis. Tissue samples were ground to pass through a 0.5-mm screen and stored for dry weight analysis, with a thoroughly mixed 5-g portion of each sample stored. Tissue material was digested using H2SO4 in the presence of H2O2 and analyzed for total Kjeldahl N [34] and P by colorimetric ascorbic acid methodology [35]. In both years, soil samples were taken to determine the initial (0–40 cm) and the residual amount of ammonium (NH4–N) and nitrate (NO−3-N) at five soil core samples (10 cm apart) per plot, directly under drip lines. Ammonia and nitrate contents in each soil sample were extracted with 2M KCl, according to Jones and Case [34]. Microbial biomass carbon and 0.5 M K2SO4 extractable organic carbon (OC) were measured at all but the harvest sampling dates in surface soil (0–20 cm) by chloroform fumigation extraction followed by UV persulphate oxidation [36].

2.7. Statistical Analysis

Analysis of variance (ANOVA) was performed using the CoStat program (Version 6.311, CoHort, USA, 1998-2005) on the data of all yield and yield components, WUE, N and P uptake, and residual soil fertility measured in the experiments. Comparison of treatment means was carried out using the least significant difference (LSD) at P < 0.05. Linear regression analyses were made with Excel and Sigma Plot 9.0 (Systat Software, Inc., Point Richmond, CA, USA).

3. Results

3.1. Crop Biomass

Total fruit yield and total dry biomass for each irrigation treatment were similar in the two experimental years. Seasonal irrigation volume in the full irrigation treatment (ET1.0) resulted in the maximum fruit yield and all yield traits under both AM treatments (Table 2). The reduction in irrigation water by 20% (ET0.8) reduced the fruit yield by 22.9% and 21.5 % in 2017 and 2018 while the reduction by 40% (ET0.6) and 60% (ET0.4) reduced fruit yield by 44.1% and 71.0% and by 43.7% and 70.1% in both years, respectively, compared to the full irrigation treatment. Plants grown under mild water stress (ET0.8) in AM+ had a fruit yield similar to plants receiving full irrigation in AM−, but a provision of 20% (ET0.8) water saving was achieved during the entire season. AM+ plants averaged 27.8% and 27.5% higher fruit yield across irrigation treatments than AM− plants in both years, respectively.
Moreover, the effect of AM fungi was more pronounced in the severe drought treatment than at full irrigation (yield was 29.3% and 30.5% higher in AM+ than AM- at ET0.4 compared to 26.9% and 27.1% at ET1.0 during the two seasons, respectively). Total dry biomass was proportional to total fruit yield production (R2 = 0.99; P = 0.05), demonstrating that the crop regulates its fruit biomass relative to the total cumulative biomass. The total dry biomass showed more evident differences between full irrigation and water deficits at ET0.6 (28.8%) and ET0.4 (54.1%) compared to the ET0.8 (14.2%) treatment. AM+ plants averaged 28.0% and 27.8% higher dry biomass across irrigation treatments than with AM− in both years, respectively.
The number of fruits per plant decreased with a decrease in the amount of water applied under both AM treatments, and the trend was similar to the fruit yield. The fruit weight was more resistant to a water deficit than the fruit number per plant, as the decrease in fruit yield in the water deficit treatments was mainly due to the decrease in the fruit number. The correlation analysis between the fruit yield and fruit number showed a very strong correlation (R2 = 0.987; P = 0.05), which indicates that the increase in fruit yield was attributed mainly to the increase in fruit number (Figure 1a). On the other hand, the correlation analysis between the fruit yield and average fruit weight was weak (R2 = 0.236; P = 0.05), indicating that fruit weight was not the main reason behind yield reduction (Figure 1b). The relationship between fruit weight and the number of fruits per plant were not related (R2 = 0.165; P = 0.05), where the decrease in the weight of fruits did not affect the number of fruits per plant. The number of fruits increased with AM+ under all water deficit treatments, and the trend was similar to the yield trend. The average fruit weight was not significantly affected by a water deficit up to ET0.8 in the first season while it was only significant at ET1.0 in the second season. Inoculation with AM did not show a significant effect on fruit weight under any deficit irrigation treatment. The interaction between irrigation and AM treatments for total yield and yield traits was significant, indicating a combined action between both treatments, although this effect was not always significant.

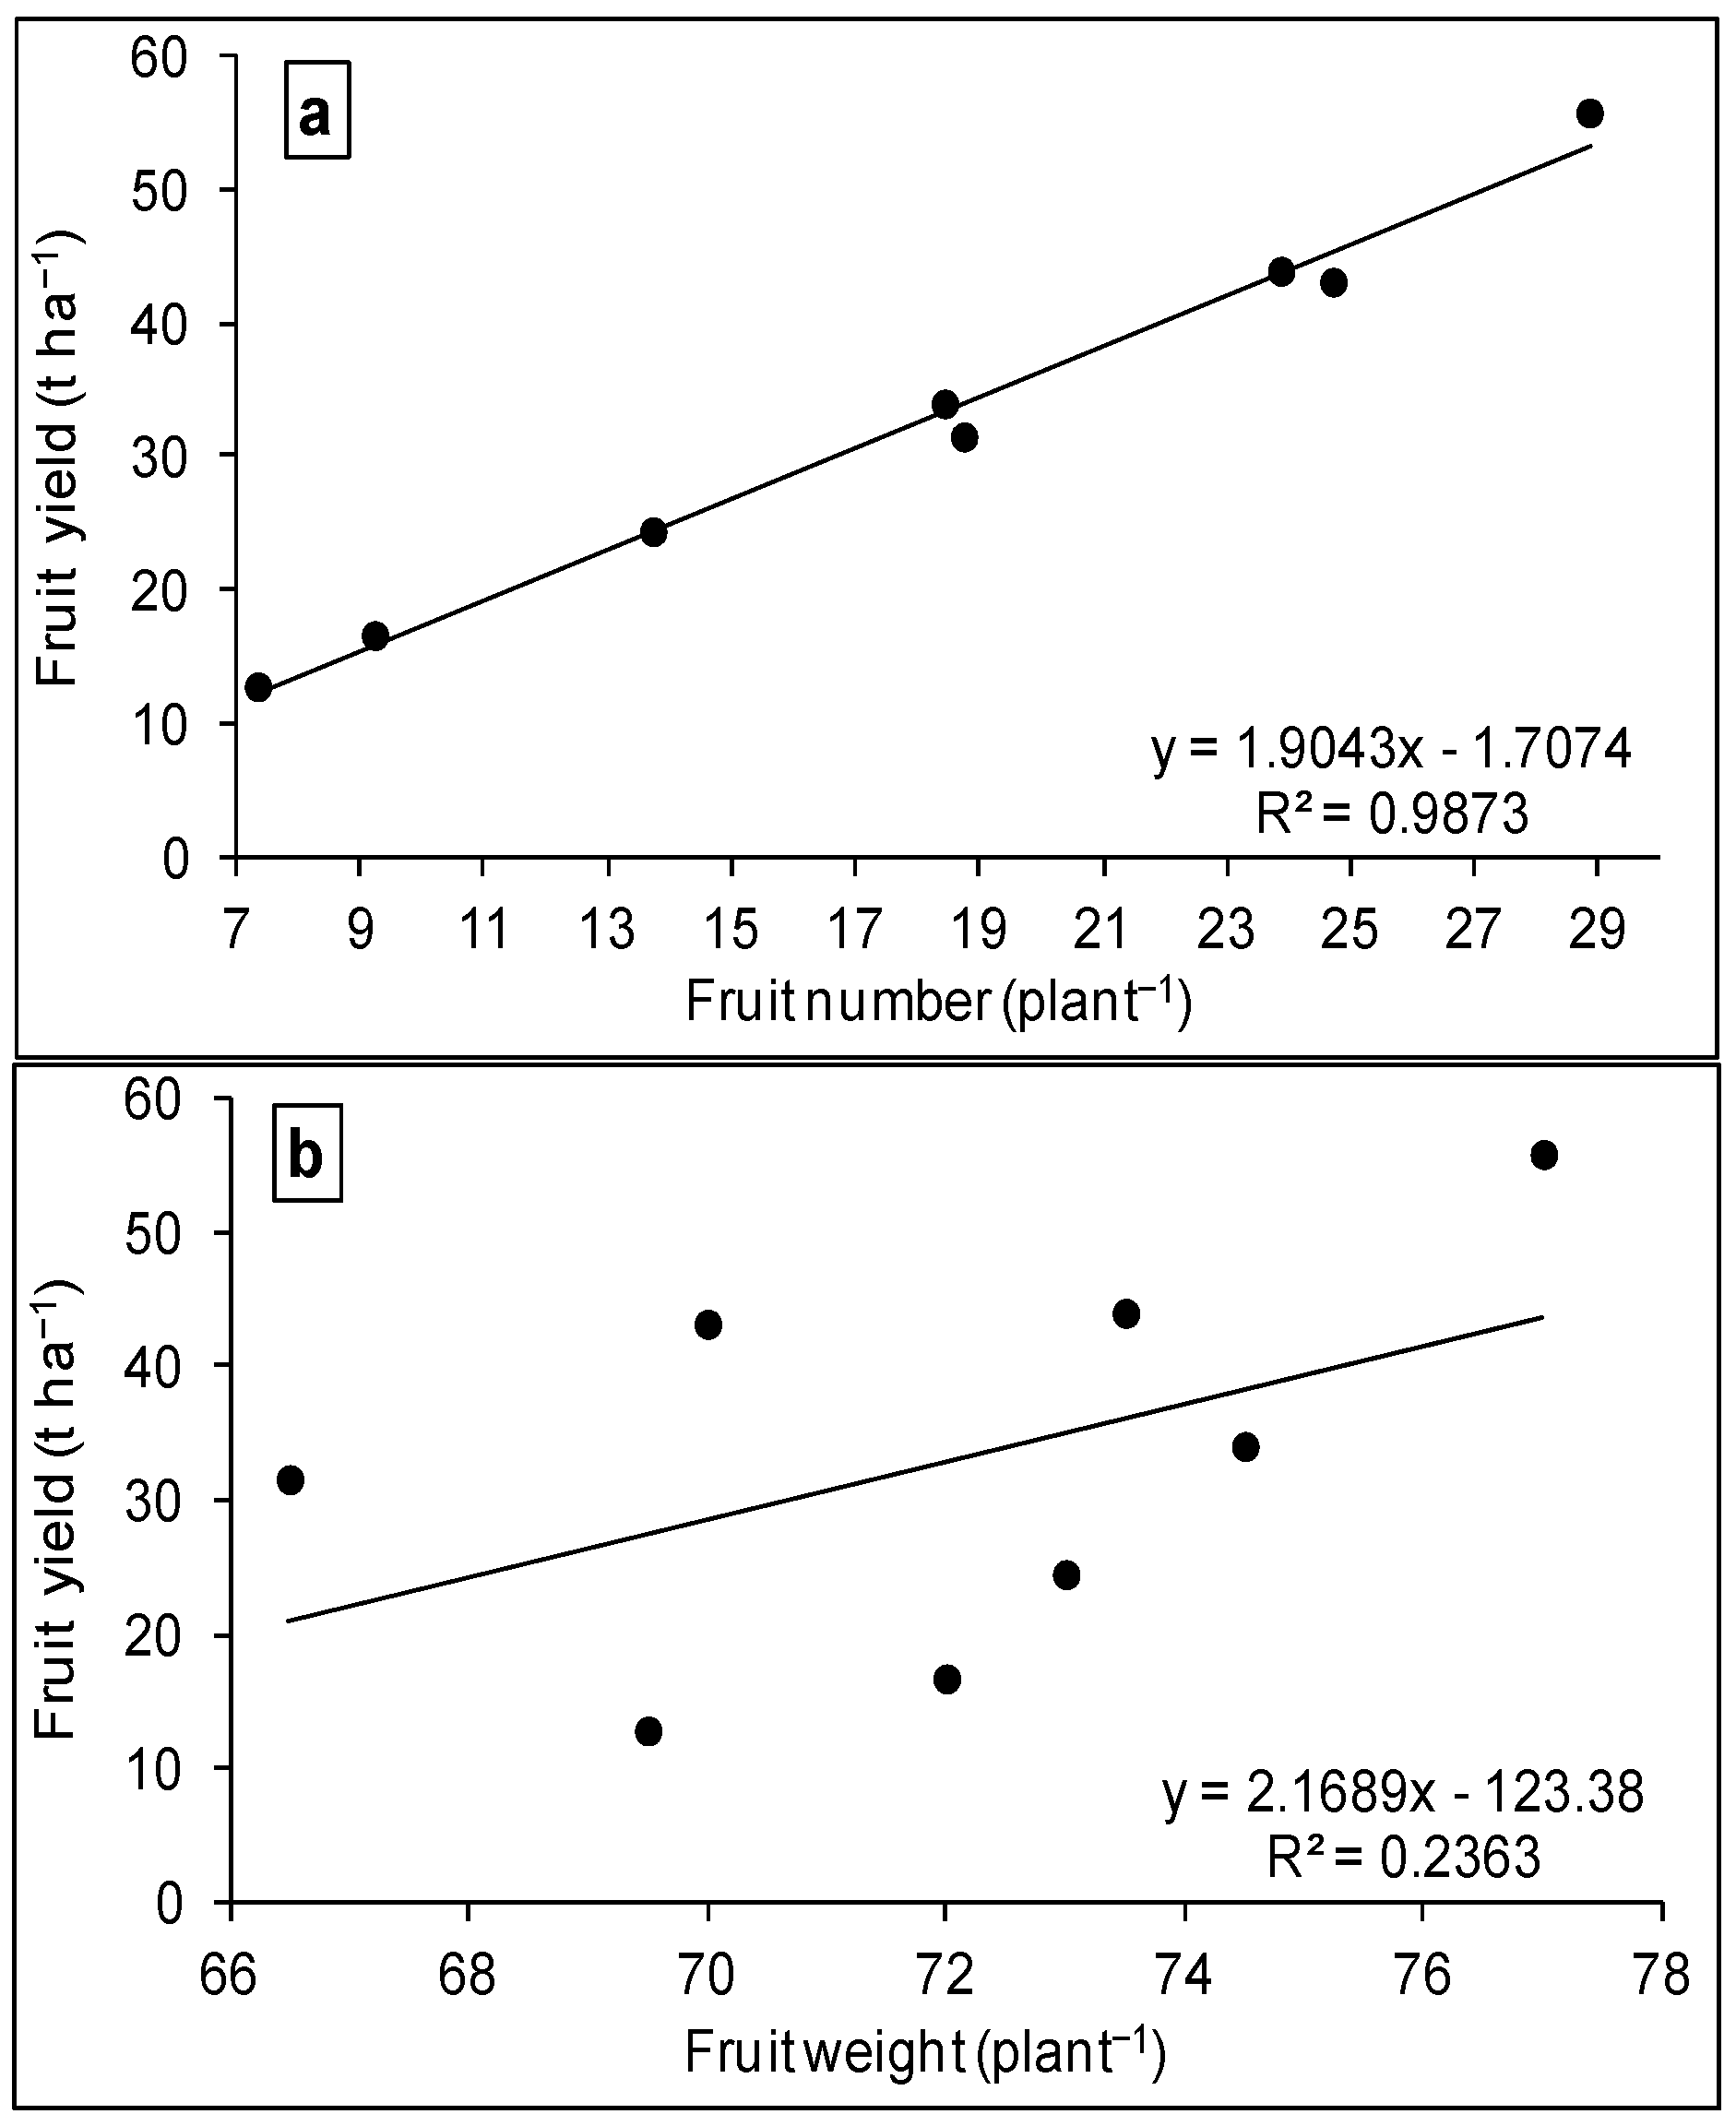
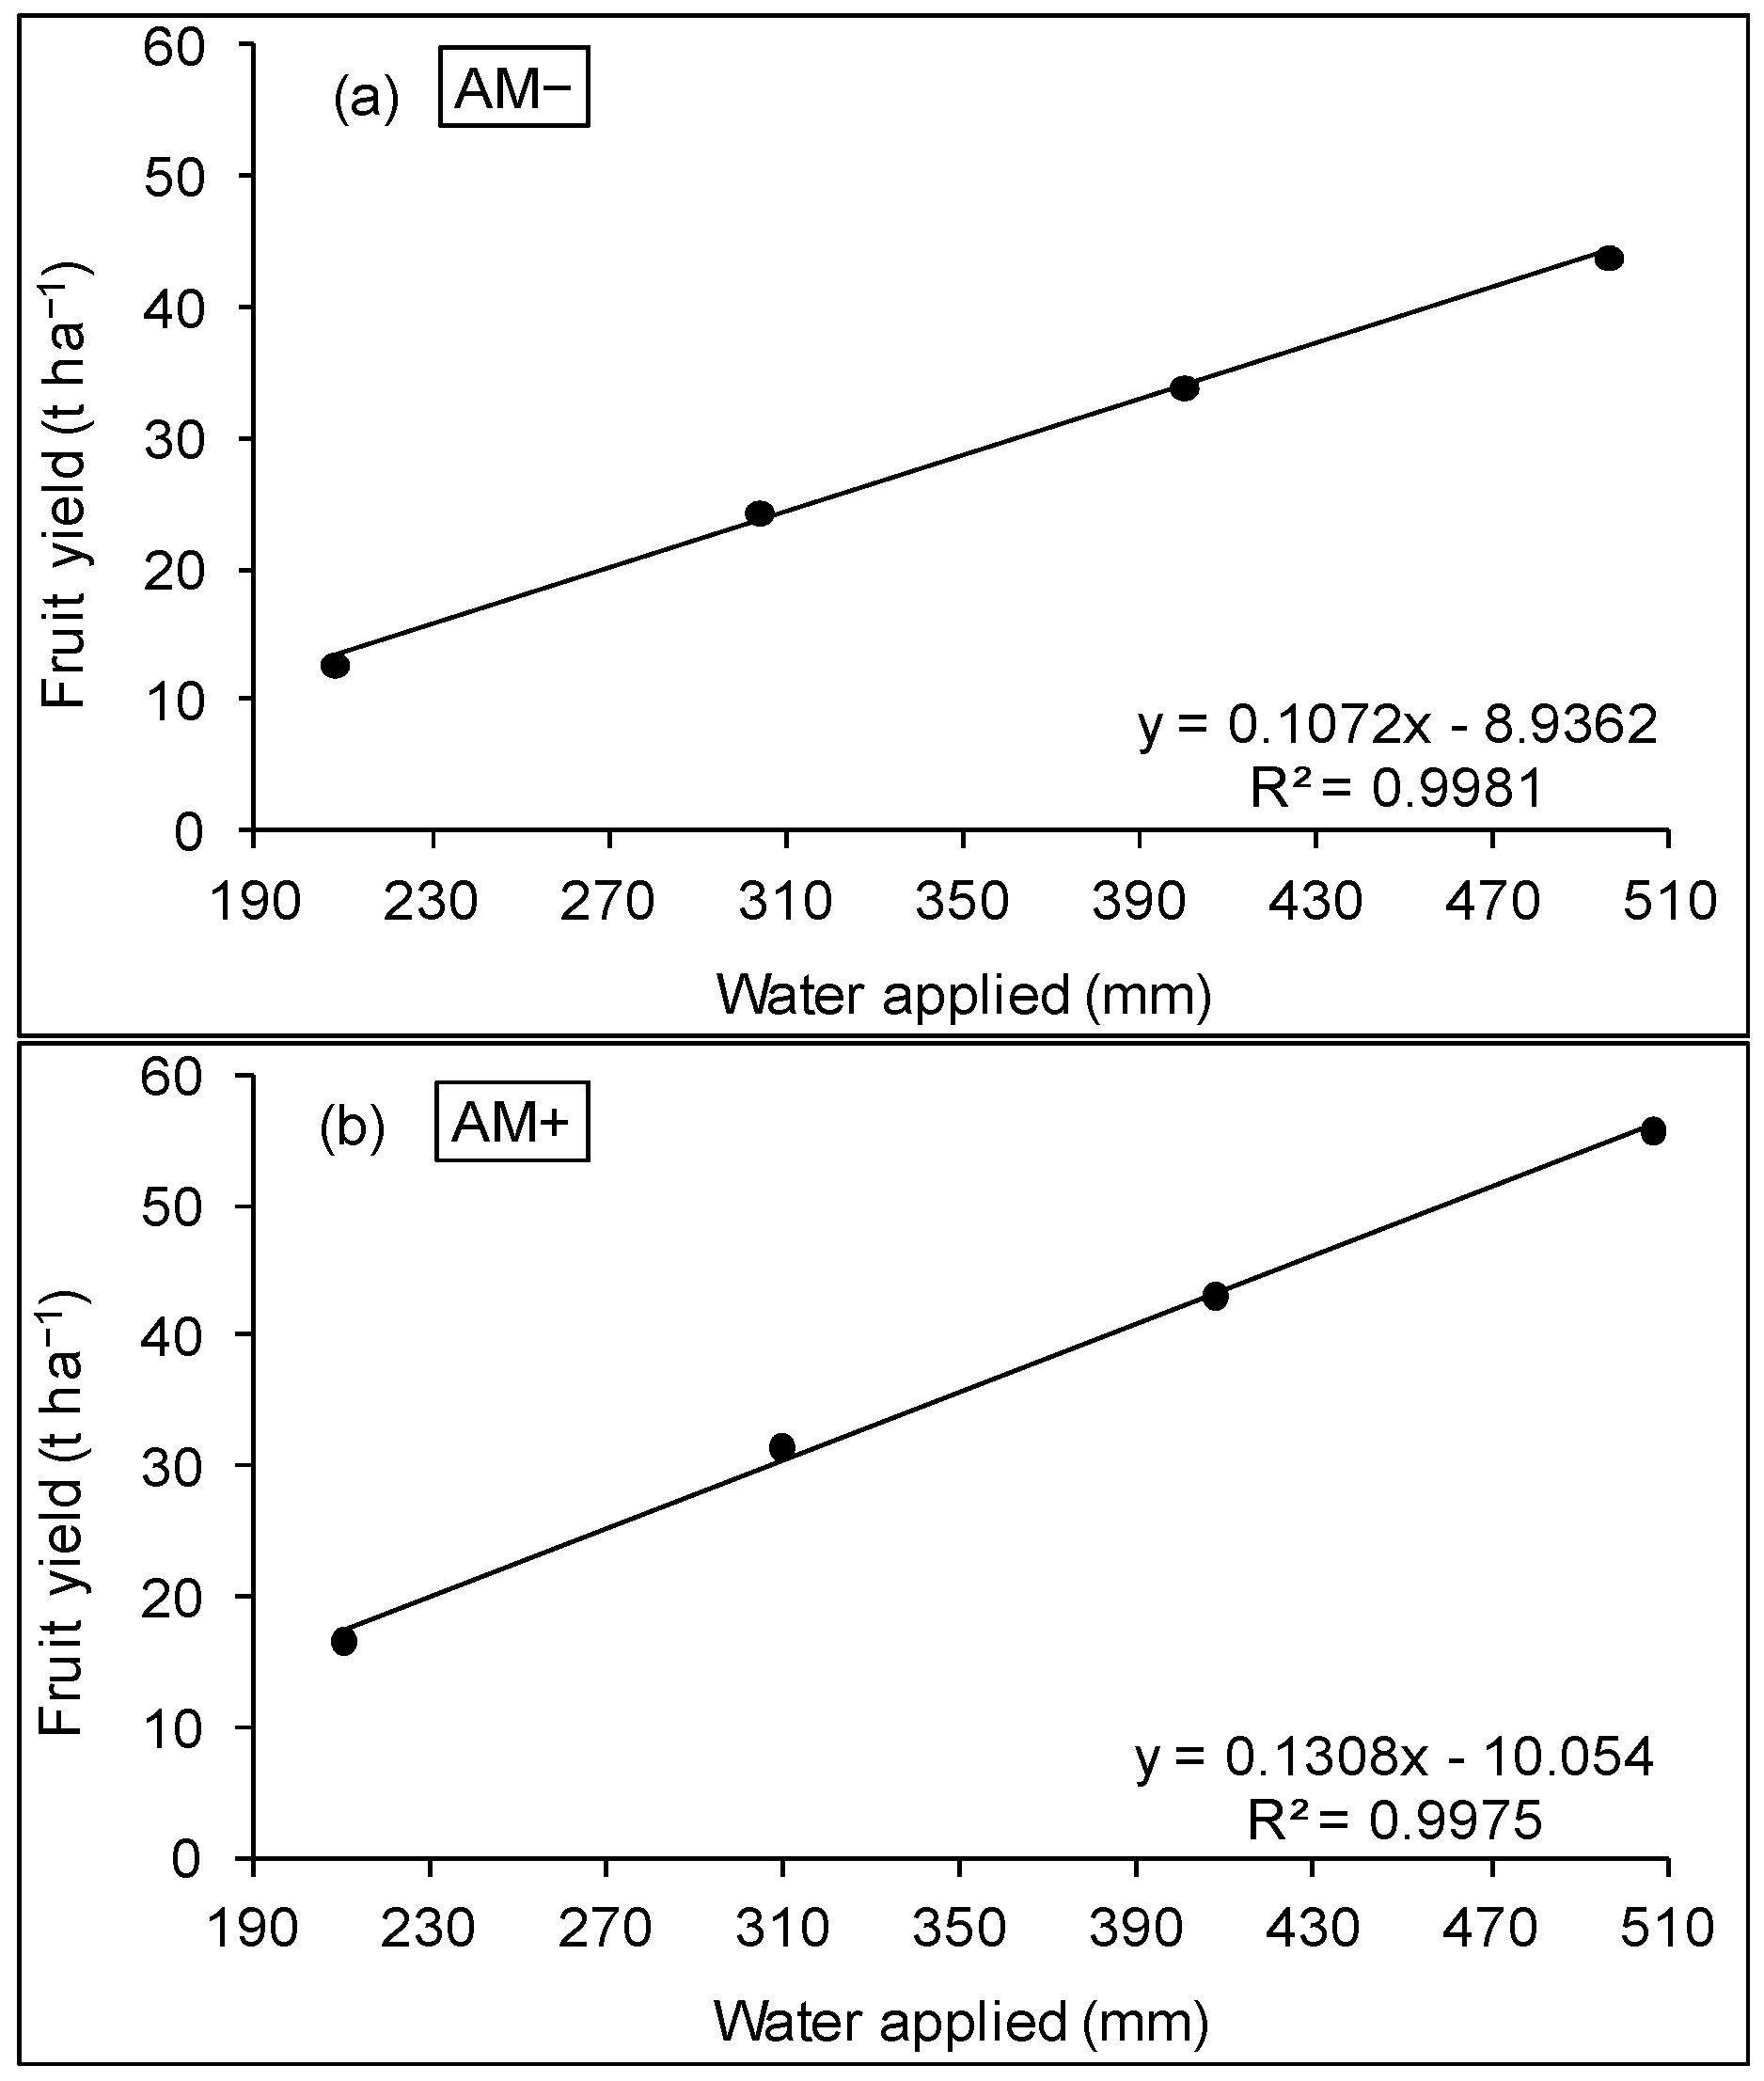
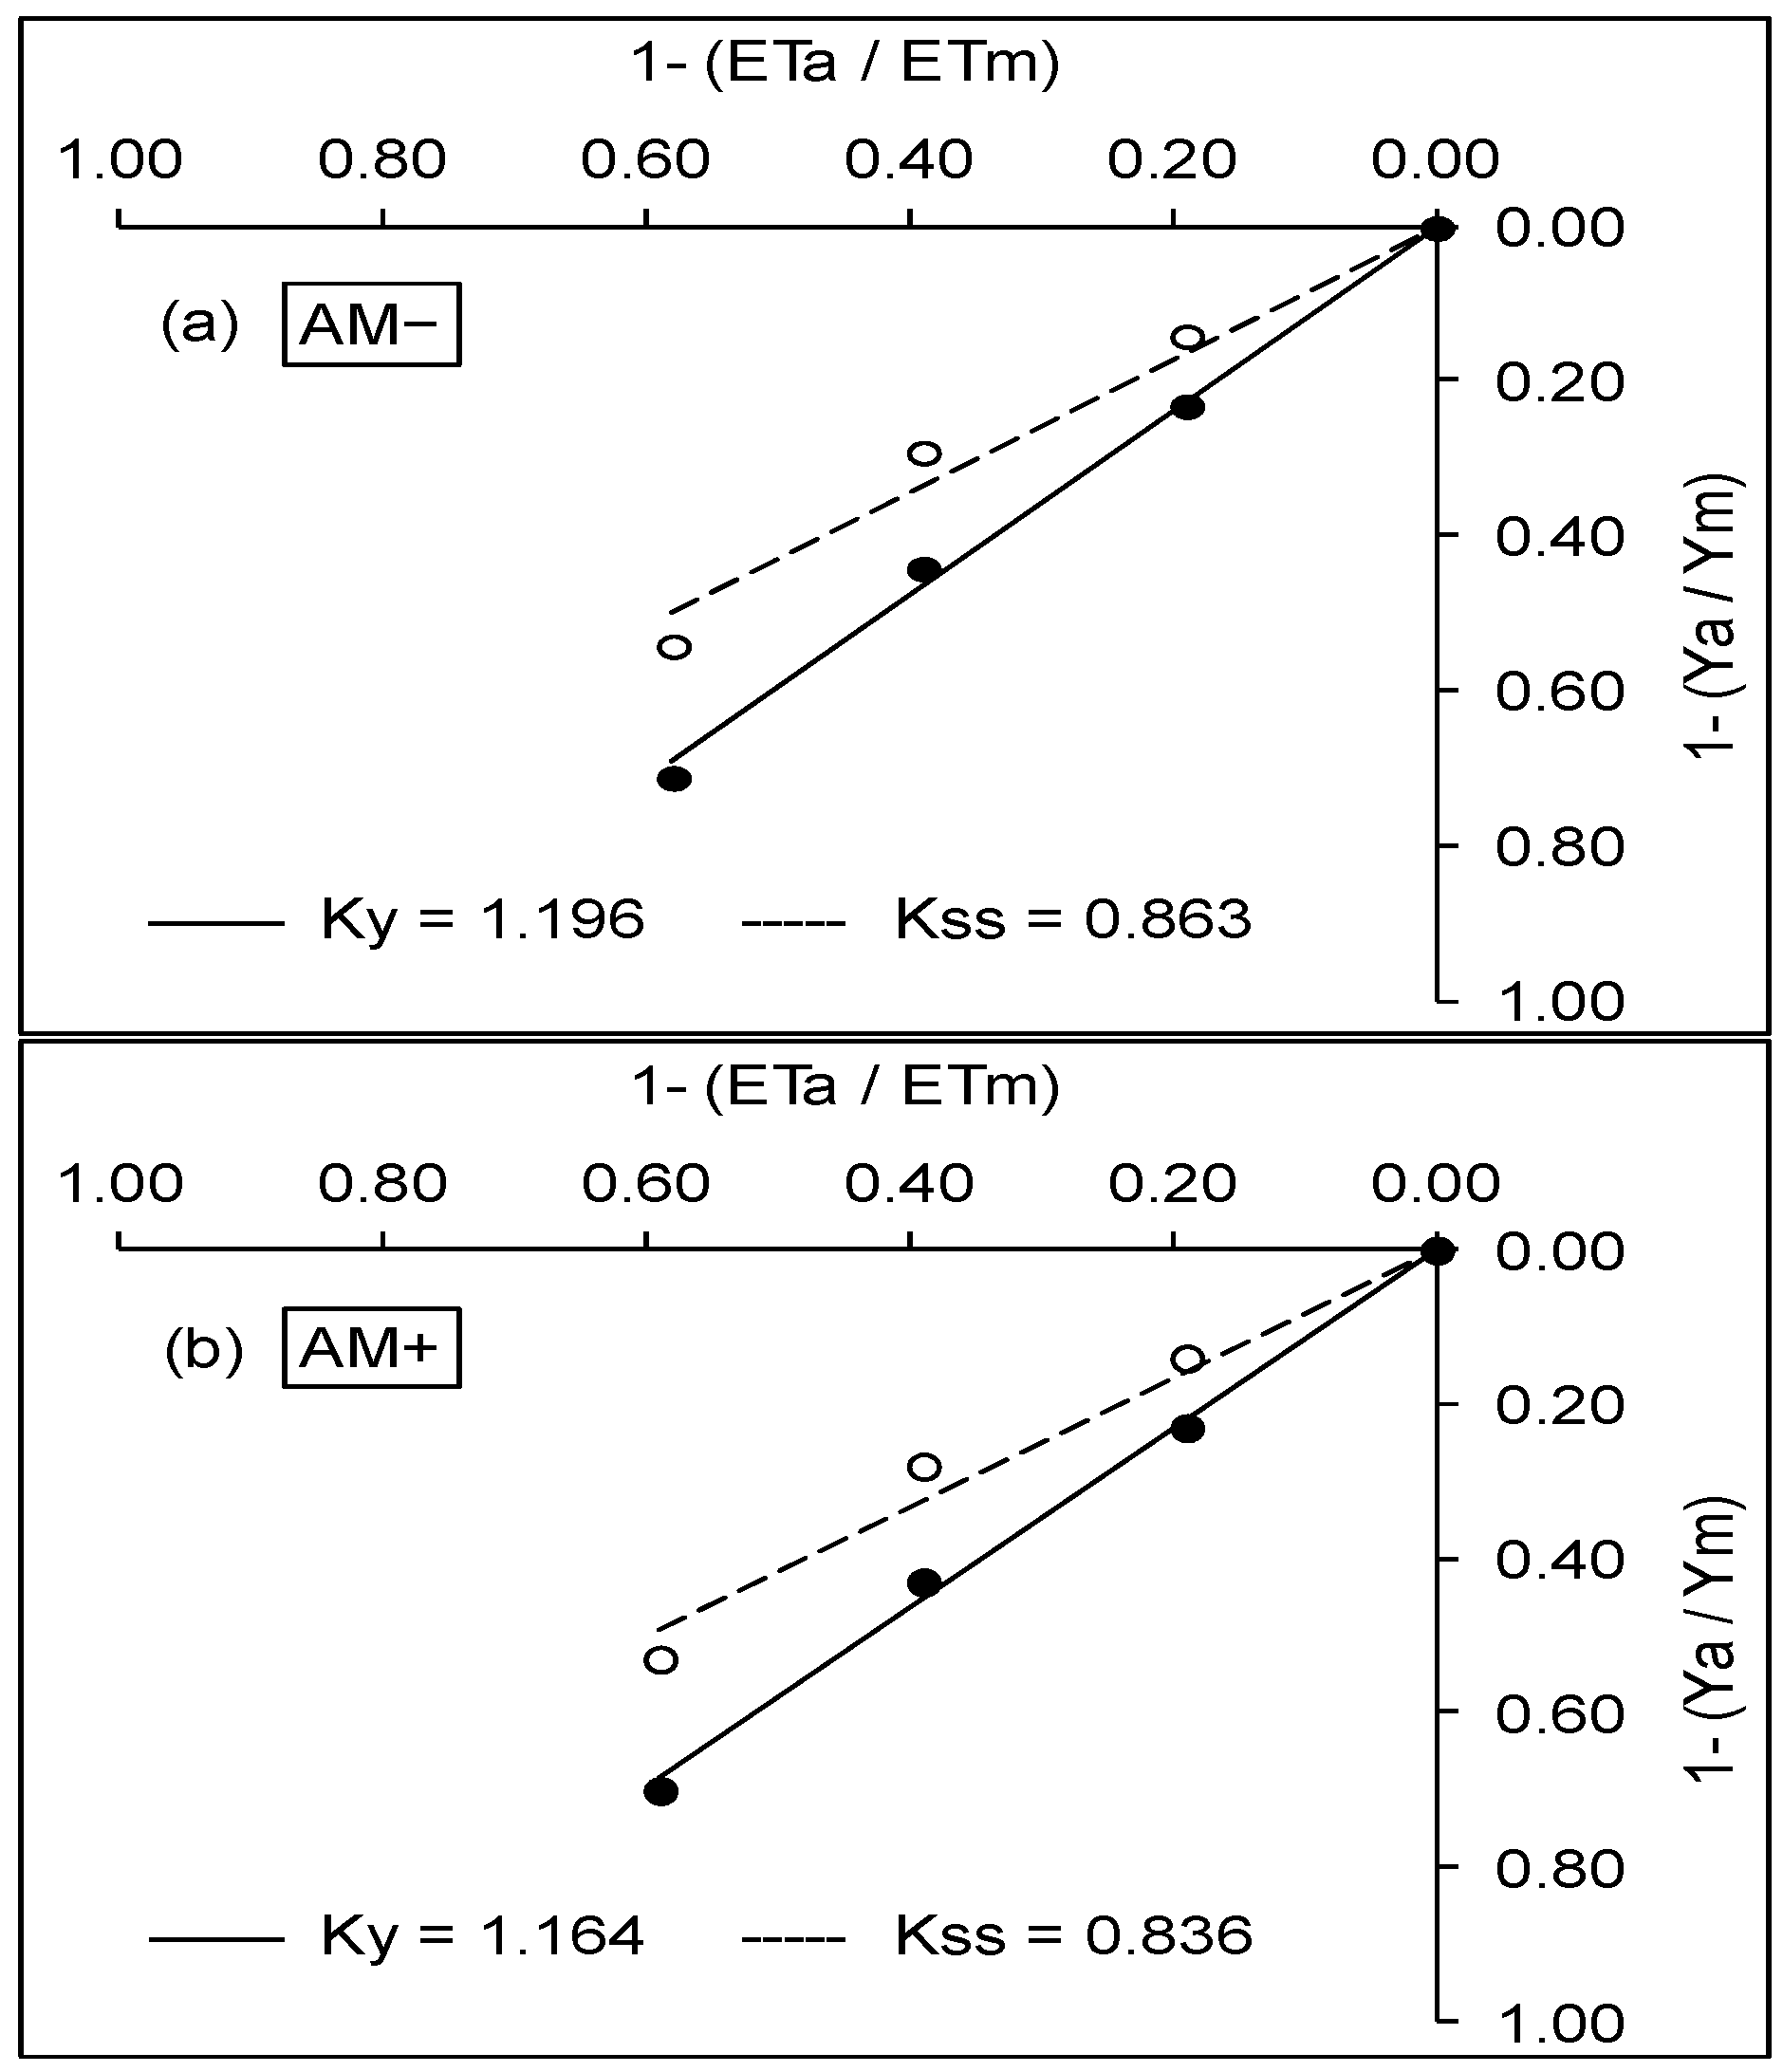
3.2. WUE and Production Function

The WUE was highest under full irrigation with a decreasing trend by deficit irrigation treatments (Table 3). However, the variation between WUE at the different irrigation treatments was not significant except for the ET0.4 treatment, in which water stress severely depressed fruit yield by about 70% compared to full irrigation. Across different irrigation treatments, WUE increased by 28.9% and 27.5% with AM+ over AM− in the first and second seasons, respectively. This result may be because mycorrhizal inoculation has positive implications for eggplant culture in arid regions when water is not reasonably sufficient for plant growth.
The regression equation fit for seasonal water use (ET) versus fruit yields showed that the increase in ET would induce a different response on yield (Figure 2). Fruit yields increased linearly with the total amount of water applied between planting and harvest over the range 208–496 mm in 2016 and 210–507mm in 2017, where single lines represented an average of AM− or AM+ during the two seasons. Over the range of water inputs, the yield in AM− increased by 107 kg ha−1 for each mm of water applied while the corresponding value in AM+ increased by 130 kg ha−1 mm for the same years. Both functions were significant and had a high coefficient of determination (R2 = 0.998 and 0.997; P = 0.05) for the same seasons, respectively. The intercept on the x-axis of this relationship can be used as a measure of the amount of water lost by evaporation from the soil and canopy before crop establishment. However, this remaining water was relatively little with AM+, indicating that mycorrhiza can provide primarily support in the early stages of the plant of growth.
The yield response factor (Ky) indicates the level of tolerance of a crop to water deficits (the higher the value, the lower the tolerance). The yield response factor (Ky) was calculated for both the total yield (Ky) and total dry biomass (Kss) produced by the crop, considering the data of the two years (Figure 3). The slope of the fitted regressions, which represents Ky and Kss factors, was 1.196 and 0.863 for fruit yield and total dry biomass in AM−and 1.164 and 0.836 for the same parameters in AM+, respectively, where in both cases, the reduction in crop productivity was proportionally higher than the relative ET deficit. However, the lower Ky was calculated for both parameters, indicating that eggplant with AM+ was relatively less affected by the soil water deficit than with AM−, which may help plants to cope with low water under field conditions. The calculation of this coefficient with respect to the plant total dry biomass rather than yield resulted in values < 1 (0.836 for AM−and 0.863 for AM+), which would seem to be contrary to fruit yield. The evidence supporting this result was related to the effect of irrigated treatments on the assimilate partitioning distribution (harvest index), which significantly changed among the irrigated treatments, ranging between 0.47 and 0.41.

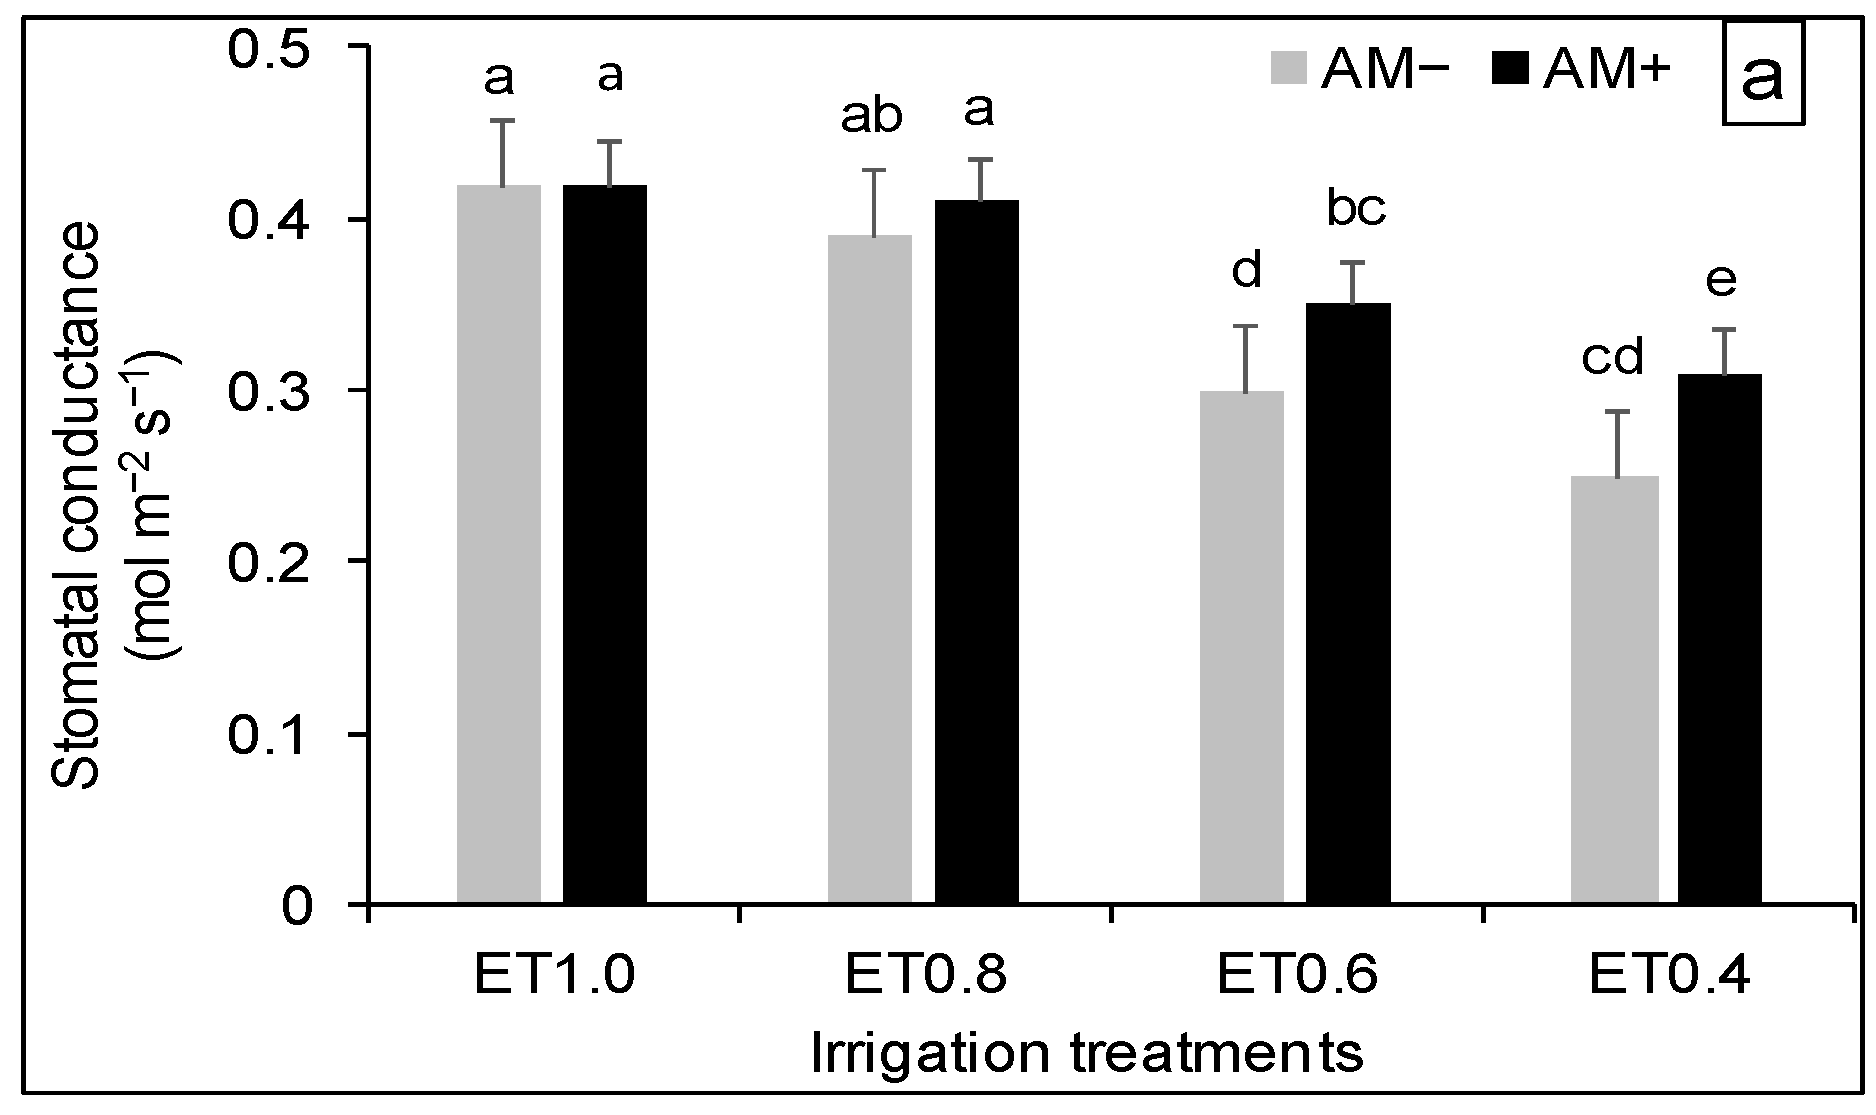
3.3. Plant Physiological Response

Plant physiological status showed remarkable differences between full irrigation and water deficit treatments during the flowering stage (Figure 4a,b). Considering all measurements taken when the temperature rose at midday, gs and Pn in ET1.0 plants averaged higher values than in water deficit treatments under both AM treatments. In contrast, the values in the mild water deficit ET0.8 with AM+ were a little bit lower than other treatments. The values of gs showed an appreciable decline by 29% and 40% in water deficit treatments at ET0.6 and ET0.4 with AM− vs. only 17% and 26% with the same treatments in AM+, respectively. Similarly, Pn values in ET0.8 were unaffected at ET0.8 by either AM treatment. At the same time, AM− contributed to a 25% and 31% decline at ET0.6 and ET0.4 with AM− vs. 16% and 22% only with AM+, respectively, than those obtained at full irrigation.

3.4. Plant N and P Uptake

Substantial significant differences were found in total N and P uptake between various irrigation and AM treatments and such a trend of response was similar to the yield trend (Table 4). Total aboveground N uptake (shoots + fruits) was relatively higher in AM+ than in AM− plants under all irrigation treatments, resulting from higher dry biomass and N contents in the shoots and fruits (data not shown). Similarly, total aboveground P uptake was higher in AM+ plants, which corresponded to both a relatively higher plant P concentration and higher dry biomass. As a proportion of the N and P uptake, AM+ gave the most satisfactory recovery of both nutrients despite the sandy nature of the soil. This corresponded to a lower N:P ratio in AM+ plants mainly in the full irrigation treatment, corresponding to a relatively higher P uptake than N uptake, indicating a specific effect of AM+ on the absorption of phosphorus.

3.5. Soil Fertility

The analysis of variance within each year revealed no significant effect for irrigation treatments alone, or when combined with AM+ on soil fertility; therefore, only the latter factor is only discussed. Before plant cultivation, initial OC in the soil was 0.25% while at harvest of the first and second season, there was a trend toward higher OC in soil with AM+ plants, reaching 26% and 31% over AM− in the first and the second seasons, respectively (Table 5). AM+ within irrigation treatments led to varying amounts of available NPK in the soil after harvest. The available N and K content with AM+ increased by 20 - 25% and 15 - 17% over AM− in the same season, respectively, while P content increased markedly by 30-50% regardless of drought stress.

4. Discussion

4.1. Yield Response and Plant Water Relations

The maximum yield traits under ET1.0 were mainly due to the sufficient available water in the soil, which led to an increase in water and nutrient absorption and consequently in the metabolic mechanisms in the plants, increasing the fruit yield and total dry biomass. However, there were significant reductions in the total yield when less water was applied, and the negative response to the irrigation deficit was more evident when the water supply was less than 20% of the full irrigation demand. The shortage in the yield of many crops under lower available water may be due to a reduced soil water content, which has been shown to delay rooting [37], along with a reduction in leaf area, root system, and shoot biomass, and a low photosynthetic rate [38]. Fruit yield and total dry biomass with AM+ was higher during both the seasons across different irrigation regimes, with the total yield 28% higher than AM− plants.
The ability of AM fungi to protect the host plant against progressive drought appears to be related to the intrinsic capacity of mycorrhizal fungi to resist drought stress. Thus, the main effect of AM on plant growth was in fruit rather than shoots, which increased the total dry biomass. The association with AM fungi increased the eggplant yield and fruit numbers in both full and deficit irrigation treatments; a higher fruit set likely occurred in AM+ plants but without other substantial changes in fruit weight. The higher fruit biomass in AM+ plants and few differences in shoot biomass pointed to a specific effect on fruit rather than a general effect on plant growth. Eggplant showed a remarkable decrease in the harvest index (HI), which changed significantly among irrigation treatments (data not shown), indicating that water deficits had a substantial consequence on saleable production. However, AM fungi has been shown to affect plant reproductive growth [39,40], including increasing the total number of flowers as well as the proportion of flowers setting as fruit [41].
The correlation analysis between fruit yield and average fruit weight showed a weak correlation, indicating that the change in yield was not affected by fruit weight [42,43]. However, eggplant tends to abort some flowers when sensing water stress to limit the number of fruit reaching the maturity stage to as few as possible. Aujla et al. [24] and Colak et al. [43] reported similar results with a decrease in the fruit yield of eggplant at a reduced water level and the formation of fewer fruits. The fruit size was not affected.
The response to mycorrhizal colonization was relatively greater for drought-stressed than full irrigation conditions, which may be explained by a higher absorption root surface area or a significant proliferation of root or hydraulic differences between root systems [44,45]. Drought stress may impede the translocation of nutrients and metabolites from the leaf to the reproductive organs. The improved nutritional status and relative water content caused by mycorrhizal colonization would have alleviated drought effects and promoted fruit production with changing water stress. The experimental data agree with the findings of others that mycorrhizal aided host plant drought tolerance and the associated yield increase under water deficit conditions [9,25].
Higher rates of root sap exudation in AM+ plants may reflect the reason behind higher root osmotic hydraulic conductance, a pathway for water uptake that may play an essential role under dry conditions [26,46]. Irrespective of irrigation treatments, AM+ improved the plant water status, suggesting that AM+ roots could extract more water from deeper soil profiles or that AM+ plants regulated daily leaf gas exchange. These findings suggest that AM affected a suite of interrelated plant drought responses that together enabled plants to produce higher yields. Previous work from Cavagnaro et al. [47] showed similar microbial communities (AM) in the soil around roots, suggesting that these changes may be relatively minor. However, there is still a possibility that there are micro-scale fungal–bacterial interactions that affect nutrient availability and uptake by the plant.
Water use efficiency (WUE) is defined as the ratio between the actual yield achieved and the total water use, including rainfall, and is expressed in physical terms (kg ha mm−1). WUE did not cause significant variation due to different deficit irrigation treatments except for ET0.4 when the yield was severely depressed by water deficit (Table 3). Although, in a limited way, WUE showed a decreasing trend when the water supply was lower than 100% ET of the crop, indicating sensitivity to water stress [31]. However, AM fungi contributed consistently to higher WUE under all deficit irrigation treatments in both years, leading to a higher fruit yield. The regression equations’ fit for crop ET versus fruit yields showed that the same increase in ET would induce a different improvement on eggplant yields for different irrigation treatments (Figure 2a,b). Significant linear relationships were established between the total applied water and fresh fruit yield as indicated by the slopes of the lines shown in Figure 2. The slope of the line for AM+ was steeper than for AM–, where the fruit yield increased by 130 t ha−1 for AM+ versus 107 t ha−1 for AM–, respectively.
The sensitivity of eggplant to water stress due to deficit irrigation, as expressed by (Ky and Kss), indicates the level of tolerance of a crop to water stress (the value is over than 1 when the yield declines proportionally to the ET deficit). Fruit yield and total dry biomass decreases by decreasing the water deficit are higher than proportional to the relative ET decrease. In this regard, eggplant seems to be more sensitive to a water deficit than other vegetable crops, e.g., tomato, where Ky was lower than one calculated in a Mediterranean region [48]. The calculation of Ky gave a value > 1 according to FAO, which means a particular sensitivity to a water deficit; in other words, a crop production decrease due to water deficit treatments, which is more than proportional to the ET decrease. However, higher values were obtained in AM+ for fruit yield and total dry biomass than in AM−, showing the importance of mycorrhizal inoculation in supporting water stress tolerance to stress-sensitive crops. The relatively lower Ky factor under AM+ could account for a guarantee of the higher water uptake capacity by the roots’ association with stimulated soil OC, which in turn improves soil conditions for plant growth [26,49]. Thus, the water deficit imposed a substantial consequence on fresh fruit production that ranged between 22% and 70% due to water stress. In comparison, the measured total dry biomass decrements at the same water levels only ranged between 12% and 51%. Thus, in eggplant, the fresh fruit yield decrease was more proportional to the ET drop, and this explains the differences in terms of Ky and Kss in this crop.

4.2. Photosynthesis, Nutrient Status, and Soil OC

A trend toward higher gs and Pn in AM+ plants under water stress was indicated by the assimilation of higher C for vegetative and fruit growth. In contrast, relative inhibition in the AM− plant was observed to avoid rapid loss of water through transpiration. However, the differences in gs in AM+ vs. AM− plants have been attributed to plant size and C dynamics over the whole growing season as a driver in water relations. AM fungi also regulate diurnal patterns of leaf gas exchange, for instance, by maximizing C gain through increased stomatal conductance early in the day when the vapor pressure is lower followed by a reduction in gs in the afternoon [50]. This could explain how AM+ plants could control higher gs when the daily air temperature peaks despite a larger canopy size.
Enhanced Pn in AM+ plants may result from higher gs, increased N and P nutrition, and/or higher C sink stimulation. Moreover, higher gs would increase CO2 diffusion to sites of carboxylation and support higher Pn [26,51]. That M+ plants appeared to optimize responses to the soil moisture content in ways that would maximize growth agrees with studies in controlled environments that show AM+ plants respond more quickly than AM− plants to changes in soil moisture [17,26,52]. These results suggest that AM affects a range of biological processes associated with the plant drought response that produces a higher crop yield.
Water deficit plants had the lowest N and P uptake since the absorption of elements mainly depends on the available water in the soil. Total uptake of N was higher in AM+ plants than the corresponding values in AM− plants when considering the water treatments together, due to the higher fruit biomass in AM+ plants. As the greater demand for N and drought impedes the mobility of nitrate, mycorrhizal colonization is essential for the host plant N nutrition under water deficit conditions. The external mycelium of AM can transport 40% of the added N under moderate drought conditions, which modifies the N acquisition and assimilation by host plant roots [53]. An enhanced nutritional and water status of mycorrhizal plants assists in the production of a higher number of flowers and fruits and a greater degree of conversion of flowers into fruits, where abortion of flowers is a significant constraint that leads to lower productivity in many plants [25,43]. Total P uptake was also higher in AM+ plants due to the relatively higher plant P uptake than N uptake in these plants. The remarkable increases in plant N and P uptake observed in AM+ plants may have affected growth, especially fruit production [54] and the physiological status (photosynthetic rate and stomatal conductance [26,55]. The enhanced capacity for P uptake by AM+ fungi was expected to be more effective under drought conditions as AM could transfer extra P to the root system by passing direct uptake [56,57]. This contribution resulted in a better N:P ratio in fruit and total dry biomass but mainly in the full irrigation treatment. Higher uptake of N and P in AM+ plants can contribute to a significant increase in fruit biomass, where a large proportion of nutrients will be stored in fruits that will be reflected in plant production.
The organic C and available N and P content increased relatively with AM+ plants at the harvest of both seasons as a result of organic substances and microbial activity in the soil (Table 5). The increase in available P could be attributed to the mineralization of organic P, solubilization action of certain organic acids, and displacement of phosphate with organic anions. The equivalent quantity of these nutrients from such an organic source will be available in a fair manner and could be an additive source for plant nutrition for sustaining soil fertility buildup.

5. Conclusions

The inoculation of mycorrhizal colonization increased the yield and regulated the physiological status of eggplant associated with a higher nutrient uptake and soil fertility at different water stress, and potentially managed water drought tolerance. The mycorrhizal response showed a better performance under severe water stress than full irrigation conditions. This proved that mycorrhizal fungi play an essential role in plant responses under adverse plant and soil conditions, particularly in sandy soil. Strategies that boost water-saving management in agriculture systems may be suggested to include services provided by mycorrhizal associations from detrimental effects of drought stress in arid and semi-arid regions.

Author Contributions

M.A.B. and W.A.E.-T. conceptualized and designed the experiment, M.A.B, W.A.E.-T. and S.D.A.-H. performed the experiments, M.A.B. and W.A.E.-T. analyzed the data and wrote the paper; N.S.G. revised and finalized the paper. All authors have read and agreed to the published version of the manuscript.

Funding

This research received no external funding.

Conflicts of Interest

The authors declare no conflict of interest.

Abbreviations

AMarbuscular mycorrhizal;
AMFarbuscular mycorrhizal fungi;
AM+inoculated;
AM−non-inoculated;
WUEwater use efficiency;
ETevopotranspiration;
ET0evapotranspiration;
Tmaxaverage monthly maximum temperature;
Tminand average monthly minimum temperature;
Ymreference maximum yield;
Ya 1actual yield;
Kssbiomass response factor;
Kyyield response factor;
SStotal dry biomass;
gsstomatal conductance;
Pnphotosynthetic rate;
Fttotal nutrient uptake;
F0total nutrient uptake under unfertilized treatment;
Ftotal amount of nutrient applied during the whole season;
DATdays after transplantation;
HIharvest index;
OCorganic carbon.

References

  1. Elliott, J.; Deryng, D.; Müller, C.; Frieler, K.; Konzmann, M.; Gerten, D.; Glotter, M.; Flörke, M.; Wada, Y.; Best, N.; et al. Constraints and potentials of future irrigation water availability on agricultural production under climate change. Proc. Natl. Acad. Sci. USA 2014, 111, 3239–3244. [Google Scholar] [CrossRef] [PubMed] [Green Version]
  2. Ruiz-Lozano, J.M.; Porcel, R.; Azcón, R.; Bárzana, G.; Aroca, R. Contribution of arbuscular mycorrhizal symbiosis to plant drought tolerance: State of the art. In Responses to Drought Stress: From Morphological to Molecular Features; Aroca, R., Ed.; Springer: Berlin/Heidelberg, Germany, 2012; pp. 335–362. [Google Scholar]
  3. Costa, J.M.; Ortuño, M.F.; Chaves, M.M. Deficit irrigation as a strategy to save water: Physiology and potential application to horticulture. J. Integr. Plant Biol. 2007, 49, 1421–1434. [Google Scholar] [CrossRef]
  4. Badr, M.A.; El-Tohamy, W.A.; Zaghloul, A.M. Yield and water use efficiency of potato grown under different irrigation and nitrogen levels in an arid region. Agric. Water Manag. 2012, 110, 9–15. [Google Scholar] [CrossRef]
  5. Bardgett, R.D.; van der Putten, W.H. Belowground biodiversity and ecosystem functioning. Nature 2014, 515, 505–511. [Google Scholar] [CrossRef]
  6. Mohan, J.E.; Cowden, C.C.; Baas, P.; Dawadi, A.; Frankson, P.T.; Helmick, K.; Hughes, E.; Khan, S.; Lang, A.; Machmuller, M.; et al. Mycorrhizal fungi mediation of terrestrial ecosystem responses to global change: Mini-review. Fungal Ecol. 2014, 10, 3–19. [Google Scholar] [CrossRef]
  7. Badr, M.A.; Abou Hussein, S.D.; El-Tohamy, W.A.; Gruda, N. Efficiency of subsurface drip irrigation for potato production under different dry stress conditions. Healthy Plants 2010, 62, 63–70. [Google Scholar] [CrossRef]
  8. Badr, M.A.; El-Tohamy, W.A.; Hussein, S.D.A.; Gruda, N. Tomato yield, physiological response, water and nitrogen use efficiency under deficit and partial root zone drying irrigation in an arid region. J. Appl. Bot. Food Qual. 2018, 91, 332–340. [Google Scholar] [CrossRef]
  9. Augé, R. Water relations, drought and vesicular-arbuscular mycorrhizal symbiosis. Mycorrhiza 2001, 11, 3–42. [Google Scholar] [CrossRef]
  10. Baum, C.; El-Tohamy, W.; Gruda, N. Increasing the productivity and product quality of vegetable crops using arbuscular mycorrhizal fungi: A review. Sci. Hortic. 2015, 187, 131–141. [Google Scholar] [CrossRef]
  11. Augé, R.M.; Toler, H.D.; Moore, J.L.; Cho, K.; Saxton, A.M. Comparing contributions of soil versus root colonization to variations in stomatal behavior and soil drying in mycorrhizal Sorghum bicolor and Cucurbita pepo. J. Plant Physiol. 2007, 164, 1289–1299. [Google Scholar] [CrossRef]
  12. Michalis, O.; Ioannides, I.M.; Ehaliotis, C. Mycorrhizal inoculation affects arbuscular mycorrhizal diversity in watermelon roots but leads to improved colonization and plant response under water stress only. Appl. Soil Ecol. 2013, 63, 112–119. [Google Scholar] [CrossRef]
  13. Aroca, R.; Vernieri, P.; Ruiz-Lozano, J.M. Mycorrhizal and non-mycorrhizal Lactuca sativa plants exhibit contrasting responses to exogenous ABA during drought stress and recovery. J. Exp. Bot. 2008, 59, 2029–2041. [Google Scholar] [CrossRef] [Green Version]
  14. Kaschuk, G.; Kuyper, T.W.; Leffelaar, P.A.; Hungria, M.; Giller, K.E. Are the rates of photosynthesis stimulated by the carbon sink strength of rhizobial and arbuscular mycorrhizal symbioses? Soil Biol. Biochem. 2009, 41, 1233–1244. [Google Scholar] [CrossRef]
  15. Birhane, E.; Sterck, F.J.; Fetene, M.; Bongers, F.; Kuyper, T.W. Arbuscular mycorrhizal fungi enhance photosynthesis, water use efficiency, and growth of frankincense seedlings under pulsed water availability conditions. Oecologia 2012, 169, 895–904. [Google Scholar] [CrossRef] [PubMed] [Green Version]
  16. Augé, R.M.; Toler, H.D.; Saxton, A.M. Arbuscular mycorrhizal symbiosis alters stomatal conductance of host plants more under drought than under amply watered conditions: A meta-analysis. Mycorrhiza 2015, 25, 13–24. [Google Scholar] [CrossRef]
  17. Lazcano, C.; Barrios-Masias, F.H.; Jackson, L.E. Arbuscular mycorrhizal effects on plant water relations and soil greenhouse gas emissions under changing moisture regimes. Soil Biol. Biochem. 2014, 74, 184–192. [Google Scholar] [CrossRef]
  18. Foley, J.A.; Ramankutty, N.; Brauman, K.A.; Cassidy, E.S.; Gerber, J.S.; Johnston, M.; Mueller, N.D.; O’Connell, C.; Ray, D.K.; West, P.C.; et al. Solutions for a cultivated planet. Nature 2011, 478, 337–342. [Google Scholar] [CrossRef] [Green Version]
  19. Adesemoye, A.O.; Torbert, H.A.; Kloepper, J.W. Plant growth-promoting rhizobacteria allow reduced application rates of chemical fertilizers. Microb. Ecol. 2009, 58, 921–929. [Google Scholar] [CrossRef]
  20. Hungria, M.; Nogueira, M.A.; Araujo, R.S. Co-inoculation of soybeans and common beans with rhizobia and azospirilla: Strategies to improve sustainability. Biol. Fertil. Soils 2013, 49, 791–801. [Google Scholar] [CrossRef]
  21. Suriyagoda, L.D.B.; Ryan, M.H.; Renton, M.; Lambers, H. Plant responses to limited moisture and phosphorus availability: A meta-analysis. Adv. Agron. 2014, 124, 143–200. [Google Scholar]
  22. Neumann, E.; George, E. Colonisation with the arbuscular mycorrhizal fungus Glomus mosseae (Nicol. & Gerd.) enhanced phosphorus uptake from dry soil in Sorghum bicolor (L.). Plant Soil 2004, 261, 245–255. [Google Scholar]
  23. George, E.; Marschner, H.; Jakobsen, I. Role of arbuscular mycorrhizal fungi in uptake of phosphorus and nitrogen from soil. Crit. Rev. Biotechnol. 1995, 15, 257–270. [Google Scholar] [CrossRef]
  24. Hetrick, B.A.D.; Wilson, G.W.T.; Todd, T.C. Mycorrhizal response in wheat cultivars: Relationship to phosphorus. Can. J. Bot. 1996, 74, 19–25. [Google Scholar] [CrossRef]
  25. Subramanian, K.S.; Santhanakrishnan, P.; Balasubramanian, P. Responses of field grown tomato plants to arbuscular mycorrhizal fungal colonization under varying intensities of drought stress. Sci. Hortic. 2006, 107, 245–253. [Google Scholar] [CrossRef]
  26. Bowles, T.M.; Barrios-Masias, F.H.; Carlisle, E.A.; Cavagnaro, T.R.; Jackson, L.E. Effects of arbuscular mycorrhizae on tomato yield, nutrient uptake, water relations, and soil carbon dynamics under deficit irrigation in field conditions. Sci. Total Environ. 2016, 566, 1223–1234. [Google Scholar] [CrossRef] [Green Version]
  27. Gruda, N.; Bisbis, M.B.; Tanny, J. Impacts of protected vegetable cultivation on climate change and adaptation strategies for cleaner production—A review. J. Clean. Prod. 2019, 225, 324–339. [Google Scholar] [CrossRef]
  28. Gruda, N.; Bisbis, M.B.; Tanny, J. Influence of climate change on protected cultivation: Impacts and sustainable adaptation strategies—A review. J. Clean. Prod. 2019, 225, 481–495. [Google Scholar] [CrossRef]
  29. FAO. FAOSTAT. Food and Agriculture Organization of the United Nations. 2016. Available online: http://faostat.fao.org/statistics (accessed on 10 August 2020).
  30. Karam, F.; Sabiha, R.; Skaf, S.; Breidy, J.; Rouphael, Y.; Balendonck, J. Yield and water use of eggplants (Solanum Melongena L.) under full and deficit irrigation regimes. Agric. Water Manage. 2011, 98, 1307–1316. [Google Scholar] [CrossRef]
  31. Lovelli, S.; Perniola, M.; Ferrara, A.; Di Tommaso, T. Yield response factor to water (Ky) and water use efficiency of Carthamus tinctorius L. and Solanum melongena L. Agric. Water Manag. 2007, 92, 73–80. [Google Scholar] [CrossRef]
  32. Allen, R.G.; Pereira, L.S.; Raes, D.; Smith, M. Crop Evapotranspiration. Guidelines for Computing Crop Water Requirements. FAO Irrigation and Drainage. Paper No. 56; FAO: Rome, Italy, 1998; p. 300. [Google Scholar]
  33. Stewart, J.I.; Cuenca, R.H.; Pruit, W.O.; Hagan, R.M.; Tosso, J. Determination and Utilization of Water Production Functions for Principal California Crops. W-67 California Contribution Project Report; University of California: Davis, CA, USA, 1977. [Google Scholar]
  34. Jones, J.B.J.; Case, V.W. Sampling, Handling and Analyzing Plant Tissue Samples; Westerman, R.L., Ed.; Soil Testing and Plant Analysis: Madison, WI, USA, 1991; pp. 289–427. [Google Scholar]
  35. Eaton, A.D.; Clesceri, L.S.; Greenberg, A.E. Standard Methods for the Examination of Water and Wastewater, 19th ed.; American Public Health Association: Washington, DC, USA, 1995. [Google Scholar]
  36. Wu, J.; Joergensen, R.G.; Pommerening, B.; Chaussod, R.; Brookes, P.C. Measurement of soil microbial biomass C by fumigation-extraction: An automated procedure. Soil Biol. Biochem. 1990, 22, 1167–1169. [Google Scholar] [CrossRef]
  37. Bathke, G.R.; Gassel, D.K.; Hargrove, W.L.; Porter, P.M. Modification of soil physical properties and root growth response. Soil Sci. 1992, 154, 316–329. [Google Scholar] [CrossRef]
  38. Masle, J.; Passiour, J.B. The effect of soil strength on the growth of young wheat plants. Aust. J. Plant Physiol. 1987, 14, 643–656. [Google Scholar] [CrossRef]
  39. Bryla, D.R.; Koide, R.T. Regulation of reproduction in wild and cultivated Lycopersicon esculentum Mill. by vesicular-arbuscular mycorrhizal infection. Oecologia 1990, 84, 74–81. [Google Scholar] [CrossRef]
  40. Poulton, J.L.; Bryla, D.; Koide, R.T.; Stephenson, A.G. Mycorrhizal infection and high soil phosphorus improve vegetative growth and the female and male functions in tomato. New Phytol. 2002, 154, 255–264. [Google Scholar] [CrossRef] [Green Version]
  41. Conversa, G.; Lazzizera, C.; Bonasia, A.; Elia, A. Yield and phosphorus uptake of a processing tomato crop grown at different phosphorus levels in a calcareous soil as affected by mycorrhizal inoculation under field conditions. Biol. Fertil. Soils 2013, 49, 691–703. [Google Scholar] [CrossRef]
  42. Aujla, M.S.; Thind, H.S.; Buttar, G.S. Fruit yield and water use efficiency of eggplant (Solanum melongema L.) as influenced by different quantities of nitrogen and water applied through drip and furrow irrigation. Sci. Hortic. 2007, 112, 142–148. [Google Scholar] [CrossRef]
  43. Colak, Y.B.; Yazar, A.; Çolak, I.; Akça, H.; Duraktekin, G. Evaluation of crop water stress index (CWSI) for eggplant under varying irrigation regimes using surface and subsurface drip systems. Agric. Sci. Procedia 2015, 4, 372–382. [Google Scholar] [CrossRef] [Green Version]
  44. Kothari, S.K.; Marschner, H.; George, E. Effect of VA fungi and rhizosphere organisms root and shoot morphology, growth and water relations in maize. New Phytol. 1990, 116, 303–311. [Google Scholar] [CrossRef]
  45. Augé, R.M.; Duan, X.; Ebel, R.C.; Stodola, A.J.W. Nonhydraulic signaling of soil drying in mycorrhizal maize. Planta 1994, 193, 74–82. [Google Scholar] [CrossRef]
  46. Barrios-Masias, F.H.; Knipfer, T.; McElrone, A. Differential responses of grapevine rootstocks to water stress are associated with adjustments in fine root hydraulic physiology and suberization. J. Exp. Bot. 2015, 66, 6069–6078. [Google Scholar] [CrossRef] [Green Version]
  47. Cavagnaro, T.R.; Jackson, L.E.; Six, J.; Ferris, H.; Goyal, S.; Asami, D.; Scow, K.M. Arbuscular mycorrhizas, microbial communities, nutrient availability, and soil aggregates in organic tomato production. Plant Soil 2006, 282, 209–225. [Google Scholar] [CrossRef]
  48. Patanè, C.; Tringali, S.; Sortinob, O. Effects of deficit irrigation on biomass, yield, water productivity and fruit quality of processing tomato under semi-arid Mediterranean climate conditions. Sci. Hortic. 2011, 129, 590–596. [Google Scholar] [CrossRef]
  49. Cheng, W. Priming effect: Its functional relationships with microbial turnover, Rhizosphere evapotranspiration, and C–N budgets. Soil Biol. Biochem. 2009, 41, 1795–1801. [Google Scholar] [CrossRef]
  50. Richards, R.A. Selectable traits to increase crop photosynthesis and yield of grain crops. J. Exp. Bot. 2000, 51, 447–458. [Google Scholar] [CrossRef]
  51. Chitarra, W.; Pagliarani, C.; Maserti, B.; Lumini, E.; Siciliano, I.; Cascone, P.; Schubert, A.; Gambino, G.; Balestrini, R.; Guerrieri, E. Insights on the Impact of Arbuscular Mycorrhizal Symbiosis on Tomato Tolerance to Water Stress. Plant Physiol. 2016, 171, 1009–1023. [Google Scholar] [CrossRef] [Green Version]
  52. Duan, X.; Neuman, D.; Reiber, J.; Green, C.; Saxton, A.; Augé, R. Mycorrhizal influence on hydraulic and hormonal factors implicated in the control of stomatal conductance during drought. J. Exp. Bot. 1996, 47, 1541–1550. [Google Scholar] [CrossRef] [Green Version]
  53. Subramanian, K.S.; Charest, C. Acquisition of N by external hyphae of an arbuscular mycorrhizal fungus and its impact on physiological responses in maize under drought-stressed and well-watered conditions. Mycorrhiza 1999, 9, 69–75. [Google Scholar] [CrossRef]
  54. Tei, F.; Benincasa, P.; Guiducci, M. Critical nitrogen concentration in processing tomato. Eur. J. Agron. 2002, 18, 45–55. [Google Scholar] [CrossRef]
  55. Liu, C.; Ravnskov, S.; Liu, F.; Rubaek, G.H. Arbuscular mycorrhizal fungi alleviate abiotic stresses in potato plants caused by low phosphorus and deficit irrigation/partial root-zone drying. J. Agric. Sci. 2018, 156, 46–58. [Google Scholar] [CrossRef]
  56. Cramer, M.; Hawkins, H.; Verboom, G. The importance of nutritional regulation of plant water flux. Oecologia 2009, 161, 15–24. [Google Scholar] [CrossRef]
  57. Javaid, A. Arbuscular mycorrhizal mediated nutrition in plants. J. Plant Nutr. 2009, 32, 1595–1916. [Google Scholar] [CrossRef]
Figure 1. Relationship between the total fruit yield and fruit number per plant (a), and total fruit yield and average fruit weight per plant (b), of eggplant subjected to varying water stress and AM inoculation.
Horticulturae 06 00045 g001
Figure 2. Relationship of total fruit yield versus the amounts of applied water (pooled AM− (a) and AM+ (b) of the two years), through regression analysis.
Horticulturae 06 00045 g002
Figure 3. Relative yield decrease and total dry biomass relative decrease as a function of the relative ET decrease, measured in eggplant subjected to varying water stress and AM inoculation (pooled AM− (a) and AM+ (b) of the two years).
Horticulturae 06 00045 g003
Figure 4. Changes of stomatal conductance (a), and CO2 assimilation rate (b) at the flowering stage in eggplant subjected to varying water stress and AM inoculation. Data points are two years of pooled data of three replications.
Horticulturae 06 00045 g004aHorticulturae 06 00045 g004b
Table 1. Average monthly maximum (Tmax) and minimum (Tmin) temperature, relative humidity, rainfall, evapotranspiration (ET0), and wind speed during growing seasons.
MonthTmax
(°C)
Tmin
(°C)
Relative
Humidity (%)
Rain Fall
(mm)
ET0
(mm d−1)
Wind Speed
(km h−1)
2017
March23.610.2467.43.811.67
April28.312.5373.94.711.30
May32.215.9384.55.910.56
June34.518.74206.710.56
2018
March23.810.1456.23.711.85
April28.312.6362.44.711.65
May32.415.9383.65.910.56
June36.218.74306.710.19
Table 2. Fruit yield, total dry biomass, fruit number, and fruit weight of eggplant subjected to varying water stress and AM inoculation.
YearAM zIrrigation Levels
ET1.0ET0.8ET0.6ET0.4Mean
2017Fruit yield (t ha−1)
AM−42.75 b,y32.82 c23.75 d12.32 e27.91 B
AM+54.25 a41.97 b30.52 c15.94 e35.67 A
Mean48.50 A37.40 B27.14 C14.13 D
Total dry biomass (t ha−1)
AM−7.35 c6.28 d5.02 e3.34 g5.54 B
AM+9.33 a8.03 b6.68 d4.32 f7.09 A
Mean8.34 A7.16 B5.94 C3.83 D
Fruit number (g plant−1)
AM−23.64 b17. 69 c14.10 d7.33 e15.69 B
AM+28.46 a23.90 b18.97 c9.09 e20.10 A
Mean26.05 A20.80 B16.53 C8.21 D
Fruit weight (g plant−1)
AM−72.33 a,b74.20 a,b67.39 a,b67.20 a,b70.28 A
AM+76.26 a70.23 a,b64.35 b70.18 a,b70.25 A
Mean74.29 A72.22 A65.87 B68.69 B
2018Fruit yield (t ha−1)
AM−45.12 b35.18 c25.12 d13.32 e29.69 B
AM+57.32 a44.27 b32.54 c17.38 e37.88 A
Mean51.22 A40.23 B28.83 C15.35 D
Total dry biomass (t ha−1)
AM−7.76 b,c6.73 d5.50 e3.61 g5.90 B
AM+9.86 a8.47 b7.12 c,d4.71 f7.54 A
Mean8.81 A7.60 B6.31 C4.16 D
Fruit number (g plant−1)
AM−24.08 b19.18 c13.36 d7.36 e16.00 B
AM+29.23 a25.51 b18.52 c9.39 e20.66 A
Mean26.66 A22.53 B15.94 C8.38 D
Fruit weight (g plant−1)
AM−74.94 a,b73.37 a,b75.22 a,b72.35 a,b73.97 A
AM+78.44 a69.41 b70.27 b74.07 a,b73.05 A
Mean76.69 A71.39 B72.75 B73.21 B
z Abbreviations: AM = arbuscular mycorrhizal treatment; ET = evapotranspiration. y Values are significantly different based on the least significant difference (LSD) at P ≤ 0.05. Capital letters indicate significant differences among main effect means, and small letters indicate significant differences within factorial treatments.
Table 3. Water use efficiency (WUE - kg ha−1 mm−1) of eggplant subjected to varying water stress and AM inoculation.
YearAM zIrrigation Levels
ET1.0ET0.8ET0.6ET0.4Mean
2017AM−86 b,y82 b78 b59 c76 B
AM+109 a105 a100 a77 b98 A
Mean98 A93 A89 A68 B
2018AM−89b b86 b81 b63 c80 B
AM+113 a108 a105 a83 b102 A
Mean101 A97 A93 A73 B
z Abbreviations: AM = arbuscular mycorrhizal treatment; ET = evapotranspiration. y Values followed by different letters are significantly different based on the least significant difference (LSD) at P ≤ 0.05. Capital letters indicate significant differences among main effect means, and small letters indicate significant differences within factorial treatments.
Table 4. Total N and P uptake in fruits and shoots of eggplant subjected to varying water stress and AM inoculation.
Year Treatment z N Uptake (kg ha−1)N Recovery
%
P Uptake (kg ha−1)P Recovery
%
N:P
Ratio
FruitShoot Total FruitShoot Total
2017ET1.0 AM−75 b,y69 c144 c4412.0 c9.8 c21.8 c166.6
AM+95 a87 a183 a5717.4 a15.0 a32.3 a245.7
ET0.8 AM−63 c60 d123 d3710.0 d7.9 d17.9 d126.9
AM+80 b77 b157 b4814.6 b12.3 b26.9 b205.8
ET0.6 AM−47 d48 e95 e287.0 e6.3 e13.3 e97.1
AM+60 c66 c,d126 d389.8 d8.9 c18.7 c,d136.7
ET0.4 AM−30 f31 f61 g164.2 f4.1 f8.3 f47.4
AM+38 e43 e82 f236.3 e5.8 e12.1 e86.7
2018ET1.0 AM−78 b73 c150 c4612.6 c10.4 d23.0 c176.5
AM+99 a92 a191 a6018.3 a15.8 a34.2 a265.6
ET0.8 AM−67 c64 c132 d4010.7 d9.2 c19.9 d146.6
AM+85 b81 b166 b5115.4 b13.9 b29.3 b225.7
ET0.6 AM−50 d51 d101 e307.4 e6.4 d13.8 e97.3
AM+64 c70 c135 d4110.5 d10.3 c21.7 c,d156.5
ET0.4 AM−32 f34 e66 f184.5 f4.2 e8.7 f57.6
AM+42 e47 d89 e266.8 e6.9 d13.7 e96.5
z Abbreviations: AM = arbuscular mycorrhizal treatment; ET = evapotranspiration. y Values within the column followed by different letters are significantly different based on the least significant difference (LSD) at P ≤ 0.05.
Table 5. Residual soil fertility after the harvest of eggplant subjected to varying water stress and AM inoculation.
YearTreatments zOrganic C
(%)
Available Nutrients (mg kg−1 soil)
NPK
2017AM−0.27 a,y15 a10 a40 a
AM+0.34 b18 b13 b46 b
2018AM−0.29 a19 a10 a42 a
AM+0.38 b24 b15 b49 b
z Abbreviations: AM = arbuscular mycorrhizal treatment. y Values within the column followed by different letters are significantly different based on the least significant difference (LSD) at P ≤ 0.05.

