Article

Modulating Vapor Pressure Deficit in the Plant Micro-Environment May Enhance the Bioactive Value of Lettuce

Department of Agricultural Sciences, University of Naples Federico II, Via Università 100, 80055 Portici (Naples), Italy
*
Author to whom correspondence should be addressed.
Submission received: 29 January 2021 / Revised: 12 February 2021 / Accepted: 18 February 2021 / Published: 22 February 2021

Abstract

:
Growing demand for horticultural products of accentuated sensory, nutritional, and functional quality traits has been driven by the turn observed in affluent societies toward a healthy and sustainable lifestyle relying principally on plant-based food. Growing plants under protected cultivation facilitates more precise and efficient modulation of the plant microenvironment, which is essential for improving vegetable quality. Among the environmental parameters that have been researched for optimization over the past, air relative humidity has always been in the background and it is still unclear if and how it can be modulated to improve plants’ quality. In this respect, two differentially pigmented (green and red) Salanova® cultivars (Lactuca sativa L. var. capitata) were grown under two different Vapor Pressure Deficits (VPDs; 0.69 and 1.76 kPa) in a controlled environment chamber in order to appraise possible changes in mineral and phytochemical composition and in antioxidant capacity. Growth and morpho-physiological parameters were also analyzed to better understand lettuce development and acclimation mechanisms under these two VPD regimes. Results showed that even though Salanova plants grown at low VPD (0.69 kPa) increased their biomass, area, number of leaves and enhanced Fv/Fm ratio, plants at high VPD increased the levels of phytochemicals, especially in the red cultivar. Based on these results, we have discussed the role of high VPD facilitated by controlled environment agriculture as a mild stress aimed to enhance the quality of leafy greens.

1. Introduction

Air humidity (RH), and more specifically the Vapor Pressure Deficit (VPD), is one of the most important microclimate factors affecting plant transpiration rate in Controlled Environment Agriculture (CEA). Consequently, VPD affects all physiological and biochemical processes associated with the transpiration, such as: water balance, cooling, gas-exchange, and ion translocation, thus affecting plant growth and productivity [1,2]. It is well established that plants grown under a reduced VPD (high RH) enhance carbon gain by opening their stomata, usually improving at the same time, dry matter production [3]. Moreover, plants enhance growth under high RH levels, as long as the transpiration rate is still enough to support the uptake and distribution of essential macronutrients (Ca2+, Mg2+, K+) and phytohormones (auxin, cytokinin) [4]. Furthermore, in lettuce, high air humidity, especially during night, appears to prevent Ca2+ deficiency, a common physiological disorder known as tipburn, which negatively affects the nutritional quality and marketability of the product [5]. Under high VPD levels (low RH), plants try to avoid dehydration and water loss by closing their stomata, which negatively affect photosynthetic efficiency, thus determining a major reduction in plant growth and yield [6,7]. Nevertheless, high VPD in indoor cultivation has proven to enhance vegetable quality, for example increasing ascorbate, lycopene, β-carotene, rutin, and caffeic acid concentrations in greenhouse tomato, often connected to high irradiance during sunny hours when greenhouses are subjected to high VPD [6,8]. In greenhouse cherry tomato cv. Naomi, Rosales et al. [9] found an increment in ascorbic acid synthesis in plants grown under high VPD levels (2–3 kPa), probably due to the occurrence of oxidative stress [10,11]. This is consistent with other “controlled” stress like drought or salinity that, if moderately applied to plants, can increase product quality [12,13]. For instance, Favati et al. [14] found improved quality of tomato fruit subjected to deficit irrigation, in particular due to the enhancement of ascorbic acid and β-carotene. Moreover, controlled drought stress increased the levels of carotenoids in edible organs of pepper and carrot as well as the levels of sugars in tomato and cucumber fruits [12].
Notwithstanding the positive outcomes of recent research, little is known about the effects of VPD modulation on leafy greens nutritional and functional quality. Indeed, humidity is one of the most difficult environmental factors to control in CEA (instrumentally and economically), thus often being neglected by growers [6]. However, over the past two decades there has been a growing demand for high quality horticultural products [13,15], with consumers always looking for fresh and high nutritional food [16]. Bioactive compounds, also known as phytochemicals, are already present in leafy green vegetables and especially in lettuce, where red-leaved cultivars present very high content of vitamin C, polyphenols and antioxidant activities compared to their green counterparts [17,18]. Phytochemicals-rich-food are in great demand due to their ability to reduce the risk of cardiovascular diseases, some forms of cancer, and stimulate cognitive health against age-related problems [19]. Even though the genetic material (i.e., genotype) is the principal factor in determining how much phytochemicals a plant will accumulate during its life cycle, the influence of microclimatic factors affecting greenhouse and indoor growing modules vegetables, cannot be neglected. Several scientific papers have been published regarding genotype, and microclimate (e.g., air and root zone temperature, light quantity, and quality) effects on the quality of controlled environments vegetables [20,21], whereas the effects of VPD on leafy greens quality is still poorly explored.
In light of the foregoing, the aim of the current study was to assess how the modulation of VPD influences the nutritional and functional quality of green and red-leaved lettuce (Lactuca sativa L. var. capitata). For this purpose, a growth chamber experiment under controlled climatic conditions was conducted, growing plants under two different VPDs (0.6 kPa and 1.7 kPa), considered respectively low- and high- VPD. The development of lettuces in terms of anatomical structure of the leaf lamina, plant growth, as well as some plant physiological responses (Fv/Fm ratio and chlorophyll content) were examined. Treatments were compared in terms of leaf colorimetry coordinates, antioxidant activity, minerals profile, polyphenols, and total ascorbic acid content.

2. Materials and Methods

2.1. Experimental Design, Lettuce Genotypes, and Controlled Growing Conditions

The experiment was carried out on two butterhead Salanova® lettuce cultivars (Lactuca sativa L. var. capitata), with green and red leaves. Two-week old transplants were purchased from a local provider and grown at the Department of Agricultural Sciences (University of Naples Federico II, Italy) in two consecutive cycles, in a growth-chamber (KBP-6395F, Termaks, Bergen, Norwey) equipped with a Light-Emitting Diode (LED) panel unit (K5 Series XL750, Kind LED, Santa Rosa, CA, USA), with an emission wavelength range of 400–700 nm. The two cultivation cycles were identical in terms of agricultural practices and microclimatic conditions (light intensity, quality, photoperiod, air, and zone temperature), except for the VPD levels. More specifically, the first cycle was performed under an average VPD of 0.69 kPa and the second under a VPD of 1.76 kPa. The two VPDs were achieved keeping air temperature (T) at 24 ± 1° C and changing the RH accordingly. RH and T were controlled by the growth chamber and monitored inside the chamber by means of mini-sensors (Testo 174 H), equipped with a data-logger which collected data every 15 min.
In each cycle, 9 green and 9 red Salanova lettuces were transplanted into plastic trays (14 × 19 × 6 cm: W × L × D) on peat:perlite substrate (1:1 v/v). Daily rotation of the trays was performed to ensure homogenous light and humidity across the shelf surface. Plants were grown for 23 days under a red-green-blue (RGB) light of 315 µmol m−2 s−1, 12 h photoperiod (13.6 Daily Light Integral; DLI). All plants were fertigated to field capacity with a modified Hoagland solution (8.2 mM N-NO3, 2.0 mM S, 2.7 mM K+, 5.8 mM Ca2+, 1.4 mM Mg2+, 1.0 mM NH4+, 15.0 μM Fe, 9.0 μM Mn, 0.3 μM Cu, 1.6 μM Zn, 20 μM B, and 0.3 μM Mo), resulting in an electrical conductivity of 1.4 dS m−1 and a pH of 5.8.

2.2. Plant Growth Parameters, Biomass Production, and Leaf Colorimetry

Harvesting of all experimental units was performed 23 days after transplanting (DAT). Before harvesting, each plant was photographed from the top and digital images were used to assess plant total area (PA) through ImageJ 1.45 software (U.S. National Institutes of Health, Bethesda, MD, USA). The number of leaves (LN) was counted for all plants, which were then weighted to determine the above-ground fresh biomass (FB). For the dry biomass (DB) determination, samples of fresh leaf tissues (about 15 g per plant) were oven-dried at 70 °C for 3 days, until they reached a constant weight. On the harvesting day, leaf color was measured on the upper part of three representative leaves per plant, using a Minolta CR-300 Chroma Meter (Minolta Camera Co. Ltd., Osaka, Japan). The meter was calibrated with the standard white plate before measurements. Leaf chromaticity was performed following the Commission Internationale de l’Eclairage and expressed as: lightness (L*), b* (+b* yellowness) used to calculate chroma (C* = (a*2 + b*2)1/2) and Hue angle (H° = arctan (b*/a*)).

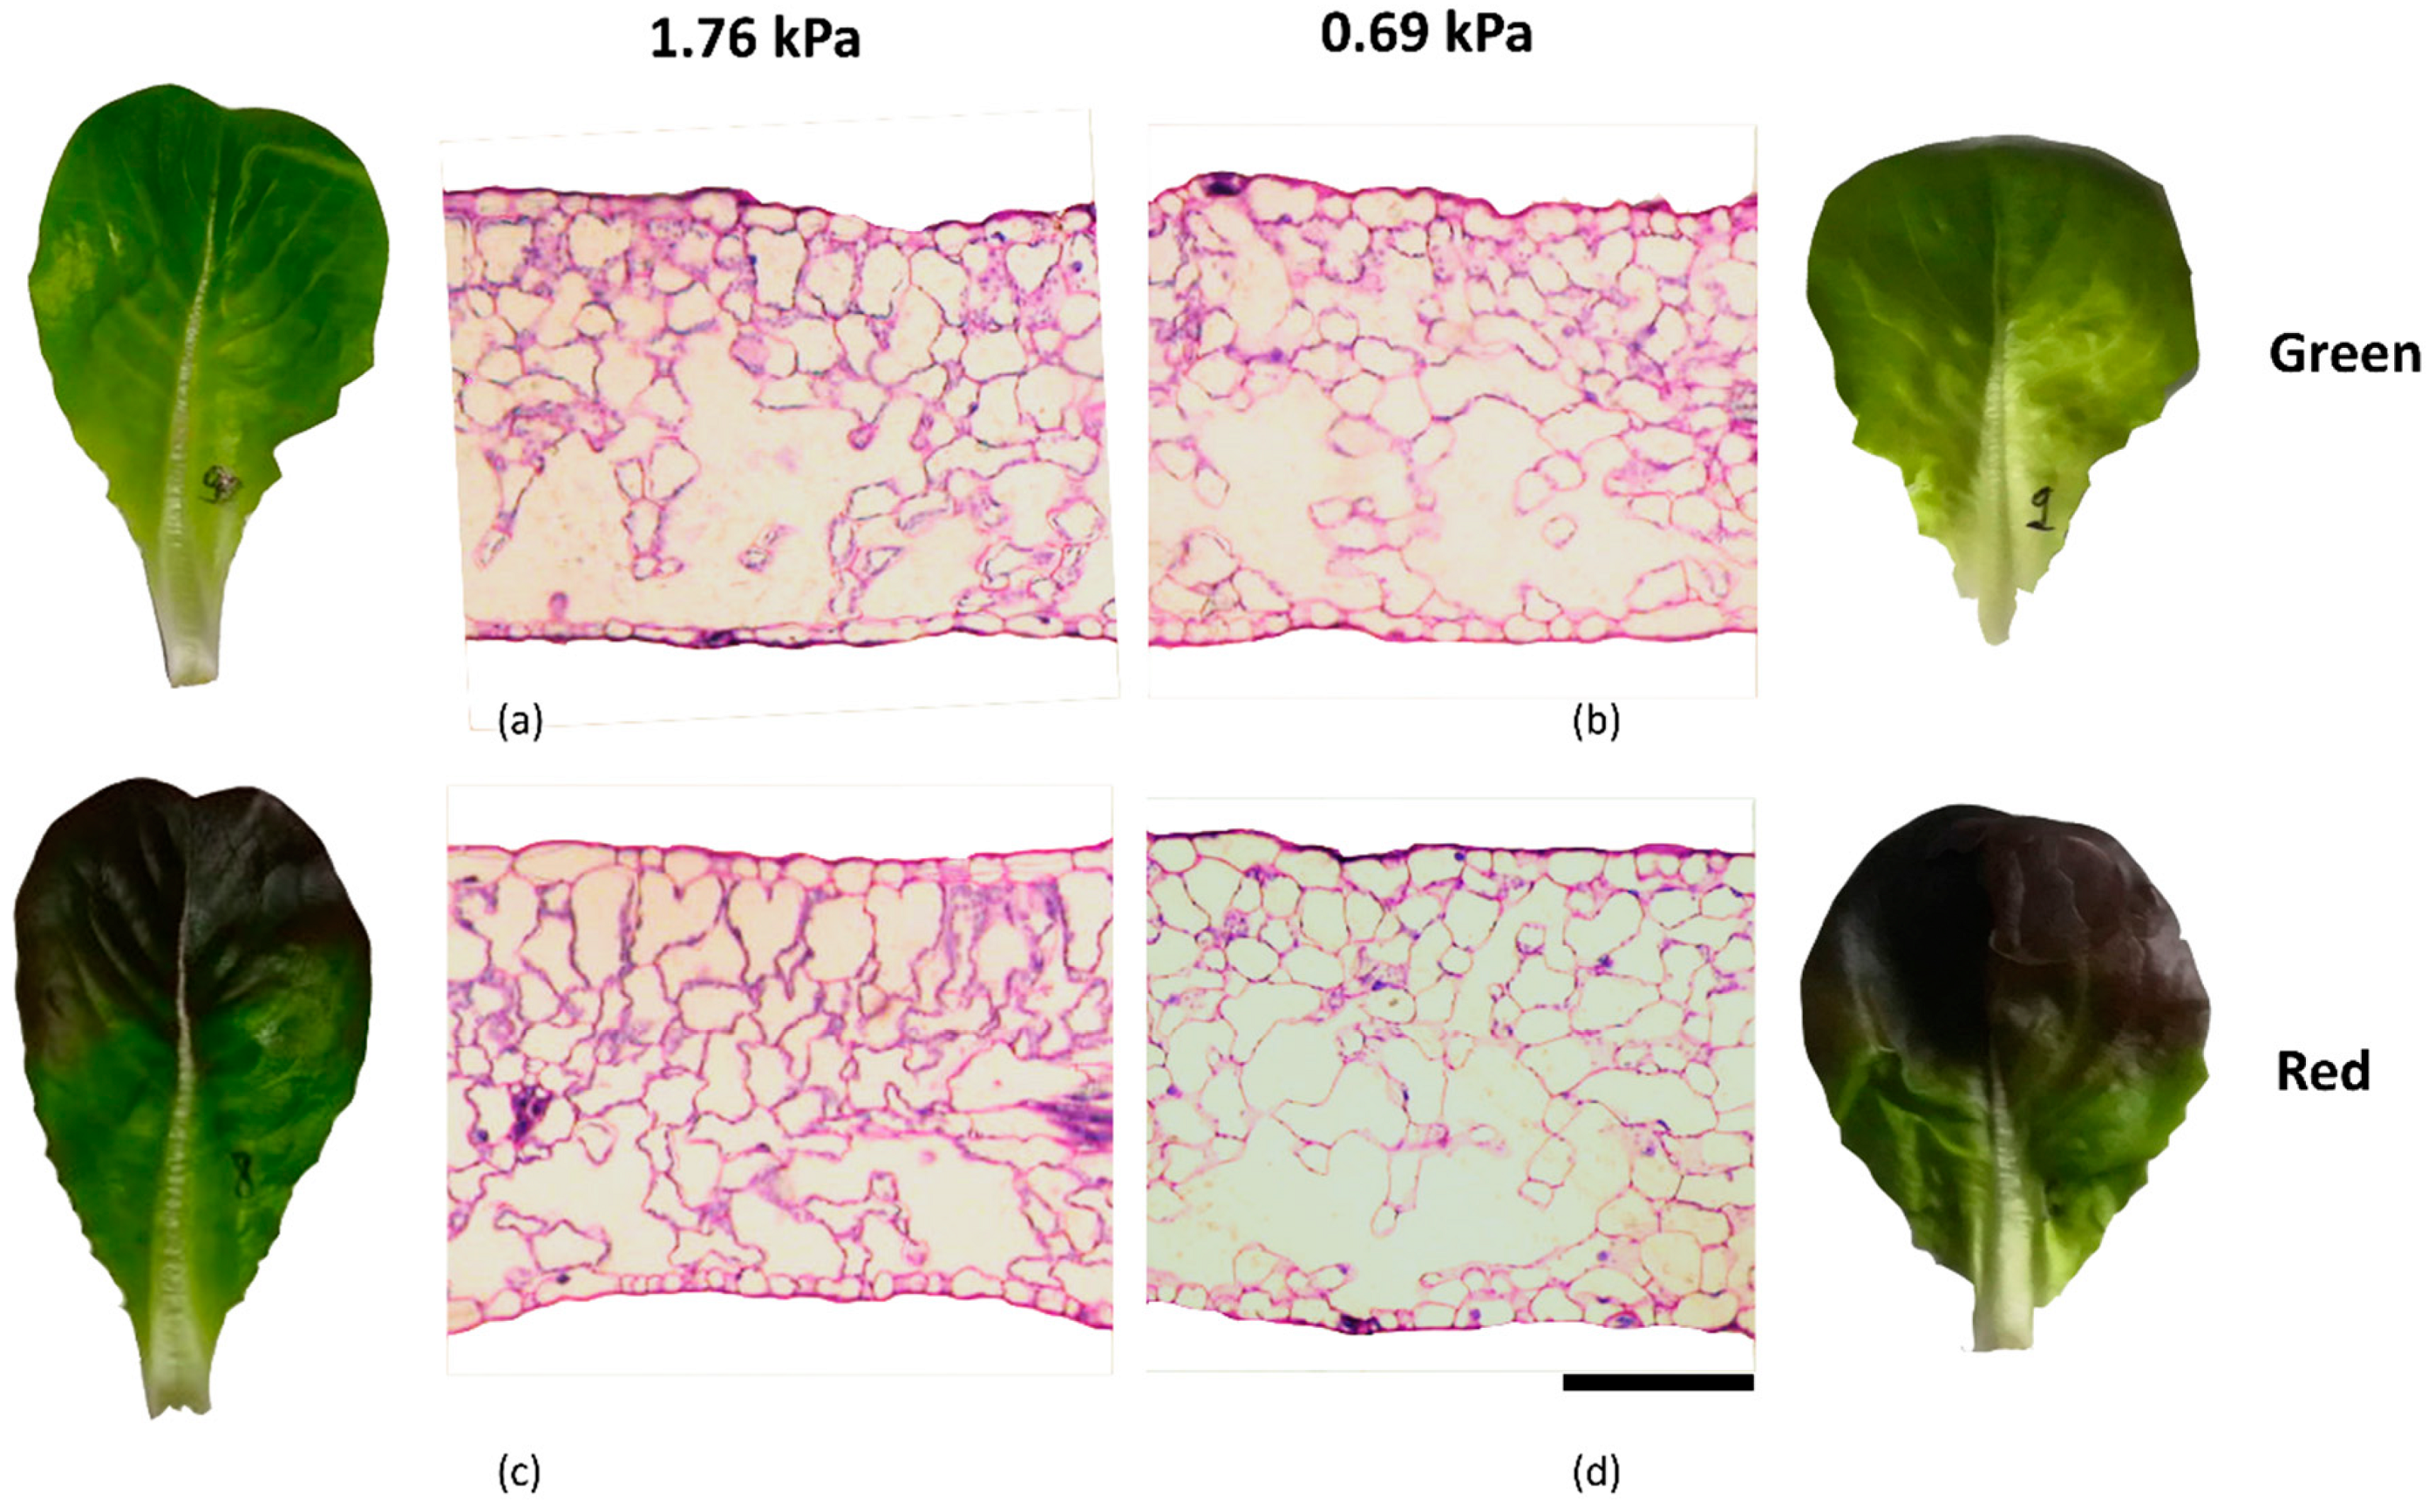
2.3. Anatomical Analyses of Leaves

At 23 DAT, one complete life-span leaf per plant was collected from the median part of the canopy and promptly stored in F.A.A. fixative solution (40% formaldehyde, glacial acetic acid, 50% ethanol, 5: 5: 90 by volume). Each leaf was dissected to remove the apical and basal portions, while keeping the median region of the lamina. 5 × 5 mm portions of the leaf lamina were dehydrated in an ethanol series (50, 70, and 95%) and embedded in the JB4 acrylic resin (Polysciences, Warrington, PA, USA). Thin cross sections (5 μm thick) were cut by means of a rotary microtome, stained with 0.025% toluidine blue [22] and mounted with mineral oil for microscopy. Sections were analyzed under the BX60 transmitted light microscope (Olympus, Hamburg, Germany), and digital images were collected and analyzed through the Olympus AnalySIS software (AnalySIS 3.2, Olympus). The following functional anatomical traits were quantified: upper and lower epidermis thickness (UET; LET) (μm); palisade parenchyma thickness (PT) (μm); spongy parenchyma thickness (ST) (μm); total leaf lamina thickness (LT) (μm) and percentage of intercellular spaces (IS) (%). All the thickness measurements were taken in 6 position along the lamina, avoiding veins and damaged areas. The IS was measured as percentage of area occupied by intercellular spaces over a given surface of parenchyma, in three regions of the leaf lamina, as reported in [23].

2.4. Mineral Composition in Leaf Tissue

Dried material was used for the evaluation of mineral leaf composition in terms of cations (K+, Mg2+, Ca2+ Na2+), anions (NO3, SO42−, PO43−) and acids (malate, tartrate, citrate, isocitrate). Dried leaves (0.25 g per replicate) were suspended in 50 mL of ultrapure water (Milli-Q, Merk Millipore, Darmstadt, Germany), frozen and then shook for 10 min in a water bath (ShakeTemp SW22, Julabo, Seelbach, Germany) at 80 °C. The mixture was then centrifuged at 6000 rpm for 10 min (R-10M, Remi Elektrotechnik, India) and the supernatant, was filtered to 0.45 µm, and stored at −20 °C until analysis. Anions and cations were separated and quantified by ion chromatography equipped with a conductivity detection (ICP 3000 Dionex, Thermo fisher Scientific Inc., MA, USA).

2.5. Extraction and Quantification of Total Ascorbic Acid, Polyphenols, Lipophylic, and Hydrophilic Antioxidant Activities

All phytochemical analyses were performed on 9 green and 9 red Salanova lettuces (one leaf per replicate). Total ascorbic acid (TAA) was assessed spectrophotometrically based on the protocol of Kampfenkel, Montagu, and Inze [24]. The phenolic content (PH) was determined using the Folin-Cicolteau procedure [25] using gallic acid (Sigma Aldrich Inc, St Louis, MO, USA) as a standard. The hydrophilic antioxidant activity (HAA) was measured using N,N-dimethyl-p-phenylenediamine (DMPD) method [26], whereas the lipophilic antioxidant activity (LAA) was measured following the ABTS method [27].

2.6. Soil Plant Analysis Development Index and Chlorophyll a Fluorescence Emission

At 12 and 23 DAT (middle and final point of experiments), the Soil Plant Analysis Development (SPAD) index was measured on 9 fully expanded leaves per condition by means of a portable chlorophyll meter SPAD-502 (Konica Minolta, Japan), avoiding major veins, leaflet margins, and damaged areas. On the same dates, measurements of leaf chlorophyll “a” fluorescence emission, were performed on the same leaves to calculate the maximum quantum efficiency of PSII photochemistry (Fv/Fm) on 30′ dark-adapted leaves, with a portable fluorometer, equipped with a light sensor (ADC BioScientific Ltd., Hoddesdon, United Kingdom).

2.7. Statistics

Data were initially subjected to a two-way analysis of variance (ANOVA). Interactions between cultivar and VPD (C × VPD) were further addressed through specific one-way ANOVA and treatment means were compared using Duncan’s multiple range test performed at p ≤ 0.05 using the SPSS 20 software package (IBM, Armonk, NY, USA). Moreover, multivariate analysis was used to perform an agglomerative hierarchical cluster analysis (HCA) of the data sets. For HCA, the paired group (UPGMA) and Euclidean distances were used for clustering. Results of HCA were displayed as a tree-shaped dendrogram, where the horizontal distance between clusters represented data dissimilarity, and a heat-map, through the web tool (Clustvis; https://biit.cs.ut.ee/clustvis/).

3. Results

3.1. Plant Growth Parameters, Biomass Production, and Leaf Colorimetry

As presented in Table 1, cultivar and VPD had a significant effect on Salanova plant area (PA), leaves number (LN), fresh biomass (FB), dry biomass (DB), as main factors and in interaction. More specifically, red cultivar (R) presented higher values of all growth parameters (PA, FB, DB) enhanced by 10, 11, and 4%, with an exception made for LN. At the same time, 0.69 kPa increased all growth parameters (PA, LN, FB, FB) by 17, 12, 15, and 47%, always showing highest values in red cultivar (0.69 R), followed by 0.69 G, 1.76 R, and 1.76 G. Leaf colorimetry parameters were also influenced by C and VPD as main factors and by their interaction (C × VPD). In this case, b*, leaf brightness (L*) and Chroma were higher in G cultivar by 91, 54, and 23% and Hue in R cultivar (82%). Whereas, 0.69 kPa elicited increments in b* Chroma and Hue (41, 83 and 23%), while 1.76 kPa enhanced L* (32%). Concerning the interaction, the three colorimetry coordinates had a completely different trends among treatment, with increments in L* in 1.76 G followed by 0.69 G, 1.76 R, and 0.69 G. b* and chroma values incremented in 0.69 G followed by 1.76 G, 0.6 R, and 1.76 R; whereas Hue values increased in 0.69 R followed by 1.76 R and 0.69 G.

3.2. Morpho-Anatomical Analyses

As shown in Figure 1 the morpho-anatomical structure of the leaf lamina was not different among the four different combinations of cultivar and VPD. Cultivar and VPD alone showed no significant differences on Salanova lettuces morpho-anatomical parameters, with an exception made for LET where G cultivar showed an increment of 13% (Table 2). However, their interaction (C × VPD) elicited a significant difference in the upper and lower epidermis thickness (UET and LET). More specifically, UET was the highest in 0.69 G and the lowest in 1.76 G, while no significant differences were found in R cultivars between 0.69 and 1.76 kPa. Differently, LET was the highest in 0.69 R, followed by 0.69 G and was the lowest in 1.76 with no significant differences between G and R.

3.3. Mineral Composition

Results from ion chromatography are showed in Table 3. Mineral content varied among treatments. More specifically, red cultivar enhanced the content of NO3, Ca2+ and malate by 22, 24, and 50%, whereas green cultivar enhanced the content of K+, tartrate, and isocitrate by 20, 45, and 26%. No significant differences among cultivar were detected in the other minerals and organic acids. Differently 0.69 kPa enhanced the content of PO43−, Ca2+, malate and tartrate by 24, 19, 53, and 25%, whereas 1.76 kPa enhanced the content of NO3, SO42−, and K+ by 9, 47, and 46%. No significant differences between 0.69 and 1.76 kPa were found in the other minerals and organic acids. Concerning the interaction (C × VPD), no significant changes were found in Na2+, Malate and Citrate. Whereas, NO3, SO42−, and K+ followed the same trend with highest values in 1.76 G and no significant differences among the other treatments (0.69 G, 1.76R, 0.69 R). Furthermore, PO43− showed highest content under 0.69 both G and R, followed by 1.76 R and 1.76 G; Ca2+ content increased under 0.69 R, not showing any significant differences among other treatments; Mg2+ content increased under 0.69 R, followed by 1.76 G, 1.76 R, and 0.69 G; tartrate content was more elevated in 0.69 G, followed by 1.76 G, 1.76 R, and 0.69 R and isocitrate content presented highest values in G, with no significant differences between 0.69 and 1.76 kPa, followed by 1.76 R and 0.69 R.

3.4. Antioxidant Activities and Phytochemicals

Antioxidant activity and phytochemical content were influenced by C, VPD, and their interaction (Table 4). Cultivar had a significant effect on TAA, PH, and LAA, with increments in the red cultivar by 27, 12, and 40% compared to the green one; whereas VPD had a significant effect on TAA, PH, and HAA, with increments in the 1.76 kPa plants by 22, 47, and 8% compared to the low VPD condition. However, the interaction (C × VPD) was always significant. More specifically, TAA content resulted enhanced in 1.76 R followed by 1.76 G, 0.69 R, and 0.69 G. Differently, PH and LAA showed a common trend, with highest values in 1.76 R and 0.69 R; these values were significantly higher than those detected in 1.76 G which in turn showed significantly higher values than 0.69 G. HAA showed highest values once again in 1.76 R which was not significantly different from 0.69R; the latter showed intermediate values between 1.76R and 1.76G, while the lowest values were found in 0.69 G that was significantly different from all the other conditions.

3.5. Soil Plant Analysis Development Index and Chlorophyll a Fluorescence Emission

Results from SPAD and Fv/Fm are showed in Table 5, separated for data (12 and 23 DAT). At 12 and 23 DAT, C and VPD had a significant effect as main factors and in interaction on SPAD index, showing enhanced values in R cultivar (49, 47%) and under 0.69 kPa (17, 4%). Differently, at both 12 and 23 DAT, cultivar did not elicit significant differences in Fv/Fm, whereas VPD had a significant effect with enhanced values under 0.69 kPa (2, 5%). Concerning the interaction, at both 12 and 23 DAT, SPAD index showed higher values in R cultivar under 0.69 kPa, followed by 1.76 R and 1.76 G and 0.69 G, with no differences among them. Differently, Fv/Fm ratio presented significantly higher values in 0.69 kPa with no differences between cultivars, followed by 1.76 kPa, again with no differences between cultivars.

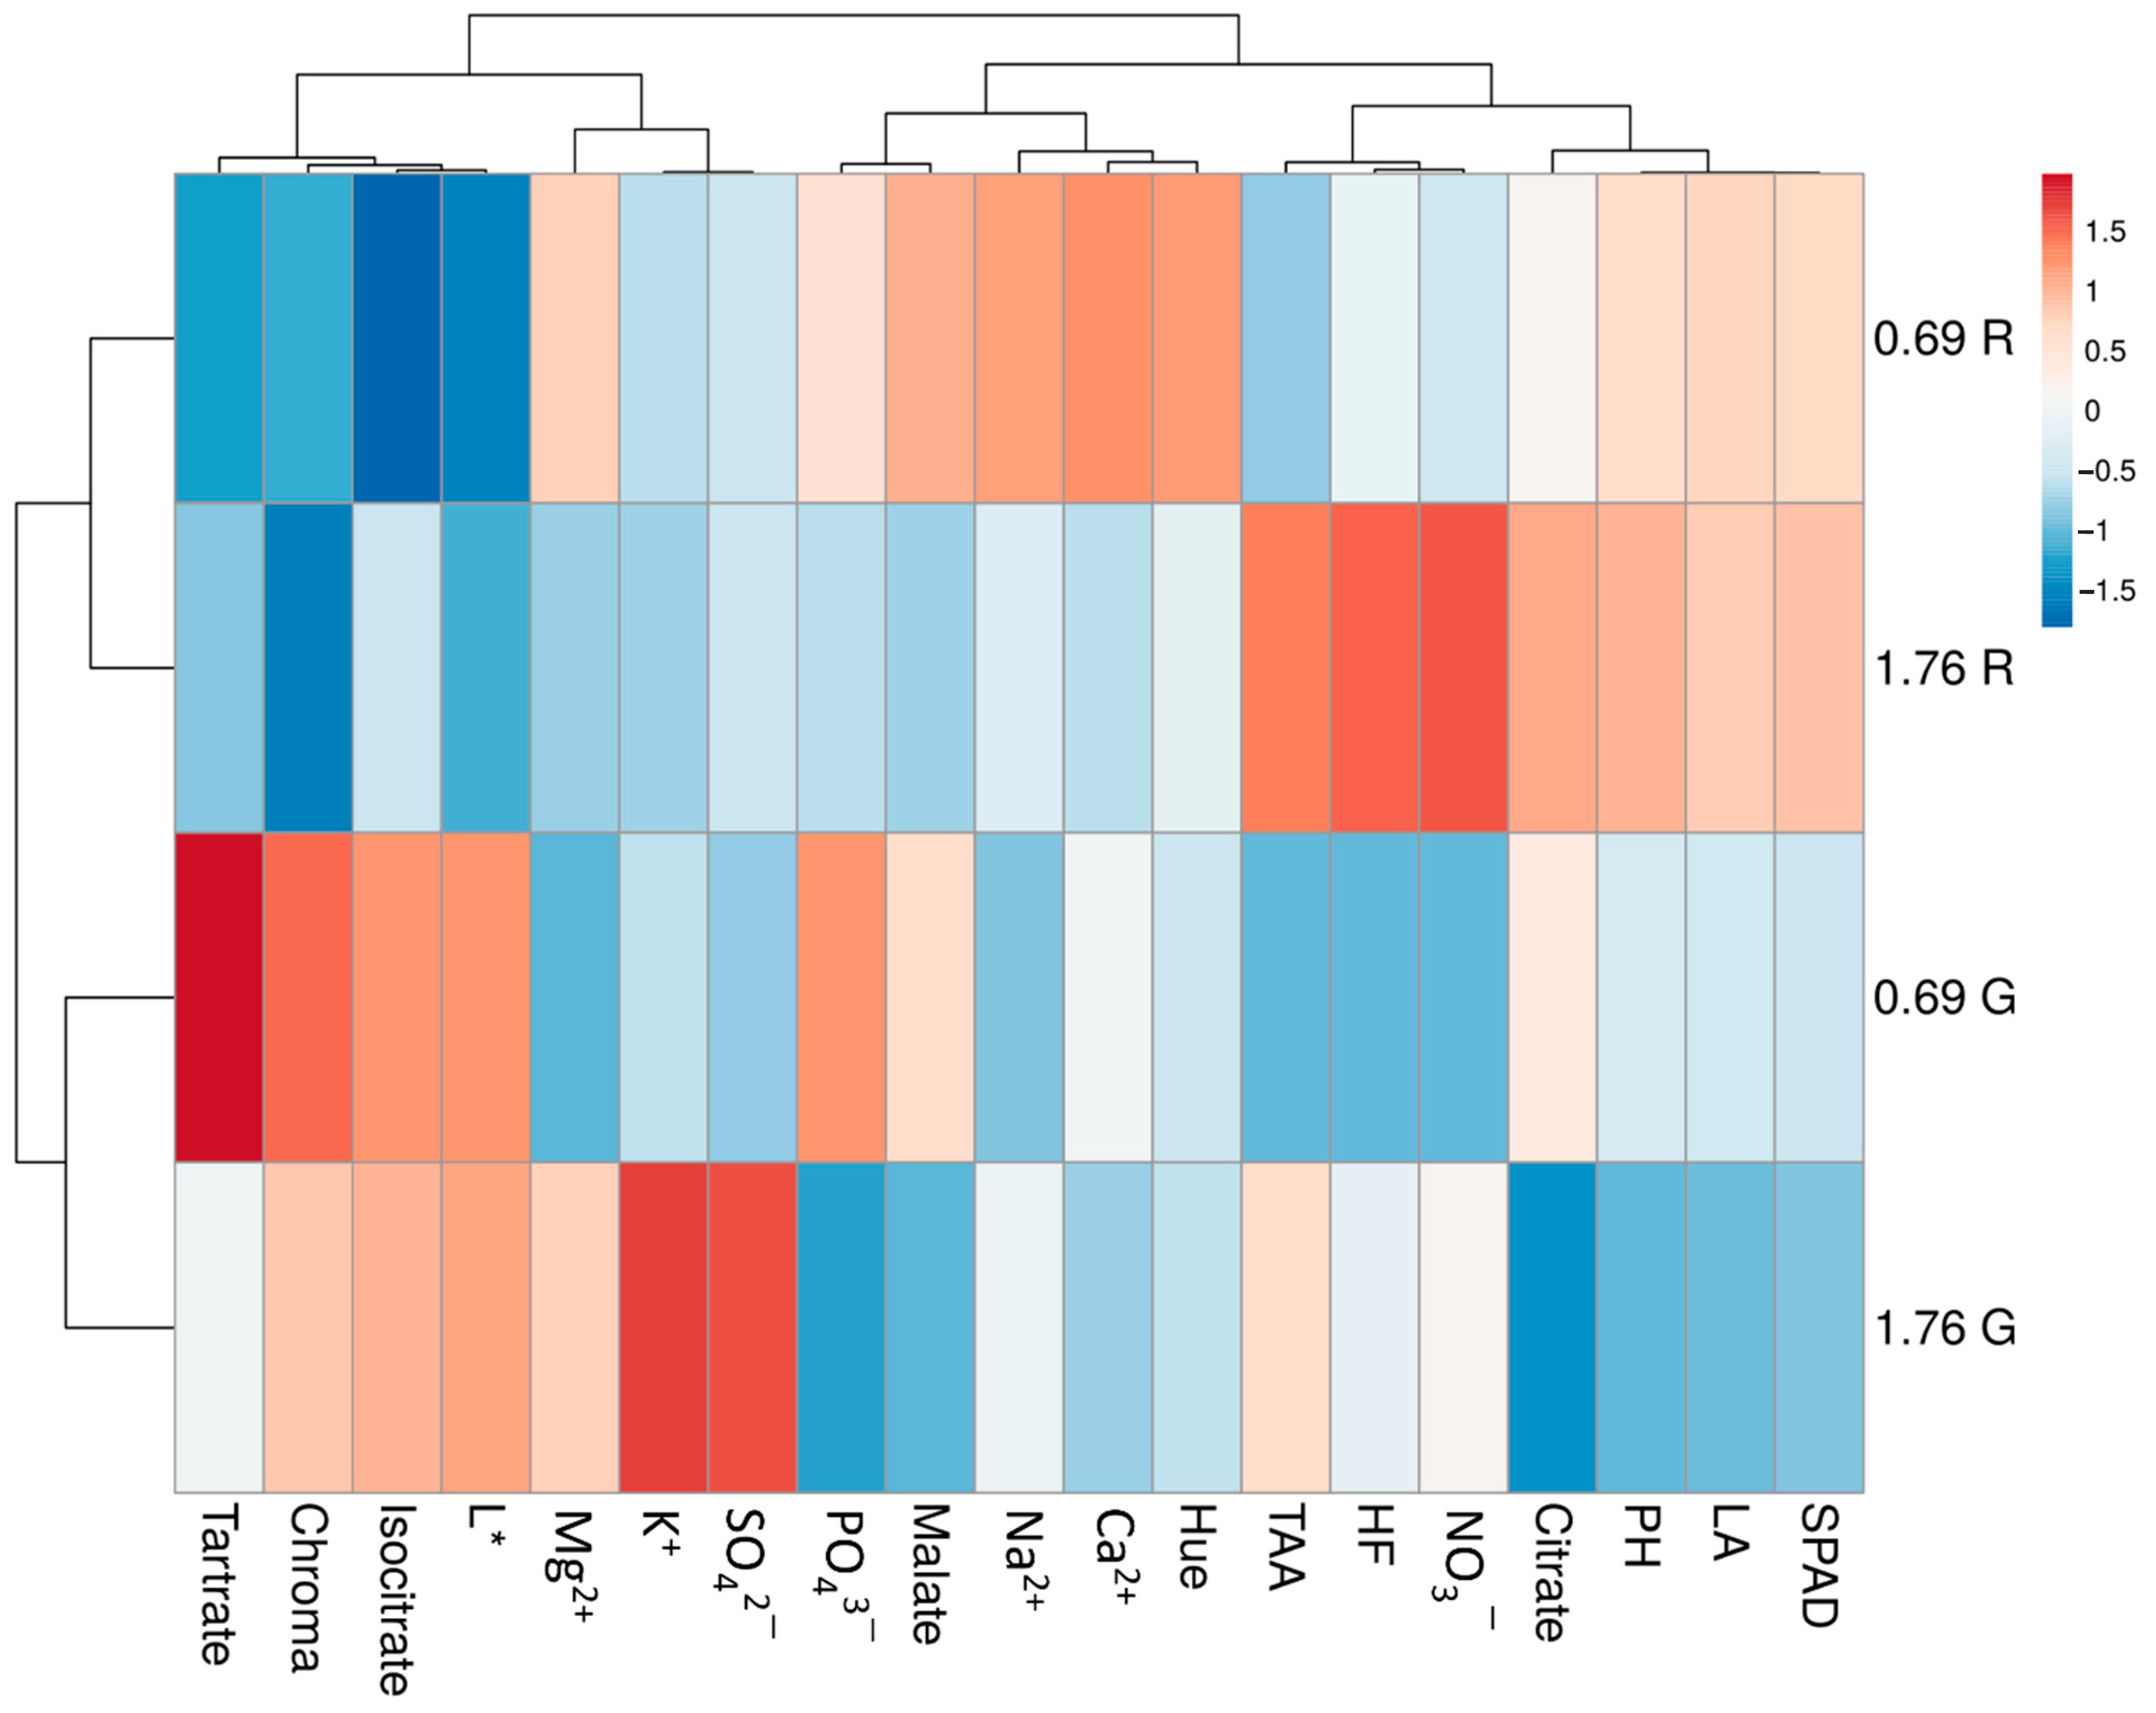
3.6. Hierarchical Clustering of Functional and Nutritional Aspects of Green and Red Salanova

A heat map providing an integrated overview of the effects of cultivar and VPD on the physiological and qualitative traits of Salanova lettuce is displayed in Figure 2. In the left dendrogram, the heat map identified two main clusters, separated by the different cultivar (0.69 G and 1.76 G on one cluster and 0.69 R and 1.76 R on the other); furthermore, as visible in the upper dendrogram also variables grouped together. More specifically, our results indicated that 0.69 R separated from the other treatments because of its highest positive relation with the cations content (Na2+, Ca2+), Hue and malate content, and negative relation with isocitrate content and L*. Whereas, 1.76 R separated from the other treatments mainly due to its antioxidant content, especially NO3, HF, TAA, and its negative relation with chroma. Differently, 0.69 G presented a higher positive variation of tartrate, isocitrate and the colorimetry parameter chroma. Finally, 1.76 G separated from the others because of its higher accumulation of SO42− and K+ and negative variation of citrate.

4. Discussion

Modulating the microclimate in indoor module-cultivation can positively affect crop morpho-physiological development, also leading to differences in appearance and in product quality, especially influencing the content of plant secondary metabolites [1,13,28]. In general, high VPD can limit plant growth and dry matter accumulation, reducing yield and photosynthesis, which are major constrains for crop production [29]. Our results are consistent with this general statement, always showing a lower biomass, number of leaves and canopy area in plants exposed to 1.76 kPa. Moreover, lettuce developed under a low-VPD environment (0.69 kPa), apart from increased growth and biomass, also presented a higher Fv/Fm and chlorophyll content (SPAD index) both at 12 and 23 DAS, overall suggesting a better performance of the photosynthetic apparatus. Indeed, a high content of photosynthetic pigments in plants is often associated with high Fv/Fm values [30] and even small increases in the photosynthetic rates are known to cause wide improvements in crop biomass and yield [31,32]. In low-VPD-exposed S. lycopersicum plants, a higher photosynthesis, mostly due to a better regulation of stomatal closure, and consequently high values of Fv/Fm, have been found in correlation with improved yield and biomass [29]. Fv/Fm values lower than 0.8, which is a threshold level for unstressed plants, are common in plants facing the onset of photodamage [33]. Indeed, the chlorophyll “a” fluorescence parameter Fv/Fm reflects the PSII (photosystem II) maximum quantum efficiency and consequently has been widely used as a screening for early stress detection in plants and for improvements in crop production in CEA [34,35]. For example, several researches found a decrease in Fv/Fm in different tomato [36] cultivars subjected to heat stress or a combination of heat and drought stresses [37]. In the present study, plants at 1.76 kPa always presented values lower than 0.8, suggesting that plants may sense the dry air, characteristic of high VPD as a mild-stress, similarly to what happens in conditions of heat stress or drought. However, microscopy observation in lettuce samples did not evidence VPD-induced differences in lamina thickness and intercellular spaces patterns. It is known that VPD levels can bring to a different morpho-anatomical development of leaf lamina, changing the whole mesophyll structure, thus changing the resistance/conductance to water vapor and CO2 within the leaf [38,39]. From these different morpho-anatomical characteristics depend the photosynthetic rates and the whole plant physiological behavior. Indeed, although some intra- and inter- species variation is observed, physiological responses cannot overcome plant morpho-anatomical structure [40]. In the present study, the reductions in Fv/Fm, photosynthetic pigments, yield, and biomass were not due to VPD-driven changes in morpho-anatomical structure of leaf lamina probably because the microclimate around the developing leaves under the two VPD treatments was not enough different to induce any differential cell differentiation leading to different mesophyll structure. Therefore, the observed reductions in growth and photosynthetic traits were likely linked with the oxidative stress which typically occurs under unfavorable environmental conditions and which can change crop quality [41].
Several authors have demonstrated that mild to moderate stress stresses could produce higher quality products, especially crop rich in phytochemicals, depending on: the type of stress (environmental, nutritional, etc.), the time of exposure, the intensity of application, as well as the crop species/cultivars [12]. For instance, Da Ge et al. [42], found in maize grains subjected to water stress, increments in Ca2+, Mg2+, Cu2+, and Zn2+. Additionally, El-Nakhel et al. [43] reported that mineral eustress (half strength nutrient solution) was able to boost the phenolic and carotenoids profile in butterhead Salanova in particular in the red-pigmented ones.
Minerals are essential elements in human diet, necessary as co-factors for several enzyme activities [44], and leafy greens are among the prime sources of these nutrients [45]. In our study, 1.76 kPa incremented the concentration of K+, which is involved as a carrier ion, transporting solutes and hormones in xylem and phloem, other than be involved in enzyme activation, osmotic potential, and synthesis of protein [46]. However, Salanova lettuces at high VPD also presented a high nitrate content, especially in red cultivar. Since leafy greens are usually harvested at vegetative growth stages, and the edible parts can accumulate relatively large amounts of nitrate, these crops have been found to be the major source of nitrate uptake by humans. In the present study, however, nitrate concentration in both Salanova cultivars, were inferior to the European Commission regulation No 1258/2011 [47] which set the NO3 content for protected-grown lettuce at 5000 mg NO3 kg−1 per fresh weight [48]. The lower concentration of nitrates has been associated with yellowish leaves characterized by a decreased hue angle and increased L*, b*, and chroma [49]. In our study, although presenting a higher content of nitrates, 1.76 VPD lettuces decreased b* and L* producing less dark leaves but with vivid colors (increased chroma). The analysis of color is an important consideration for edible food, since the most common property to measure quality of any material is its appearance and consumers can easily be influenced by a fruit or vegetable color which they consider inappropriate [50]. Furthermore, different research also reported similar relationships between total N/NO3 concentrations, chlorophyll content and chromaticity parameters (especially L*), so much to suggest the use of colorimeter reader or SPAD meter to predict the total content of chlorophyll and nitrate in a time-saving non-destructive analytical method [51]. Our results did not show such correlation with L*, however red cultivar presented an enhanced SPAD index as well as a highest nitrate content (Table 3 and Table 4), compared to green one. The highest chlorophyll concentration (SPAD index) of red lettuces might seem odd and could be explained by the highest content of nitrates in this cultivar.
Moreover, red lettuces also showed a highest content of phytochemicals, compared to green cultivar, especially under 1.76 VPD (Table 5). Many studies have demonstrated that red-pigmented-leafy-green-cultivars contained highest amounts of metabolites compared to their green counterparts [52]. Just to mention a few, El-Nakhel et al. [43] found in red Salanova lettuces higher quantities of phenolic compounds compared to green Salanova plants. Other studies also found an enhanced quantity of ascorbic acid in red-pigmented lettuce leaves [52,53]. Both phenolic compounds and ascorbic acid are potent antioxidants which confers valuable nutritional properties to vegetables [52,54].
Ascorbic acid, like other vitamins, cannot be synthesized by humans endogenously, so it represents an essential dietary component [55]; thus, ascorbic acid-rich-lettuces could represent an added value for the marketability of the products. It is interesting that increments in ascorbate, polyphenols, and antioxidant capacity were reported in lettuce grown under various types of stress. For instance, in lettuces subjected to moderate stress (heat shock, chilling, high light intensity), Oh et al. [56] found a two/three-fold increase in the total phenolic content and a significant increase in the antioxidant capacity, with no adverse effects on the general plant growth. In our study, lettuces exposed to high VPD always enhanced their phytochemical content, compared to those exposed to low VPD, probably sensing the surrounding environment as a mild stress not able to induce permanent structural changes neither cell shrinkage, but still enough to modulate chlorophyll content, Fv/Fm ratio and biomass which resulted reduced under the 1.76 kPa treatment. Levels of antioxidant molecules, such as ascorbate metabolites, phenolic compounds, and α-tocopherol, higher in high VPD, can indicate a defense against oxidative stress [41]. In this study, we examined the total amount of phenolic compounds in leaves; however, as a future perspective it would be valuable to focus on individual phenolic components to have a more comprehensive idea of plant phytochemical’s synthesis in response to VPD.
The most common effect of low humidity rates on crops is to induce leaf water stress, since under this environmental condition the uptake of water from the soil is not enough to cope with the high transpiration rates [6,57]. Indeed, when subjected to high VPD, plants begin to dehydrate and start to physically translocate a larger volume of soil water through the plant system, which can also exacerbate the stress if in interaction with other adverse environmental conditions like high EC rates, bringing to the accumulation of additional salts within the plant [58]. Still, the use of these mild-stress during cultivation techniques has proven to increase tomato fruit dry matter content [59], which is an important parameter in improving yield and nutritional quality [60] also increasing sugar content, the ratio of sugar:acids [61], and the synthesis of secondary metabolites and antioxidants [9,62]. There is evidence that many antioxidants play a key role in plant adaptation to abiotic and biotic stresses [56,63]. Additionally, a significant part of antioxidants produced by plants in response to stress is secondary metabolites, including some simple and complex phenolic compounds derived primarily via the phenylpropanoid pathway [64].
As a number of these are phytochemicals with health-promoting qualities in the human diet, in the light of the above results, it would be feasible to use VPD, among other mild environmental stresses, to enhance the phytochemical content of lettuce or other common leafy vegetable. To date there are no clear indications on how to use high VPD levels, in a sort of plant “hardening off”, to ameliorate the nutraceutical value of leafy greens. A next step could be to grow plants under optimal conditions and then subject them to short periods of high VPD to promptly increase their antioxidant levels, without reducing plant photosynthesis and consequently crop production.

Author Contributions

Conceptualization, C.A. and V.D.M.; methodology, C.A., Y.R. and V.D.M.; formal analysis, C.A.; investigation, C.A.; resources, Y.R., S.D.P., V.D.M.; data curation, C.A. and V.D.M.; writing—original draft preparation, C.A.; writing—review and editing, C.A., Y.R., S.D.P., V.D.M.; supervision, V.D.M.; funding acquisition, Y.R., S.D.P., V.D.M. All authors have read and agreed to the published version of the manuscript.

Funding

This research was conducted in the framework of the Ph.D. sponsored by the Italian Ministry of University and Research (PON research and innovation).

Institutional Review Board Statement

Not applicable.

Informed Consent Statement

Not applicable.

Data Availability Statement

Data available on request due to restrictions eg privacy or ethical. The data presented in this study are available on request from the corresponding author.

Acknowledgments

We wish to thank Carmen Arena and Chiara Cirillo for support in chlorophyll “a” fluorescence measurements and data analysis. We also wish to thank Antonio Pannico for technical support during the cultivation and Maria Giordano for technical support during qualitative analysis.

Conflicts of Interest

The authors declare no conflict of interest (financial or nonfinancial) for this research.

References

  1. Gruda, N. Impact of Environmental Factors on Product Quality of Greenhouse Vegetables for Fresh Consumption. Crit. Rev. Plant Sci. 2005, 24, 227–247. [Google Scholar] [CrossRef]
  2. Bakker, J. Physiological disorders in cucumber under high humidity conditions and low ventilation rates in greenhouses. ISHS Acta Hortic. 1984, 257–264. [Google Scholar] [CrossRef]
  3. Amitrano, C.; Arena, C.; Rouphael, Y.; De Pascale, S.; De Micco, V. Vapour pressure deficit: The hidden driver behind plant morphofunctional traits in controlled environments. Ann. Appl. Biol. 2019, 175, 313–325. [Google Scholar] [CrossRef]
  4. Krug, H. Gemuseproduktion: Ein Lehr-und Nachschlagewerk fur Studium und Praxis; Verlag Paul Parey: Singhofen, Germany, 1986. [Google Scholar]
  5. Collier, G.F. Tipburn of Littuce. In Horticultural Reviews; Wiley Blackwell: Hoboken, NJ, USA, 1982; Volume 4, pp. 49–65. [Google Scholar]
  6. Leonardi, C.; Guichard, S.; Bertin, N. High vapour pressure deficit influences growth, transpiration and quality of tomato fruits. Sci. Hortic. 2000, 84, 285–296. [Google Scholar] [CrossRef]
  7. Sinclair, T.R.; Devi, J.; Shekoofa, A.; Choudhary, S.; Sadok, W.; Vadez, V.; Riar, M.; Rufty, T. Limited-transpiration response to high vapor pressure deficit in crop species. Plant Sci. 2017, 260, 109–118. [Google Scholar] [CrossRef] [PubMed]
  8. Dorai, M.; Papadopoulos, A.; Gosselin, A. Influence of electric conductivity management on greenhouse tomato yield and fruit quality. Agronomie 2001, 21, 367–383. [Google Scholar] [CrossRef] [Green Version]
  9. Rosales, M.A.; Cervilla, L.M.; Sanchez-Rodriguez, E.; Rubio-Wilhelmi, M.M.; Blasco, B.; Rios, J.J.; Soriano, T.; Castilla, N.; Romero, L.; Ruiz, J.M. The effect of environmental conditions on nutritional quality of cherry tomato fruits: Evaluation of two experimental Mediterranean greenhouses. J. Sci. Food Agric. 2011, 91, 152–162. [Google Scholar] [CrossRef] [PubMed]
  10. Davey, M.W.; Montagu, M.V.; Inze, D.; Sanmartin, M.; Kanellis, A.; Smirnoff, N.; Benzie, I.J.J.; Strain, J.J.; Favell, D.; Fletcher, J. Plant L-ascorbic acid: Chemistry, function, metabolism, bioavailability and effects of processing. J. Sci. Food Agric. 2000, 80, 825–860. [Google Scholar] [CrossRef]
  11. Rosales, M.A.; Ruiz, J.M.; Hernández, J.; Soriano, T.; Castilla, N.; Romero, L. Antioxidant content and ascorbate metabolism in cherry tomato exocarp in relation to temperature and solar radiation. J. Sci. Food Agric. 2006, 86, 1545–1551. [Google Scholar] [CrossRef]
  12. Wang, Y.; Frei, M. Stressed food—The impact of abiotic environmental stresses on crop quality. Agric. Ecosyst. Environ. 2011, 141, 271–286. [Google Scholar] [CrossRef]
  13. Bisbis, M.B.; Gruda, N.; Blanke, M. Potential impacts of climate change on vegetable production and product quality—A review. J. Clean. Prod. 2018, 170, 1602–1620. [Google Scholar] [CrossRef]
  14. Favati, F.; Lovelli, S.; Galgano, F.; Miccolis, V.; Di Tommaso, T.; Candido, V. Processing tomato quality as affected by irrigation scheduling. Sci. Hortic. 2009, 122, 562–571. [Google Scholar] [CrossRef]
  15. Kyriacou, M.C.; Rouphael, Y. Towards a new definition of quality for fresh fruits and vegetables. Sci. Hortic. 2018, 234, 463–469. [Google Scholar] [CrossRef]
  16. Amitrano, C.; Arena, C.; De Pascale, S.; De Micco, V. Light and Low Relative Humidity Increase Antioxidants Content in Mung Bean (Vigna radiata L.) Sprouts. Plants 2020, 9, 1093. [Google Scholar] [CrossRef] [PubMed]
  17. Llorach, R.; Martinez-Sanchez, A.; Tomas-Barberan, F.A.; Gil, M.I.; Ferreres, F. Characterisation of polyphenols and antioxidant properties of five lettuce varieties and escarole. Food Chem. 2008, 108, 1028–1038. [Google Scholar] [CrossRef] [PubMed]
  18. El-Nakhel, C.; Pannico, A.; Graziani, G.; Kyriacou, M.C.; Giordano, M.; Ritieni, A.; De Pascale, S.; Rouphael, Y. Variation in Macronutrient Content, Phytochemical Constitution and In Vitro Antioxidant Capacity of Green and Red Butterhead Lettuce Dictated by Different Developmental Stages of Harvest Maturity. Antioxidants 2020, 9, 300. [Google Scholar] [CrossRef] [Green Version]
  19. Slavin, J.L.; Lloyd, B. Health benefits of fruits and vegetables. Adv. Nutr. 2012, 3, 506–516. [Google Scholar] [CrossRef] [Green Version]
  20. Gil, M.I. Preharvest factors and fresh-cut quality of leafy vegetables. Acta Hortic. 2016, 57–64. [Google Scholar] [CrossRef]
  21. Rouphael, Y.; Kyriacou, M.C.; Petropoulos, S.A.; De Pascale, S.; Colla, G. Improving vegetable quality in controlled environments. Sci. Hortic. 2018, 234, 275–289. [Google Scholar] [CrossRef]
  22. Feder, N.; O’Brien, T. Plant microtechnique: Some principles and new methods. Am. J. Bot. 1968, 55, 123–142. [Google Scholar] [CrossRef]
  23. De Micco, V.; Amitrano, C.; Stinca, A.; Izzo, L.G.; Zalloni, E.; Balzano, A.; Barile, R.; Conti, P.; Arena, C. Dust accumulation due to anthropogenic impact induces anatomical and photochemical changes in leaves of Centranthus ruber growing on the slope of the Vesuvius volcano. Plant Biol. 2019, 22, 93–102. [Google Scholar] [CrossRef]
  24. Kampfenkel, K.; Van Montagu, M.; Inzé, D. Effects of iron excess on Nicotiana plumbaginifolia plants (implications to oxidative stress). Plant Physiol. 1995, 107, 725–735. [Google Scholar] [CrossRef] [PubMed] [Green Version]
  25. Singleton, V.L.; Orthofer, R.; Lamuela-Raventós, R.M. Analysis of total phenols and other oxidation substrates and antioxidants by means of folin-ciocalteu reagent. Methods Enzymol. 1999, 299, 152–178. [Google Scholar]
  26. Fogliano, V.; Verde, V.; Randazzo, G.; Ritieni, A. Method for measuring antioxidant activity and its application to monitoring the antioxidant capacity of wines. J. Agric. Food Chem. 1999, 47, 1035–1040. [Google Scholar] [CrossRef]
  27. Re, R.; Pellegrini, N.; Proteggente, A.; Pannala, A.; Yang, M.; Rice-Evans, C. Antioxidant activity applying an improved ABTS radical cation decolorization assay. Free Radic. Biol. Med. 1999, 26, 1231–1237. [Google Scholar] [CrossRef]
  28. Gruda, N. Do soilless culture systems have an influence on product quality of vegetables? J. Appl. Bot. Food Qual. 2009, 82, 141–147. [Google Scholar]
  29. Zhang, D.; Du, Q.; Zhang, Z.; Jiao, X.; Song, X.; Li, J. Vapour pressure deficit control in relation to water transport and water productivity in greenhouse tomato production during summer. Sci. Rep. 2017, 7, 43461. [Google Scholar] [CrossRef]
  30. Carillo, P.; Cirillo, C.; De Micco, V.; Arena, C.; De Pascale, S.; Rouphael, Y. Morpho-anatomical, physiological and biochemical adaptive responses to saline water of Bougainvillea spectabilis Willd. trained to different canopy shapes. Agric. Water Manag. 2019, 212, 12–22. [Google Scholar] [CrossRef]
  31. Parry, M.A.; Reynolds, M.; Salvucci, M.E.; Raines, C.; Andralojc, P.J.; Zhu, X.-G.; Price, G.D.; Condon, A.G.; Furbank, R.T. Raising yield potential of wheat. II. Increasing photosynthetic capacity and efficiency. J. Exp. Bot. 2011, 62, 453–467. [Google Scholar] [CrossRef]
  32. Zhu, X.-G.; Long, S.P.; Ort, D.R. Improving photosynthetic efficiency for greater yield. Annu. Rev. Plant Biol. 2010, 61, 235–261. [Google Scholar] [CrossRef] [Green Version]
  33. Ogaya, R.; Peñuelas, J.; Asensio, D.; Llusià, J. Chlorophyll fluorescence responses to temperature and water availability in two co-dominant Mediterranean shrub and tree species in a long-term field experiment simulating climate change. Environ. Exp. Bot. 2011, 71, 123–127. [Google Scholar] [CrossRef]
  34. Sharma, D.K.; Andersen, S.B.; Ottosen, C.O.; Rosenqvist, E. Wheat cultivars selected for high Fv/Fm under heat stress maintain high photosynthesis, total chlorophyll, stomatal conductance, transpiration and dry matter. Physiol. Plant. 2015, 153, 284–298. [Google Scholar] [CrossRef]
  35. Baker, N.R.; Rosenqvist, E. Applications of chlorophyll fluorescence can improve crop production strategies: An examination of future possibilities. J. Exp. Bot. 2004, 55, 1607–1621. [Google Scholar] [CrossRef] [PubMed] [Green Version]
  36. Poudyal, D.; Rosenqvist, E.; Ottosen, C.-O. Phenotyping from lab to field—Tomato lines screened for heat stress using Fv/Fm maintain high fruit yield during thermal stress in the field. Funct. Plant Biol. 2019, 46, 44–55. [Google Scholar] [CrossRef]
  37. Nankishore, A.; Farrell, A.D. The response of contrasting tomato genotypes to combined heat and drought stress. J. Plant Physiol. 2016, 202, 75–82. [Google Scholar] [CrossRef] [PubMed]
  38. Du, Q.; Liu, T.; Jiao, X.; Song, X.; Zhang, J.; Li, J. Leaf anatomical adaptations have central roles in photosynthetic acclimation to humidity. J. Exp. Bot. 2019, 70, 4949–4962. [Google Scholar] [CrossRef]
  39. Tosens, T.; Niinemets, U.; Vislap, V.; Eichelmann, H.; Diez, P.C. Developmental changes in mesophyll diffusion conductance and photosynthetic capacity under different light and water availabilities in Populus tremula: How structure constrains function. Plant Cell Env. 2012, 35, 839–856. [Google Scholar] [CrossRef]
  40. Murphy, M.R.C.; Jordan, G.J.; Brodribb, T.J. Acclimation to humidity modifies the link between leaf size and the density of veins and stomata. Plant Cell Environ. 2014, 37, 124–131. [Google Scholar] [CrossRef] [Green Version]
  41. Lihavainen, J.; Keinänen, M.; Keski-Saari, S.; Kontunen-Soppela, S.; Sõber, A.; Oksanen, E. Artificially decreased vapour pressure deficit in field conditions modifies foliar metabolite profiles in birch and aspen. J. Exp. Bot. 2016, 67, 4367–4378. [Google Scholar] [CrossRef] [PubMed] [Green Version]
  42. Da Ge, T.; Sui, F.G.; Nie, S.; Sun, N.B.; Xiao, H.; Tong, C.L. Differential responses of yield and selected nutritional compositions to drought stress in summer maize grains. J. Plant Nutr. 2010, 33, 1811–1818. [Google Scholar] [CrossRef]
  43. El-Nakhel, C.; Giordano, M.; Pannico, A.; Carillo, P.; Fusco, G.M.; De Pascale, S.; Rouphael, Y. Cultivar-specific performance and qualitative descriptors for butterhead Salanova lettuce produced in closed soilless cultivation as a candidate salad crop for human life support in space. Life 2019, 9, 61. [Google Scholar] [CrossRef] [Green Version]
  44. Soetan, K.; Olaiya, C.; Oyewole, O. The importance of mineral elements for humans, domestic animals and plants—A review. Afr. J. Food Sci. 2010, 4, 200–222. [Google Scholar]
  45. Gupta, K.; Wagle, D. Nutritional and antinutritional factors of green leafy vegetables. J. Agric. Food Chem. 1988, 36, 472–474. [Google Scholar] [CrossRef]
  46. Peuke, A.D.; Jeschke, W.D.; Hartung, W. Flows of elements, ions and abscisic acid in Ricinus communis and site of nitrate reduction under potassium limitation. J. Exp. Bot. 2002, 53, 241–250. [Google Scholar] [CrossRef] [PubMed] [Green Version]
  47. Statement on possible public health risks for infants and young children from the presence of nitrates in leafy vegetables. EFSA J. 2010, 8, 1935. [CrossRef] [Green Version]
  48. Colla, G.; Kim, H.-J.; Kyriacou, M.C.; Rouphael, Y. Nitrate in fruits and vegetables. Sci. Hortic. 2018, 237, 221–238. [Google Scholar] [CrossRef]
  49. Navarro, A.; Elia, A.; Conversa, G.; Campi, P.; Mastrorilli, M. Potted mycorrhizal carnation plants and saline stress: Growth, quality and nutritional plant responses. Sci. Hortic. 2012, 140, 131–139. [Google Scholar] [CrossRef]
  50. Jha, S.N. Colour Measurements and Modeling. In Nondestructive Evaluation of Food Quality; Springer: Berlin/Heidelberg, Germany, 2010; pp. 17–40. [Google Scholar]
  51. Tuncay, O. Relationships between nitrate, chlorophyll and chromaticity values in rocket salad and parsley. Afr. J. Biotechnol. 2011, 10, 17152–17159. [Google Scholar]
  52. Kim, D.E.; Shang, X.; Assefa, A.D.; Keum, Y.S.; Saini, R.K. Metabolite profiling of green, green/red, and red lettuce cultivars: Variation in health beneficial compounds and antioxidant potential. Food Res. Int. 2018, 105, 361–370. [Google Scholar] [CrossRef]
  53. Baslam, M.; Morales, F.; Garmendia, I.; Goicoechea, N. Nutritional quality of outer and inner leaves of green and red pigmented lettuces (Lactuca sativa L.) consumed as salads. Sci. Hortic. 2013, 151, 103–111. [Google Scholar] [CrossRef]
  54. El-Nakhel, C.; Petropoulos, S.A.; Pannico, A.; Kyriacou, M.C.; Giordano, M.; Colla, G.; Troise, A.D.; Vitaglione, P.; De Pascale, S.; Rouphael, Y. The bioactive profile of lettuce produced in a closed soilless system as configured by combinatorial effects of genotype and macrocation supply composition. Food Chem. 2020, 309, 125713. [Google Scholar] [CrossRef] [PubMed]
  55. Li, Y.; Schellhorn, H.E. New developments and novel therapeutic perspectives for vitamin C. J. Nutr. 2007, 137, 2171–2184. [Google Scholar] [CrossRef] [Green Version]
  56. Oh, M.M.; Carey, E.E.; Rajashekar, C.B. Environmental stresses induce health-promoting phytochemicals in lettuce. Plant Physiol. Biochem. 2009, 47, 578–583. [Google Scholar] [CrossRef]
  57. Grange, R.; Hand, D. A review of the effects of atmospheric humidity on the growth of horticultural crops. J. Hortic. Sci. 1987, 62, 125–134. [Google Scholar] [CrossRef]
  58. Tack, J.; Singh, R.K.; Nalley, L.L.; Viraktamath, B.C.; Krishnamurthy, S.L.; Lyman, N.; Jagadish, K.S. High vapor pressure deficit drives salt-stress-induced rice yield losses in India. Glob. Chang. Biol. 2015, 21, 1668–1678. [Google Scholar] [CrossRef] [PubMed]
  59. Ho, L.; Grange, R.; Picken, A. An analysis of the accumulation of water and dry matter in tomato fruit. Plant Cell Environ. 1987, 10, 157–162. [Google Scholar]
  60. Boyer, J.S. Plant productivity and environment. Science 1982, 218, 443–448. [Google Scholar] [CrossRef]
  61. Bertin, N.; Guichard, S.; Leonardi, C.; Longuenesse, J.; Langlois, D.; Navez, B. Seasonal evolution of the quality of fresh glasshouse tomatoes under Mediterranean conditions, as affected by air vapour pressure deficit and plant fruit load. Ann. Bot. 2000, 85, 741–750. [Google Scholar] [CrossRef]
  62. Rosales, M.A.; Ríos, J.J.; Cervilla, L.M.; Rubio-Wilhelmi, M.M.; Blasco, B.; Ruiz, J.M.; Romero, L. Environmental conditions in relation to stress in cherry tomato fruits in two experimental Mediterranean greenhouses. J. Sci. Food Agric. 2009, 89, 735–742. [Google Scholar] [CrossRef]
  63. Burritt, D.J.; Mackenzie, S. Antioxidant metabolism during acclimation of Begonia × erythrophylla to high light levels. Ann. Bot. 2003, 91, 783–794. [Google Scholar] [CrossRef] [Green Version]
  64. Dixon, R.A.; Paiva, N.L. Stress-Induced Phenylpropanoid Metabolism. Plant Cell 1995, 7, 1085. [Google Scholar] [CrossRef] [PubMed]
Figure 1. Light microscopy views of cross-sections of green (a,b) and red (c,d) leaf lamina of lettuces grown under the two VPD levels 1.76 (a,c) and 0.69 (b,d). Bar = 100 µm.
Horticulturae 07 00032 g001
Figure 2. Heat map of qualitative and physiological aspects of green (G) and red (R) lettuce plants grown under the two VPD levels (0.69 and 1.76 kPa).
Horticulturae 07 00032 g002
Table 1. Growth analyses consisting of plant area (PA), leaf number (LN), fresh biomass (FB), dry Biomass (DB), and leaf colorimetry coordinates (L*, Chroma and Hue angle) in green (G) and red (R) lettuce plants grown under the two Vapor Pressure Deficit (VPD) levels (0.69 and 1.76 kPa).
PA
(cm2 Plant−1)
LN
(No. Plant−1)
FB
(g Plant−1)
DB
(g Plant−1)
b *L *ChromaHue
Cultivar
G196 ± 1.02 b51.9 ± 0.72 a33.2 ± 0.50 b3.60 ± 0.03 a40.3 ± 1.21a49.4 ± 0.46 a28.1 ± 0.44 a107 ± 4.46 b
R214 ± 0.37 a49.3 ± 0.81 b36.8 ± 0.29 a3.75 ± 0.02 a3.62 ± 0.78 b22.7 ± 0.47 b21.5 ± 0.45 b195 ± 3.34 a
VPD
0.69 kPa224 ± 1.01 a53.9 ± 0.76 a37.9 ± 0.48 a4.80 ± 0.06 a28.8 ± 1.16 a34.0 ± 0.33 b42.3 ± 0.62 a171 ± 3.15 a
1.76 kPa186 ± 0.33 b47.3 ± 0.77 b32.1 ± 0.31 b2.55 ± 0.03 b17.1 ± 0.88 b38.1 ± 0.34 a7.24 ± 0.66 b132 ± 2.02 b
Int.
0.69 G211 ± 0.17 b53.4 ± 0.24 a35.6 ± 0.17 b4.75 ± 0.02 a44.5 ± 0.81 a48.5 ± 0.42 b46.2 ± 0.74 a106 ± 0.44 c
0.69 R237 ± 0.03 a54.4 ± 0.40 a40.4 ± 0.22 a4.85 ± 0.03 a9.25 ± 0.80 c19.5 ± 0.31 d9.84 ± 0.73 c236 ± 0.88 a
1.76 G180 ± 0.20 d50.4 ± 0.25 b30.8± 0.23 d2.46 ± 0.01 b36.2 ± 0.70 b50.3 ± 0.77 a38.3 ± 0.68 b109 ± 0.28 c
1.76 R192 ± 0.21 c44.2 ± 0.49 c33.4 ± 0.07 c2.66 ± 0.01 b-2.00 ± 0.16 d25.9 ± 0.13 c4.60 ± 0.11 d154 ± 2.18 b
Sig.
C*******NS************
VPD***********************
C × VPD********************
All data are expressed as mean ± standard error. ***, **, *, NS refer to p ≤ 0.001, 0.01, 0.05 and Non-significant, respectively. Lower case letters indicate the significant differences of the interaction.
Table 2. Morpho-anatomical analyses consisting of upper epidermis thickness (UET), lower epidermis thickness (LET), palisade thickness (PT), spongy thickness (ST), lamina thickness (LT) and percentage of intercellular spaces (IS) in green (G) and red (R) lettuce plants grown under the two VPD levels (0.69 and 1.76 kPa).
UET
(µm)
LET
(µm)
PT
(µm)
ST
(µm)
LT
(µm)
IS
(%)
Cultivar
G23.4 ± 0.66 a16.7 ± 1.03 a97.3 ± 4.69 a148 ± 6.29 a287 ± 8.86 a46.2 ± 2.87 a
R22.4 ± 1.05 a14.8 ± 0.65 b94.2 ± 3.71 a149 ± 11.8 a282 ± 11.3 a45.3 ± 2.05 a
VPD
0.69 kPa22.9 ± 0.64 a15.4 ± 0.79 a95.5 ± 5.06 a146 ± 7.57 a281 ± 8.76 a45.6 ± 1.89 a
1.76 kPa22.8 ± 1.11 a16.1 ± 0.74 a95.9 ± 5.31 a151 ± 9.15 a287 ± 13.4 a46.8 ± 2.50 a
Int.
0.69 G24.2 ± 0.63 a16.2 ± 0.79 ab94.5 ± 3.10 a144 ± 3.56 a280 ± 4.85 a44.2 ± 1.96 a
0.69 R22.7 ± 0.64 ab17.2 ± 0.79 a99.8 ± 3.93 a152 ± 8.02 a293 ± 11.73 a44.9 ± 1.33 a
1.76 G21.7 ± 0.70 b14.6 ± 0.48 b96.5 ± 3.19 a147 ± 5.47 a281 ± 8.02 a48.1 ± 1.83 a
1.76 R23.1 ± 0.82 ab15.1 ± 0.52 b92.1 ± 4.24 a151 ± 7.56 a282 ± 10.82 a45.6 ± 1.35 a
Sig.
CNS*NSNSNSNS
VPDNSNSNSNSNSNS
C × VPD**NSNSNSNS
All data are expressed as mean ± standard error. ***, **, *, NS refer to p ≤ 0.001, 0.01, 0.05, and Non-significant, respectively. Lower case letters indicate the significant differences of the interaction.
Table 3. Minerals in leaves of green (G) and red (R) lettuce plants grown under the two VPD levels (0.69 and 1.76 kPa).
NO3
(mg/kg FW)
PO43−
(g/kg DW)
SO42−
(g/kg DW)
K+
(g/kg DW)
Ca2+
(g/kg DW)
Mg2+
(g/kg DW)
Na2+
(g/kg DW)
Malate
(g/kg DW)
Tartrate
(g/kg DW)
Citrate
(g/kg DW)
Isocitrate
(g/kg DW)
Cultivar
G4013 ± 711 b6.92 ± 0.73 a2.01 ± 0.25 a58.2 ± 2.36 a14.7 ± 0.86 b3.46 ± 0.74 a3.36 ± 0.40 a56.5 ± 4.82 b3.64 ± 0.28 a12.2 ± 1.86 a0.23 ± 0.03 a
R4911 ± 625 a7.44 ± 0.67a1.78 ± 0.29 a46.6 ± 5.54 b18.3 ± 2.44 a3.74 ± 0.64 a4.11 ± 0.98 a84.8 ± 8.60 a1.98 ± 0.25 b14.5 ± 1.31 a0.17 ± 0.03 b
VPD
0.69 kPa4513 ± 746 b8.19 ± 0.36 a1.53 ± 0.21b42.6 ± 1.56 b18.3 ± 1.15 a3.56 ± 0.76 a3.80 ± 0.56 a92.6 ± 8.19 a3.21 ± 0.26 a13.7 ± 1.41 a0.18 ± 0.03 a
1.76 kPa4911 ± 553 a6. 24 ±1.39 b2.25 ± 0.37a62.2 ± 7.15 a14.7 ± 1.87 b3.64 ± 0.59 a3.65 ± 0.66 a43.3 ± 1.86 b2.41 ± 0.28 b12.9 ± 2.45 a0.21 ± 0.03 a
Int.
0.69 G3246 ± 556 d8.18 ± 0.27 a1.26 ± 0.13 b37.5 ± 0.48 b15.6 ± 0.27 b3.04 ± 0.64 c3.09 ± 0.24 a76.5 ± 4.28 b4.65 ± 0.22 a13.4 ± 0.74 a0.23 ± 0.02 a
0.69 R3980 ± 380 c8.21 ± 0.19 a1.80 ± 0.15 b47.7 ± 2.16 b21.1 ± 1.76 a4.08 ± 0.25 a4.52 ± 0.64 a108.6 ± 7.83 a1.77 ± 0.08 c14.2 ± 1.34 a0.15 ± 0.01 b
1.76 G4080 ± 310 b5.65 ± 0.91 b2.75 ± 0.23 a78.9 ± 3.77 a13.9 ± 1.19 b3.87 ± 0.21 ab3.62 ± 0.32 a31.5 ± 1.09 c2.62 ± 0.12 b10.9 ± 1.49 a0.23 ± 0.01 a
1.76 R4942 ± 490 a6.84 ± 0.96 ab1.75 ± 0.28 b45.5 ± 6.77 b15.6 ± 1.36 b3.41 ± 0.77 bc3.69 ± 0.68 a55.1 ± 1.54 b2.19 ± 0.33 bc14.9 ± 1.93 a0.19 ± 0.03 ab
Sig.
C***NSNS**NSNS*****NS*
VPD********NSNS*****NSNS
C × VPD************NSNS***NS*
All data are expressed as mean ± standard error. ***, **, *, NS refer to p ≤ 0.001, 0.01, 0.05 and Non-significant, respectively. Lower case letters indicate the significant differences of the interaction.
Table 4. Total Ascorbic Acid (TAA), Phenols (PH), Hydrophilic antioxidant activity (HAA) and lipophilic antioxidant activity (LAA) in leaves of green (G) and red (R) lettuce plants grown under the two VPD levels (0.69 and 1.76 kPa).
TAA
mg100 g−1 FW
PH
mg GA eq. 100 g−1 DW
HAA
mmol AA eq. 100 g−1 DW
LAA
mmol trolox eq. 100 g−1 DW
Cultivar
G76.6 ± 5.22 b9.21 ± 0.24 b14.9 ± 0.52 a30.2 ± 1.73 b
R97.7 ± 3.74 a10.3 ± 0.48 a16.6 ± 0.36 a42.3 ± 0.70 a
VPD
0.69 kPa63.7 ± 3.65 b8.08 ± 0.21 b10.3 ± 0.57 b36.1 ± 1.20 a
1.76 kPa111 ± 6.86 a11.9 ± 0.54 a11.2 ± 0.25 a36.5 ± 1.77 a
Int.
0.69 G52.5 ± 2.93 d5.83 ± 0.14 c9.71 ± 0.41 c28.9 ± 1.01 c
0.69 R75.1 ± 1.44 c10.3 ± 0.13 a10.8 ± 0.32 ab43.3 ± 0.38 a
1.76 G101 ± 4.57 b6.77 ± 0.19 b10.4 ± 0.21 b31.5 ± 1.45 b
1.76 R120 ± 4.59 a10.3 ± 0.71 a11.6 ± 0.09 a41.4 ± 0.64 a
Sig.
C*****NS***
VPD******
C × VPD****
All data are expressed as mean ± standard error. ***, **, *, NS refer to p ≤ 0.001, 0.01, 0.05 and Non-significant, respectively. Lower case letters indicate the significant differences of the interaction.
Table 5. Soil Plant Analysis Development (SPAD) index and Fv/Fm in leaves of green (G) and red (R) lettuce plants grown under the two VPD levels (0.69 and 1.76 kPa) at 12 and 23 DAT (days after transplanting).
SPAD IndexFv/Fm
12 DAT23 DAT12 DAT23 DAT
Cultivar
G28.07 ± 0.74 b27.9 ± 1.46 b0.77 ± 0.10 a0.80 ± 0.07a
R41.85 ± 0.91 a41.1 ± 1.17 a0.77 ± 0.30 a0.80 ± 0.12a
VPD
0.69 kPa36.70 ± 0.85 a35.2 ± 1.00 a0.78 ± 0.11 a0.82 ± 0.12a
1.76 kPa30.51 ± 0.69 b33.8 ± 1.63 b0.76 ± 0.20 b0.78 ± 0.13b
Int.
0.69 G28.5 ± 0.57 c28.5 ± 0.54 c0.79 ± 0.06 a0.82 ± 0.02 a
0.69 R44.9 ± 0.57 a41.8 ± 0.46 a0.78 ± 0.06 a0.82 ± 0.01 a
1.76 G27.6 ± 0.35 c27.3 ± 0.92 c0.75 ± 0.13 b0.79 ± 0.06 b
1.76 R38.2 ± 0.69 b33.4 ± 0.71 b0.77 ± 0.07 ab0.78 ± 0.07 b
Sig.
C****NSNS
VPD**********
C × VPD******
All data are expressed as mean ± standard error. ***, **, *, NS refer to p ≤ 0.001, 0.01, 0.05 and Non-significant, respectively. Lower case letters indicate the significant differences of the interaction.
Publisher’s Note: MDPI stays neutral with regard to jurisdictional claims in published maps and institutional affiliations.

