
Leaf Photosynthesis and Carbon Metabolism Adapt to Crop Load in ‘Gala’ Apple Trees


1
Section of Horticulture, School of Integrative Plant Science, Cornell University, Ithaca, NY 14850, USA
2
College of Resources and Environment, Fujian Agriculture and Forestry University, Fuzhou 350002, China
*
Author to whom correspondence should be addressed.
Horticulturae 2021, 7(3), 47; https://0-doi-org.brum.beds.ac.uk/10.3390/horticulturae7030047
Submission received: 9 February 2021
/
Revised: 26 February 2021
/
Accepted: 27 February 2021
/
Published: 10 March 2021
(This article belongs to the Section Developmental Physiology, Biochemistry, and Molecular Biology)
Abstract
:It is widely accepted that a tight coordination between carbon (C) utilization in the sink and C assimilation and metabolism in the source exists in higher plants. However, much of our current understanding is based on research from herbaceous plants, where the source and sink interaction is less sophisticated compared to woody perennials with a significant sink presence. Apple (Malus x domestica Borkh.) is a good representative of the latter category, and its production and transport of sorbitol, in addition to sucrose, adds complexity to C regulation. In this study, four-year-old “Gala”/”M.26” apple trees were subjected to crop load levels at 2.5, 7.5, and 15 fruits/cm2 trunk cross-sectional area. Low crop load trees exhibited reduced leaf C assimilation and extra accumulation of non-structural carbohydrates (NSC). This was primarily a result of reduced activity of Rubisco and increased activities of key enzymes that synthesize starch, sucrose, and sorbitol. Among the NSC, leaf starch was found to be most sensitive to crop load and could function as a leading indicator for source–sink balance in apple. However, even the high crop load trees still retained a significant amount of NSC in leaves at dawn, demonstrating that apple is fundamentally different from herbaceous plants in the way it balances leaf carbon inventories at dawn with carbon export at night for sink growth.
1. Introduction
Carbon (C) assimilation and metabolism fuel plant growth and development. In terms of the source–sink relationship, it is widely accepted that a tight coordination between C utilization in the sink and C assimilation and metabolism in the source exists in higher plants [1,2,3,4,5,6,7,8,9,10,11,12]. However, much of our current understanding is based on research conducted on model plant Arabidopsis [13,14,15] and herbaceous crop plants such as rice [10,12] and tomato [16,17,18]. For Arabidopsis, the source and sink interaction is less sophisticated compared to plants that invest significant C resource to sink tissues [19]. Even for herbaceous plants with a significant sink presence, their source and sink interaction could also be vastly different from woody plants [2]. Therefore, more work on woody plant species is needed to provide a full picture of how carbon metabolism is regulated in higher plants [12,20,21].
Many economically important tree fruits in Rosaceae have a significant sink presence. Apple (Malus x domestica Borkh) is a good representative, as it often allocates over 70% of its annual dry matter gain to fruits [22,23]. The regulation of C metabolism in apple has yet another layer of complexity. In most plants, sucrose is the major transported C from source to sink. In apple, like many other tree fruits in Rosacea, sorbitol is synthesized in addition to sucrose in source leaves, and both sorbitol and sucrose are transported to sink tissues to fuel growth and development [24]. This dual-C transport system makes the regulation of C metabolism in apple more complex and interesting.
Crop load manipulation has long been used to alter source–sink relationship to improve fruit quality and mitigate biennial bearing in fruit crops. However, the results have been inconsistent regarding how crop load affects C assimilation and metabolism in leaves. While crop load was found to positively influence photosynthetic rate by most [25,26,27,28,29,30,31,32,33,34,35,36,37,38,39,40,41], it was also reported to have no effect [42,43,44] or negative effects [43,45,46] by others. Little research has examined how crop load affects the activities of key enzymes involved in photosynthesis [25,36,38,45,47], and it is unclear whether crop load largely affects leaf photosynthesis via its long-term effect on the activities of these enzymes. There is also no consensus regarding how low crop load affects non-structural carbohydrates (NSC) accumulation in leaves [25,30,33,34,37,40,41,42,47,48], an aspect proven to be important in source and sink communication [2,5,7,9,10,12,49,50].
In this study, four-year-old “Gala/M.26” apple trees were subjected to three crop load levels. To further understand how altered sink capacity in woody perennial plants affects C assimilation and metabolism in the source, metabolic analysis was conducted in mature leaves at different times of the day during rapid fruit expansion. We examined photosynthetic rate, activities of key enzymes involved, and concentrations of key metabolic end products and intermediates. We found that in apple sink activity regulates C assimilation and metabolism via its long-term effect on key enzymes involved, and apple is fundamentally different from herbaceous plants in the way it balances leaf carbon inventories at dawn with carbon export at night for sink growth.
2. Materials and Methods
2.1. Plant Materials
Twenty four-year-old “Gala” apple trees on “M.26” rootstock were grown in 55-L plastic containers filled with sand at Cornell Orchards in Ithaca, NY. The trees were lined up in a single row in an east–west orientation with a between-tree spacing of one meter. They received Hoagland nutrient solution via fertigation the same way as described in [22] and standard disease and pest management throughout the growing season. The trees were assigned to three crop load levels, with six replicates per treatment (single tree per replicate), excluding the two trees at the end of the row. The treatment levels were low crop load at 2.5 fruits/cm2 trunk cross-sectional area (TCSA), medium crop load at 7.5 fruits/cm2 TCSA, and high crop load at 15 fruits/cm2 TCSA, achieved by hand thinning at the 10-mm king fruit size. The chosen treatments reflect the most common range of crop load levels encountered in apple production, with 7 to 8 fruits/cm2 TCSA being the optimal level for good size and quality.
2.2. Photosynthetic Gas Exchange
Carbon dioxide assimilation (A) and stomatal conductance (gs) were measured between 10–11:30 a.m. throughout the growing season between seven days after full bloom (DAFB) and 162 DAFB (35 days post-harvest) with a CIRAS-1 portable photosynthesis system (PP system, Hitchin, Hertfordshire, UK) using a standard broad leaf cuvette. The measurements were made on one representative leaf from each tree that was fully developed, well-lit, and from a bourse shoot where fruits were located, except the first measurement, which was made on the largest spur leaf just below the flower cluster.
2.3. Light Response Curves
To determine leaf photosynthetic responses to light intensity, light response curves were constructed with Li-Cor 6400 portable photosynthesis system (Li-Cor, Inc., Lincoln, NE, USA). Three mature and well-lit leaves were chosen from each crop load level for the measurement at photosynthetic photon flux density (PFD) of 1800, 1400, 1250, 1000, 750, 500, 250, 100, 50, and 0 µmol·m−2·s−1 (in that sequence) with 6400–40 Leaf Chamber Fluorometer (LCF) as the light source. Cuvette conditions were maintained at an ambient CO2 concentration of 400 µmol·mol−1, and leaf temperature of 25 °C. Measurements were taken after steady state was reached.
2.4. A/Ci Curves
Leaf net CO2 assimilation (A) responses to different intercellular CO2 concentrations (Ci) were constructed with Li-Cor 6400. Three mature and well-lit leaves were chosen from each crop load level for the measurement at CO2 concentrations of 400, 100, 200, 300, 550, 700, 900, 1200, and 1500 µmol·mol−1 (in that sequence), with 6400-02B as the light source. Cuvette conditions were maintained at PFD of 1600 µmol·m−2·s−1, relative humidity > 60%, and leaf temperature of 25 °C. Measurements were taken after steady state was reached. To understand the biophysical and biochemical limitations to photosynthesis, Vc,max (maximum carboxylation rate allowed by ribulose 1·5-bisphosphate carboxylase/oxygenase (Rubisco)), J (rate of photosynthetic electron transport (based on NADPH requirement)), TPU (triose phosphate utilization), and Rd (day respiration) [4,51] were derived from A/Ci curve based on the models developed by [4] and using non-linear curve-fitting routine available in Microsoft Excel.
2.5. Metabolites Analysis
Leaf disks (1.277 cm2) from different crop load levels were taken at noon, dusk, and dawn, frozen in liquid N2, and stored at −80 °C until use. Gas chromatography–mass spectrometry (GC–MS) metabolite profiling was carried out via an Agilent 7890A GC/5975C MS (Agilent Technology, Palo Alto, CA, USA) with an electron ionization source as described by [52]. The pellets after the extraction of polar metabolites were used for starch analysis below. Duplicate leaf disks were taken on the same day at noon only to measure metabolite intermediates: glucose-6-phosphate (G6P), fructose-6-phosphate (F6P), and 3-phosphoglycerate (PGA). These compounds were extracted and assayed according to [53] with modifications [54].
2.6. Starch Analysis
Leaf starch was extracted and assayed from the pellets after extraction of polar metabolites according to [55]. The pellets were first boiled in 2 mL of 0.2 mol·L−1 KOH for 30 min. After adjusting the pH to 4.5 with 1 mol·L−1 acetic acid, they were then digested by 30 units of amyloglucosidase (EC3.2.1.3) for 30–60 min at 55 °C. The reaction was stopped by boiling for 1 min to inactivate the enzyme, and the solution was cooled and diluted to 5 mL with H2O. After centrifugation, the supernatants were used for the determination of the resulting glucose using an enzymatic assay described by [56].
2.7. Enzyme Activity Assays
To quantify the activity of key C assimilation and metabolism enzymes, leaf disks (1.277 cm2) from different crop loads were taken at noon in full sun, frozen in liquid N2, and stored at −80 °C until being extracted. Ribulose-1,5-bisphosphate carboxylase/oxygenase (Rubisco, EC4.1.1.39), NADP-glyceraldehyde-3-phosphate dehydrogenase (GAPDH, EC1.2.1.12), phosphoribulokinase (PRK, EC2.7.1.19), and sucrose–phosphate synthase (SPS6, EC2.4.1.14) were extracted according to the methods described by [54]. Two or three frozen leaf disks were ground with a pre-cooled mortar and pestle in 1.5 mL extraction buffer containing 50 mM Hepes-KOH (pH 7.5), 10 mM MgCl2, 2 mM ethylenediaminetetraacetic acid (EDTA), 10 mM dithiothreitol (DDT), 1% (v/v) Triton X-100, 1% (w/v) bovine serum albumin (BSA), 10% (v/v) glycerol, and 5% (w/v) insoluble polyvinylpolypyrrolidone (PVPP). The extract was centrifuged at 13,000 g for 5 min, and the supernatant was assayed immediately.
To measure the total Rubisco activity, the leaf extract was first incubated in assay solution without RuBP for 15 min at room temperature. The reaction was then initiated by the addition of RuBP [57]. Activities of GAPDH and PRK were determined according to [58].
SPS was assayed according to [54] with some modifications. Sixty microliter extract was incubated for 20 min at 30 C with 100 mM Hepes-KOH (pH7.5), 100 mM KCl, 6 mM EDTA, 30 mM uridine 5’-diphosphoglucose (UDPG), 10 mM F6P, and 40 mM glucose-6-G6P in a total volume of 100 µL. The reaction was stopped by boiling for 3 min, held on ice for 15 min, and then centrifuged at 13,000 g for 1 min. An aliquot (60 µL) of the supernatant was assayed for uridine 5´-diphosphate (UDP) by coupling with the oxidation of NADH with lactate dehydrogenase (LDH, EC1.1.1.27) and pyruvate kinase (PK, EC2.7.1.40). The reaction mixture (1 mL) contained 50 mM Hepes-NaOH (pH7.0), 5 mM MgCl2, 0.3 mM NADH, 0.8 mM phosphoenolpyruvate (PEP), 14 units LDH, and 4 units PK. PK was added last to start the reaction, and an aliquot was boiled for 3 min to stop the reaction. Leaf ADP-glucose pyrophosphorylase (AGPase, EC2.7.7.27) and aldose-6-phosphate reductase (A6PR, EC 1.1.1.200) were extracted and assayed according to methods described in [59] and [60], respectively.
2.8. Statistical Analysis
To compare mean measurements of samples from different crop load treatments, Tukey’s HSD test at α = 0.05 was used after analysis of variance with software JMP, version 11.
3. Results
3.1. Crop Load Affected Photosynthetic Carbon Assimilation and Stomatal Conductance
Before crop load adjustments at 7 DAFB, leaf assimilation rates were comparable in different crop load levels. Post adjustment, and throughout the growing season, leaf assimilation rate, was always the lowest in low crop load trees and highest in high crop load trees (Figure 1), although it followed a similar seasonal pattern across treatment levels. The effects of crop load on assimilation rate gradually diminished post-harvest. At 18 and 35 days after harvest, respectively, the assimilation rates of medium and high crop load trees dropped to a level similar to that of low crop load trees (Figure 1). Crop load also affected stomatal conductance, gs. Similar to the assimilation rate, gs was always the lowest in low crop load trees during the growing season, followed by medium and high crop load trees. The stomatal conductance of the low crop load trees differed from high crop load trees by a factor between 1.5 and 2.8. Postharvest, gs from high and medium crop load trees decreased to the levels that were not statistically different from low crop load trees. Throughout the growing season, gs was also shown to be positively correlated with assimilation rate with an average R2 of 0.6.
To further understand how the photosynthetic performance responds to crop load, we measured photosynthetic responses to different light intensities and CO2 concentrations on mature and well-lit leaves from each crop load level during rapid fruit expansion in early August. Light response curves and A/Ci curves were constructed. As PFD or intercellular CO2 concentration increased, leaf CO2 assimilation increased as well. At any given PFD or Ci, CO2 assimilation was always greater in high crop load trees than low crop load trees (Figure 2). Leaf Vc,max, J, TPU, and Rd were the highest in the high crop load trees, followed by medium and low crop load trees when they were estimated based on the model described in [4] (Figure 2).
3.2. Crop Load Altered Accumulation of Non-Structural Carbohydrates (NSC)
NSC were extracted and measured from leaf discs taken at noon, dusk, and dawn during rapid fruit expansion. Metabolic intermediates G6P, F6P, and PGA were only assayed from leaf discs taken at noon. Crop load affected the level of NSC and the intermediates, and the effects became more prominent as time progressed to the dawn of the next day. At noon, higher concentrations of starch (~3.3-fold) and lower concentrations of G6P (~60%), F6P (~70%), and PGA (~60%) were detected in low crop load trees than that of high crop load trees (Figure 3 and Figure 4). The concentration of fructose in low crop load trees was about 75% of that in medium crop load trees and 84% of that in high crop load trees. At dusk, the effects of crop load started to manifest on more compounds. Compared with that of high crop load trees, in low crop load trees, the concentration increased by a factor of ~1.3 for sorbitol, ~1.2 for sucrose, ~3.1 for starch, and ~1.6 for total non-structural carbohydrates (TNC) (Figure 3). The concentration of fructose in low crop load trees was again the lowest and about 70% of that of high crop load trees. At dawn, concentrations of sorbitol and TNC increased with decreasing crop loads, and concentrations of starch and sucrose were higher in low crop load treatment than in the other two treatments. Compared with that of high crop load trees, in low crop load trees the concentration increased by a factor of ~1.8 for sucrose, ~1.9 for sorbitol, ~7.5 for starch, and ~2.2 for TNC. No significant difference was detected for fructose level at dawn.
Throughout the diel cycle, the drops in NSC levels were smaller in low crop load trees than in high crop load trees. For sucrose, low crop load trees had a 30% reduction at dawn compared to the noon of the previous day, while high crop load trees had a 50% reduction. For sorbitol, low crop load trees had comparable levels at these two time-points, while high crop load trees had a 30% reduction. For fructose, low crop load trees had a comparable level between dusk and dawn, while high crop load trees had a 30% reduction. For glucose, low crop load trees had a 5% reduction comparing dusk to that of noon, while high crop load trees had a 50% reduction. While about 60% of starch was re-mobilized at night in high crop load trees, no difference in starch level was detected in low crop load trees across the three time points we measured, indicating that very little leaf transitory starch was remobilized for C export in these trees at night.
Crop load also altered the ratio between end-products of photosynthesis accumulated in the leaves. Low crop load trees had a higher starch/(sucrose + sorbitol) ratio compared with that of high crop load trees at noon and dusk. At noon, the starch/(sucrose + sorbitol) ratio was ~0.5 in low crop load trees and ~0.2 in high crop load trees. This ratio dropped to ~0.4 for low crop load trees at dusk and ~0.1 for high crop load trees. In addition, the ratio of sorbitol/sucrose was higher in low crop load trees at noon compared with that of high crop load trees. In low crop load trees, this ratio was ~4.8 and in high crop load trees, ~3.8.
3.3. Crop Load Changed Activities of Key Enzymes in Carbon Assimilation and Metabolism
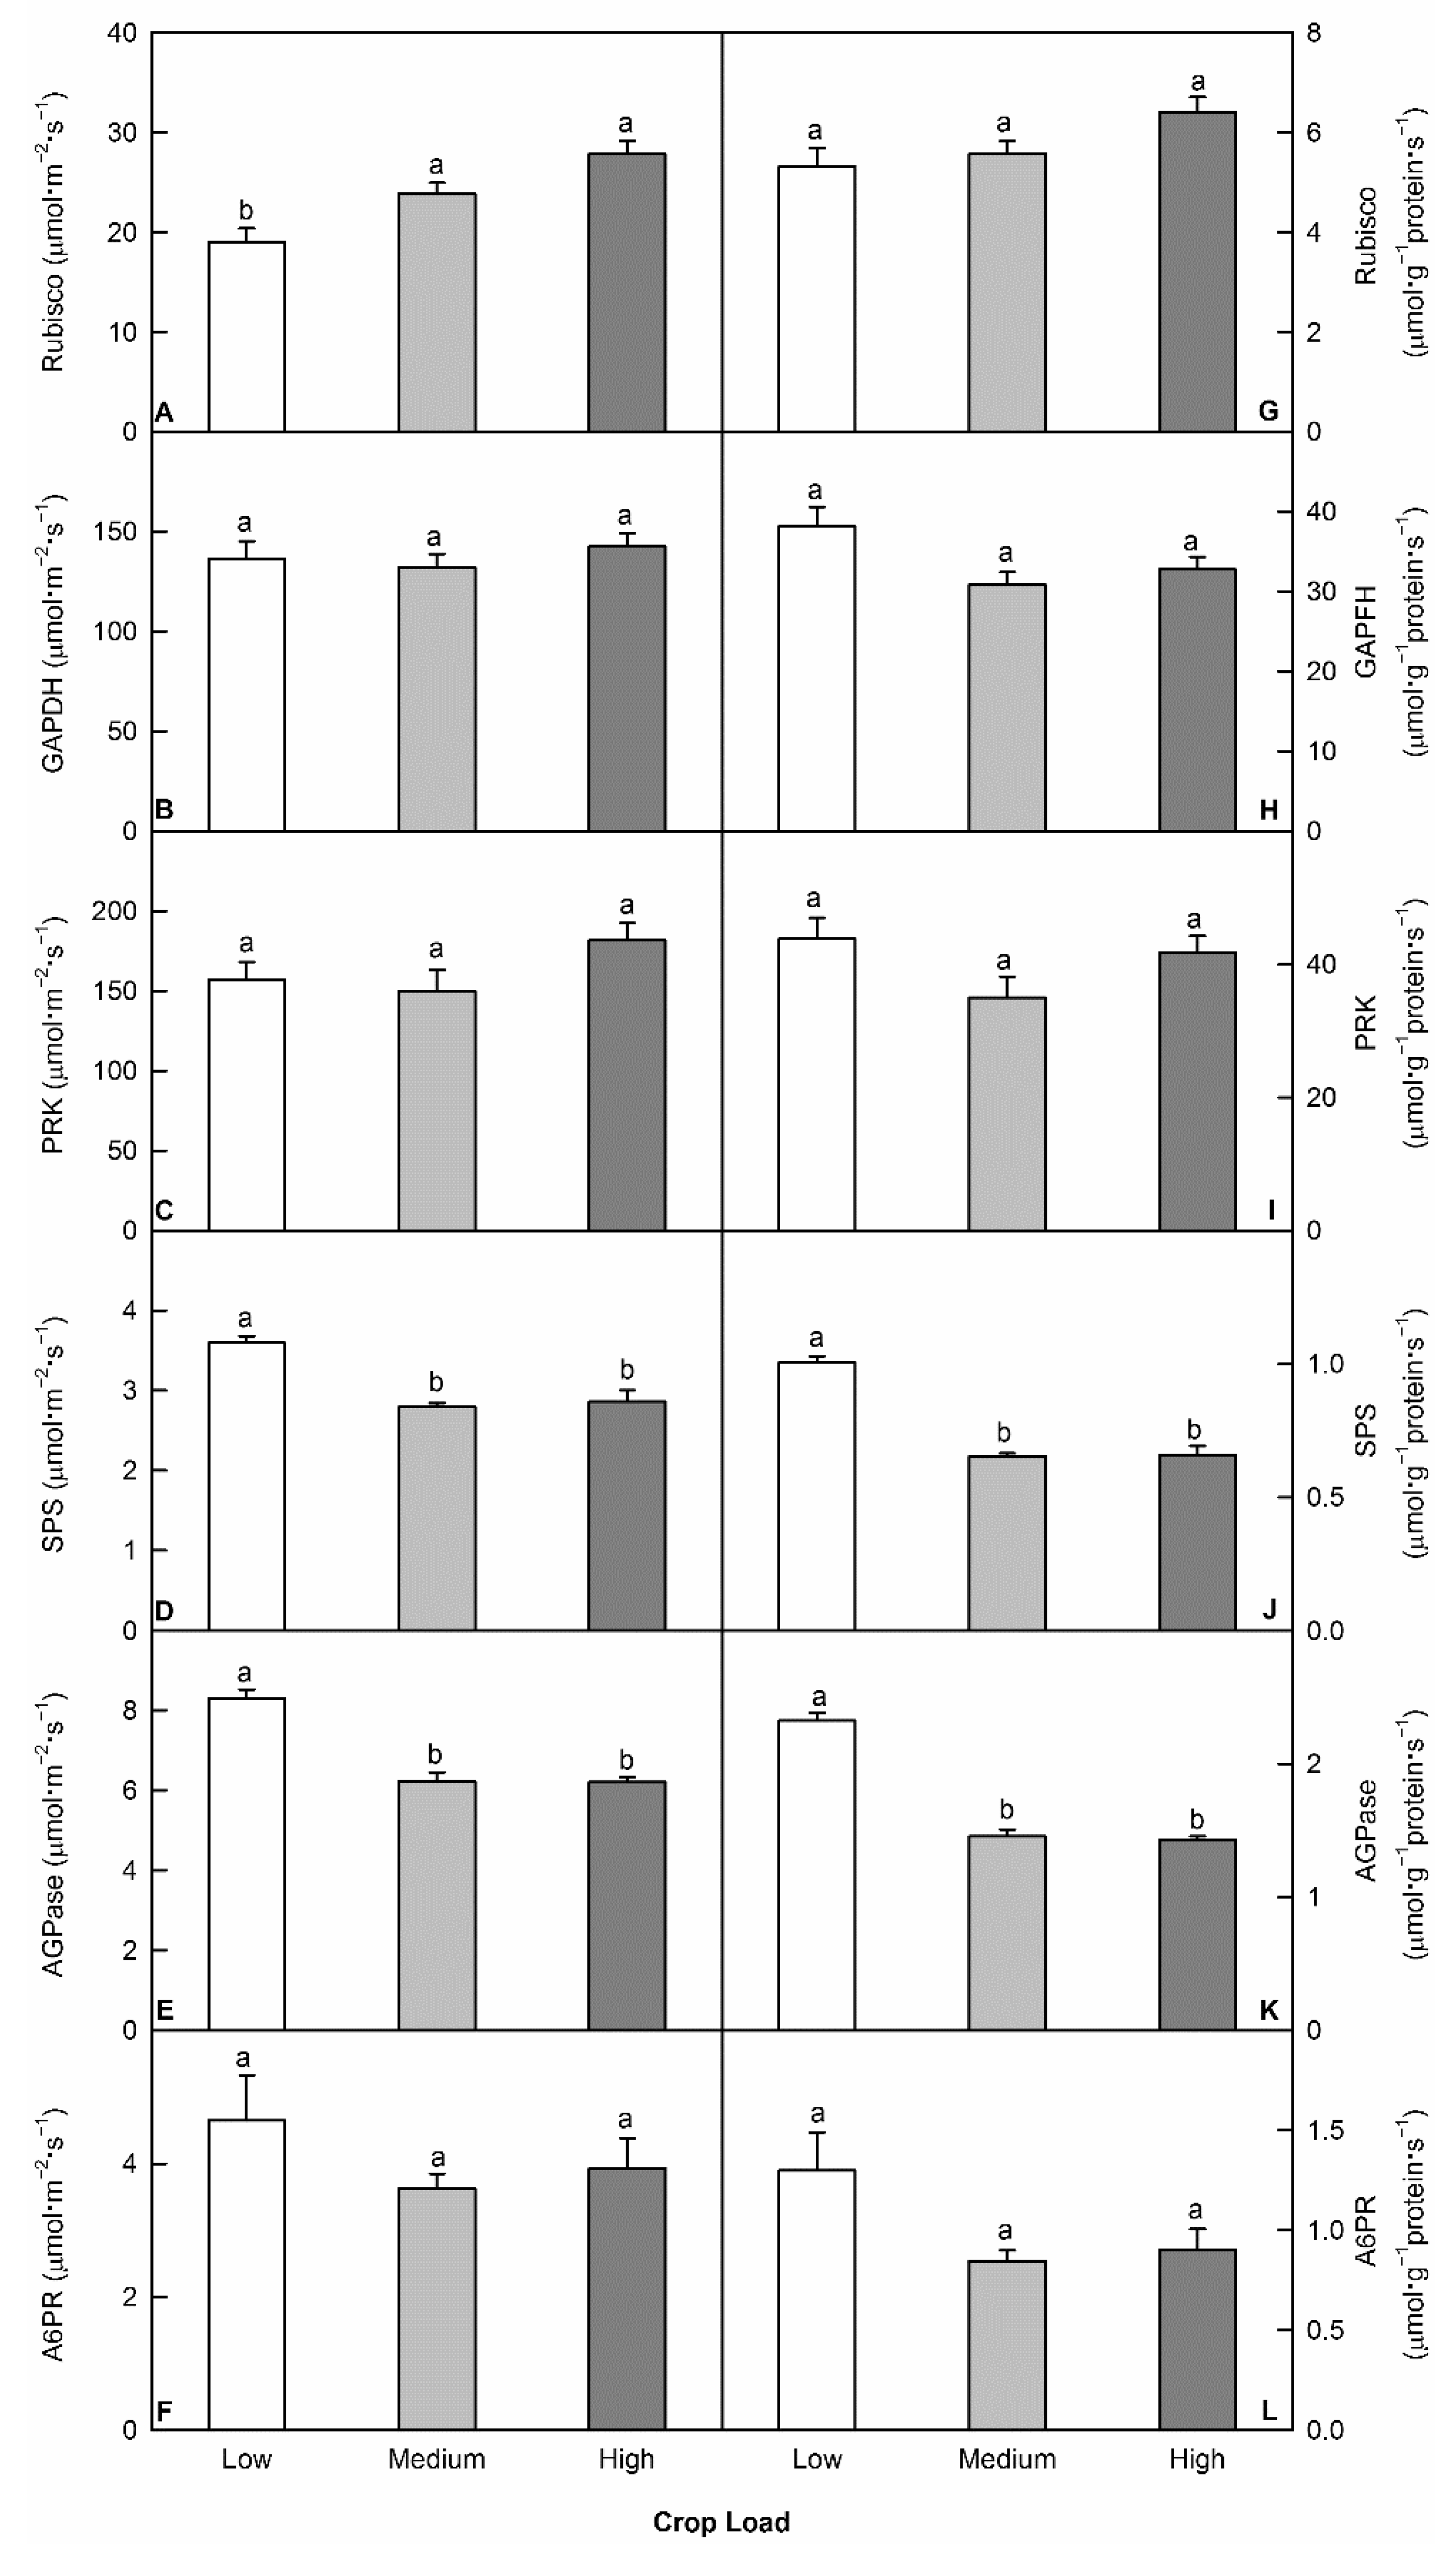
Activities of Rubisco, PRK, GAPDH, SPS, AGPase, and A6PR were measured from leaf disks taken at noon in full sun from different crop load levels. Rubisco activity was lower in low crop load trees, while the activity of PRK did not differ across crop load levels (Figure 5). Higher SPS and AGPase activities were detected in low crop load trees, regardless of whether the data were expressed on a protein basis or leaf area basis (Figure 5). A6PR activity was higher in low crop load trees than medium and high crop load trees with Student’s t-test; however, the difference was not significant with Tukey’s HSD test. No difference was detected for the activity of GAPDH (Figure 5).
3.4. Crop Load Affected Organic Acid Levels to a Lesser Degree
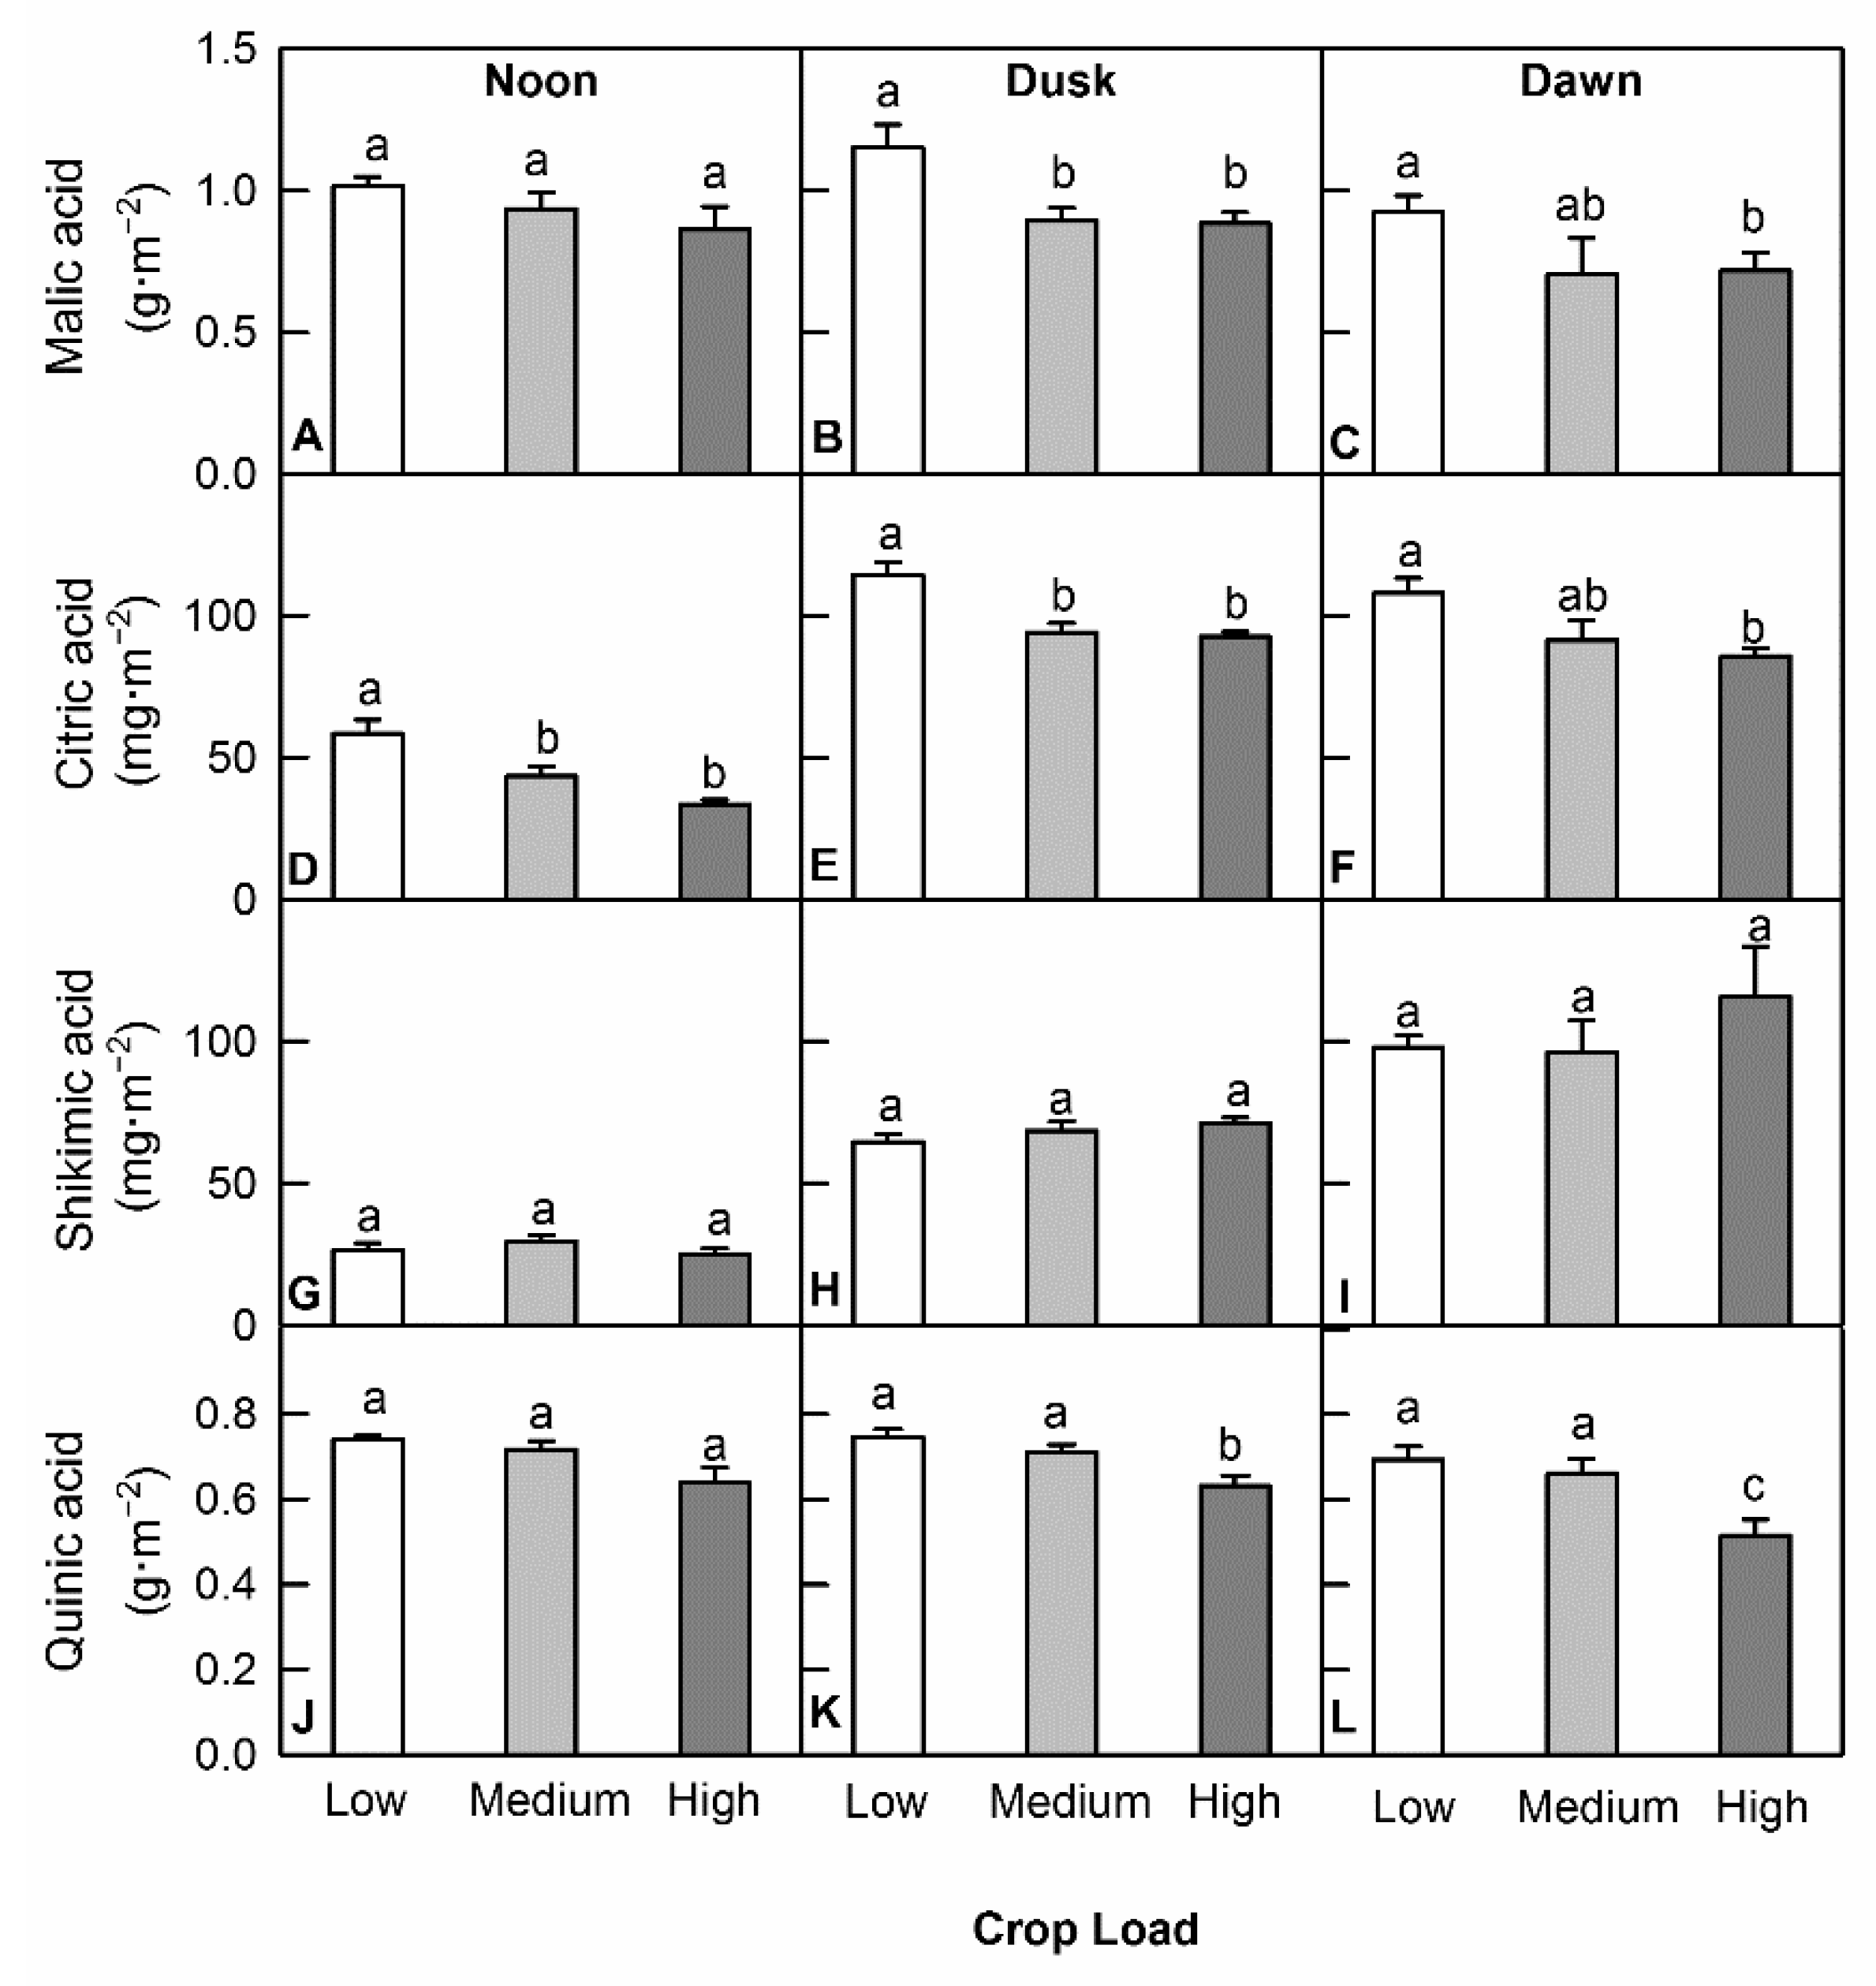
Four organic acids, malic acid, citric acid, shikimic acid, and quinic acid were measured from leaf discs taken at noon, dusk, and dawn from different crop load levels. In general, decreased crop loads led to increased accumulation of organic acids and more compounds were affected at dusk and dawn than at noon. At noon, only citric acid was affected in low crop load trees having a concentration that was ~1.7 times of the high crop load trees. At dusk, malic acid, quinic acid, and citric acid were all found to have a higher concentration in low crop load trees and increased by a factor of ~1.3, ~1.2, and ~1.2, respectively, compared with that of high crop load trees. At dawn, concentration in low crop load trees increased by a factor of ~1.3 for citric acid and quinic acid compared with that of high crop load trees (Figure 6). There was a greater amount of total organic acids (TOA) in low crop load trees at noon compared with that of high crop load trees. However, the extra accumulation of organic acids caused by a decreasing crop load level was smaller in magnitude compared with that of NSC. The greatest difference between low crop load and high crop load trees was a factor of 2.2 for TNC, but 1.2 for TOA. Further, a higher ratio of TNC/TOA was detected in low crop load trees at dusk and dawn. At dusk, the ratio was ~4.2 in low crop load trees and ~2.4 in high crop load trees; at dawn the ratio was ~5.4 in low crop load trees and ~3.9 in high crop trees.
4. Discussion
4.1. Crop Load Affected Carbon Assimilation in a Positive and Season-Dependent Manner
The manipulation of crop load in our study altered fruit sink, the dominant sink of the tree during the growing season, and thus the C demand by the whole tree. To understand how crop load affects C fixation, we measured leaf assimilation rate (A) at 7 DAFB, which was before the crop load adjustment, and between 38 DAFB and 162 DAFB (35 days post-harvest). Prior to crop load adjustments, no difference was detected for the leaf assimilation rate among trees assigned to different treatment levels. Post-adjustment, crop load demonstrated a positive effect on leaf assimilation. This phenomenon has been reported on apple [26,27,30,36,61], sour cherry (Prunus cerasus) [62], mango (Mangifera indica) [34], tangerine (Citrus unshiu) [33], plum (Prunus domestica) [25], peach (Prunus persica) [27], grapevine (Vitis vinifera) [28,63,64], and coffee (Coffea arabica) [35]. While we did not measure the leaf area and light interception at the canopy level, it was observed in “Braeburn” apple that high crop load trees had a higher gas exchange rate both at the per unit leaf and whole canopy levels [30]. At the end of the growing season, assimilation rates from different crop load levels converged around 35 days post-harvest (162 DAFB). The decrease of leaf assimilation rate in medium and high crop load trees would have to do with the removal of fruit sinks. Changes of photosynthetic rates around harvest were also observed previously [26,29,30] although with inconsistent details, probably due to variances in scion and rootstock combinations as well as growing conditions.
This positive relationship between crop load and leaf assimilation during rapid fruit growth and carbohydrate accumulation was not observed universally [29,38,43,45,46,48,65,66,67]. We think the discrepancy can be attributed to the following factors: 1) Sink demand is not the only factor influencing leaf photosynthesis [68]. Its impact on A also depends on the water [48,68] and nutrient [46,67] status of the plants. When sink demand is high and nutrients are insufficient for normal growth, nutrient deficiency in the roots could limit water and mineral uptake and lead to decreased nutrient and water levels in the leaves [46,66,68]. This explains why photosynthetic rates in some studies decreased with increased crop load levels [45,46]. In our study, the plants were provided with adequate water and nutrients to avoid water and mineral deficits, which ensured that proper crop load effects could be observed. 2) Different plant species vary in their ability to adjust their sink size. Some display less feedback inhibition under the condition of low sink strength, especially when the sink size can be readily increased [2]. Therefore, changing crop load in these species may not correspond with a changing leaf assimilation rate. 3) Leaf assimilation is regulated at the whole plant level. Given the importance of photosynthesis to a plant’s survival, the sink regulation of photosynthesis happens at the whole plant level [2,69]. It was demonstrated in apple that leaf photosynthetic rate responds to fruiting at the tree level rather than the shoot level, and branch photosynthesis autonomy does not exist [41,70]. This explains the discrepancy when photosynthesis is observed at the branch level without girdling [43].
4.2. Reduced Leaf Assimilation Rate in Low Crop Load Trees Was Primarily a Result of Reduced Rubisco Activity
The activity of Rubisco was lower in low crop load trees compared with high crop load trees both on a protein basis and on a leaf area basis. In addition, Vc,max, the maximum Rubisco carboxylation rate derived from A/Ci curves under CO2 limiting situation, was also the lowest in low crop load trees, suggesting a reduced in vivo Rubisco activity. With reduced carbon fixation in low crop load trees, we would expect a lower level of PGA, the first C compound of leaf assimilation. Indeed, the PGA level was lower in low crop load trees compared with medium and high crop load trees. Given no difference was observed for the activity of the enzyme GAPDH, this would lead to a lower level of G3P in the reduction phase of the Calvin cycle. G3P serves as the initial compound for the regeneration of RuBP, the other substrate for carbon fixation [71]. Although no difference was detected in the activity of phosphoribulokinase (PRK), a key enzyme that catalyzes the last and irreversible step of the regeneration of RuBP, reduced G3P level is likely to lead to reduced RuBP regeneration and availability for carbon fixation. Calvin cycle also requires chemical energy in the form of ATP and NADPH, which are generated from light driven electron transport in the chloroplast. The parameter J, which measures the capacity for electron transport in the chloroplast, was also the lowest in low crop load trees, reflecting a lower demand for electron transport associated with the lower leaf Rubisco activity in low crop load trees.
Throughout the growing season, low crop load trees had lower stomata conductance (gs) than medium and high crop load trees. Further, stomatal conductance was linearly correlated with A and explained about 60% of the variance in leaf assimilation, a number similar to but lower than 80% observed in “Braeburn” apple [30]. This positive linear relationship between gs and A was also observed in a meta-study in 14 plant species [72]. While the exact mechanism of how photosynthesis interacts with stomata’s behavior has not been fully elucidated, sucrose has been proposed as a metabolic link that connects photosynthetic activity in mesophyll cells, a primary location for carbon fixation, with stomata behavior [73,74]. It is suggested that the majority of the sucrose accumulated in guard cells is produced by photosynthesis in mesophyll cells and translocated to guard cells via apoplast [74]. Therefore, sucrose accumulation in low crop load trees could result in stomata closure either as an apoplastic osmolyte and/or as a signal metabolite that functions via plant hormone abscisic acid [73].
4.3. Low Crop Load Trees Accumulated a Higher Level of NSC and Organic Acids
Despite reduced leaf carbon assimilation, low crop load trees accumulated a higher level of sucrose, sorbitol, starch, and TNC compared with medium and high crop load trees. This extra accumulation of NSC in leaves due to a high source to sink ratio was also observed previously [25,33,34,36,37,41,42,48,75]. The NSC accumulation in our study was affected by the diel cycle. Among the three time points monitored, it was at dawn that the largest difference in concentration for the same compounds was detected across treatment levels. Compared with low crop load trees, high crop load trees exhibited larger decreases in the concentration of sucrose and sorbitol at night. From dusk to dawn, low crop load trees had a 30% decrease in sucrose level and 17% decrease in sorbitol level, while high crop load trees had a 50% decrease and 36% decrease, respectively. For the level of transitory starch in the leaves, no difference was detected between dusk and dawn in low crop load trees, whereas a 60% decrease was detected for high crop load trees (Figure 3). These data clearly indicate that significantly less carbohydrates were re-mobilized and exported out of leaves in low crop load trees than high crop load trees.
Low crop load trees also showed extra accumulation TOA. At the individual compound level, low crop load trees had the highest level of citric acid, which was ~1.7-fold at noon, ~1.2-fold at dusk, and ~1.3-fold at dawn compared with high crop load trees. An intermediate of TCA, citric acid is the precursor of 2-oxoglutarate (2-OG), which provides the carbon skeleton for N assimilation [76,77,78]. With a reduced requirement for C in low crop load trees, the corresponding requirement for N would be lower. Therefore, this extra accumulation of citric acid in low crop load trees is most likely a result of reduced consumption of 2-OG for N assimilation. The lower Day Respiration Rate (Rd) in low crop load trees also reflected this reduced demand for carbon skeleton and energy. Further, N assimilation mostly happens during the day, and it would first leverage the carbon produced in the previous night, mostly in the form of organic acids such as citric acid [76,77,78,79]. This may explain why among all the time points we have sampled, the largest difference in citric acid concentration between high and low crop load trees happened around noon.
4.4. Elevated Carbon Storage in Low Crop Load Trees and TPU Acclimation
The pool size of NSC in leaves is largely determined by carbon synthesis and export. Most of the photoassimilates in mature leaves are exported to other parts of the plant via phloem [7]. This transport links carbon status in the sink to carbon metabolism in the source [2,50,80,81,82,83]. In low crop load trees, where NSC were accumulated to a higher level, a reduced photosynthate export was observed. The significant drop in demand for photosynthates by the small number of fruits in low crop load trees would slow down phloem unloading of both sucrose and sorbitol in apple. This would lead to the buildup of these compounds in the phloem and sink tissues, resulting in increased viscosity in the sap and high turgor pressure in the sink. Both would lead to a decreased mass flow of assimilates from leaves [7,81,84], therefore a higher accumulation of NSC in low crop load trees. On the synthesis side, we observed increased activity of AGPase, SPS, and A6PR, three key enzymes for the synthesis of starch, sucrose, and sorbitol, respectively (although not statistically significant for A6PR). It was previously proposed that an accumulation of NSC in source leaves may increase the expression of the genes that are involved in carbohydrate utilization and storage [1,15]. AGPase was also shown to respond to sucrose accumulation in the leaves [2,50,52,54,80,82].
The increased activity of these enzymes may seem counterintuitive in low crop load trees. With a decreased carbon consumption capacity in the fruit sink, we would expect reduced demand for sucrose and sorbitol. Afterall, the whole photosynthesis apparatus was down-regulated to reduce the availability of end products in low crop load trees. The important perspective to consider here is the short-term versus long-term response. When fruit sink was reduced initially in our study, end product accumulation would most likely lead to reduced synthesis via feedback regulation [2,3]. In the chloroplast, this would be reflected as reduced utilization of triose-phosphate (TP), the immediate product of carbon fixation, and the principal form by which carbon is exported out of the chloroplast [85]. In most plants, TP is largely used for the synthesis of starch in the chloroplast and sucrose in the cytosol [86]. In apple, sorbitol is also produced in the cytosol in addition to sucrose. TP utilization (TPU) releases inorganic phosphate (Pi) from phosphorylated intermediates, and largely determines the rate at which Pi is recycled back to the chloroplast, where it is needed for ATP production for photosynthesis [3]. Therefore, reduced TPU can reduce the level of Pi, which in turn will limit photosynthesis [86]. This limitation is mediated through the deactivation of Rubisco and the reduction of the rate of RuBP regeneration [71]. However, this may not be sustainable in a long term. Deactivation of Rubisco while maintaining the total amount of the enzyme means a lot of nitrogen is wasted for producing this highly abundant protein, and the reduction of RuBP regeneration could lead to light damage to electron transport components [2,71]. The increased end product synthesis capacity as indicated by higher AGPase, SPS, and to a lesser extent A6PR activities is similar to what has been previously described as TPU acclimation [5,86]. This concerted effort to increase TPU would lead to a shift of resource allocation from Rubisco to enzymes involved in utilization and storage, so the usage of finite carbon and nitrogen resources can be optimized. This also suggests that reduction in the total amount of Rubisco as reflected in its total activity (Figure 5) represents the most effective way of aligning carbon assimilation with sink demand. We do not yet know how this acclimation happens, but trehalose-6-phosphate (T6P), a precursor of trehalose and a recently emerged key player in regulating carbon metabolism, could play a role [9,87,88].
4.5. Leaf Starch as an Indicator of Source–Sink Balance and Difference in Carbon Use between Apple and Herbaceous Plants
Compared with medium and high crop load trees, low crop load trees accumulated more starch at noon, dusk, and dawn. Given the low photosynthetic rate in low crop load trees, a much higher percentage of photosynthates must have been allocated to starch during the day [30]. Indeed, starch accounted for 30% of the NSC in low crop load trees at noon but only 15% in high crop load trees. This is largely consistent with previous work showing that low crop load led to an extra accumulation of starch in apple leaves [30,41]. However, our study further demonstrated that the effect of crop load on leaf starch level becomes more prominent from noon to dusk and then to dawn. It is clear from our data that the starch level is very sensitive to changing carbon dynamics, as it exhibited the largest concentration change (a difference of more than seven-fold) among all the compounds measured. This sensitivity makes it a good indicator, among all the NSC, of sink demand and carbon status in apple trees.
Although at dusk high crop load trees had a significantly lower level of transport sugars (sucrose and sorbitol) and TNC than low crop load trees, at dawn they still retained more than half of the transport sugars and TNC despite their high C demand. This high level of carbon inventory at dawn has to do with the passive, symplastic phloem loading strategy apple has adopted for both sucrose and sorbitol, because certain threshold concentrations are required to drive the diffusion of the transport sugars from mesophyll cells to sieve element–companion cell complex in the minor veins of leaves before phloem transport [89]. This is fundamentally different from Arabidopsis and most herbaceous plants that use active phloem loading strategies, either via apoplast or polymer trapping, which afford them low transport sugar concentrations in leaves [83,90]. Indeed, Arabidopsis plants export almost all of their TNC by dawn and would show carbon starvation responses even the night is artificially extended for 2 to 4 h [13,14,91]. The extremely low carbon inventory at dawn in these active loading herbaceous plants allows them to use carbon more efficiently for rapid growth [83]. In contrast, most woody plants have adopted the passive, symplastic phloem loading strategy, largely due to the constraint by their low whole-plant hydraulic conductance [92]. Consequently, these woody plants retain significant carbon inventories at dawn and have a lower growth rate than herbaceous plants.
5. Conclusions
By manipulating crop load, we found that leaf photosynthesis is closely linked to crop load in apple. The lower leaf photosynthesis measured in low crop load trees is primarily caused by reduced Rubisco activity via the long-term sink regulation of leaf photosynthesis. Low crop load decreases fruit sink strength, leading to extra accumulation of non-structural carbohydrates in source leaves. Starch appears to be a good indicator for the carbon status of apple trees due to its sensitivity to alteration in crop load. However, even the high crop load trees still retain a significant amount of non-structural carbohydrates in leaves at dawn. This demonstrates that apple is fundamentally different from active phloem loading herbaceous plants in the way it balances leaf carbon inventories at dawn with carbon export at night for sink growth. From the perspective of carbon acquisition, crop load management in apple needs to maximize sink-stimulated leaf photosynthesis, but the extent to which this can be used to enhance productivity will be ultimately dictated by the negative effect of increasing crop load on fruit quality and flower bud initiation in the cultivar of interest.
Author Contributions
L.C., X.Y. and L.-S.C. planned and designed the experiments; X.Y., L.-S.C. and L.C. performed the experiments and analyzed the data; X.Y., L.C. and L.-S.C. wrote the manuscript. All authors have read and agreed to the published version of the manuscript.
Funding
This research was funded in part by USDA NIFA-SCRI project: Precision crop load management for apples (2020-51181-32197).
Institutional Review Board Statement
Not applicable.
Informed Consent Statement
Not applicable.
Data Availability Statement
Data are archived in L. Cheng’s lab and available upon request.
Acknowledgments
We thank Peter Davies for his editorial comment on the manuscript.
Conflicts of Interest
The authors declare no conflict of interest.
References
- Sheen, J. Metabolic repression of transcription in higher plants. Plant Cell 1990, 2, 1027–1038. [Google Scholar]
- Paul, M.J.; Foyer, C.H. Sink regulation of photosynthesis. J. Exp. Bot. 2001, 52, 1383–1400. [Google Scholar] [CrossRef]
- Paul, M.J.; Pellny, T.K. Carbon metabolite feedback regulation of leaf photosynthesis and development. J. Exp. Bot. 2003, 54, 539–547. [Google Scholar] [CrossRef] [Green Version]
- Sharkey, T.D.; Bernacchi, C.J.; Farquhar, G.D.; Singsaas, E.L. Fitting photosynthetic carbon dioxide response curves for C3 leaves. Plant Cell Environ. 2007, 30, 1035–1040. [Google Scholar] [CrossRef] [PubMed]
- Smith, A.; Stitt, M. Coordination of carbon supply and plant growth. Plant Cell Environ. 2007, 30, 1126–1149. [Google Scholar] [CrossRef]
- Zhu, X.G.; de Sturler, E.; Long, S.P. Optimizing the distribution of resources between enzymes of carbon metabolism can dramatically increase photosynthetic rate, a numerical simulation using an evolutionary algorithm. Plant Physiol. 2007, 145, 513–526. [Google Scholar] [CrossRef] [PubMed] [Green Version]
- Ainsworth, E.A.; Bush, D.R. Carbohydrate export from the leaf: A highly regulated process and target to enhance photosynthesis and productivity. Plant Physiol. 2011, 155, 64–69. [Google Scholar] [CrossRef] [PubMed] [Green Version]
- Long, S.P.; Marshall-Colon, A.; Zhu, X.G. Meeting the global food demand of the future by engineering crop photosynthesis and yield potential. Cell 2015, 161, 56–66. [Google Scholar] [CrossRef] [PubMed] [Green Version]
- Yu, S.M.; Lo, S.F.; Ho, T.H.D. Source–sink communication, regulated by hormone; nutrient; and stress cross-signaling. Trends Plant Sci. 2015, 20, 844–857. [Google Scholar] [CrossRef]
- Chang, T.G.; Zhu, X.G. Source–sink interaction, a century old concept under the light of modern molecular systems biology. J. Exp. Bot. 2017, 68, 4417–4431. [Google Scholar] [CrossRef] [PubMed]
- Durand, M.; Mainson, D.; Porcheron, B.; Maurousset, L.; Lemoine, R.; Pourtau, N. Carbon source–sink relationship in Arabidopsis thaliana, the role of sucrose transporters. Planta 2018, 247, 587–611. [Google Scholar] [CrossRef] [Green Version]
- Sonnewald, U.; Fernie, A.R. Next-generation strategies for understanding and influencing source–sink relations in crop plants. Curr. Opin. Plant Biol. 2018, 43, 63–70. [Google Scholar] [CrossRef]
- Gibon, Y.; Pyl, E.; Sulpice, R.; Lunn, J.E.; Hohne, M.; Gunther, M.; Stitt, M. Adjustment of growth, starch turnover, protein content and central metabolism to a decrease of the carbon supply when Arabidopsis is grown in very short photoperiods. Plant Cell Environ. 2009, 32, 859–874. [Google Scholar] [CrossRef]
- Graf, A.; Schlereth, A.; Stitt, M.; Smith, A.M. Circadian control of carbohydrate availability for growth in Arabidopsis plants at night. Proc. Natl. Acad. Sci. USA 2010, 107, 9458–9463. [Google Scholar] [CrossRef] [PubMed] [Green Version]
- Stitt, M.; Lunn, J.; Usadel, B. Arabidopsis and primary photosynthetic metabolism, more than the icing on the cake. Plant J. 2010, 61, 1067–1091. [Google Scholar] [CrossRef] [PubMed]
- Do, P.T.; Prudent, M.; Sulpice, R.; Causse, M.; Fernie, A.R. The influence of fruit load on the tomato pericarp metabolome in a Solanum chmielewskii introgression line population. Plant Physiol. 2010, 154, 1128–1142. [Google Scholar] [CrossRef] [Green Version]
- Osorio, S.; Ruan, Y.L.; Fernie, A.R. An update on source-to-sink carbon partitioning in tomato. Front. Plant Sci. 2014, 5, 516. [Google Scholar] [CrossRef] [Green Version]
- Li, T.; Heuvelink, E.; Marcelis, L.F. Quantifying the source–sink balance and carbohydrate content in three tomato cultivars. Front. Plant Sci. 2015, 6, 416. [Google Scholar]
- Paul, M.J.; Gonzalez-Uriarte, A.; Griffiths, C.A.; Hassani-Pak, K. The role of trehalose 6-phosphate in crop yield and resilience. Plant Physiol. 2018, 177, 12–23. [Google Scholar] [CrossRef] [PubMed] [Green Version]
- Sulpice, R.; Pyl, E.T.; Ishihara, H.; Trenkamp, S.; Steinfath, M.; Witucka-Wall, H.; Gibon, Y.; Usadel, B.; Poree, F.; Piques, M.C.; et al. Starch as a major integrator in the regulation of plant growth. Proc. Natl. Acad. Sci. USA 2009, 106, 10348–10353. [Google Scholar] [CrossRef] [Green Version]
- Dietze, M.C.; Sala, A.; Carbone, M.S.; Czimczik, C.I.; Mantooth, J.A.; Richardson, A.D.; Vargas, R. Nonstructural carbon in woody plants. Annu. Rev. Plant Biol. 2014, 65, 667–687. [Google Scholar] [CrossRef] [PubMed] [Green Version]
- Cheng, L.; Raba, R. Accumulation of macro- and micronutrients and nitrogen demand-supply relationship of ‘Gala’/M.26 trees grown in sand culture. J. Am. Soc. Hortic. Sci. 2009, 134, 3–13. [Google Scholar] [CrossRef]
- Xia, G.; Cheng, L.; Lakso, A.N.; Goffinet, M. Effects of nitrogen supply on source-sink balance and fruit size of ‘Gala’ apple trees. J. Am. Soc. Hortic. Sci. 2009, 134, 126–133. [Google Scholar] [CrossRef] [Green Version]
- Cheng, L.; Zhou, R.; Reidel, E.J.; Sharkey, T.D.; Dandekar, A.M. Antisense inhibition of sorbitol synthesis leads to up-regulation of starch synthesis without altering CO2 assimilation in apple leaves. Planta 2005, 220, 767–776. [Google Scholar] [CrossRef] [PubMed]
- Gucci, R.; Xiloyannis, C.; Flore, J.A. Gas exchange parameters; water relations and carbohydrate partitioning in leaves of field-grown Prunus domestica following fruit removal. Physiol. Plant. 1991, 83, 497–505. [Google Scholar] [CrossRef]
- Palmer, J.W. Effects of varying crop load on photosynthesis, dry-matter production and partitioning of ‘Crispin’/M.27 apple trees. Tree Physiol. 1992, 11, 19–33. [Google Scholar] [CrossRef]
- Ben Mimoun, M.; Longuenesse, J.J.; Génard, M. Pmax as related to leaf: Fruit ratio and fruit assimilate demand in peach. J. Hortic. Sci. 1996, 71, 767–775. [Google Scholar] [CrossRef]
- Naor, A.; Gal, Y.; Bravdo, B. Crop load affects assimilation rate; stomatal conductance; stem water potential; and water relations of field-grown Sauvignon blanc grapevines. J. Exp. Bot. 1997, 48, 1675–1680. [Google Scholar] [CrossRef] [Green Version]
- Palmer, J.W.; Giuliani, R.; Adams, H.M. Effect of crop load on fruiting and leaf photosynthesis of ‘Braeburn’/M.26 apple trees. Tree Physiol. 1997, 17, 741–746. [Google Scholar] [CrossRef] [Green Version]
- Wünsche, J.N.; Palmer, J.W.; Greer, D.H. Effects of crop load on fruiting and gas-exchange characteristics of ‘Braeburn’/M.26 apple trees at full canopy. J. Am. Soc. Hortic. Sci. 2000, 125, 93–99. [Google Scholar]
- Di Vaio, C.; Petito, A.; Buccheri, M. Effect of girdling on gas exchanges and leaf mineral content in the ‘Independence’ nectarine. J. Plant Nutr. 2001, 24, 1047–1060. [Google Scholar] [CrossRef]
- Klages, K.; Donnison, H.; Wünsche, J.; Boldingh, H. Diurnal changes in non-structural carbohydrates in leaves; phloem exudate and fruit in ‘Braeburn’ apple. Funct. Plant Biol. 2001, 28, 131–139. [Google Scholar] [CrossRef]
- Iglesias, D.J.; Lliso, I.; Tadeo, F.R.; Talon, M. Regulation of photosynthesis through source, sink imbalance in citrus is mediated by carbohydrate content in leaves. Physiol. Plant. 2002, 116, 563–572. [Google Scholar] [CrossRef]
- Urban, L.; Léchaudel, M.; Lu, P. Effect of fruit load and girdling on leaf photosynthesis in Mangifera indica L. J. Exp. Bot. 2004, 55, 2075–2085. [Google Scholar] [CrossRef] [PubMed] [Green Version]
- Vaast, P.; Angrand, J.; Franck, N.; Dauzat, J.; Génard, M. Fruit load and branch ring-barking affect carbon allocation and photosynthesis of leaf and fruit of Coffea arabica in the field. Tree Physiol. 2005, 25, 753–760. [Google Scholar] [CrossRef] [Green Version]
- Wünsche, J.N.; Greer, D.H.; Laing, W.A.; Palmer, J.W. Physiological and biochemical leaf and tree responses to crop load in apple. Tree Physiol. 2005, 25, 1253–1263. [Google Scholar] [CrossRef]
- Franck, N.; Vaast, P.; Génard, M.; Dauzat, J. Soluble sugars mediate sink feedback down-regulation of leaf photosynthesis in field-grown Coffea arabica. Tree Physiol. 2006, 26, 517–525. [Google Scholar] [CrossRef] [Green Version]
- DaMatta, F.M.; Cunha, R.L.; Antunes, W.C.; Martins, S.C.; Araujo, W.L.; Fernie, A.R.; Moraes, G.A. In field-grown coffee trees source-sink manipulation alters photosynthetic rates, independently of carbon metabolism, via alterations in stomatal function. New Phytol. 2008, 178, 348–357. [Google Scholar] [CrossRef] [Green Version]
- Duan, W.; Pei, G.F.; Li, J.W.; Wei, D.L.; Shu, T.Y.; Shao, H.L. Photosynthetic response to low sink demand after fruit removal in relation to photoinhibition and photoprotection in peach trees. Tree Physiol. 2008, 28, 123–132. [Google Scholar] [CrossRef] [Green Version]
- Bustan, A.; Avnu, A.; Lavee, S.; Zipori, I.; Yeselson, Y.; Schaffer, A.A.; Riov, J.; Dag, A. Role of carbohydrate reserves in yield production of intensively cultivated oil olive (Olea europaea L.) trees. Tree Physiol. 2011, 31, 519–530. [Google Scholar] [CrossRef] [Green Version]
- Pallas, B.; Bluy, S.; Ngao, J.; Martinez, S.; Clément-Vidal, A.; Kelner, J.J.; Costes, E. Growth and carbon balance are differently regulated by tree and shoot fruiting contexts, an integrative study on apple genotypes with contrasted bearing patterns. Tree Physiol. 2018, 38, 1395–1408. [Google Scholar] [CrossRef]
- Roper, T.R.; Keller, J.D.; Loescher, W.H.; Rom, C.R. Photosynthesis and carbohydrate partitioning in sweet cherry, fruiting effects. Physiol. Plant. 1998, 72, 42–47. [Google Scholar] [CrossRef]
- Nebauer, S.G.; Arenas, C.; Rodríguez-Gamir, J.; Bordón, Y.; Fortunato-Almeida, A.; Monerri, C.; Guardiola, G.L.; Molina, R.V. Crop load does not increase the photosynthetic rate in citrus leaves under regular cropping conditions. A study throughout the year. Sci. Hort. 2013, 160, 358–365. [Google Scholar] [CrossRef] [Green Version]
- Neilsen, D.; Neilsen, G.; Guak, S.; Forge, T. Consequences of deficit irrigation and crop load reduction on plant water relations, yield, and quality of ‘Ambrosia’ apple. HortScience 2016, 51, 98–106. [Google Scholar] [CrossRef] [Green Version]
- Saa, S.; Brown, P.H. Fruit presence negatively affects photosynthesis by reducing leaf nitrogen in almond. Funct. Plant Biol. 2014, 41, 884–891. [Google Scholar] [CrossRef]
- Ding, N.; Chen, Q.; Zhu, Z.; Peng, L.; Ge, S.; Jiang, Y. Effects of crop load on distribution and utilization of 13C and 15N and fruit quality for dwarf apple trees. Sci. Rep. 2017, 7, 14172. [Google Scholar] [CrossRef] [PubMed] [Green Version]
- Nebauer, S.G.; Renau-Morata, B.; Lluch, Y.; Baroja-Fernández, E.; Pozueta-Romero, J.; Molina, R.V. Influence of crop load on the expression patterns of starch metabolism genes in alternate-bearing citrus trees. Plant Physiol. Biochem. 2014, 80, 105–113. [Google Scholar] [CrossRef] [Green Version]
- Naschitz, S.; Naor, A.; Genish, S.; Wolf, S.; Goldschmidt, E.E. Internal management of non-structural carbohydrate resources in apple leaves and branch wood under a broad range of sink and source manipulations. Tree Physiol. 2010, 30, 715–727. [Google Scholar] [CrossRef] [Green Version]
- White, A.C.; Rogers, A.; Rees, M.; Osborne, C.P. How can we make plants grow faster? A source–sink perspective on growth rate. J. Exp. Bot. 2016, 67, 31–45. [Google Scholar] [CrossRef]
- Griffiths, C.A.; Paul, M.J.; Foyer, C.H. Metabolite transport and associated sugar signaling systems underpinning source/sink interactions. BBA-Bioenergetics 2016, 1857, 1715–1725. [Google Scholar] [CrossRef] [PubMed] [Green Version]
- Long, S.P.; Bernacchi, C.J. Gas exchange measurements, what can they tell us about the underlying limitations to photosynthesis? Procedures and sources of error. J. Exp. Bot. 2003, 54, 2393–2401. [Google Scholar] [CrossRef] [Green Version]
- Wang, H.; Ma, F.; Cheng, L. Metabolism of organic acids, nitrogen and amino acids in chlorotic leaves of ‘Honeycrisp’ apple (Malus x domestica Borkh.) with excessive accumulation of carbohydrates. Planta 2010, 232, 511–522. [Google Scholar] [CrossRef]
- Chen, L.S.; Lin, Q.; Nose, A. A comparative study on diurnal changes in metabolite levels in the leaves of three crassulacean acid metabolism (CAM) species, Ananas comosus, Kalanchoë daigremontiana and K. pinnata. J. Exp. Bot. 2002, 53, 341–350. [Google Scholar] [CrossRef] [PubMed] [Green Version]
- Chen, L.S.; Cheng, L. Carbon assimilation and carbohydrate metabolism of ‘Concord’ grape (Vitis labrusca L.) leaves in response to nitrogen supply. J. Am. Soc. Hortic. Sci. 2003, 128, 754–760. [Google Scholar] [CrossRef] [Green Version]
- Chen, L.S.; Qi, Y.P.; Nose, A. Diurnal changes in metabolite levels in the chlorenehyma and the water storage parenchyma of Ananas comosus leaves. Acta Phytophysiol. Sin. 2001, 27, 253–260. [Google Scholar]
- Jones, M.G.; Outlaw, W.H.; Lowry, O.H. Enzymic assay of 10−7 to 10−14 moles of sucrose in plant tissues. Plant Physiol. 1977, 60, 379–383. [Google Scholar] [CrossRef] [Green Version]
- Cheng, L.; Fuchigami, L.H. Rubisco activation state decreases with increasing nitrogen content in apple leaves. J. Exp. Bot. 2000, 51, 1687–1694. [Google Scholar] [CrossRef] [Green Version]
- Leegood, R.C. Enzymes of the Calvin Cycle. In Methods in Plant Biochemistry; Lea, P.J., Ed.; Academic Press: New York, NY, USA, 1990; Volume 3, pp. 15–37. [Google Scholar]
- Chen, L.S.; Qi, Y.P. Dithiothreitol decreases in vitro activity of ADP-glucose pyrophosphorylase from leaves of apple (Malus x domestica Borkh.) and many other plant species. Phytochem. Anal. 2007, 18, 300–305. [Google Scholar] [CrossRef] [PubMed]
- Chen, L.S.; Cheng, L. CO2 assimilation: Carbohydrate metabolism, xanthophyll cycle and the antioxidant system of ‘Honeycrisp’ apple (Malus x domestica Borkh.) leaves with zonal chlorosis. J. Am. Soc. Hortic. Sci. 2004, 129, 729–737. [Google Scholar] [CrossRef]
- Hansen, P. 14C studies on apple trees. VI. The influence of the fruit on the photosynthesis of leaves; and the relative photosynthetic yields of fruits and leaves. Physiol. Plant 1970, 23, 805–810. [Google Scholar] [CrossRef]
- Layne, D.R.; Flore, J.A. End-product inhibition of photosynthesis in Prunus cerasus L. in response to whole-plant source-sink manipulation. J. Am. Soc. Hortic. Sci. 1995, 120, 583–599. [Google Scholar] [CrossRef] [Green Version]
- Kaps, M.L.; Cahoon, G.A. Berry thinning and cluster thinning influence vegetative growth, yield, fruit composition, and net photosynthesis of ‘Seyval Blanc’ grapes. J. Am. Soc. Hortic. Sci. 1989, 114, 20–24. [Google Scholar]
- Edson, C.E.; Howell, G.S.; Flore, J.A. Influence of fruit load on photosynthesis and dry matter partitioning of Seyval grapevines. II. Seasonal changes in single leaf and whole vine photosynthesis. Am. J. Enol. Vitic. 1995, 46, 469–477. [Google Scholar]
- Naor, A.; Naschitz, S.; Peres, M.; Gal, Y. Responses of apple fruit size to tree water status and crop load. Tree Physiol. 2008, 28, 1255–1261. [Google Scholar] [CrossRef] [Green Version]
- Samuolienė, G.; Čeidaitė, A.; Sirtautas, R.; Duchovskis, P.; Kvikly, D. Effect of crop load on phytohormones, sugars, and biennial bearing in apple trees. Biol. Plant 2016, 60, 394–400. [Google Scholar] [CrossRef]
- Pan, Y.H.; Lu, Z.F.; Lu, J.W.; Li, X.K.; Cong, R.H.; Ren, T. Effects of low sink demand on leaf photosynthesis under potassium deficiency. Plant Physiol. Biochem. 2017, 113, 110–121. [Google Scholar] [CrossRef]
- Zhang, W.W.; Fu, X.Z.; Peng, L.Z.; Ling, L.L.; Cao, L.; Ma, X.H.; Xie, F.; Li, C. Effects of sink demand and nutrient status on leaf photosynthesis of spring-cycle shoot in ‘Newhall’ navel orange under natural field conditions. Sci. Hort. 2013, 150, 80–85. [Google Scholar] [CrossRef]
- Ljung, K.; Nemhauser, J.L.; Perata, P. New mechanistic links between sugar and hormone signaling networks. Curr. Opin. Plant Biol. 2015, 25, 130–137. [Google Scholar] [CrossRef]
- Poirier-Pocovi, M.; Lothier, J.; Buck-Sorlin, G. Modelling temporal variation of parameters used in two photosynthesis models, influence of fruit load and girdling on leaf photosynthesis in fruit-bearing branches of apple. Ann. Bot. 2018, 121, 821–832. [Google Scholar] [CrossRef]
- Sharkey, T.D. Photosynthesis in intact leaves of C3 plants, physics, physiology and rate limitations. Bot. Rev. 1985, 51, 53–105. [Google Scholar] [CrossRef]
- Gago, J.; de Menezes Daloso, D.; Figueroa, C.M.; Flexas, J.; Fernie, A.R.; Nikoloski, Z. Relationships of leaf net photosynthesis, stomatal conductance, and mesophyll conductance to primary metabolism, a multispecies meta-analysis approach. Plant Physiol. 2016, 171, 265–279. [Google Scholar] [CrossRef]
- Lima, V.F.; Medeiros, D.B.; Dos Anjos, L.; Gago, J.; Fernie, A.R.; Daloso, D.M. Toward multifaceted roles of sucrose in the regulation of stomatal movement. Plant Signal. Behav. 2018, 13, e1494468. [Google Scholar] [CrossRef] [PubMed]
- Lawson, T.; Matthews, J. Guard cell metabolism and stomatal function. Annu. Rev. Plant Biol. 2020, 71, 273–302. [Google Scholar] [CrossRef] [PubMed] [Green Version]
- Wünsche, J.N.; Ferguson, I.B. Crop load interactions in apple. Hortic. Rev. 2005, 31, 231–290. [Google Scholar]
- Nunes-Nesi, A.; Fernie, A.R.; Stitt, M. Metabolic and signaling aspects underpinning the regulation of plant carbon nitrogen interactions. Mol. Plant 2010, 3, 973–996. [Google Scholar] [CrossRef] [PubMed]
- Gauthier, P.P.; Bligny, R.; Gout, E.; Mahé, A.; Nogués, S.; Hodges, M.; Tcherkez, G.G. In folio isotopic tracing demonstrates that nitrogen assimilation into glutamate is mostly independent from current CO2 assimilation in illuminated leaves of Brassica napus. New Phytol. 2010, 185, 988–999. [Google Scholar] [CrossRef]
- Tcherkez, G.; Gauthier, P.; Buckley, T.N.; Busch, F.A.; Barbour, M.M.; Bruhn, D.; Heskel, M.A.; Gong, X.Y.; Crous, K.Y.; Griffin, K.; et al. Leaf day respiration, low CO2 flux but high significance for metabolism and carbon balance. New Phytol. 2017, 216, 986–1001. [Google Scholar] [CrossRef]
- Stitt, M.; Müller, C.; Matt, P.; Gibon, Y.; Carillo, P.; Morcuende, R.; Scheible, W.R.; Krapp, A. Steps towards an integrated view of nitrogen metabolism. J. Exp. Bot. 2002, 53, 959–970. [Google Scholar] [CrossRef]
- Muller-Rober, B.T.; Kossman, J.; Hannah, L.C.; Willmitzer, L.; Sonnewald, U. ADPG-pyrophosphorylase genes from potato, mode of RNA expression and its relation to starch synthesis. In Phloem Transport and Assimilate Compartmentation; Bonnemain, J.L., Ed.; Quest Editions: Nantes, France, 1991; pp. 204–208. [Google Scholar]
- Nikinmaa, E.; Hölttä, T.; Hari, P.; Kolari, P.; Mäkelä, A.; Sevanto, S.; Vesala, T. Assimilate transport in phloem sets conditions for leaf gas exchange. Plant Cell Environ. 2013, 36, 655–669. [Google Scholar] [CrossRef] [PubMed]
- Geigenberger, P.; Kolbe, A.; Tiessen, A. Redox regulation of carbon storage and partitioning in response to light and sugars. J. Exp. Bot. 2005, 56, 1469–1479. [Google Scholar] [CrossRef]
- Turgeon, R. The puzzle of phloem pressure. Plant Physiol. 2010, 154, 578–581. [Google Scholar] [CrossRef] [Green Version]
- Ruan, Y. Sucrose metabolism, gateway to diverse carbon use and sugar signaling. Annu. Rev. Plant Biol. 2014, 65, 33–67. [Google Scholar] [CrossRef]
- Herold, A. Regulation of photosynthesis by sink activity–the missing link. New Phytol. 1980, 86, 131–144. [Google Scholar] [CrossRef]
- McClain, A.M.; Sharkey, T.D. Triose phosphate utilization and beyond, from photosynthesis to end product synthesis. J. Exp. Bot. 2019, 70, 1755–1766. [Google Scholar] [CrossRef]
- Figueroa, C.M.; Lunn, J.E. A tale of two sugars, trehalose 6-phosphate and sucrose. Plant Physiol. 2016, 172, 7–27. [Google Scholar] [CrossRef] [Green Version]
- Zhang, W.; Lunn, J.E.; Feil, R.; Wang, Y.; Zhao, J.; Tao, H.; Guo, Y.; Zhao, Z. Trehalose 6-phosphate signal is closely related to sorbitol in apple (Malus x domestica Borkh. cv. Gala). Biol. Open 2017, 6, 260–268. [Google Scholar] [CrossRef] [PubMed] [Green Version]
- Reidel, E.J.; Rennie, E.A.; Amiard, V.; Cheng, L.; Turgeon, R. Phloem loading strategies in three plant species that transport sugar alcohols. Plant Physiol. 2009, 149, 1601–1608. [Google Scholar] [CrossRef] [PubMed] [Green Version]
- Rennie, E.A.; Turgeon, R. A comprehensive picture of phloem loading strategies. Proc. Natl. Acad. Sci. USA 2009, 106, 14162–14167. [Google Scholar] [CrossRef] [Green Version]
- Usadel, B.; Bläsing, O.E.; Gibon, Y.; Retzlaff, K.; Höhne, M.; Günther, M.; Stitt, M. Global transcript levels respond to small changes of the carbon status during progressive exhaustion of carbohydrates in Arabidopsis rosettes. Plant Physiol. 2008, 146, 1834–1861. [Google Scholar] [CrossRef] [PubMed] [Green Version]
- Fu, Q.; Cheng, L.; Guo, Y.; Turgeon, R. Phloem loading strategies and water relations in trees and herbaceous plants. Plant Physiol. 2011, 157, 1518–1527. [Google Scholar] [CrossRef] [Green Version]
Figure 1.
Effects of crop load on leaf CO2 assimilation (A) throughout the growing season, from seven days after full bloom (DAFB, before crop load adjustment), to 162 DAFB (35 days after harvest). Each point is mean ± SE (n = 6). The arrow indicates fruit harvest.
Figure 1.
Effects of crop load on leaf CO2 assimilation (A) throughout the growing season, from seven days after full bloom (DAFB, before crop load adjustment), to 162 DAFB (35 days after harvest). Each point is mean ± SE (n = 6). The arrow indicates fruit harvest.

Figure 2.
Effects of crop load on light response curve (A) and A/Ci response curve (B) of apple leaves. For A, each data point represents mean ± SE (n = 3). For B, each data point represents mean ± SE for leaf Ci (horizontal, n = 3) and CO2 assimilation (vertical, n = 3). Parameters of A/Ci curves for different crop load levels were estimated according to [4] and as follows: for low crop load, Vc,max = 50 µmol·m−2 s−1, J = 82 µmol·m−2·s−1, TPU = 5.7 µmol·m−2·s−1, Rd = 1.14 µmol·m−2·s−1; for medium crop load, Vc,max = 66 µmol·m−2 s−1, J = 114 µmol·m−2·s−1, TPU = 8.4 µmol·m−2·s−1, Rd = 1.15 µmol·m−2·s−1; for high crop load, Vc,max = 90 µmol·m−2 s−1, J = 160 µmol·m−2·s−1, TPU = 11.5 µmol·m−2·s−1, Rd = 1.25 µmol·m−2·s−1.

Figure 3.
Effects of crop load on the concentrations of non-structural carbohydrates at noon, dusk, and dawn in apple leaves: starch (A–C), sorbitol (D–F), sucrose (G–I), glucose (J–L), fructose (M–O), and total non-structural carbohydrates (P–R). Each bar is mean ± SE (n = 6). Different letters above the bars indicate a significant difference for Tukey’s HSD test at p < 0.05.

Figure 4.
Effects of crop load on the concentrations of carbon metabolism intermediates in apple leaves at noon: glucose-6-phosphate (G6P, A), fructose-6-phosphate (F6P, B), and 3-phosphoglycerate (PGA, C). Each bar is mean ± SE (n = 5). Different letters above the bars indicate a significant difference for Tukey’s HSD test at p < 0.05.

Figure 5.
Effects of crop load on the activities of key enzymes involved in carbon assimilation and metabolism in leaves at noon, expressed on leaf area and protein basis: Ribulose-1,5-bisphosphate carboxylase/oxygenase (Rubisco, A,G), NADP-glyceraldehyde-3-phosphate dehydrogenase (GAPDH, B,H), phosphoribulokinase (PRK, C,I), sucrose phosphate synthase (SPS, D,J), ADP-glucose pyrophosphorylase (AGPase, E,K), and aldose-6-phosphate reductase (A6PR, F,L). Each bar is mean ± SE (n = 5). Different letters above the bars indicate a significant difference for Tukey’s HSD test at p < 0.05.

Figure 6.
Effects of crop load on the concentrations of organic acids at noon, dusk, and dawn in apple leaves: malic acid (A–C), citric acid (D–F), shikimic acid (G–I), and quinic acid (J–L). Each bar is mean ± SE (n = 6). Different letters above the bars indicate a significant difference for Tukey’s HSD test at p < 0.05.

Publisher’s Note: MDPI stays neutral with regard to jurisdictional claims in published maps and institutional affiliations. |
© 2021 by the authors. Licensee MDPI, Basel, Switzerland. This article is an open access article distributed under the terms and conditions of the Creative Commons Attribution (CC BY) license (http://creativecommons.org/licenses/by/4.0/).
Share and Cite
MDPI and ACS Style
Yang, X.; Chen, L.-S.; Cheng, L. Leaf Photosynthesis and Carbon Metabolism Adapt to Crop Load in ‘Gala’ Apple Trees. Horticulturae 2021, 7, 47. https://0-doi-org.brum.beds.ac.uk/10.3390/horticulturae7030047
AMA Style
Yang X, Chen L-S, Cheng L. Leaf Photosynthesis and Carbon Metabolism Adapt to Crop Load in ‘Gala’ Apple Trees. Horticulturae. 2021; 7(3):47. https://0-doi-org.brum.beds.ac.uk/10.3390/horticulturae7030047
Chicago/Turabian StyleYang, Xiaohua, Li-Song Chen, and Lailiang Cheng. 2021. "Leaf Photosynthesis and Carbon Metabolism Adapt to Crop Load in ‘Gala’ Apple Trees" Horticulturae 7, no. 3: 47. https://0-doi-org.brum.beds.ac.uk/10.3390/horticulturae7030047
Note that from the first issue of 2016, this journal uses article numbers instead of page numbers. See further details here.