Article

Basil as Secondary Crop in Cascade Hydroponics: Exploring Salinity Tolerance Limits in Terms of Growth, Amino Acid Profile, and Nutrient Composition

1
Department of Agriculture Crop Production and Rural Environment, University of Thessaly, Fytokou, Nea Ionia, 38446 Volos, Greece
2
Faculty of Horticulture and Food Technology, Hochschule Weihenstephan-Triesdorf, University of Applied Sciences, Am Staudengarten 14, 85354 Freising, Germany
*
Author to whom correspondence should be addressed.
Submission received: 3 June 2021 / Revised: 18 July 2021 / Accepted: 18 July 2021 / Published: 21 July 2021

Abstract

:
In a cascade hydroponic system, the used nutrient solution drained from a primary crop is directed to a secondary crop, enhancing resource-use efficiency while minimizing waste. Nevertheless, the inevitably increased EC of the drainage solution requires salinity-tolerant crops. The present study explored the salinity-tolerance thresholds of basil to evaluate its potential use as a secondary crop in a cascade system. Two distinct but complemented approaches were used; the first experiment examined basil response to increased levels of salinity (5, 10 and 15 dS m−1, compared with 2 dS m−1 of control) to identify the limits, and the second experiment employed a cascade system with cucumber as a primary crop to monitor basil responses to the drainage solution of 3.2 dS m−1. Growth, ascorbate content, nutrient concentration, and total amino acid concentration and profile were determined in both experiments. Various aspects of basil growth and biochemical performance collectively indicated the 5 dS m−1 salinity level as the upper limit/threshold of tolerance to stress. Higher salinity levels considerably suppressed fresh weight production, though the total concentration of amino acids showed a sevenfold increase under 15 dS m−1 and 4.5-fold under 5 and 10 dS m−1 compared to the control. The performance of basil in the cascade system was subject to a compromise between a reduction of fresh produce and an increase of total amino acids and ascorbate content. This outcome indicated that basil performed well under the conditions and the system employed in the present study, and might be a good candidate for use as a secondary crop in cascade-hydroponics systems.

1. Introduction

Enhanced soil salinity is a worldwide and expanding problem posing serious threats to crop production [1]. It is an inherent problem of intensive cultivation systems and of semi-arid zones, which are characterized by the imbalance between precipitation and evapotranspiration. Nevertheless, increased salinity affects soilless cultivation systems as well—either open or closed [2]. Especially in the latter, where the nutrient solution re-circulates more than once in the crop lines, the increased salt accumulation in the root zone is inevitable. This entails risks regarding impaired plant function and performance, which negatively affect crop yield [3,4]. Additionally, in both open and closed soilless systems, the discharge of used nutrient solutions to the environment further deteriorates soil quality, causing severe environmental degradation and a waste of resources [5]. The ultimate result of such management practices is a reduced sustainability of soilless systems, although their implementation has considerable advantages in terms of crop productivity, space utilization, and nutrient-use efficiency [6,7]. Toward mitigating the environmental impacts of the discharge of waste nutrient solutions, a new concept in closed systems has been recently proposed that includes a transformation of the classical system into a cascade system; i.e., the used nutrient solution drained from a primary crop is subsequently directed to a secondary crop, and its drainage solution to a tertiary crop [5,8]. This exhaustive re-use of the same nutrient solution confers great advantages in resource-use efficiency while minimizing waste, and thus enhances the sustainability of cascade cultivation systems. Apparently, the suitability of certain crops to be used as secondary and tertiary crops should be carefully considered in terms of salt tolerance; it becomes a crucial characteristic due to increased salinity of the drained nutrient solution [5,9].
Plants grown under increased soil or water salinity are exposed mainly to three constraints; i.e., water deficit, ion imbalance, and ion toxicity [10,11]. The consequent physiological and metabolic disturbances collectively affect gas exchange rates, as well as morphological and biochemical characteristics of plants, and hence compromise crop growth and yield [3,12]. Plant species exhibit differential potentials to tolerate salinity, ranging from non-tolerant glycophytes—among them most cultivated plants—to salt-tolerant halophytes, which are adapted to thrive in saline environments. Interestingly, though different in tolerance, plants employ the same basic mechanisms to respond and acclimate to salt stress [10]. Among them are the control of cell water balance, ion homeostasis mechanisms, and scavenging of toxic compounds, all of which are deployed to various extents by different genotypes [11]. All the above-mentioned mechanisms include the activation of certain pathways of the secondary metabolism of plants, which result in production of antioxidants and accumulation of compatible osmoprotectants such as proline and glycine betaine [11]. Thus, the effort of the plant to cope with salt stress results in the enhancement of bioactive compounds, which are defined as phytochemicals that can modulate metabolic processes in humans and promote better health [13]. This effect is desirable from the human diet perspective, representing the “bright side” of salt stress. The promotion of bioactive compounds production by plants under stress is a new, intensive, and promising line of research [13].
The selection of crops that may efficiently cope with salt stress will optimize the use of the available resources of low quality, such as saline soil and irrigation water. The fundamental step in this process is to determine the salinity thresholds for both productivity and quality of the specific crops. There is often a trade-off between yield in terms of biomass production and quality characteristics in terms of marketable plant products of high-added value; e.g., health-promoting bioactive compounds and essential oils [4,14,15]. This trade-off reflects of course the balance between primary and secondary plant metabolism, and is usually challenged by imposing abiotic stress to crops [16]. Yet, given the adverse effects of salt stress on crop function and growth, it is crucial to consider and fine-tune the balance between yield, nutritional value, and bioactivity of the given crop species [17].
It is well documented that aromatic plants can tolerate moderate salinity, and thus can be used as alternative crops in salt-degraded soils without significant yield loss [18,19]. Among them, sweet basil (Ocinum basilicum L.) has a high commercial value because of its vast variety of uses [20]. Apart from culinary and ornamental use, basil has antimicrobial and medicinal properties that add potential to its further utilization and increase its commercial value [21]. The aim of the present study was two-fold: (i) the exploration of the salinity tolerance thresholds of basil toward the best compromise between yield and the content of ascorbic acid and amino acids, combined with (ii) the evaluation of basil as a candidate for cascade hydroponics. Here, we report the implementation of two separate experiments, the first determining the tolerance thresholds of basil exposed to three salinity levels, through its response in terms of growth, antioxidant capacity, nutrient concentration, and amino acid profile; and the second examining the same response variables in an experimental set-up in which basil was the secondary crop irrigated by the drainage solution of a primary crop; i.e., cucumber, a commercial high-value crop that is commonly cultivated in soilless systems.

2. Materials and Methods

2.1. Plant Material and Experimental Design

This study was conducted in the greenhouse premises of Hochschule Geisenheim University in Geisenheim, Germany during the summer months of 2018. The mean monthly temperature during the experimental period ranged from 22.4 to 27.0 °C, and crops were grown under ambient light conditions, with 517 μmol m−2 s−1 average light intensity. Basil seeds of the Genovese (Eowyn) variety were sown in 3 L pots containing a mixture of peat and perlite (2:1). After two weeks, basil plants had reached the two true leaves stage. For the first experiment, a total of 40 pots with 25 plants each were selected. The pots were divided into four treatments with 10 replicates each, and were irrigated daily with a nutrient solution of four salinity levels; i.e., 2 dS m−1 (control), 5 dS m−1 (T5), 10 dS m−1 (T10), and 15 dS m−1 (T15). Commercial fertilizers were used to build up the selected salinity levels. Table 1 summarizes the elemental composition and concentration of each nutrient in the irrigation solution used for the four treatments. The pots were arranged according to the randomized complete block design, and frequent rotation (every 10 days) was performed to minimize the impact of the microenvironment. The experimental period lasted five weeks, during which two harvests were performed, 15 and 35 days after commencement of the salinity treatment.
In the second experiment, a cascade system was established with cucumber as a primary crop grown in hydroponics, the drainage of which was driven to basil grown in pots as a secondary crop. A total of 36 cucumber plants were planted in six rows, each composed of two rock wool slabs (Grodan, Roermond, the Netherlands; length: 1 m; volume: 11.25 L) planted with three cucumber plants each. The primary crop plants were allocated to three groups, with 12 plants each. The drainage of each group was driven to a tray upon which 12 pots were placed and received this capillary irrigation, with no additional watering throughout the experimental period. Each pot contained 25 basil plants, as described above. Thus, three replicates of the drainage solution treatment were formed while the control group of basil (also 12 pots) received fresh nutrient solution, the same that was prepared for cucumber. The latter was a standard nutrient solution for cucumber grown in open hydroponic systems, with the following composition: 3.0 mM K+, 6.0 mM Ca2+, 2.0 mM Mg2+, 1.0 mM NH4+, 11.5 mM NO3, 1.5 mM H2PO4, 3.5 mM SO42−. The electrical conductivity (EC) was set at 2.1 dS m−1 and pH 5.7. The EC range of the drainage solution that irrigated the treated basil plants was 3.2 ± 0.3 dS m−1, and its composition was 4.1 ± 0.3 mM K+, 7.1 ± 1.0 mM Ca2+, 2.2 ± 0.6 mM Mg2+, 13.2 ± 2.8 mM N, 1.7 ± 0.3 mM P+ (average ± SD from three measurements during the experimental period). The same experimental duration and harvest times as for the first experiment were applied.
The following methods and sampling protocols for the growth and biochemical parameters determination apply to both experiments described above.

2.2. Plant Growth

Plant height was measured at intermediate and final harvest. At the same time-points, projected leaf area was determined through capturing photographs from the same height above plants and subsequently using the free software ImageJ (open-source software, ImageJ.net/ver. ImageJ 1.51j) to estimate the green area of the plants. At the intermediate and final harvests, five random plants were selected from each pot. Leaves and stems were separated, the fresh weight was measured immediately, and all the samples were oven dried for four days at 55 °C and weighed for biomass assessment.

2.3. Nutrient Element Analysis

After the determination of dry weight, 0.25 g of leaf tissue from each sample was used to conduct the nutrient elemental analysis. A modified Kjeldahl extraction was used for the mineralization of all nutrients. Each leaf sample was extracted with 4.4 mL of the digestion solution, which included 1.94 mL concentrated sulfuric acid, 2.82 mg Se, 82.13 mg Li2SO4, and 1.94 mL 30% H2O2. The samples were digested for two hours at 30 °C, then left to reach room temperature, and finally diluted up to 50 mL with distilled water before proceeding to elemental analysis. The concentrations of N, P, K, Ca, Mg, Fe, Zn, Mn, and Cu were determined by ICP-OES (Spectro Arcos EOS 12 ICP—OES Spectrometer, SPECTRO Analytical Instruments GmbH, Kleve, Germany) and flow injection analysis (Foss Tecator FIAStar 5000, FOSS, Hilleroed, Denmark). The concentration of macronutrients (N, P, K, Ca, Mg) and micronutrients (Fe, Zn, Mn, Cu) are expressed in % and mg/kg of leaf dry weight, respectively.

2.4. Ascorbic Acid Content

For each treatment, 20 individual plants were used to constitute five samples. For each plant, all the leaves were removed and grounded in liquid nitrogen. The ascorbic acid content was determined according to Pegg et al. (2007) [22]. First, 100–200 mg of tissue per sample was homogenized using 5 mL of 80% ethanol. The homogenate was mixed threefold using a vortex for 5 s. The samples were submerged in an iced ultrasound bath for 15 min. After that, the samples were centrifuged at 1792× g for 15 min at 0 °C, then 1 mL of supernatant was transferred into cryogenic Eppendorf vials and stored at –80 °C. The ascorbic acid content (mg AsA/g of dry tissue) was determined based on photochemoluminescence (PCL) with the PHOTOCHEM Antioxidant Analyzer (Analytik Jena GmbH, Jena, Germany).

2.5. Amino Acids

The sample preparation followed the procedure described above for the ascorbic acid determination. Concerning the extraction, 100–200 mg of tissue per sample were homogenized using 2 mL of polyvinylpyrrolidone (PVP) 100 buffering solution. The homogenate was mixed using a vortex for 5 s. The samples were submerged in an ultrasound bath for 15 min. After that, the samples were centrifuged at 1792× g for 15 min at 4 °C. The supernatant was filtered through a 0.2 nm cellulose filter to sealable glass vials. The concentration of amino acids (mg/kg of fresh tissue) was determined using an automatic Amino Acid Analyzer (SYKAM s433, Sykam GmbH, Fürstenfeldbruck, Germany).

2.6. Statistics

Statistical analysis was performed with IBM SPSS Statistics v.26 software, using one-way ANOVA, followed by Tukey’s HSD post hoc tests, and confidence intervals for p ≤ 0.05.

3. Results and Discussion

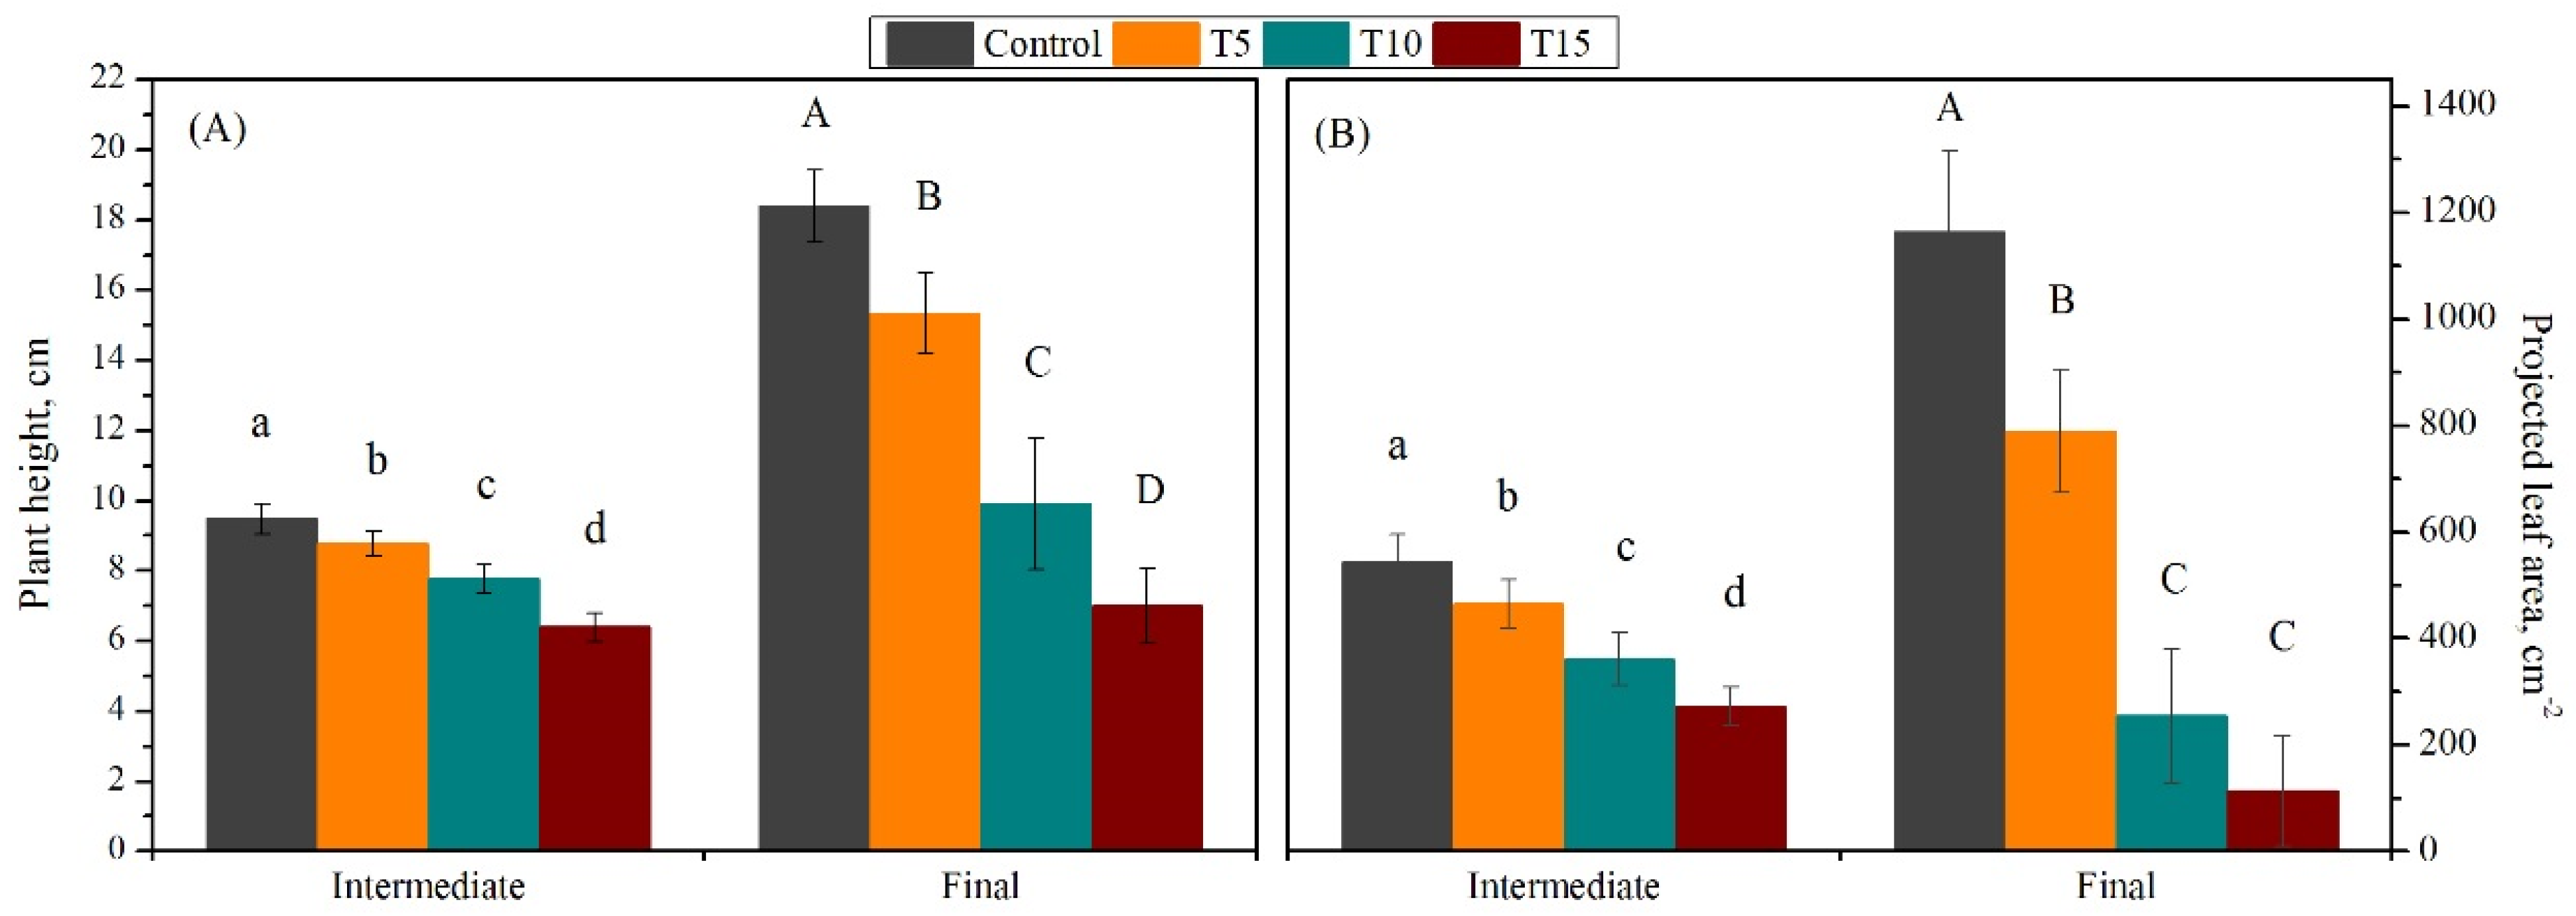
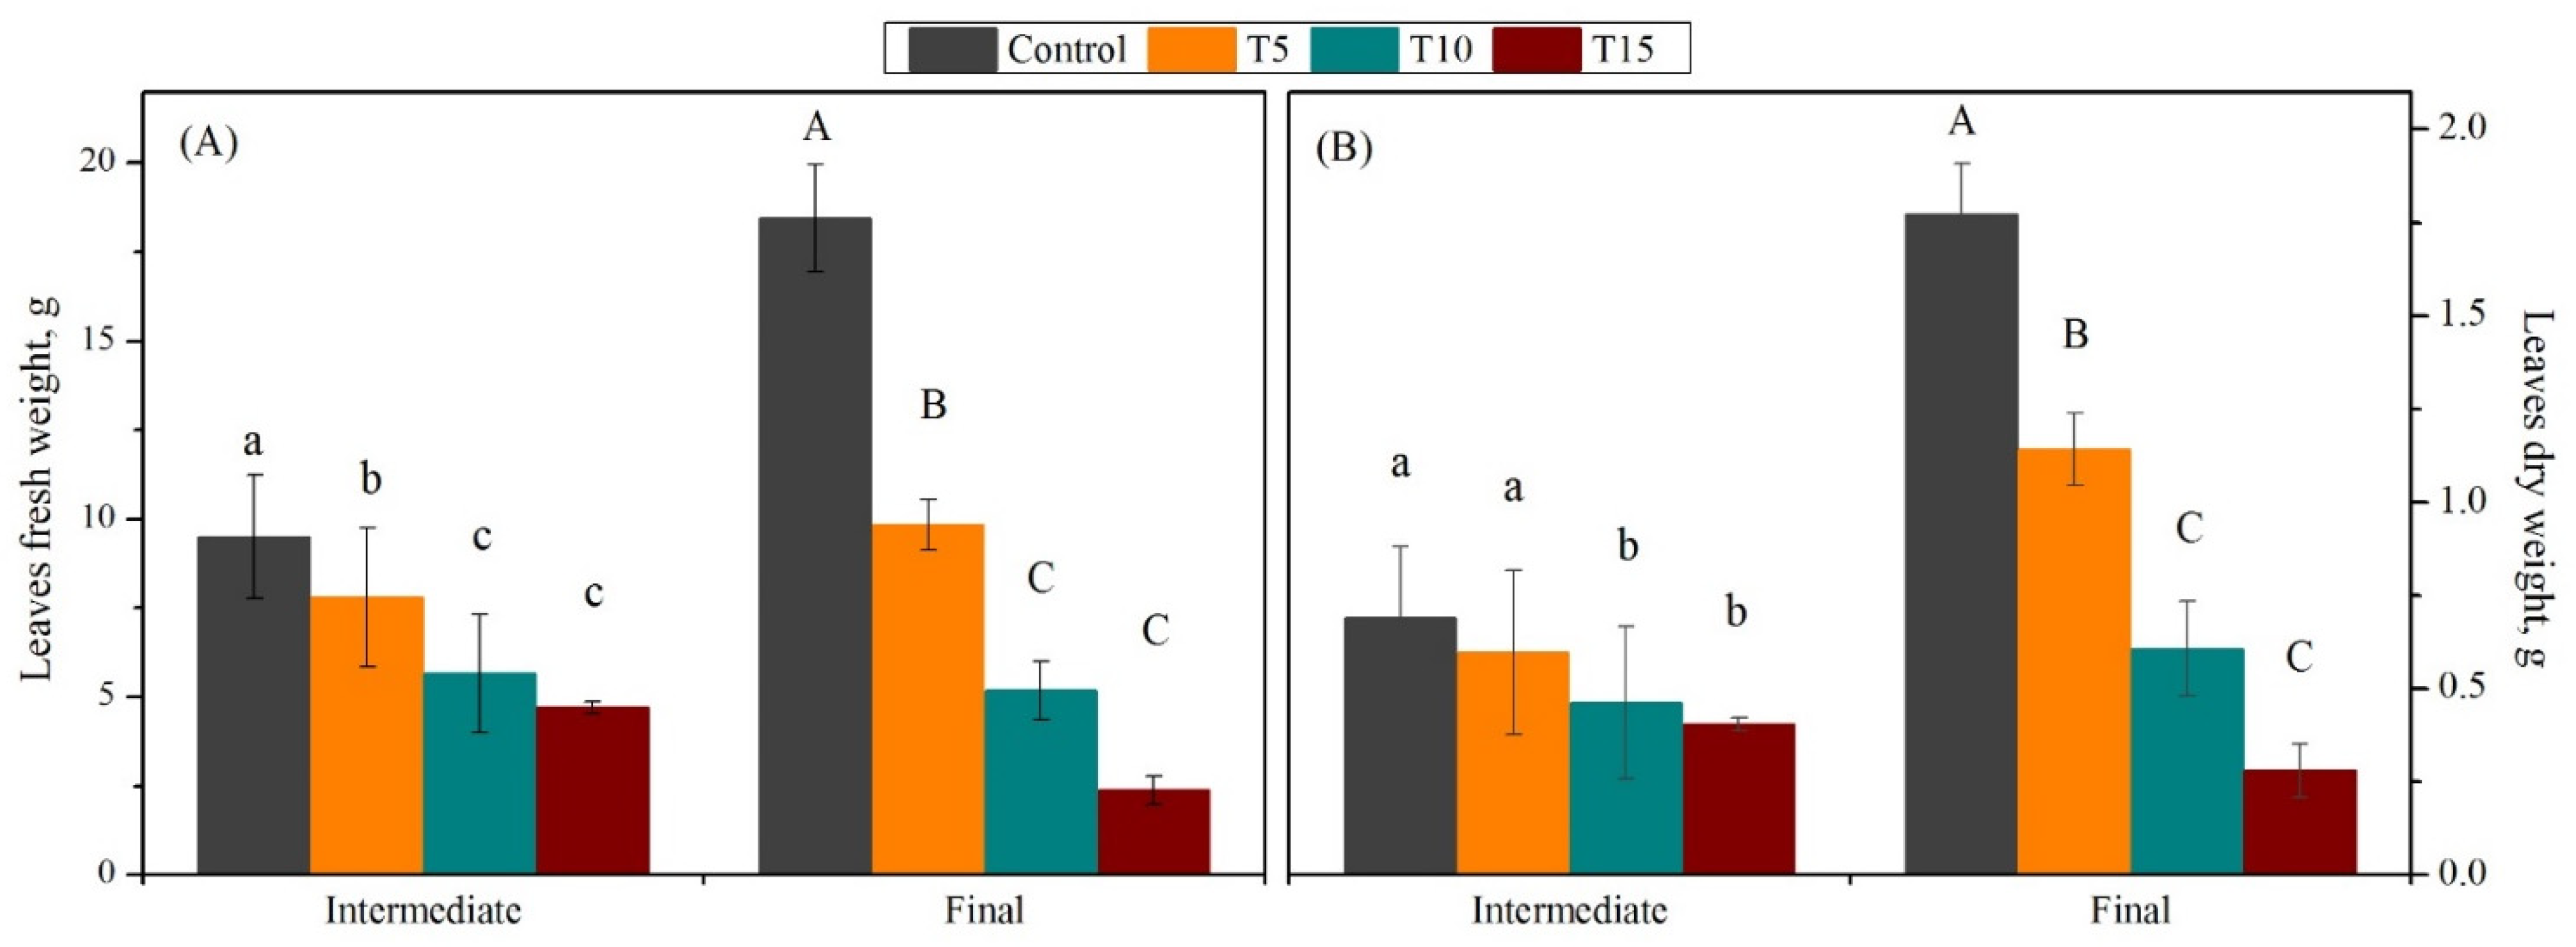
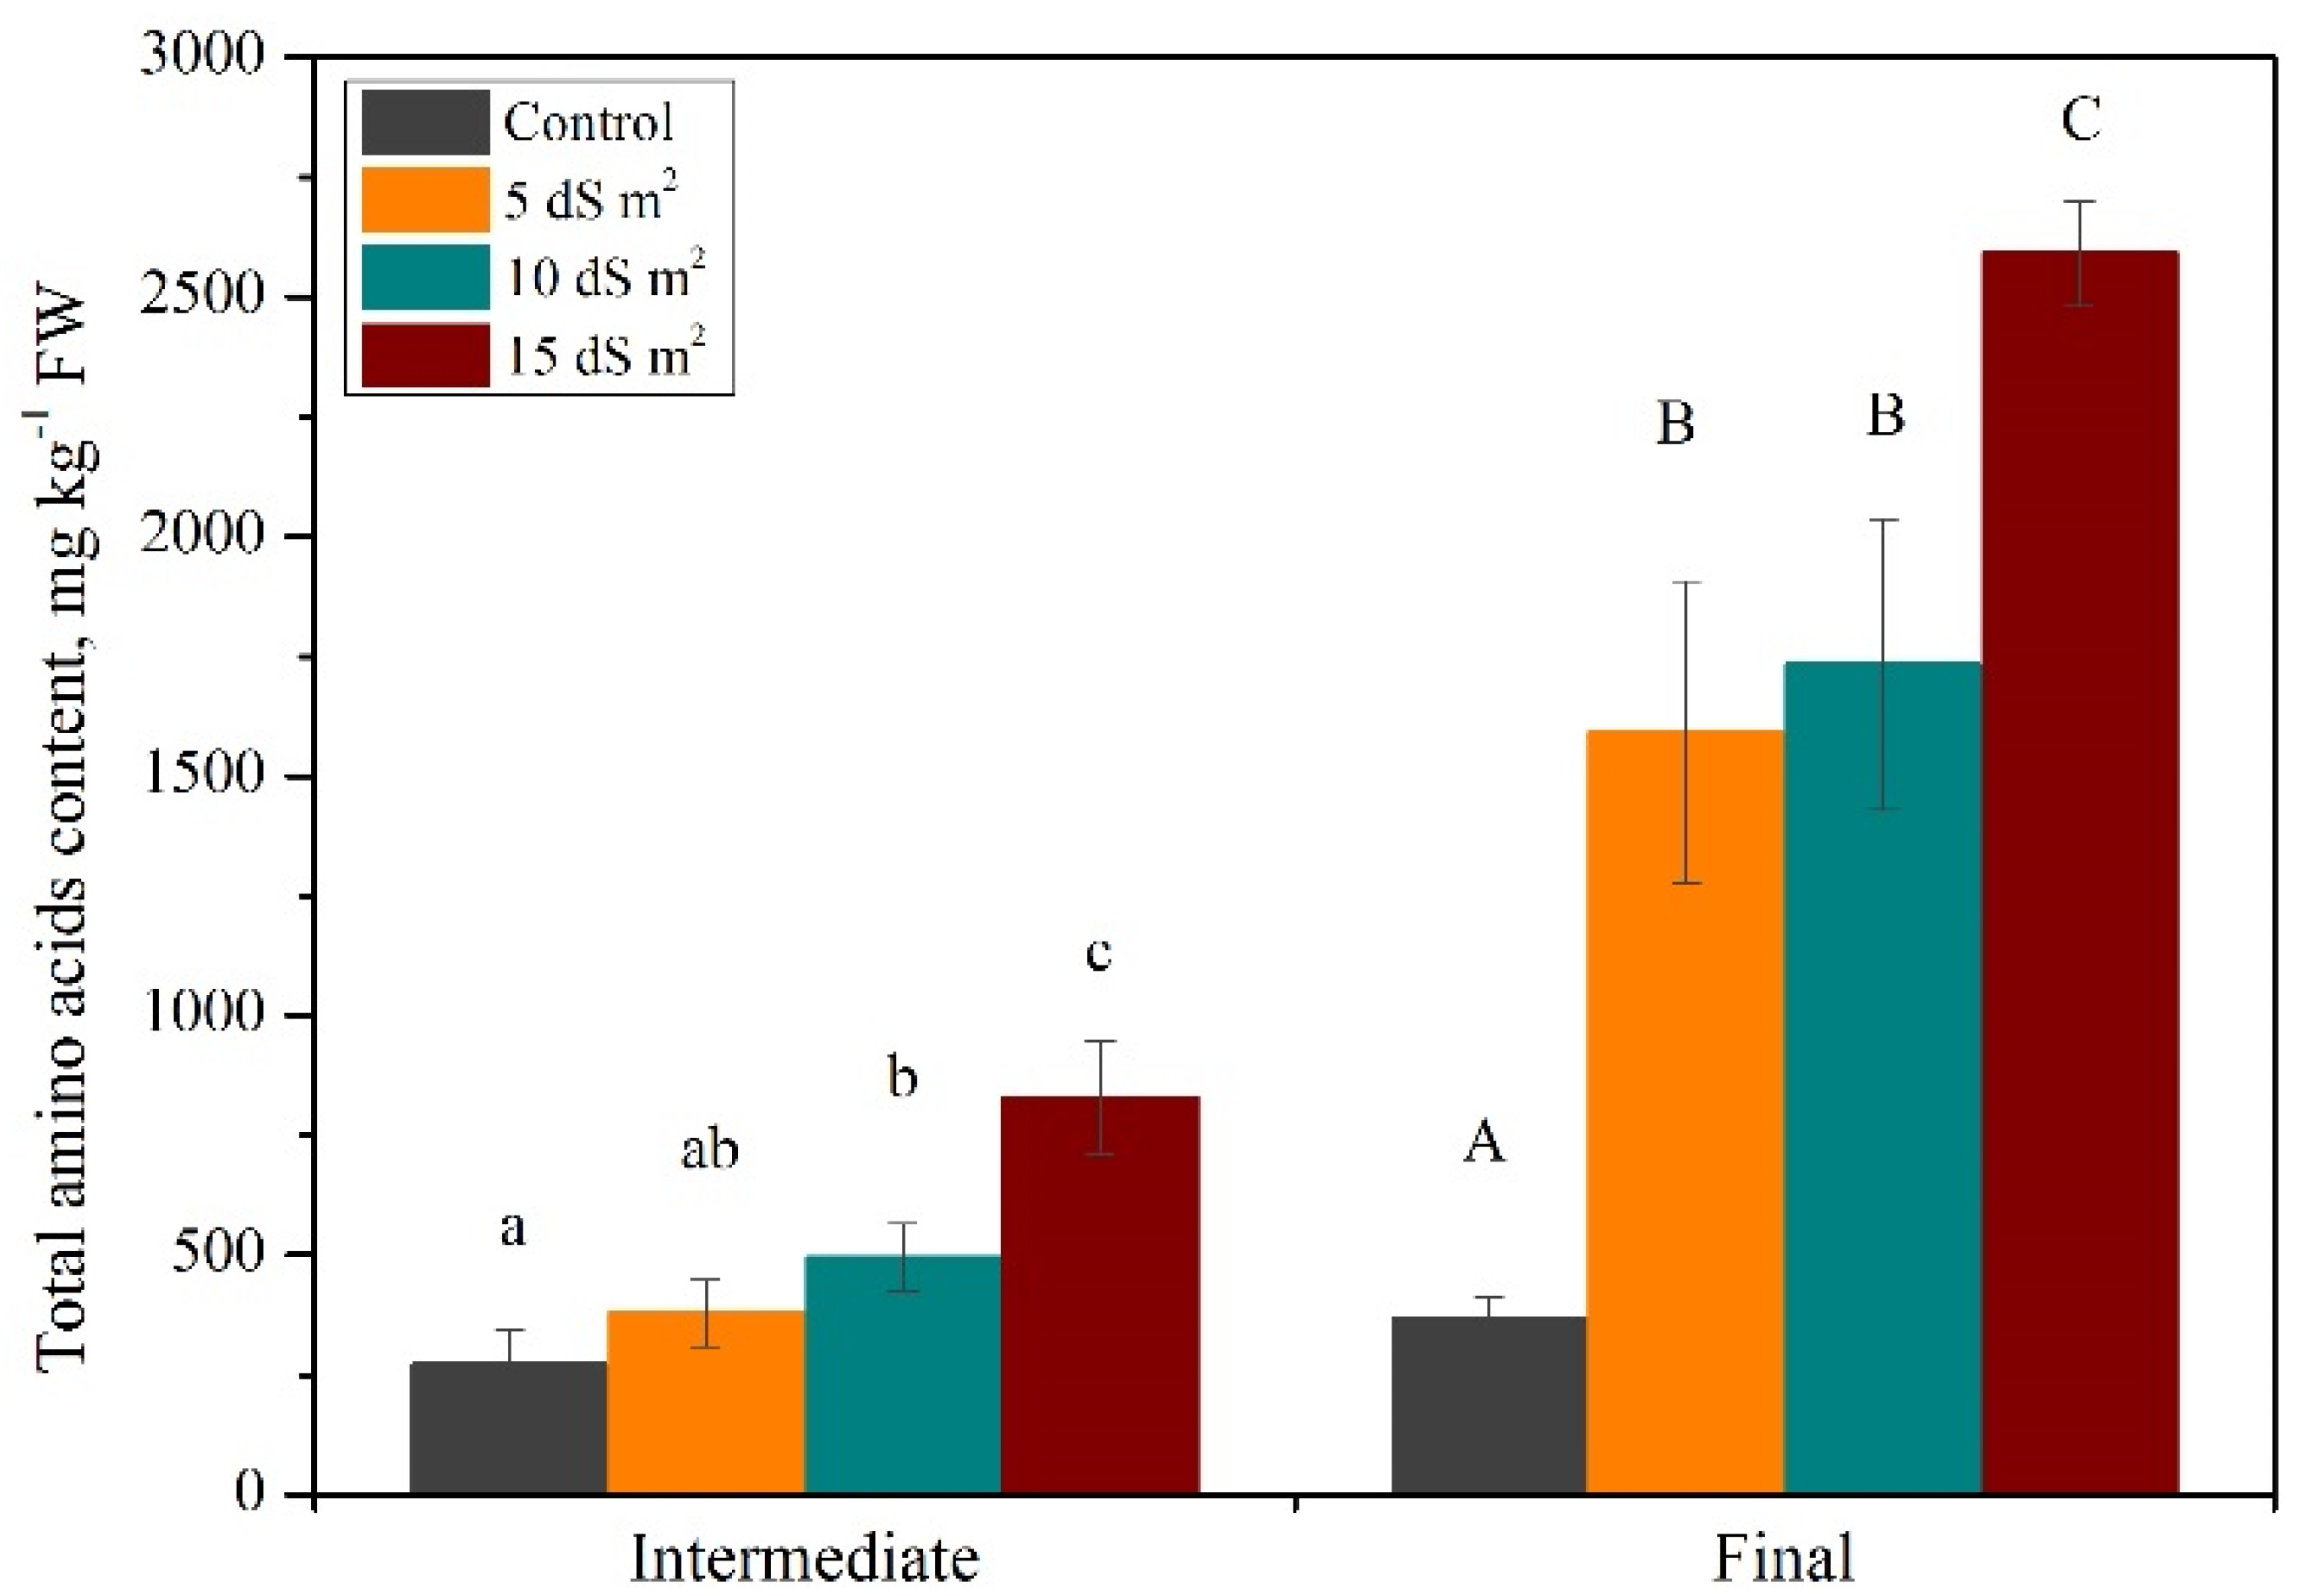
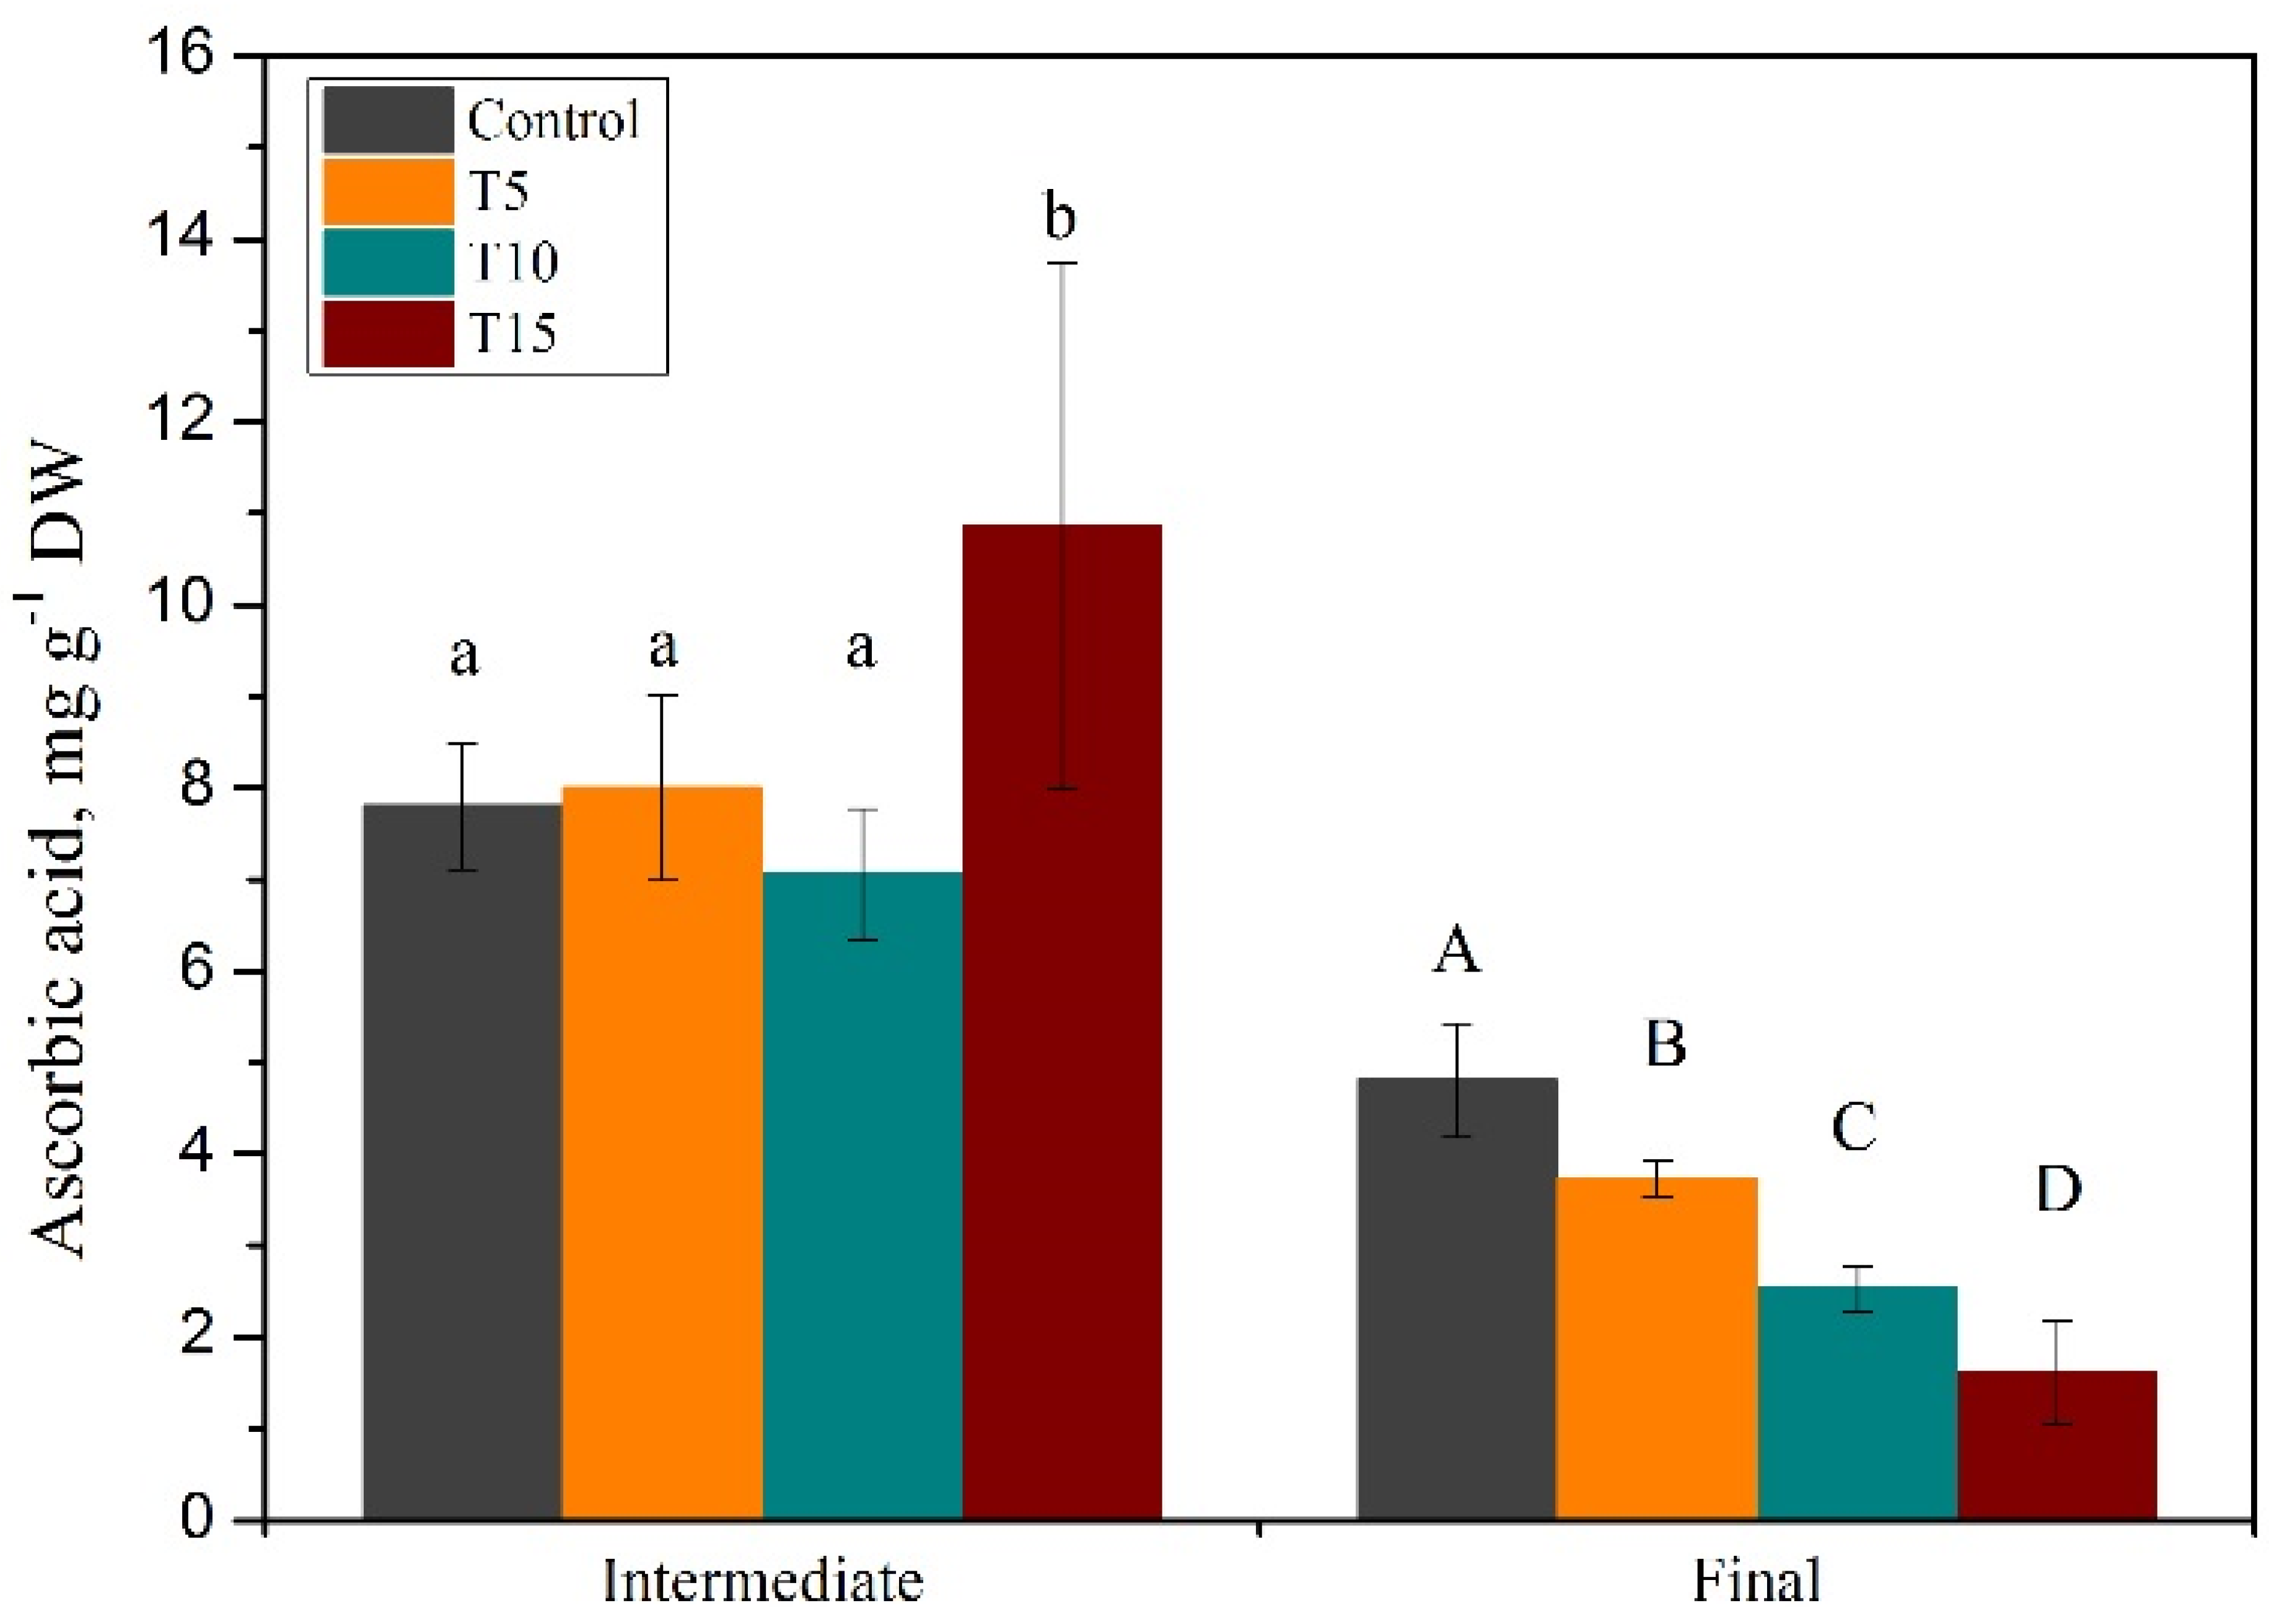
3.1. Exploration of Salinity-Tolerance Thresholds of Basil

In the first experiment, we evaluated the productivity as well as quality parameters of basil exposed to various levels of salt stress to explore its tolerance thresholds. Moreover, we performed an evaluation with two time-points, including an intermediate harvest before the final one to identify crucial patterns of response and the course of growth performance.
Basil’s growth response to increased salinity confirmed its moderate potential to cope with this stress condition. Plant height reduction was evident at both intermediate and final harvest (Figure 1A). In the latter, T5 slightly reduced plant height, but with statistical significance, while T10 and T15 severely affected it, resulting in a decrease of 46 and 62%, respectively, compared to the control. After only two weeks of exposure to stress, the treated groups began to differentiate from the control plants, and these differences were magnified in the final harvest. The same profile was followed by another indicative growth parameter, the projected leaf area, as shown in Figure 1B. The between-treatment differences over the course of the experiment were clearly reflected in both intermediate and final harvest values of projected leaf area, showing a significant stepwise reduction with increasing salinity levels (Figure 1B). The time-point of 15 days seemed to be crucial for all growth responses of basil, since it marked the establishment of the first statistically significant differences compared to the control. This applied not only to height and leaf area, but also to the plant fresh weight and dry biomass production. Figure 2A presents the fresh weight as determined in the intermediate and final harvest. After 18 days of exposure, T5 caused a small but significant decrease of 18% compared to the control, and this was maximized to 47% at the final harvest. T10 and T15 considerably suppressed fresh weight production, reaching a remarkable 72% and 87% reduction of control values, respectively, at the end of the experiment. Similar severe reduction was evidenced in basil dry biomass accumulation (Figure 2B). In the relevant literature, there are some studies on basil indicating that certain varieties are tolerant to salinity levels even higher than those examined in the present study [20]. Nevertheless, most similar works emphasize the limited potential of basil to cope with salinities higher than 5 dS m−1, corroborating our results [23,24]. Indeed, increased salinity was found to negatively affect basil height [12] and have a detrimental effect on basil’s canopy area [25,26], while Caliskan et al. (2017) [27] indicated a negative correlation between the accumulation of dry matter and increased salinity. The various aspects of basil growth performance in the present study collectively indicated the 5 dS m−1 salinity level as the upper limit/threshold of tolerance to stress, and 15 days of treatment as the critical point for the appearance of salinity symptoms on growth. It is well documented that during the early phase of salinity stress (first days), the growth reduction is ascribed to decreased leaf emergence and expansion [28,29]. The underlying mechanisms are related to osmotic stress, which affects the availability of water to the plant body with profound effects on stomatal conductance, cell cycle, and cell expansion. Apart from the rapidly occurring water stress, the evolution of oxidative stress by uncontrolled production of ROS, as well as nutrient imbalances, may account for the compromised growth under enhanced salinity [26,30]. Accordingly, the time frame of 15 days (intermediate harvest) and, moreover, 30 days (final harvest) in the present experiment may be adequate for these stresses to be developed. In an article demonstrating both the water stress imposed and the antioxidant response of salt-affected basil, Barbieri et al. (2012) [31] reported that the constitutively reduced stomatal density improved the acclimatization of the more tolerant basil variety to salinity stress, along with the efficient production of antioxidants.
The total concentration of amino acids in basil leaves showed a sevenfold increase under 15 dS m−1 and 4.5-fold under 5 and 10 dS m−1 compared to the control at the final harvest (Figure 3). Statistically significant but smaller differences between the treatments were also recorded in the intermediate harvest. It was noteworthy that the total amino acid content of the control plants remained virtually unchanged between the intermediate and final harvests, while saline treatments induced a three- to fourfold increase. An accumulation of free amino acids has been usually reported in various plants exposed to abiotic stress [32,33]. Neto et al. (2019) [21] measured the total content of amino acids of two basil varieties grown under 80 mM NaCl and reported a marginal increase in both leaves and roots. There is a tight relationship between amino acid metabolism and plant response to stress, due to the multiple roles of certain amino acids in stress mitigation; i.e., osmoprotectants, ROS scavengers, N source and storage, and as alternative substrates for mitochondrial respiration [32,33,34]. Whether from a direct salinity-induced effect or basil’s response in the adaptation process, the increase of total amino acid content indicated metabolic adjustments and was particularly ascribed to specific compounds. To the best of our knowledge, this is the first report of salinity effects on the detailed amino acid profile of basil. Notably, it was obvious in the individual amino acid concentrations (Table 2) that glutamine and arginine showed a significant increase at both intermediate and final harvests in all salinity levels. At the final harvest, the asparagine was also responsive to the imposed stress in a salinity level-dependent manner. In fact, the above-mentioned amino acids presented an eight- to 12-fold increase in T15 compared to the control, substantially contributing to the enhanced levels of total amino acid content shown in Figure 3. The results presented are in accordance with other authors, who suggested that amino acids such as asparagine, arginine, and glutamine, as well as proline, function as compatible solutes combating osmotic stress within plant cells [32,33]. Asparagine accumulation may also play a role in nitrogen remobilization and ammonia detoxification during abiotic stress [35], while the role of arginine as precursor of the stress-induced polyamines is well documented [32].
Ascorbic acid (AsA) is directly involved in salinity stress protection, and particularly in basil, it has been identified as a good indicator of the total antioxidant capacity [36]. The AsA content of T15 plants was severely suppressed at the final harvest, although at the intermediate harvest showed a statistically significant increase compared to all other treatments (Figure 4). Only T5 plants displayed similar AsA concentration with the control group. High levels of AsA effectively maintain low levels of H2O2, which may prevent the H2O2-mediated stress responses and can therefore contribute to overcome saline stress [31]. The enhanced AsA content at the intermediate harvest in the T15 group may reflect this process. Nevertheless, the decreased levels of AsA after prolonged salinity stress in all treated plants may have multiple explanations, pointing to the parallel and overlapping mechanisms that control and modulate physiological responses to stress. Possibly the extensive utilization of AsA for the detoxification of H2O2, accompanied by the inefficient regeneration of ascorbate, as proposed by Barbieri et al. (2012) [31], may explain the decreased concentration at the end of the growth period. Overall, after 15 days of saline treatment, the protection that AsA confers to basil plants may be considered insufficient. It should be noted here that although the AsA concentration is correlated with salt tolerance, it is obviously not the only responsible substance, since other physiological mechanisms and metabolites, not determined in the present study, may also contribute.
High salinity interferes with uptake and assimilation of certain nutrients [37], mainly through alterations in related enzyme activity. The source of salinity; i.e., the composition and concentration of salts in the irrigation water or nutrient solution, significantly shapes the type and magnitude of nutrient-related problems; deficiencies, ion toxicities, and altered ion balance and competition may differentially arise due to various salinity sources [38]. In salinity-related research, the use of NaCl predominates, yet there are many other sources of excessive salts that may impact crops, and their result in plant nutritional response may be different [12,39]. In the context of cascade hydroponics, using nutrient solutions of increasing elemental concentration, thus increasing EC, is a more realistic approach compared to NaCl addition. The enhanced EC substantially modified the nutrient absorption and content. Nutrient imbalances were found in basil plants exposed to salinity in both harvests of the current study (Table 3), with the effect being more pronounced at the intermediate harvest (15 days). At the final harvest, the leaf elemental concentration may reflect the trade-off between enhanced nutrient availability in the irrigation solution and the salinity effects on plant function and metabolism; accordingly, we followed the interference of imposed salinity to nutrient status. Under T5, T10, and T15, N content in leaf tissues was increased at both harvest dates compared to the control. The opposite trend has also been reported by Elhindi et al. (2017) [23], but the differences may be ascribed to their use of NaCl for imposing salt stress, the longer duration of their experiment (57 days), and possibly to the different developmental stage of basil plants at their final harvest, since flowering alters nutrient allocation patterns. Indeed, NaCl-imposed salinity stress has profound effects on N concentration due to inhibition of NO3-transport systems [40]. Corroborating our results, Scagel et al. (2017) [39] found increased N content in basil leaves exposed to either NaCl- or CaCl2-induced salinity. N concentrations in basil in the present experiment, except for the increased availability in the irrigation solution, may also be related to the enhanced concentration of certain amino acids mentioned above. Indeed, the induction of glutamine and asparagine synthesis during stress has been linked to storage of organic nitrogen and transport within plants [33]. Phosphorus uptake was gradually decreased along increasing salinity (Table 3), a result that has been also found in NaCl-challenged basil [20,23]. According to Scagel et al. (2017) [39], the source of salinity determines the mechanism of P reduction, being either limited availability of phosphate ions or competition with other ions for binding sites within roots. Apparently, in the case of P in the current experiment, the salinity effect outweighed the increasing P supply by irrigation solution. Potassium content in leaves exhibited an interesting profile. T10 and T15 plants showed significantly lower K content compared to the control and T5 at the intermediate harvest, although their irrigation solution permitted increased K availability. An increase was evident during the last days, resulting in similar K levels in all treatments at the final harvest. This increase may be due to the role of K in osmoregulation, since it is considered, along with Cl, among the inorganic solutes with a greater contribution to the osmotic adjustment in basil [21]. Similar regulatory involvement in osmotic stress may be ascribed to Ca, the accumulation of which was induced by the two higher salinity levels at the early phase of stress. Ca content enhancement in leaves has been ascribed to its altered allocation under salt stress [40], which has been evidenced also in basil [39] as an increased translocation from root to shoot. The micronutrients determined in the present study showed distinct profiles along treatments and harvests (Table 3). A general trend was evident for lower values under salinity at the final compared to the intermediate harvest. Fe accumulation was suppressed under saline conditions, while Cu and Zn concentrations did not respond consistently. Nevertheless, the variation of Mn content was significant; at the intermediate harvest, increasing salinity induced a stepwise increase compared to the control, with almost doubled values under 15 dS m−1. The opposite effect was recorded at the final harvest, where an apparent suppression of Mn uptake and/or translocation to leaves was imposed by all salinity levels, resulting in decreased concentration. The salt-affected micronutrient content of basil leaves has been rarely determined. A recent study by Elhindi et al. (2017) [23] reported a general decline in concentration of all micronutrients when plants were exposed to 6 and 12 dS m−1. Scagel et al. (2019) [20] found that 5, 10, and 20 dS m−1 did not significantly alter Fe, Mn, and Zn concentrations. However, in an earlier work by the same authors [39], a substantially increased uptake of Cu and Zn was found, along with a reduced uptake of Fe with either NaCl- or CaCl2-imposed stress. Of course, the direct comparison with other works may be misleading, since it is documented that differences in salt source used and salinity tolerance among basil cultivars may account for specific effects on leaf nutrient composition [12,39].
In conclusion, the various aspects of basil growth and biochemical performance collectively indicated the 5 dS m−1 salinity level as the upper limit/threshold of tolerance to stress. Additionally, the results of the first experiment indicated the first 15 days of treatment as a critical point for the process of salinity-symptom appearance in growth performance, as well as mineral composition.

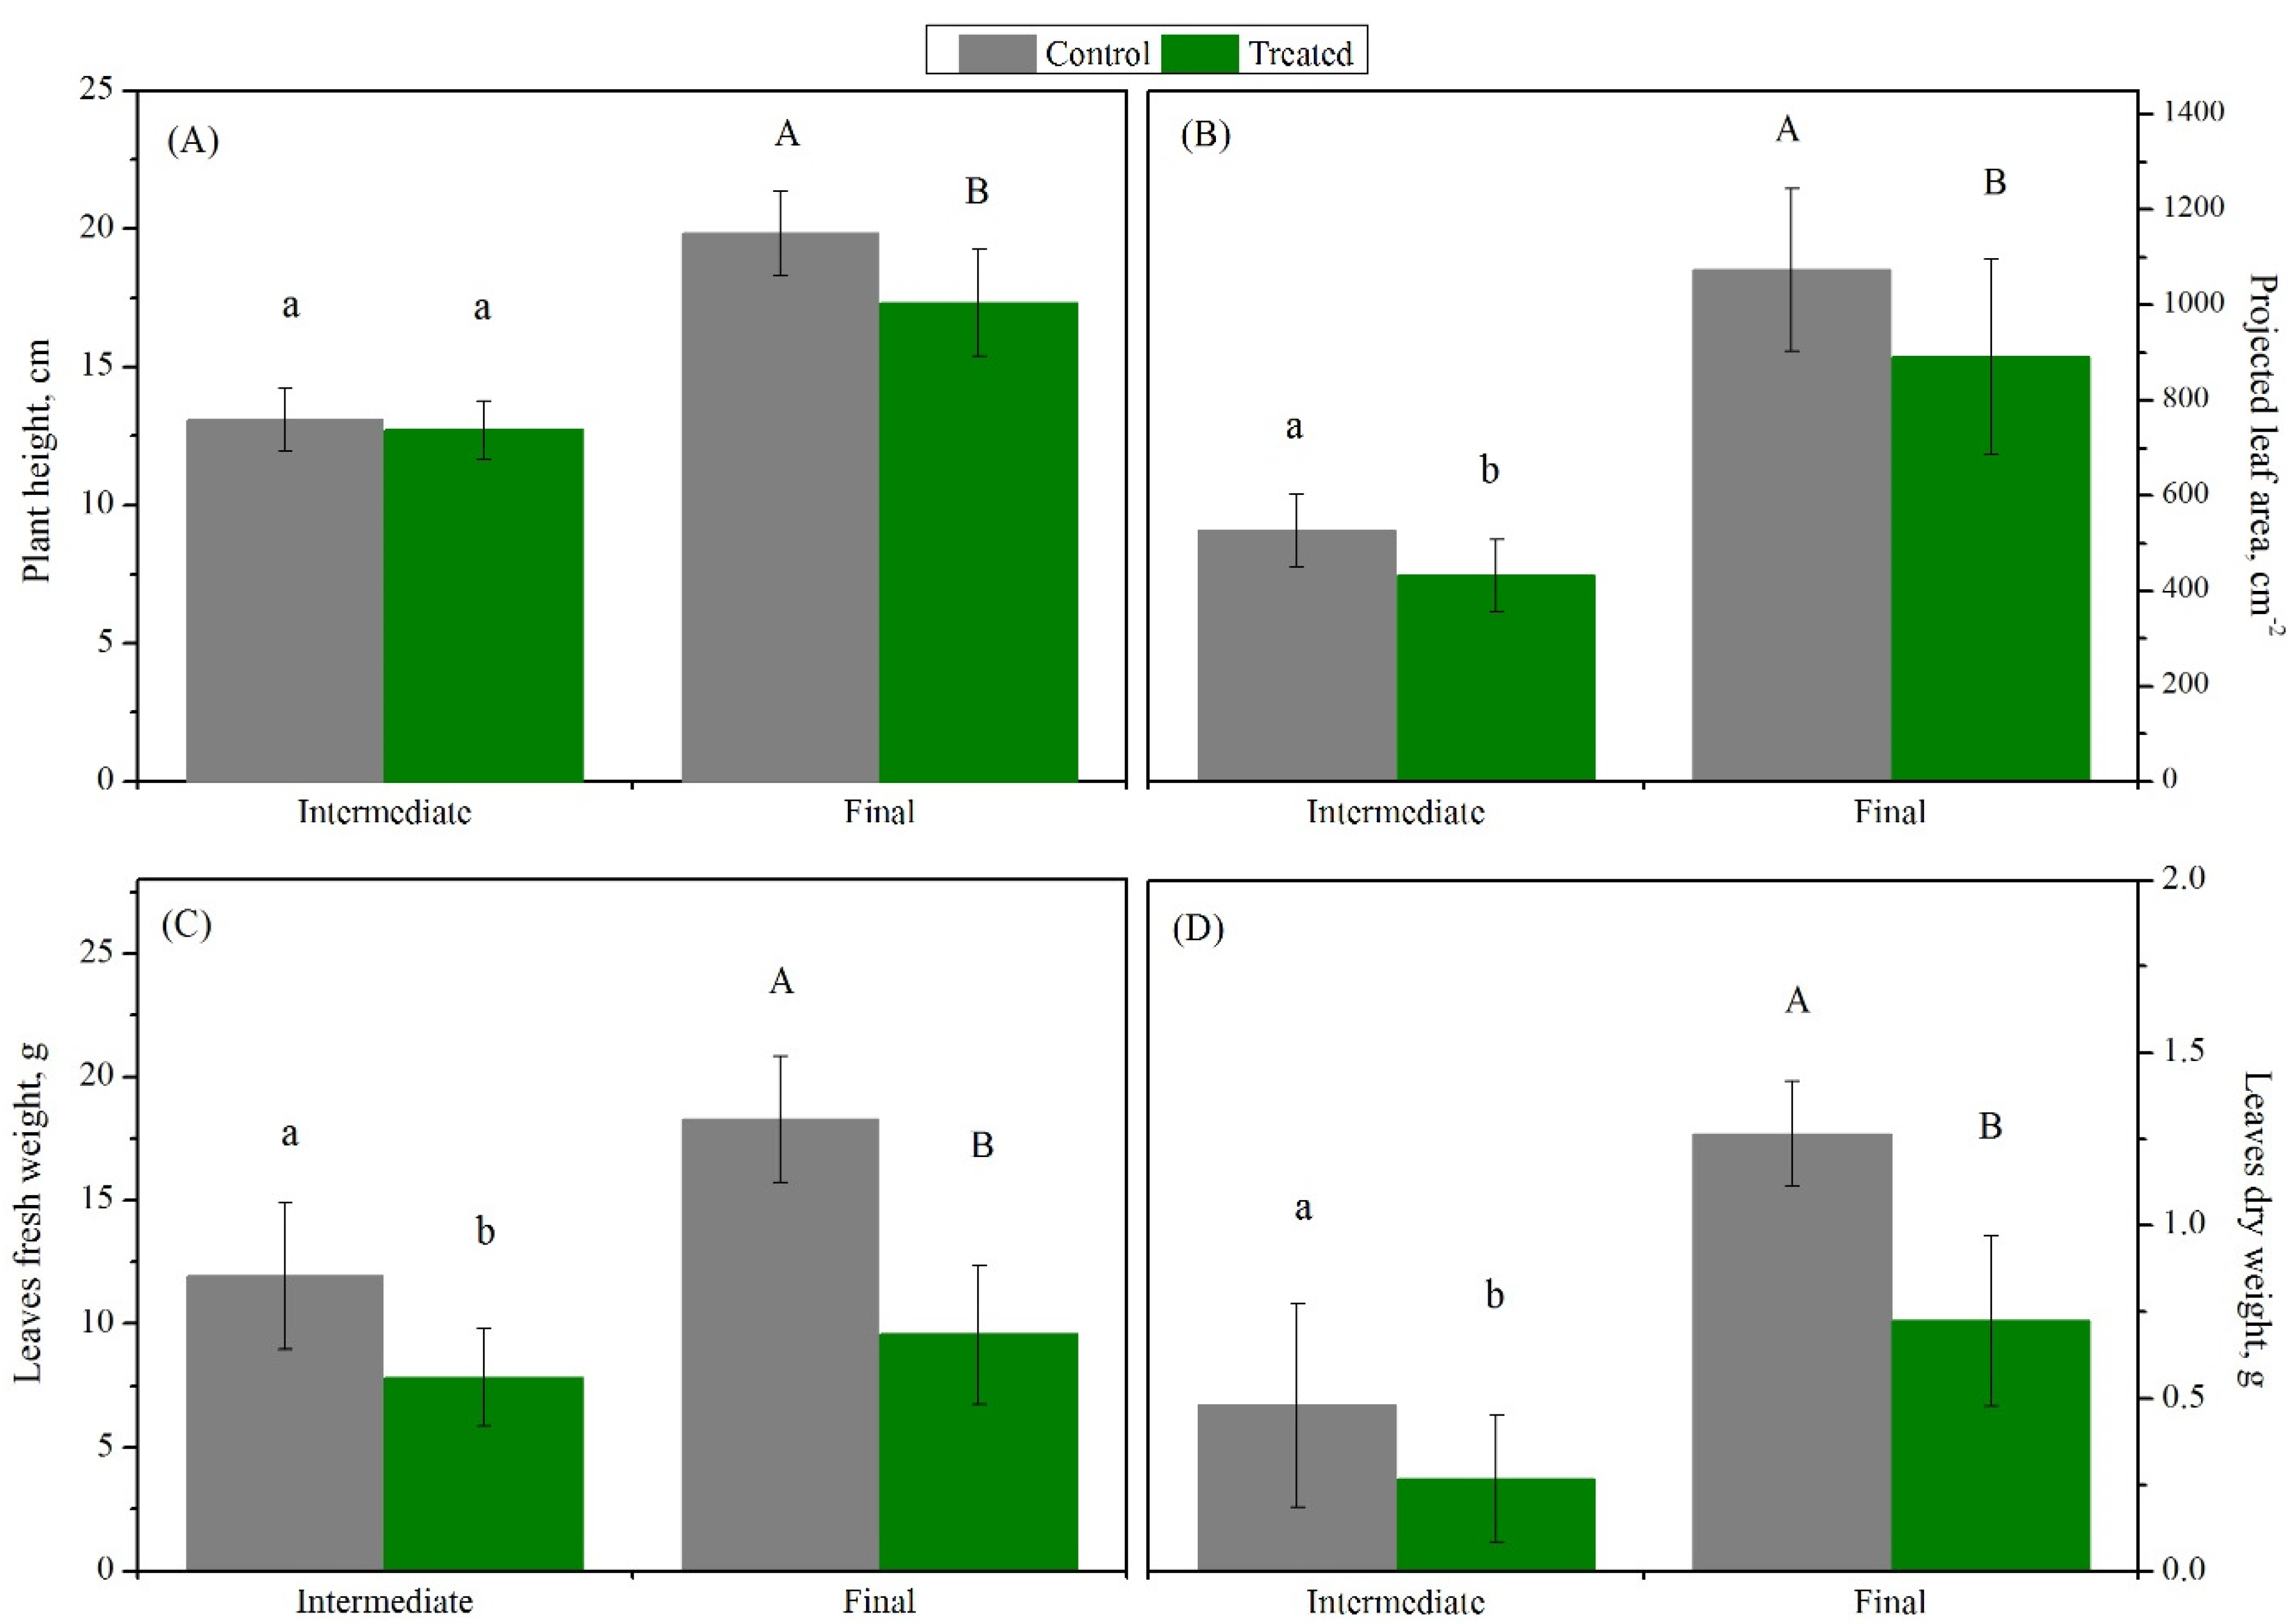
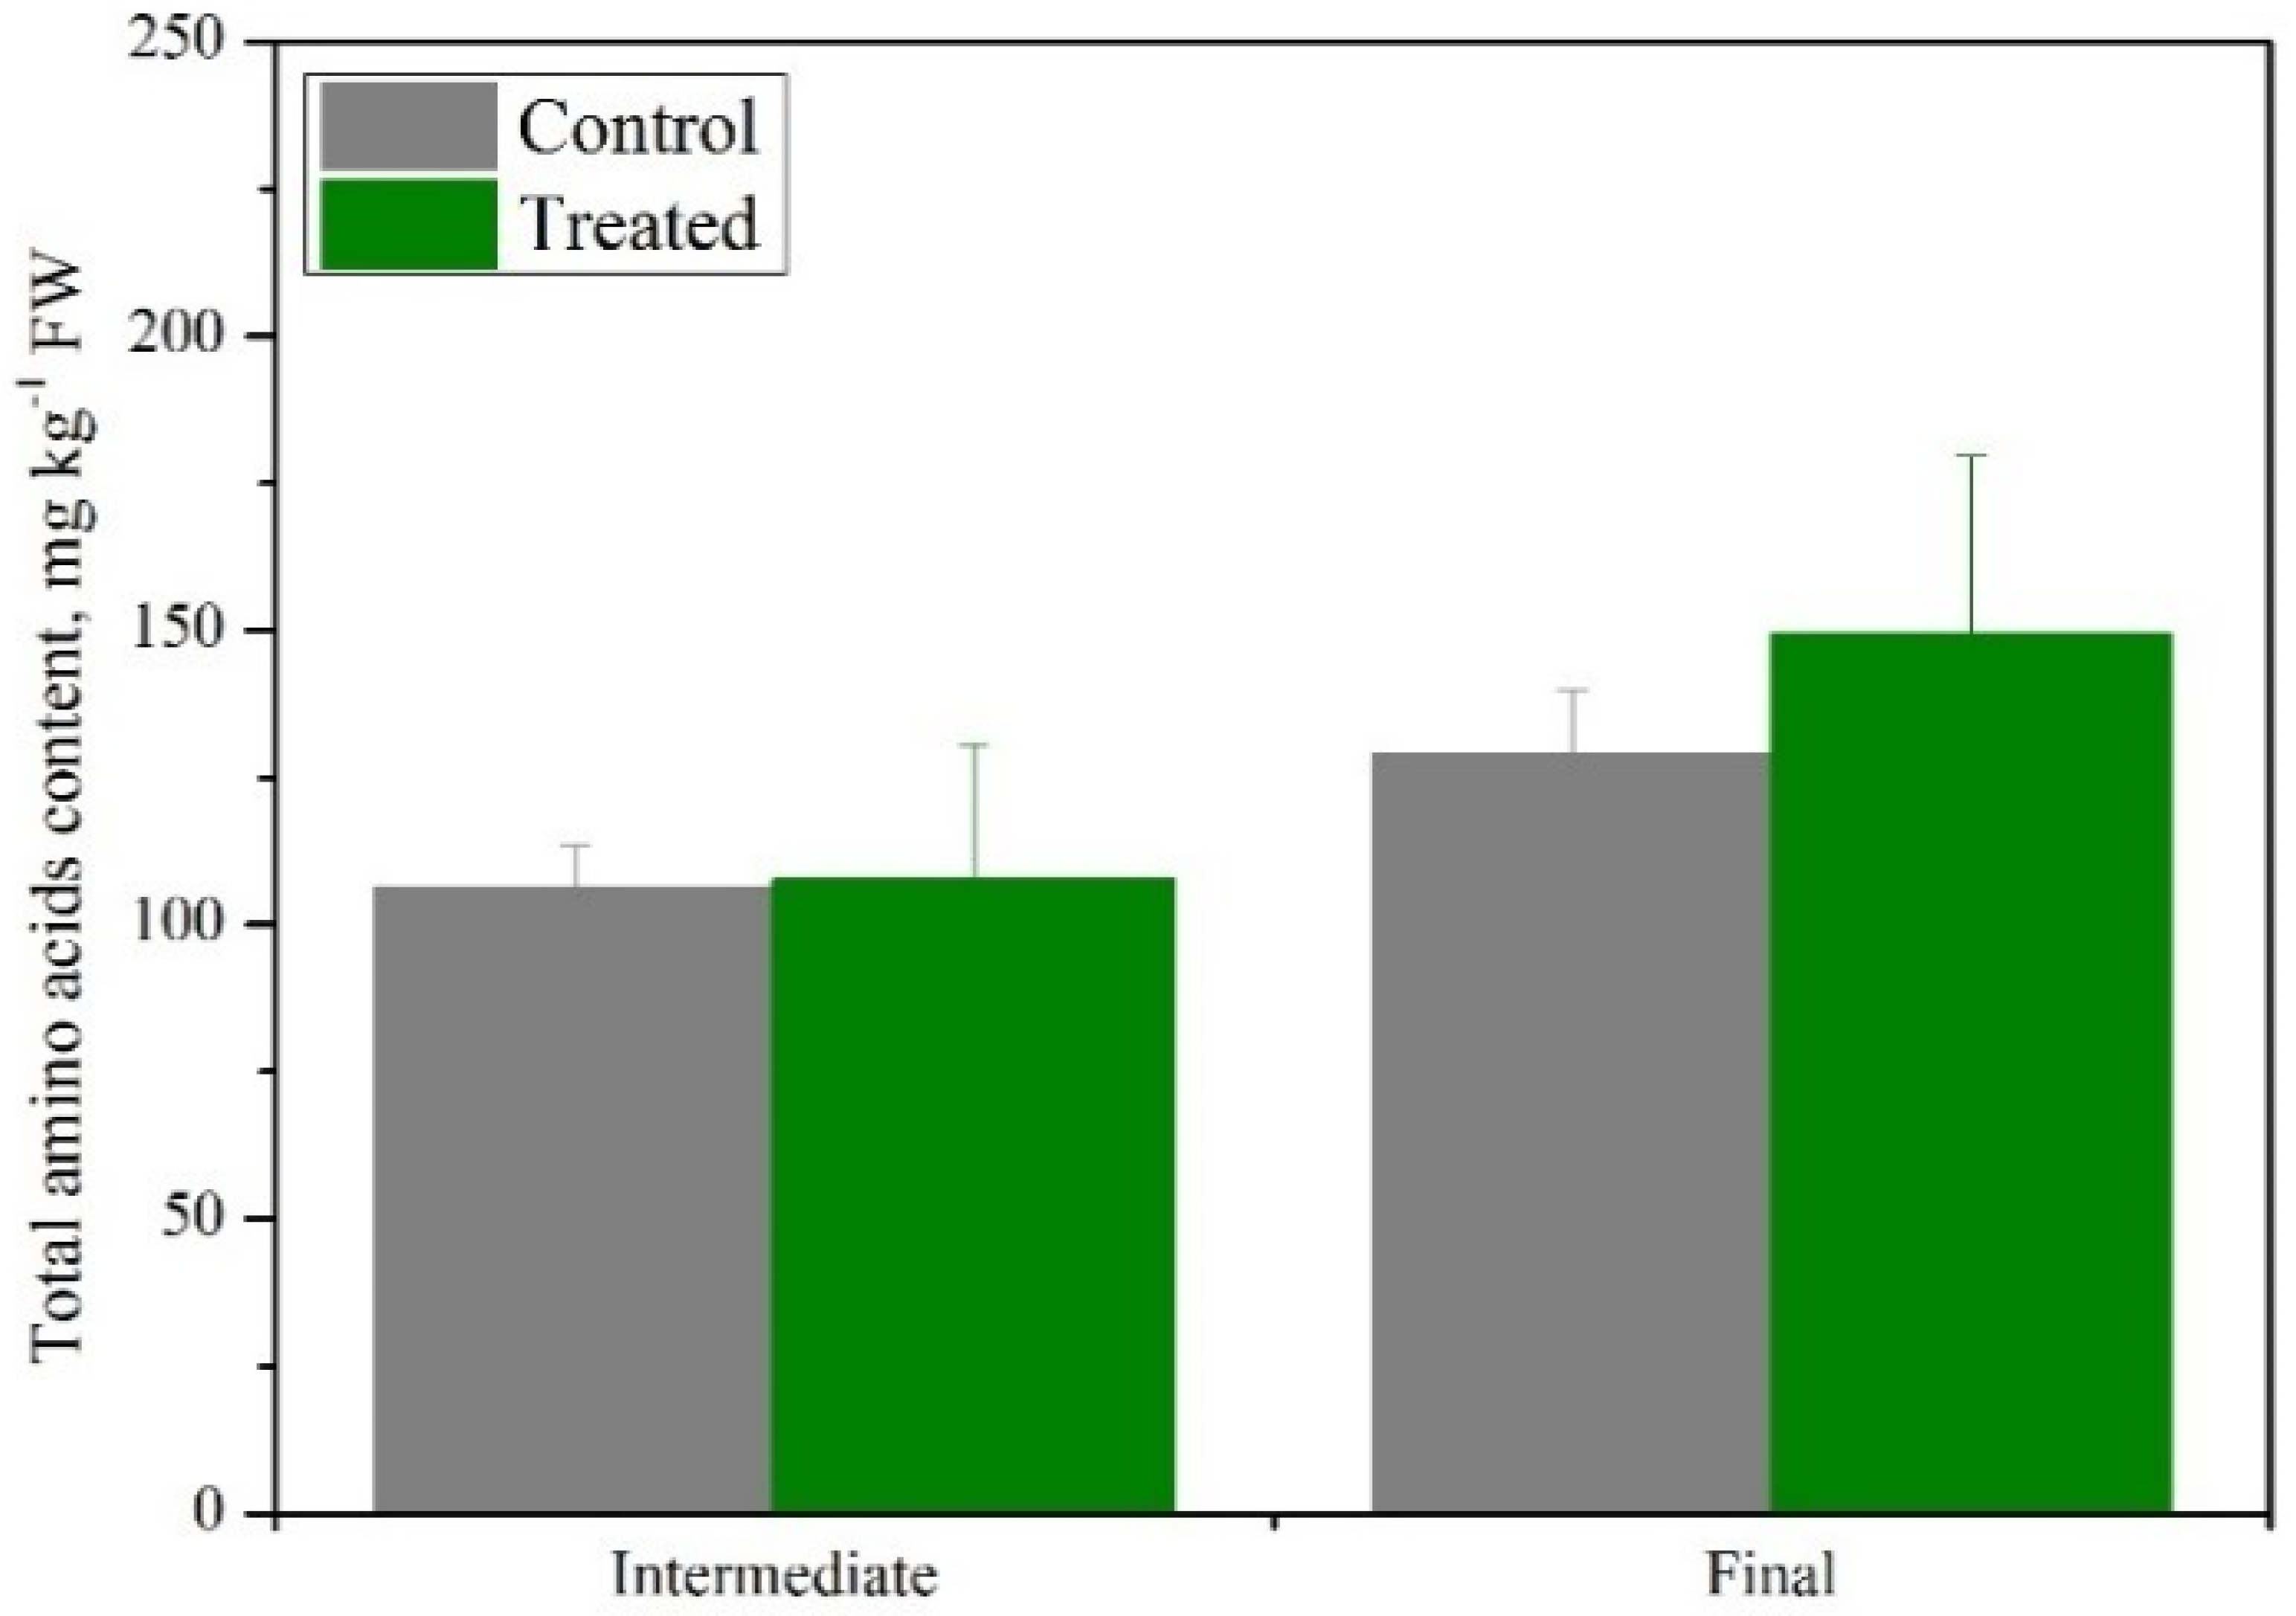
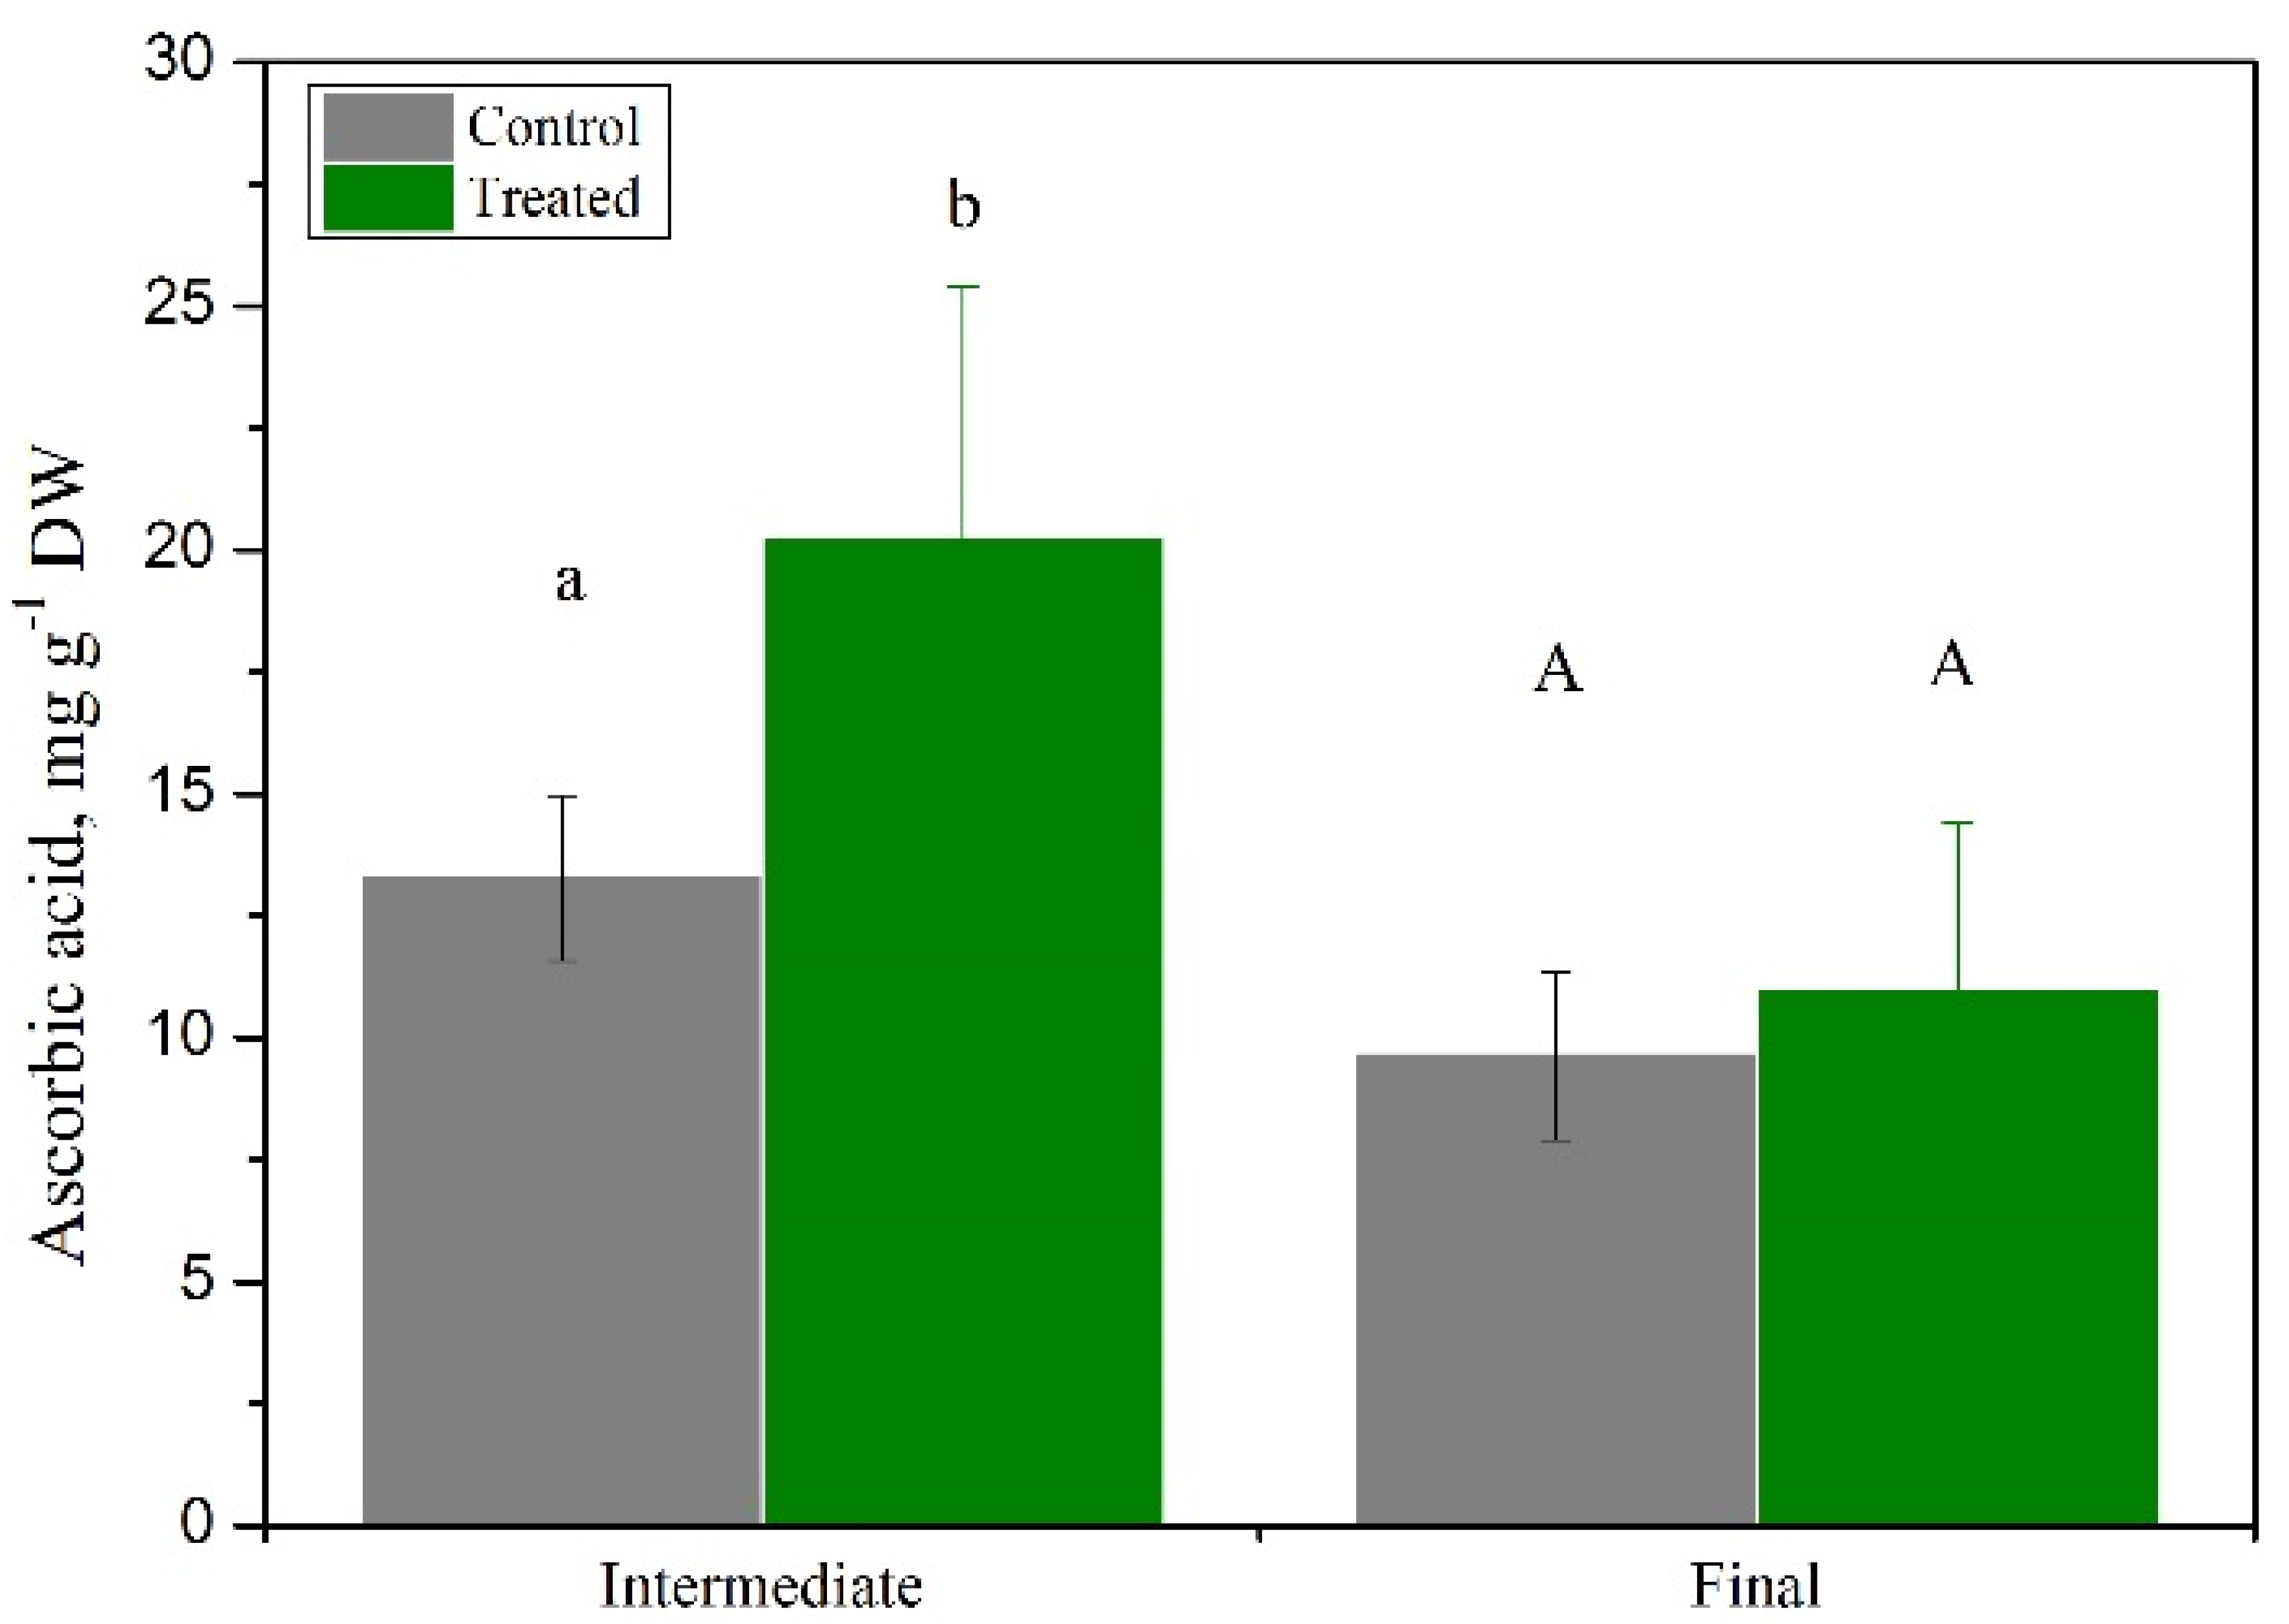
3.2. Is Basil Suitable as a Secondary Crop in a Cascade Hydroponics System?

Τhe second experiment was established to evaluate the suitability of basil as a secondary crop in a cascade hydroponics system. The inevitably moderate to high electrical conductivity of the solution that drains from the primary crop to the secondary one challenges the growth and functional performance and depends on the salinity-tolerance thresholds of the latter. In the current experiment, basil grown in pots directly received the drainage solution of cucumber grown in hydroponics without any further treatment.
The growth response of basil clearly correlated with the low salinity level of the first experiment analyzed above. Even though the EC of the solution that was channeled to basil never exceeded 3.5 dS m−1, a reduction of growth was evident, notably at the final harvest (Figure 5). All aspects of growth were affected by salinity to a different extent, ranging from 20% reduction of the projected leaf area to 47% and 42% reduction of the fresh and dry weights, respectively (Figure 5B–D). Similar growth restrictions were also recorded in the T5 plants in the first experiment (Figure 1 and Figure 2). Elvanidi et al. (2020) [5] reported similar reductions of basil grown in cascade hydroponics in which basil received only 40% of cucumber drainage complemented with typical irrigation water.
The total amino acid content of basil that received the drainage solution from cucumber (hereinafter referred to as “treated plants”) displayed a trend for higher values compared to the control only at the final harvest (Figure 6). Accumulation of amino acids is usually connected to a stress-induced protein breakdown as mentioned above; nevertheless, plants may actively synthesize specific amino acids that play a distinct and beneficial role in stress response [33]. In this line, the 67% increase of glutamic acid concentration at the final harvest (Table 4) may be correlated with its use as a precursor to essential amino acids or its newly reported signaling role toward increased activities of antioxidative enzymes [41]. A trend toward increase in citrulline concentration in treated plants may be ascribed to its function as a compatible solute involved in the maintenance of cellular osmolarity [42]. Overall, the profile of amino acids of the treated plants was in accordance with the T5 basil plants in the first experiment. However, there was a significant difference in magnitude of certain amino acid responses between the T5 and the second experiment. For example, while glycine, ornithine, and proline had a 40–60% increase in treated plants compared to the control in the second experiment, their increase in T5 was two- to fivefold of the control values. Additionally, two- to sevenfold increases in asparagine, glutamine, and arginine of T5 plants were not found in the second experiment. The above-mentioned distinct responses indicated that other factors apart from EC might also act as drivers of the regulation of free amino acid homeostasis and control the dynamic amino acid pool. We may speculate that these factors were related to cucumber root exudates that enriched the drainage solution, and affected the basil plants’ response, but they were not determined in the present study. Further and targeted experiments on exudate composition and their detailed metabolomic profile are needed to validate this hypothesis.
The ascorbic acid content of treated plants showed an increase compared to the control plants, but was statistically significant only in the intermediate harvest. The same trend was observed at the final harvest, but it was marginally non-significant (Figure 7). This finding was slightly different compared to the AsA concentration of T5 plants presented above (Figure 4). It seemed that the drainage solution from cucumber triggered the antioxidant machinery, and the response was more pronounced during the acclimation process compared to the first experiment. Apparently, other antioxidants, not determined in the present study, may also play a role in this process.
Table 5 summarizes the macro- and micro-nutrient content of basil plants in the second experiment. Noticeable impacts of treatment were recorded in P concentration, with 40% and 52%, and Mn with 74% and 60% reductions in the intermediate and final harvests, respectively; and in K, which showed a significant 45% reduction at the end of the experiment. On the contrary, Mg concentration was increased by 108% at the final harvest.
The performance of basil under the conditions and the system in which the present experiment was carried out proved to be promising for its use as a secondary crop in cascade hydroponic systems. Obviously, there are numerous aspects of basil biochemistry, complementary to those measured in the present study, that might be determined in future studies and complete the picture of basil performance. Among them, the impact of the drainage solution for various primary crops on concentrations and profiles of secondary metabolites, especially those responsible for aroma, would be worth studying.
The concept of cascade cropping systems is new; thus, few studies have explored their potential in ornamental and horticultural production and delineated their advantages and drawbacks [5,8,43,44]. The main constraint seems to be the increased salinity in the root zone of the secondary and tertiary crops, a problem that may be overcome by various levels of dilution of the primary crop leachates with water of low electrical conductivity [5,8,45]. Additionally, the use of salt-tolerant or even halophytic species, which can successfully grow under conditions of increased salinity, may be a feasible idea. Future experiments are expected to focus on this latter group, i.e., halophytes, some of which have recently been domesticated and included in human diet. Therefore, halophytes may be excellent candidates for their use as tertiary crops in cascade hydroponics.

4. Conclusions

The present study explored the salinity-tolerance thresholds of basil to evaluate its potential use as a secondary crop in a cascade hydroponics system. We used two distinct but complemented approaches to address our target; the first experiment tested several aspects of basil’s response to increasing levels of salinity in order to identify the tolerance limits, while the second experiment employed a cascade system to monitor the responses, with cucumber grown in hydroponics as the primary crop, the drainage solution of which irrigated basil grown in pots, a setup comparable to the first experiment. The various aspects of basil growth and biochemical performance collectively indicated the 5 dS m−1 salinity level as the upper limit/threshold of tolerance to stress. Additionally, the results of the first experiment indicated the first 15 days of treatment as a critical point for the process of salinity-symptom appearance on growth performance, as well as mineral composition. The use of basil as a secondary crop, which inevitably faces increased EC of the drainage solution of the primary crop, is subject to a compromise between fresh produce reduction and an increase in specific biochemical attributes related to basil quality. The increase of total amino acids under enhanced EC in both experiments and the trend for higher levels of the antioxidant AsA, as a surrogate of the antioxidant pool of basil, may compromise the 40% reduction in fresh produce yield in the cascade system. Another important aspect that should be considered is the benefit of re-using the drainage solution from the primary crop, which results in combined production of more than one crop and the optimization of the environmental footprint. Comparing the two experiments reported in the current study, we should highlight certain different responses of basil’s biochemical parameters when exposed to drainage solution in the cascade system. This finding may indicate that other factors, except for the increased EC, may also act as drivers of plant response, and this must be confirmed in future experiments to reach deeper insights. We concluded after both experiments that basil performed well under the specific conditions and in the system employed in the present study and might be a good candidate for use as a secondary crop in cascade hydroponics systems.

Author Contributions

Conceptualization, E.L., J.F.J.M.; investigation, D.A.; writing—original draft preparation, E.L.; writing—review and editing, J.F.J.M. and N.K.; funding acquisition, J.F.J.M. and N.K. All authors have read and agreed to the published version of the manuscript.

Funding

This research has been co-financed by the European Union and Greek national funds through the national action “Bilateral and Multilateral E&T Cooperation Greece-Germany” (project code: T2DGE-0893); and for the German action, by the German Federal Ministry of Education and Research.

Institutional Review Board Statement

Not applicable.

Informed Consent Statement

Not applicable.

Conflicts of Interest

The authors declare no conflict of interest.

References

  1. Plaut, Z.; Edelstein, M.; Ben-Hur, M. Overcoming Salinity Barriers to Crop Production Using Traditional Methods. Crit. Rev. Plant Sci. 2013, 32, 250–291. [Google Scholar] [CrossRef]
  2. Katsoulas, N.; Voogt, W. Recent trends in salinity control for soilless growing systems managemenT. Acta Hortic. 2014, 433–442. [Google Scholar] [CrossRef]
  3. Shahbaz, M.; Ashraf, M.; Al-Qurainy, F.; Harris, P.J.C. Salt Tolerance in Selected Vegetable Crops. Crit. Rev. Plant Sci. 2012, 31, 303–320. [Google Scholar] [CrossRef]
  4. Gruda, N.; Savvas, D.; Colla, G.; Rouphael, Y. Impacts of genetic material and current technologies on product quality of selected greenhouse vegetables—A review. Eur. J. Hortic. Sci. 2018, 83, 319–328. [Google Scholar] [CrossRef]
  5. Elvanidi, A.; Reascos, C.B.; Gourzoulidou, E.; Kunze, A.; Max, J.; Katsoulas, N. Implementation of the Circular Economy Concept in Greenhouse Hydroponics for Ultimate Use of Water and Nutrients. Horticulturae 2020, 6, 83. [Google Scholar] [CrossRef]
  6. Gruda, N.S. Increasing Sustainability of Growing Media Constituents and Stand-Alone Substrates in Soilless Culture Systems. Agronomy 2019, 9, 298. [Google Scholar] [CrossRef] [Green Version]
  7. Savvas, D.; Gruda, N. Application of soilless culture technologies in the modern greenhouse industry—A review. Eur. J. Hortic. Sci. 2018, 83, 280–293. [Google Scholar] [CrossRef]
  8. Garcia-Caparros, P.; Llanderal, A.; Maksimovic, I.; Lao, M.T. Cascade Cropping System with Horticultural and Ornamental Plants under Greenhouse Conditions. Water 2018, 10, 125. [Google Scholar] [CrossRef] [Green Version]
  9. Katsoulas, N.; Elvanidi, A.; Zagari, E.; Bartzanas, T.; Kalaitzis, P.; Kittas, C. Detection of salinity stress in soilless tomato based on crop reflectance. Acta Hortic. 2019, 1242, 723–728. [Google Scholar] [CrossRef]
  10. Cabot, C.; Sibole, J.V.; Barceló, J.; Poschenrieder, C. Lessons from crop plants struggling with salinity. Plant Sci. 2014, 226, 2–13. [Google Scholar] [CrossRef] [PubMed]
  11. Shahid, M.A.; Sarkhosh, A.; Khan, N.; Balal, R.M.; Ali, S.; Rossi, L.; Gómez, C.; Mattson, N.; Nasim, W.; Garcia-Sanchez, F. Insights into the Physiological and Biochemical Impacts of Salt Stress on Plant Growth and Development. Agronomy 2020, 10, 938. [Google Scholar] [CrossRef]
  12. Tarchoune, I.; Degl’Innocenti, E.; Kaddour, R.; Guidi, L.; Lachaâl, M.; Navari-Izzo, F.; Ouerghi, Z. Effects of NaCl or Na2SO4 salinity on plant growth, ion content and photosynthetic activity in Ocimum basilicum L. Acta Physiol. Plant. 2011, 34, 607–615. [Google Scholar] [CrossRef]
  13. Rouphael, Y.; Kyriacou, M. Enhancing Quality of Fresh Vegetables Through Salinity Eustress and Biofortification Applications Facilitated by Soilless Cultivation. Front. Plant Sci. 2018, 9, 1254. [Google Scholar] [CrossRef] [PubMed]
  14. Bahcesular, B. Seed Priming with Melatonin Effects on Growth, Essential Oil Compounds and Antioxidant Activity of Basil (Ocimum Basilicum L.) under Salinity Stress. Ind. Crops Prod. 2020, 146, 112165. [Google Scholar] [CrossRef]
  15. Selmar, D.; Kleinwächter, M. Influencing the product quality by deliberately applying drought stress during the cultivation of medicinal plants. Ind. Crop. Prod. 2013, 42, 558–566. [Google Scholar] [CrossRef]
  16. Boestfleisch, C.; Papenbrock, J. Changes in secondary metabolites in the halophytic putative crop species Crithmum maritimum L., Triglochin maritima L. and Halimione portulacoides (L.) Aellen as reaction to mild salinity. PLoS ONE 2017, 12, e0176303. [Google Scholar] [CrossRef] [PubMed] [Green Version]
  17. Gruda, N. Do Soilless Culture Systems Have an Influence on Product Quality of Vegetables? J. Appl. Bot. Food Qual. 2009, 82, 141–147. [Google Scholar]
  18. Tanaka, H.; Yamada, S.; Masunaga, T.; Yamamoto, S.; Tsuji, W.; Murillo-Amador, B. Comparison of nutrient uptake and antioxidative response among four Labiatae herb species under salt stress condition. Soil Sci. Plant Nutr. 2018, 64, 589–597. [Google Scholar] [CrossRef]
  19. Petropoulos, S.A.; Levizou, E.; Ntatsi, G.; Fernandes, Â.; Petrotos, K.; Akoumianakis, K.; Barros, L.; Ferreira, I.C. Salinity effect on nutritional value, chemical composition and bioactive compounds content of Cichorium spinosum L. Food Chem. 2017, 214, 129–136. [Google Scholar] [CrossRef] [PubMed] [Green Version]
  20. Scagel, C.F.; Lee, J.; Mitchell, J.N. Salinity from NaCl changes the nutrient and polyphenolic composition of basil leaves. Ind. Crop. Prod. 2019, 127, 119–128. [Google Scholar] [CrossRef]
  21. Neto, A.D.D.A.; Menezes, R.V.; Gheyi, H.R.; Silva, P.C.C.; Cova, A.M.W.; Ribas, R.F.; Ribeiro, M.D.O. Salt-induced changes in solutes, pigments and essential oil of two basil (Ocimum basilicum L.) genotypes under hydroponic cultivation. Aust. J. Crop. Sci. 2019, 13. [Google Scholar] [CrossRef]
  22. Pegg, R.B.; Amarowicz, R.; Naczk, M.; Shahidi, F. PHOTOCHEM® for Determination of Antioxidant Capacity of Plant Extracts. In Antioxidant Measurement and Applications; ACS Symposium Series; American Chemical Society: Washington, DC, USA, 2007; Volume 956, pp. 140–158. ISBN 978-0-8412-7428-0. [Google Scholar]
  23. Elhindi, K.M.; Al-Amri, S.M.; Abdel-Salam, E.; Al-Suhaibani, N.A. Effectiveness of salicylic acid in mitigating salt-induced adverse effects on different physio-biochemical attributes in sweet basil (Ocimum basilicum L.). J. Plant Nutr. 2017, 40, 908–919. [Google Scholar] [CrossRef]
  24. Gohari, G.; Alavi, Z.; Esfandiari, E.; Panahirad, S.; Hajihoseinlou, S.; Fotopoulos, V. Interaction between hydrogen peroxide and sodium nitroprusside following chemical priming ofOcimum basilicumL. against salt stress. Physiol. Plant. 2019, 168, 361–373. [Google Scholar] [CrossRef] [PubMed] [Green Version]
  25. Attia, H.; Ouhibi, C.; Ellili, A.; Msilini, N.; Bouzaïen, G.; Karray, N.; Lachaâl, M. Analysis of salinity effects on basil leaf surface area, photosynthetic activity, and growth. Acta Physiol. Plant. 2010, 33, 823–833. [Google Scholar] [CrossRef]
  26. Tarchoune, I.; Sgherri, C.; Izzo, R.; Lachaal, M.; Ouerghi, Z.; Navari-Izzo, F. Antioxidative responses of Ocimum basilicum to sodium chloride or sodium sulphate salinization. Plant Physiol. Biochem. 2010, 48, 772–777. [Google Scholar] [CrossRef] [PubMed]
  27. Caliskan, O.; Kurt, D.; Temizel, K.E.; Odabas, M.S. Effect of Salt Stress and Irrigation Water on Growth and Development of Sweet Basil (Ocimum basilicum L.). Open Agric. 2017, 2, 589–594. [Google Scholar] [CrossRef] [Green Version]
  28. Berger, B.; de Regt, B.; Tester, M. Trait Dissection of Salinity Tolerance with Plant Phenomics. In Plant Salt Tolerance: Methods and Protocols; Shabala, S., Cuin, T.A., Eds.; Methods in Molecular Biology; Humana Press: Totowa, NJ, USA, 2012; pp. 399–413. ISBN 978-1-61779-986-0. [Google Scholar]
  29. Awlia, M.; Nigro, A.; Fajkus, J.; Schmoeckel, S.M.; Negrao, S.; Santelia, D.; Trtílek, M.; Tester, M.; Julkowska, M.M.; Panzarová, K. High-Throughput Non-destructive Phenotyping of Traits that Contribute to Salinity Tolerance in Arabidopsis thaliana. Front. Plant Sci. 2016, 7, 1414. [Google Scholar] [CrossRef] [PubMed] [Green Version]
  30. Morano, G.; Amalfitano, C.; Sellitto, M.; Cuciniello, A.; Maiello, R.; Caruso, G. Effects of Nutritive Solution Electrical Conductivity and Plant Density on Growth, Yield and Quality of Sweet Basil Grown in Gullies by Subirrigation. Adv. Hortic. Sci. 2017, 31, 25–30. [Google Scholar] [CrossRef]
  31. Barbieri, G.; Vallone, S.; Orsini, F.; Paradiso, R.; De Pascale, S.; Zakharov, F.; Maggio, A. Stomatal density and metabolic determinants mediate salt stress adaptation and water use efficiency in basil (Ocimum basilicum L.). J. Plant Physiol. 2012, 169, 1737–1746. [Google Scholar] [CrossRef]
  32. Batista-Silva, W.; Heinemann, B.; Rugen, N.; Nunes-Nesi, A.; Araújo, W.L.; Braun, H.-P.; Hildebrandt, T.M. The role of amino acid metabolism during abiotic stress release. Plant Cell Environ. 2019, 42, 1630–1644. [Google Scholar] [CrossRef] [Green Version]
  33. Hildebrandt, T.M. Synthesis versus degradation: Directions of amino acid metabolism during Arabidopsis abiotic stress response. Plant Mol. Biol. 2018, 98, 121–135. [Google Scholar] [CrossRef]
  34. Fuertes-Mendizábal, T.; Bastías, E.I.; González-Murua, C.; González-Moro, M.B. Nitrogen Assimilation in the Highly Salt- and Boron-Tolerant Ecotype Zea mays L. Amylacea. Plants 2020, 9, 322. [Google Scholar] [CrossRef] [Green Version]
  35. Oddy, J.; Raffan, S.; Wilkinson, M.; Elmore, J.S.; Halford, N.G. Stress, nutrients and genotype: Understanding and managing asparagine accumulation in wheat grain. CABI Agric. Biosci. 2020, 1, 1–14. [Google Scholar] [CrossRef]
  36. Neocleous, D.; Ntatsi, G. Seasonal variations of antioxidants and other agronomic features in soilless production of selected fresh aromatic herbs. Sci. Hortic. 2018, 234, 290–299. [Google Scholar] [CrossRef]
  37. Arif, Y.; Singh, P.; Siddiqui, H.; Bajguz, A.; Hayat, S. Salinity induced physiological and biochemical changes in plants: An omic approach towards salt stress tolerance. Plant Physiol. Biochem. 2020, 156, 64–77. [Google Scholar] [CrossRef] [PubMed]
  38. Shannon, M.; Grieve, C. Tolerance of vegetable crops to salinity. Sci. Hortic. 1998, 78, 5–38. [Google Scholar] [CrossRef]
  39. Scagel, C.F.; Bryla, D.; Lee, J. Salt Exclusion and Mycorrhizal Symbiosis Increase Tolerance to NaCl and CaCl2 Salinity in ‘Siam Queen’ Basil. HortScience 2017, 52, 278–287. [Google Scholar] [CrossRef] [Green Version]
  40. Maathuis, F.J.M. The role of monovalent cation transporters in plant responses to salinity. J. Exp. Bot. 2005, 57, 1137–1147. [Google Scholar] [CrossRef] [PubMed] [Green Version]
  41. Teixeira, W.F.; Fagan, E.B.; Soares, L.H.; Umburanas, R.C.; Reichardt, K.; Neto, D.D. Foliar and Seed Application of Amino Acids Affects the Antioxidant Metabolism of the Soybean Crop. Front. Plant Sci. 2017, 8, 327. [Google Scholar] [CrossRef] [Green Version]
  42. Song, Q.; Joshi, M.; DiPiazza, J.; Joshi, V. Functional Relevance of Citrulline in the Vegetative Tissues of Watermelon During Abiotic Stresses. Front. Plant Sci. 2020, 11, 512. [Google Scholar] [CrossRef]
  43. García-Caparrós, P.; Espino, C.; Lao, M. Comparative Behavior of Dracaena marginata Plants Integrated into a Cascade Cropping System with the Addition of Hydrogen Peroxide. Agronomy 2021, 11, 218. [Google Scholar] [CrossRef]
  44. García-Caparrós, P.; Llanderal, A.; Velasquez, C.; Lao, M. Water and Nutrient Balance in an Ornamental Cascade Cropping System. Agronomy 2021, 11, 1251. [Google Scholar] [CrossRef]
  45. Plaza, B.M.; Soriano, F.; Jiménez-Becker, S.; Lao, M.T. Nutritional responses of Cordyline fruticosa var. ‘Red Edge’ to fertigation with leachates vs. conventional fertigation: Chloride, nitrogen, phosphorus and sulphate. Agric. Water Manag. 2016, 173, 61–66. [Google Scholar] [CrossRef]
Figure 1. Growth characteristics of basil leaves grown under the various salinity treatments: plant height at the intermediate and final harvests (A); projected leaf area at the intermediate and final harvests (B). Values are expressed as mean ± standard deviation (n = 50 for plant height and n = 10 for the PLA). Different letters indicate statistically significant differences between treatments at each harvest (small letters refer to the intermediate and capital ones to the final harvest, p < 0.05).
Horticulturae 07 00203 g001
Figure 2. Leaves fresh weight (A) and leaves biomass (B) grown under the various salinity treatments at the intermediate and final harvests. Values are expressed as mean ± standard deviation (n = 10). Different letters indicate statistically significant differences between treatments at each harvest (small letters refer to the intermediate and capital ones to the final harvest, p < 0.05).
Horticulturae 07 00203 g002
Figure 3. Total amino acid content of basil leaves grown under the various salinity treatments at the intermediate and final harvests. Values in all layers are expressed as mean ± standard deviation (n = 5). Different letters indicate statistically significant differences between treatments at each harvest (small letters refer to the intermediate and capital ones to the final harvest, p < 0.05).
Horticulturae 07 00203 g003
Figure 4. Ascorbic acid content of basil leaves grown under the various salinity treatments at the intermediate and final harvests. Values are expressed as mean ± standard deviation (n = 5). Different letters indicate statistically significant differences between treatments at each harvest (small letters refer to the intermediate and capital ones to the final harvest, p < 0.05).
Horticulturae 07 00203 g004
Figure 5. Growth characteristics of basil leaves grown as a secondary crop in the second experiment: plant height (A), projected leaf area (B), leaves fresh weight (C), and leaves biomass (D) at the intermediate and final harvests. Values are expressed as mean ± standard deviation (n = 50 for plant height and n = 10 for all the others). Different letters indicate statistically significant differences between treatments at each harvest (small letters refer to the intermediate and capital ones to the final harvest, p < 0.05).
Horticulturae 07 00203 g005
Figure 6. Total amino acid content of basil leaves grown as a secondary crop in the second experiment. The absence of letters indicates no statistically significant differences between treatments at both harvests (p < 0.05). Values are expressed as mean ± standard deviation (n = 5).
Horticulturae 07 00203 g006
Figure 7. Ascorbic acid content of basil leaves grown as a secondary crop in the second experiment at the intermediate and final harvests. Values are expressed as mean ± standard deviation (n = 5). Different letters indicate statistically significant differences between treatments at each harvest (small letters refer to the intermediate and capital ones to the final harvest, p < 0.05).
Horticulturae 07 00203 g007
Table 1. Nutrient concentrations in the irrigation solution used for each treatment, expressed in mmol L−1 for macronutrients and μmol L−1 for micronutrients.
ControlT5T10T15
NO313.647.493.4140.8
NH4+5.414.829.244.0
Ca2+1.711.823.335.2
P0.21.22.43.6
K+1.75.410.615.9
Mg2+0.41.93.75.6
S0.42.44.77.0
Fe12.331.662.394.0
Cu1.54.07.811.8
Mn7.118.336.254.5
Zn3.79.619.028.6
B22.758.3115.0173.4
Mo0.41.12.13.1
Table 2. Individual amino acid concentration in basil leaves for the various salinity treatments at the intermediate and final harvests, expressed as mg kg−1 FW. Values in all layers are expressed as mean ± standard deviation (n = 5). Different letters indicate statistically significant differences between treatments at each harvest (small letters refer to the intermediate and capital ones to the final harvest, p < 0.05).
Intermediate HarvestFinal Harvest
ControlT5T10T15ControlT5T10T15
alanine15.18 ± 2.43 a19.54 ± 0.40 ab22.47 ± 3.41 b23.49 ± 3.19 b13.30 ± 2.9 AB17.41 ± 3.77 A13.31 ± 2.71 A9.87 ± 1.00 B
arginine48.55 ± 22.03 a81.53 ± 41.92 a96.92 ± 37.05 a258.26 ± 65.20 b85.02 ± 24.38 A742.44 ± 186.1 B790.47 ± 144.2 B1107.78 ± 37.4 C
asparagine15.02 ± 9.93 a14.80 ± 8.30 a9.07 ± 2.91 a31.50 ± 18.98 a51.87 ± 7.69 A171.59 ± 51.02 B220.80 ± 81.25 B428.67 ± 72.07 C
aspartic acid9.29 ± 2.08 a11.41 ± 1.41 a17.82 ± 1.58 b19.82 ± 1.99 b11.74 ± 1.14 A17.90 ± 3.40 B16.25 ± 2.9 AB15.04 ± 0.9 AB
b-alanine0.32 ± 0.12 ab0.31 ± 0.08 a0.24 ± 0.03 a0.55 ± 0.18 b0.43 ± 0.10 A1.34 ± 0.34 B1.50 ± 0.42 B2.47 ± 0.31 C
b-amino-isobutyric acid0.30 ± 0.07 ab0.28 ± 0.11 a0.51 ± 0.08 ab0.57 ± 0.24 b0.11 ± 0.02 A0.26 ± 0.06 B0.33 ± 0.19 C0.54 ± 0.22 D
citrulline19.58 ± 5.33 a26.55 ± 2.14 ab30.75 ± 2.08 b46.11 ± 7.56 c12.94 ± 3.69 A68.15 ± 24.34 B73.16 ± 16.20 B100.24 ± 2.00 B
g-aminobutyric acid5.14 ± 0.39 a10.71 ± 3.74 ab11.72 ± 4.17 b7.51 ± 1.89 ab9.19 ± 2.04 A13.43 ± 4.37 A8.86 ± 2.22 A6.60 ± 2.18 A
glutamic acid38.29 ± 5.87 a41.59 ± 4.05 a47.34 ± 8.24 a44.58 ± 7.38 a43.96 ± 5.08 A45.22 ± 11.56 A37.61 ± 7.18 A28.95 ± 2.37 A
glutamine71.27 ± 11.95 a117.16 ± 12.50 a190.17 ± 42.23 b292.82 ± 53.92 c66.09 ± 13.01 A343.46 ± 78.23 B387.21 ± 69.89 B654.43 ± 106.3 C
glycine4.60 ± 0.87 a7.53 ± 1.28 ab8.95 ± 0.46 ab13.91 ± 6.37 b1.29 ± 0.25 A7.62 ± 2.94 B8.50 ± 1.47 B3.10 ± 1.75 A
histidine8.93 ± 4.27 a10.19 ± 2.93 a15.22 ± 2.03 a27.52 ± 3.83 b18.56 ± 6.01 aA70.36 ± 15.64 B73.57 ± 13.66 B112.98 ± 6.42 C
isoleucine1.75 ± 0.61 a1.10 ± 0.75 a1.12 ± 0.15 a1.82 ± 0.32 a4.24 ± 0.37 A6.70 ± 0.91 B6.04 ± 1.7 AB4.81 ± 0.5 AB
leucine1.78 ± 0.68 ab1.46 ± 0.28 ab1.25 ± 0.21 a2.12 ± 0.24 b4.13 ± 0.45 A7.22 ± 0.93 B6.59 ± 1.78 B5.98 ± 0.8 AB
lysine3.03 ± 0.99 a3.51 ± 0.77 a3.20 ± 0.42 a5.71 ± 0.69 b4.89 ± 1.07 A19.49 ± 3.33 B19.96 ± 3.70 B29.02 ± 0.85 C
methionine0.13 ± 0.04 a0.10 ± 0.01 a0.19 ± 0.06 b0.21 ± 0.02 b0.13 ± 0.04 A0.21 ± 0.12 B0.25 ± 0.12 B0.77 ± 0.22 B
ornithine1.61 ± 0.38 a2.18 ± 0.99 b2.57 ± 0.67 b4.82 ± 0.82 b1.56 ± 0.27 A10.10 ± 2.66 B10.75 ± 3.53 B14.67 ± 2.35 B
phenylalanine2.54 ± 1.57 a1.71 ± 0.38 a1.25 ± 0.17 a1.70 ± 0.33 a5.23 ± 2.13 A5.94 ± 0.44 A5.88 ± 2.27 A7.07 ± 1.44 A
proline0.91 ± 0.23 a1.36 ± 0.37 a2.18 ± 0.64 a4.83 ± 1.36 b0.96 ± 0.70 A3.61 ± 1.3 B2.48 ± 0.9 AB2.63 ± 0.9 AB
serine10.30 ± 1.83 a13.21 ± 1.54 a19.81 ± 1.29 b23.45 ± 2.75 b8.92 ± 1.57 A22.47 ± 2.66 B17.51 ± 3.14 C20.30 ± 1.31 BC
threonine5.17 ± 1.43 a5.28 ± 0.31 a5.61 ± 0.47 ab7.01 ± 0.48 ab6.88 ± 0.22 A10.41 ± 0.95 B9.36 ± 1.82 B8.72 ± 0.8 AB
tryptophan4.44 ± 1.97 a3.29 ± 0.95 a3.01 ± 0.37 a4.00 ± 0.81 a7.85 ± 2.88 A9.50 ± 0.76 A7.97 ± 2.35 A10.33 ± 2.87 A
tyrosine1.33 ± 0.64 a1.04 ± 0.15 ab0.31 ± 0.13 b0.51 ± 0.18 b2.56 ± 0.35 A3.22 ± 0.52 A2.42 ± 0.91 A1.97 ± 0.11 A
valine3.56 ± 1.56 a3.04 ± 0.50 a3.37 ± 0.29 a5.54 ± 0.43 b7.66 ± 0.88 A13.77 ± 1.54 B13.11 ± 3.23 B14.19 ± 1.20 B
Table 3. Nutrient concentrations in basil leaves for various salinity treatments (1st experiment) as determined at intermediate and final harvests. Different letters indicate statistically significant differences between treatments at each harvest (small letters refer to the intermediate and capital ones to the final harvest, p < 0.05). Values in all layers are expressed as mean ± standard deviation (n = 10).
Intermediate Harvest
TreatmentN (%)P (%)K (%)Ca (%)Mg (%)Fe (mg/kg)Zn (mg/kg)Mn (mg/kg)Cu (mg/kg)
Control5.18 ± 0.16 a0.94 ± 0.05 a5.31 ± 0.29 a2.32 ± 0.16 a0.47 ± 0.04 a136.39 ± 13.59 a97.50 ± 4.98 a293.29 ± 23.55 a12.05 ± 1.12 ab
T55.62 ± 0.06 b0.88 ± 0.03 b5.12 ± 0.12 a2.62 ± 0.08 a0.43 ± 0.03 a143.01 ± 16.17 a100.49 ± 8.60 a323.06 ± 24.20 a13.54 ± 1.78 a
T105.56 ± 0.18 b0.70 ± 0.05 c4.23 ± 0.25 b4.02 ± 0.50 b0.57 ± 0.11 b132.82 ± 22.12 a100.69 ± 11.62 a462.32 ± 54.44 b11.23 ± 2.18 b
T155.71 ± 0.14 b0.58 ± 0.04 d4.09 ± 0.26 b4.76 ± 0.35 c0.51 ± 0.07 ab89.24 ± 7.42 b108.18 ± 13.89 a540.10 ± 90.89 c9.46 ± 1.66 b
Final Harvest
TreatmentN (%)P (%)K (%)Ca (%)Mg (%)Fe (mg/kg)Zn (mg/kg)Mn (mg/kg)Cu (mg/kg)
Control5.16 ± 0.14 A0.77 ± 0.02 A5.04 ± 0.28 A3.04 ± 0.18 A0.64 ± 0.05 A152.46 ± 11.62 A93.76 ± 4.80 A234.17 ± 19.15 A14.77 ± 2.32 A
T56.16 ± 0.18 B0.69 ± 0.03 B5.18 ± 0.21 A2.91 ± 0.17 A0.55 ± 0.04 B109.91 ± 14.74 B75.82 ± 6.58 B182.71 ± 17.37 B13.44 ± 1.79 A
T106.40 ± 2.86 B0.66 ± 0.30 B5.33 ± 2.38 A3.31 ± 1.48 A0.57 ± 0.26 AB108.20 ± 48.30 B90.81 ± 4.69 AC223.65 ± 100.18 AC13.49 ± 6.04 A
T156.49 ± 0.30 B0.67 ± 0.02 B4.92 ± 0.25 A3.28 ± 0.69 A0.59 ± 0.09 AB94.98 ± 28.05 B80.47 ± 2.52 BC186.65 ± 17.24 BC13.38 ± 0.53 A
Table 4. Individual amino acid concentrations in basil leaves for the various salinity treatments at the intermediate and final harvests, expressed as mg kg−1 FW. Different letters indicate statistically significant differences between treatments at each harvest (small letters refer to the intermediate and capital ones to the final harvest, p < 0.05). Values are expressed as mean ± standard deviation (n = 5).
Intermediate HarvestFinal Harvest
ControlTreatedControlTreated
alanine13.27 ± 1.88 a13.13 ± 3.39 a9.14 ± 0.71 A12.83 ± 2.69 B
arginine2.44 ± 0.64 a1.56 ± 0.64 b13.07 ± 3.65 A 9.48 ± 16.25 A
asparagine2.48 ± 0.68 a1.97 ± 0.53 a11.41 ± 3.84 A8.86 ± 5.29 A
aspartic acid3.92 ± 0.40 a4.29 ± 1.30 a8.34 ± 1.44 A10.44 ± 2.54 A
b-alanine0.04 ± 0.00 a0.05 ± 0.02 a0.09 ± 0.04 A0.10 ± 0.04 A
b-amino-isobutyric acid0.03 ± 0.02 a0.13 ± 0.08 b0.05 ± 0.02 A0.09 ± 0.05 A
citrulline3.16 ± 0.51 a3.09 ± 0.96 a0.82 ± 0.22 A1.80 ± 1.32 A
g-aminobutyric acid9.18 ± 1.87 a6.88 ± 2.49 a8.72 ± 2.04 A6.61 ± 1.32 B
glutamic acid31.31 ± 1.29 a38.05 ± 6.52 b28.91 ± 3.74 A48.20 ± 7.30 B
glutamine25.49 ± 3.61 a22.67 ± 7.62 a30.87 ± 6.19 A31.28 ± 8.60 A
glycine2.09 ± 0.33 a1.83 ± 0.48 a0.84 ± 0.22 A 1.80.51 A
histidine0.84 ± 0.20 a0.79 ± 0.16 a1.67 ± 0.47 A1.49 ± 0.74 A
isoleucine0.33 ± 0.05 a0.34 ± 0.08 a0.87 ± 0.21 A0.87 ± 0.37 A
leucine0.37 ± 0.04 a0.34 ± 0.07 a0.90 ± 0.23 A0.93 ± 0.41 A
lysine2.08 ± 0.48 a2.20 ± 0.98 a2.57 ± 0.54 A2.60 ± 0.68 A
methionine0.05 ± 0.01 a0.03 ± 0.02 b0.02 ± 0.02 A0.03 ± 0.02 A
ornithine0.30 ± 0.10 a0.39 ± 0.17 a0.13 ± 0.05 A0.19 ± 0.10 A
phenylalanine0.30 ± 0.03 a0.42 ± 0.09 b0.68 ± 0.18 A0.85 ± 0.38 A
proline0.37 ± 0.07 a0.38 ± 0.20 a0.27 ± 0.16 A0.42 ± 0.17 A
serine5.09 ± 0.64 a5.16 ± 1.37 a4.07 ± 0.63 A5.07 ± 1.31 A
threonine1.68 ± 0.10 a1.74 ± 0.36 a2.66 ± 0.35 A3.23 ± 0.76 A
tryptophan0.33 ± 0.13 a0.69 ± 0.35 b0.51 ± 0.16 A0.56 ± 0.29 A
tyrosine0.07 ± 0.04 a0.12 ± 0.10 a0.35 ± 0.18 A0.32 ± 0.15 A
valine1.11 ± 0.10 a1.27 ± 0.41 a1.73 ± 0.27 A1.93 ± 0.50 A
Table 5. Nutrient concentrations in basil leaves of the control and cascade hydroponics treatments (2nd experiment) as determined at the intermediate and final harvests. Different letters indicate statistically significant differences between treatments at each harvest (small letters refer to the intermediate and capital ones to the final harvest, p < 0.05). Values in all layers are expressed as mean ± standard deviation (n = 10).
Intermediate Harvest
TreatmentN (%)P (%)K (%)Ca (%)Mg (%)Fe (mg/kg)Zn (mg/kg)Mn (mg/kg)Cu (mg/kg)
Control5.54 ± 0.64 a0.91 ± 0.21 a5.97 ± 0.45 a2.66 ± 0.68 a0.44 ± 0.13 a132.62 ± 30.72 a87.11 ± 7.02 a175.75 ± 17.69 a17.49 ± 2.93 a
Treated4.82 ± 0.32 b0.55 ± 0.05 b4.87 ± 0.65 b2.74 ± 0.23 a0.59 ± 0.09 b146.36 ± 25.92 a57.27 ± 8.31 b46.36 ± 10.19 b16.92 ± 2.87 a
Final Harvest
TreatmentN (%)P (%)K (%)Ca (%)Mg (%)Fe (mg/kg)Zn (mg/kg)Mn (mg/kg)Cu (mg/kg)
Control4.74 ± 0.13 A1.06 ± 0.05 A7.11 ± 0.46 A2.23 ± 0.13 A0.33 ± 0.02 A172.69 ± 30.86 A91.49 ± 5.46 A198.76 ± 10.19 A19.22 ± 2.21 A
Treated4.75 ± 0.17 A0.50 ± 0.05 B3.89 ± 0.46 B2.95 ± 0.14 B0.69 ± 0.06 B148.13 ± 17.79 B58.24 ± 4.61 B46.36 ± 12.01 B14.69 ± 2.42 B
Publisher’s Note: MDPI stays neutral with regard to jurisdictional claims in published maps and institutional affiliations.

