Article

Reliability of a Handheld Bluetooth Colourimeter and Its Application to Measuring the Effects of Time from Harvest, Row Orientation and Training System on Nectarine Skin Colour

1
Tatura SmartFarm, Agriculture Victoria, Tatura, VIC 3616, Australia
2
Food Agility CRC Ltd., 81 Broadway, Ultimo, NSW 2007, Australia
3
Centre for Agricultural Innovation, University of Melbourne, Parkville, VIC 3010, Australia
4
Rubens Technologies Pty Ltd., Rowville, VIC 3178, Australia
5
Instruments & Data Tools Pty Ltd., Rowville, VIC 3178, Australia
6
AgriBio, Agriculture Victoria, Bundoora, VIC 3083, Australia
*
Author to whom correspondence should be addressed.
Submission received: 13 July 2021 / Revised: 4 August 2021 / Accepted: 16 August 2021 / Published: 19 August 2021
(This article belongs to the Special Issue Precision Management of Fruit Trees)

Abstract

:
This work aimed to (i) determine the reliability of a portable Bluetooth colourimeter for fruit colour measurements; (ii) characterise the changes in quantitative skin colour attributes in a nectarine cultivar in response to time from harvest; and (iii) determine the influence of row orientation and training system on nectarine skin colour. The skin colour attributes measured with the colourimeter, namely L*, a* and b*, were calibrated and validated against a reference spectrophotometer. C* and h° were obtained from a* and b*. Skin colour was measured in situ from 42 days before to 6 days after harvest on ‘Majestic Pearl’ nectarines subjected to different row orientations and training systems. Validation models showed high reliability of colour estimations. The trends of colour attributes over time were characterised by cubic regression models, with h° proving to be the best parameter to describe changes of colour over time, with a clear link to the maturation process. No significant effects of row orientation and training system on skin colour were observed at harvest. Overall, the device proved reliable for fruit colour detection. Results of this study highlight the potential of h° as a quantitative index to monitor ripening prior to harvest in ‘Majestic Pearl’ nectarines.

1. Introduction

Fruit quality represents an important driver for future increases in value for exported Australian stone fruit. Stone fruit quality is not well defined, and it is strongly affected by the preferences of consumers, who generally demand red fruit with high sugar content. Fruit colour is one of the quality parameters that tends to be stable among different markets. Consumers prefer red nectarines and peaches, and apricots with red blush, as they are commonly associated with flavour and sweetness, and they suit celebrations of events such as Christmas or the Chinese New Year. The main skin components responsible for red colour formation in nectarines and peaches are anthocyanin pigments [1]. Growers need to guarantee consistent and optimal fruit colouration by applying best orchard and post-harvest practices. The most common orchard practices adopted to maximise fruit red colouration are the use of modern cultivars, summer and winter pruning to reduce tree vigour, crop load management, defoliation and the use of reflective mulch cloths to maximise fruit light interception, with the latter being less adopted in stone fruit compared to pome fruit. Water deficit has little to no direct influence on pigment formation in stone fruit but can reduce vegetative growth that, in turn, leads to increased red colouration [2,3]. Skin colour degradation may also be caused by storage disorders such as inking [4] or physical damage such as bruises. Traditionally the skin background colour—the colour of the part of the fruit surface that is not covered by the red blush [5]—proved to be a sensitive maturity indicator in peach [6]. However, in modern plum, peach and nectarine cultivars with uniform skin colour, background colour is often not distinguished from the overcolour, making it difficult to be used as a maturity index. Instead, Australian stone fruit growers prefer to use destructive measurements of soluble solids concentration and/or flesh firmness as the main parameters to assess maturity in situ.
Stone fruit growers typically track fruit colour development by visual assessments in the orchards and during the post-harvest supply chain. The adoption of objective measurements of colour using RGB cameras or spectrometers is less common. Handheld colourimeters such as the CM-2600d spectrophotometer (Konica Minolta, Tokyo, Japan) have been used to determine fruit colour development prior to harvest, but despite their high precision, they are not widely used due to the difficulty associated with extracting and interpreting the data, and to their relatively high cost. Therefore, visual judgement based on previous knowledge and growers’ experience remains the most important tool to assess in situ fruit skin colour. In addition, growers working with modern peach and nectarine cultivars (i.e., fully coloured fruit) are less interested in measuring fruit colour as it does not represent a very accurate indicator of fruit quality.
In colour-measuring devices, reflectance spectra of the measured specimen are often used to determine colour in the CIELAB colour space [7]. This three-dimensional space is characterised by quantitative colour attributes—namely L* (i.e., a lightness coefficient), a* [i.e., a scale of redness to greenness ranging from −60 (green) to +60 (red)] and b* [i.e., a scale of yellowness to blueness ranging from −60 (blue) to +60 (yellow)] [8]. Hue angle (h°) and chroma (C*) are two further colour indices that can be calculated from L*, a* and b* [9]. The h° is calculated as the arc tangent of b*/a* and represents a 360° wheel where 0° (or 360°) is true red, 90° is true yellow, 180° is true green and 270° is true blue; C* represents colour vividness on a scale from 0 (diluted with white or darkened with black) to +60 (no colour dilution) and is calculated as the square root of a*2 + b*2 [10]. A three-dimensional colour space framework and the relative L*, a*, b*, C* and h° scales are summarised in Figure 1.
Byrne et al. [11], Luchsinger and Walsh [12] and Nunes [5] observed that the value of a* of the skin background colour is related to maturity in Prunus persica L. Batsch (i.e., nectarine and peach). Robertson et al. [13] and Ferrer et al. [14] highlighted relationships between skin h° and maturity in ‘Cresthaven’ and ‘Calanda’ peach cultivars, respectively. Both a* and h° are likely to be good indicators of maturity, with the latter being, in theory, the ideal parameter in fruit that possess a yellow intermediate step in the shift between green (immature) to orange-red (mature) or in fruit that simply go from green to yellow during ripening. Flesh a* and h° were strongly correlated with maturity in yellow peach cultivars [15]. In peaches and nectarines, fruit skin colour is influenced by environmental factors such as light [16,17,18] and irrigation [3,19]. Maturity assessment solely based on skin colour may be misleading, as stone fruit ripening is reflected in soluble solids concentration, flesh firmness, ethylene emission, titratable acidity and other parameters [6].
After harvest, RGB cameras and spectrometers can be the core technology of colourimeters used in laboratories or as part of modern fruit sorting systems in packhouses that grade fruit into different classes based on quality characteristics. Recently, the use of ground-based mobile platforms to acquire tree-scale imagery to estimate tree size, flower cluster number and crop load has become popular in the apple and almond industry. This new technology offers the opportunity to measure fruit colour in situ. Overall, there is an increasing demand for cost-effective, user-friendly Ag-tech devices that can precisely assess fruit colour both in situ and post-harvest and that can be easily interfaced with smartphones for rapid data storage and display.
This work aimed at (i) determining the reliability of a portable Bluetooth colourimeter to rapidly measure skin colour by comparing results with a reference spectrophotometer over a range of colour cards and stone fruits, (ii) characterising the changes in skin colour attributes of a nectarine cultivar over time prior to harvest, and (iii) determining the influence of row orientation and training systems on nectarine skin colour.

2. Materials and Methods

2.1. Determination of the Reliability of a Portable Colourimeter

2.1.1. Instrument Description

A portable Bluetooth colourimeter prototype (Rubens Technologies Pty Ltd., Rowville, VIC, Australia, Figure 2) was tested for the measurement of L*, a* and b*, C* and h°. The colourimeter featured separate red, green and blue (RGB) light intensity sensors as well as a total luminance sensor, all equipped with an IR light blocking filter. The light source was a white LED controlled via integrated logic. The colourimeter was connected to a smartphone via Bluetooth and logged data on the smartphone memory through a data logger app (“IDT data logger”) available for iOS devices. The app is available in the iOS App Store (Instruments & Data Tools Pty Ltd., Rowville, VIC, Australia) [20]. RGB data were converted into CIELAB (i.e., L*, a* and b*) and CIELCH (i.e., L*, C* and h°) using a Python code [21]. The app allowed the collection of as many measurements per fruit as desired and safely stored data in the smartphone’s internal memory prior to data sharing. Data was then exported in a csv (comma-separated value) file format. In addition, the smartphone application was designed to read the labelling of near field communication (NFC) tags, which were coded with specific reference identifiers for scanned specimens (e.g., tree, fruit, treatment, replicate).

2.1.2. Calibration of Colour Attributes

The colourimeter was calibrated on 115 RAL K7 colour cards (calibration set) against a reference spectrophotometer (CM-2600d, Konica Minolta, Tokyo, Japan). One measurement per card was collected with each device. The calibration of the colourimeter’s L*, a* and b* against the reference spectrophotometer was carried out to transform the native RGB values into CieLAB colour space, and to correct the non-linearity of the colourimeter. The values of C* and h° were calculated from a* and b* as specified in the introduction.

2.1.3. Validation of Colour Predictions

The reliability of the colourimeter was assessed using a validation dataset composed by 160 scans on different reference surfaces, as detailed below:
  • A calibration greyscale set (QPcard 102) with four greyscale colours: dark grey (L* = 25, a* = 0 and b* = 0), medium grey (L* = 48, a* = 0 and b* = 0), light grey (L* = 80, a* = 0 and b* = 0) and white (L* = 95, a* = 0 and b* = 0). Five measurements were taken on each greyscale colour (n = 20).
  • 20 ‘Angeleno’ plums (Prunus salicina L.).
  • 20 ‘Golden May’ apricots (P. armeniaca L.).
  • 20 ‘Snow Flame’ white peaches (P. persica L. Batsch).
  • 20 ‘September Sun’ yellow peaches (P. persica L. Batsch).
  • 20 ‘Rose Bright’ yellow nectarines (P. persica L. Batsch).
  • 20 ‘Autumn Bright’ yellow nectarines (P. persica L. Batsch).
  • 20 ‘Majestic Pearl’ white nectarines (P. persica L. Batsch).
Fruit of each cultivar had a good colour variability. Measurements were taken in a single spot that was marked with a circular area using a permanent marker. The same area was then scanned with the reference CM-2600d spectrophotometer.

2.2. The Effects of Time, Row Orientation and Training System on Nectarine Skin Colour

2.2.1. Study Site and Experimental Design

The study was conducted during season 2020/21 in the sundial orchard experiment at the Tatura SmartFarm (36°26′7″ S and 145°16′8″ E, 113 m a.s.l.) in the Goulburn Valley, Victoria, Australia. The sundial orchard is a circular orchard of approximately 1.3 ha and hosts the nectarine cultivar ‘Majestic Pearl’ and the apple cultivar ‘ANABP 01’ (marketed as Bravo™). Both the nectarine and apple cultivars were planted in a semicircle of the orchard in four different row orientations: E–W, NW–SE, N–S and NE–SW. Each row orientation had 5 parallel rows of trees at 3.5 m between rows and 1 m between trees. Rows were 36 m in length. ‘Majestic Pearl’ trees were at their 3rd leaf stage and were trained to: (i) vertical trellis (VT), (ii) Tatura trellis (TT), (iii) cantilever trellis 1 (CT1, i.e., trellis and posts leaning 30° to the left-hand side when moving from the centre towards the perimeter of the Sundial orchard), and (iv) cantilever trellis 2 (CT2, i.e., trellis and posts leaning 30° to the right-hand side when moving from the centre towards the perimeter of the Sundial orchard). Each training system was replicated four times across the four-row orientations, which acted as four complete blocks of a randomised complete block design. The four training systems were randomly assigned to the four experimental units within each row orientation block. The experimental units were plots, each plot comprising 45 trees across five rows—with three fruits from each of the central three trees in the central row used as measurement units. The central three trees in each plot remained the same, whereas fruit selected for measurements were selected randomly at each measurement time. A detailed description of the Sundial orchard can be found in the Victorian Horticulture Industry Networks website [22].
‘Majestic Pearl’ fruit was harvested on 19 January 2021. This cultivar is highly relevant for stone fruit growers as its fruit has uniform red colouration and is typically harvested before the Chinese New Year, making it an ideal export candidate for Asian markets.

2.2.2. Colour Measurements

The colourimeter was used to estimate L*, a*, b*, C* and h° on ‘Majestic Pearl’ fruit skin. The different row orientations and training systems in the sundial orchard experimental setup led to diverse light exposure regimes that might have potentially affected skin colour formation.
In situ colour measurements were collected on a random cheek of the fruit (i.e., not selecting a specific visual characteristic such as colour intensity or overcolour/background colour) on 9 fruit per plot. Measurements were carried out at six measurement times: 42, 35, 21 and 14 days before harvest, once at harvest and once at 6 days after harvest (on trees left unharvested to determine if colour underwent significant changes after harvest). Commercial harvest time was defined using a combination of historical data, growers’ practices, flesh firmness, soluble solids and index of absorbance difference. At each measurement session, colour measurements were collected on fruit at a height between 1.2 and 1.8 m from the ground. Nine fruits were measured for each of the 16 row orientation × training system combinations. Overall, a total of 144 fruits (i.e., 9 fruit × 4-row orientations × 4 training systems) were measured at each measurement date.

2.3. Data Analysis

Exploratory data analysis was conducted to identify patterns and any outliers in the calibration datasets. The calibration models of colourimeter’s L*, a* and b* against the reference CM-2600d spectrophotometer’s L*, a* and b* were obtained with regression analysis. The calibration models were applied to the colourimeter output and the prediction of L*, a* and b* in the validation dataset was compared to the observed L*, a*, b* obtained with the reference CM-2600d spectrophotometer. Lin’s concordance correlation coefficient (rc) [23] was used to determine the degree of agreement (in terms of both precision and accuracy) between colourimeter’s L*, a* and b* and the CM-2600d spectrophotometer’s L*, a* and b* after validation. The root mean square error (RMSE) was used to report the uncertainty in estimates from the colourimeter.
Plot means for L*, a*, b*, C* and h° were subjected to repeated measures analysis of variance (ANOVA) based on a linear model (1).
Yijk = µ + Ri + Tj + εij + Dk + (RD)ik + (TD)jk + εijk
where Yijk is the plot mean corresponding to the i-th row orientation (i = 1, …, 4) and j-th training system (j = 1, …, 4) at k-th day from harvest (k = 1, …, 6), µ is general mean, Ri is the fixed effect of i-th row orientation, Tj is the fixed effect of j-th training system, εij is the between-plots random residual term, Dk is the fixed effect of k-th day from harvest, (RD)ik the fixed effect of interaction between i-th row orientation and k-th day from harvest, (TD)jk is the fixed effect of the interaction between j-th training system and k-th day from harvest, and εijk the within-plots random residual term. The two random residual terms εij and εijk were assumed to be normally distributed with zero mean and constant variance as required for a valid application of ANOVA, which was found to hold good as indicated by the ANOVA diagnostic plots of residuals after fitting Model (1). The between-plots random residual term εij forms the basis for testing the statistical significance of the effects of row orientation and training system. The within-plots random residual term εijk forms the basis for testing the statistical significance of the effects of day from harvest, and its interactions with row orientation and training system. The Greenhouse-Geisser epsilon correction was applied to adjust for within-plots temporal correlation and lack of sphericity to obtain correct estimates of the F probabilities for the D, RD and TD terms in the model.
The results from repeated measures ANOVA for L*, a*, b*, C* and h° indicated consistently significant differences (p < 0.001) for D and non-significant differences (p > 0.05) for RD and TD interactions. This provided a logical basis to fit only a single regression model relating D with each of five variables L*, a*, b*, C* and h°, rather than fitting separate regression models for each row orientation and training system. The form of the relationship between D and each of the five variables L*, a*, b*, C* and h° was consistently observed to be cubic. Accordingly, a cubic regression model was fitted for each of them based on plot means using ReML Regression (2).
Y = b0 + b1 X + b2 X2 + b3 X3 + (RO/Plot/D)
where Y is L*, a*, b*, C* or h°, X is days after harvest, and (RO/Plot/D) represents the design structure with a/representing nesting: date of observation (D) nested within Plot, and Plot nested within row orientation (RO). The three design structure elements RO, Plots (nested within RO) and D (nested within Plot within RO) were each assumed to be normally distributed with zero mean and constant variance as required for a valid application of a ReML-based regression model, which was found to hold good as indicated by the ReML diagnostic plots of residuals after fitting the Model (2). The adjusted coefficient of determination (Adj. R2) was used to determine the goodness of fit of the model. The RMSE of the fitted models were reported in percentage (RMSE divided by the range of values of the colour attribute) to allow comparisons between errors of models obtained with colour attributes that were in different scales.
Data were analysed with Genstat 21st edition (VSN International Ltd., England, UK). Repeated measures ANOVA was carried out using the AREPMEASURES procedure.

3. Results

3.1. Accuracy and Precision of a Portable Colourimeter

3.1.1. Calibration of Colour Attributes

The uncalibrated colourimeter’s L*, a* and b* were related to the reference L*, a* and b*—i.e., obtained with the spectrophotometer—by quadratic relationships, as suggested by scatterplots in Figure 3. The quadratic models had R2 > 0.9 (Table 1) and were used to calibrate the L*, a* and b* measurements obtained with the colourimeter from the uncalibrated readings (i.e., L*u, a*u and b*u). The calibration algorithms were loaded onto the colourimeter’s firmware so that the output data was pre-processed with the correction.

3.1.2. Validation of Colour Attributes

Predicted values of L*, a* and b* in the validation samples were very similar to the reference spectrophotometer’s values (Figure 4). In fact, a rc > 0.90 was observed when testing precision and accuracy of L*, a* and b* prediction (Table 2), meaning that the predicted data aligned satisfactorily with reference observations. A small deviation in the linearity of the relationship persisted in the low portion of L* data (L* < 40) since the calibration was undertaken with a sample that lacked L* values in the 20–40 range. However, the RMSE suggested that the prediction accuracy error remained relatively low even for L* (Table 2). This confirmed the suitability of the portable Bluetooth colourimeter for rapid skin colour assessments in peaches, plums, nectarines and apricots.

3.2. Colour Development over Time and the Effects of Row Orientation and Training Systems

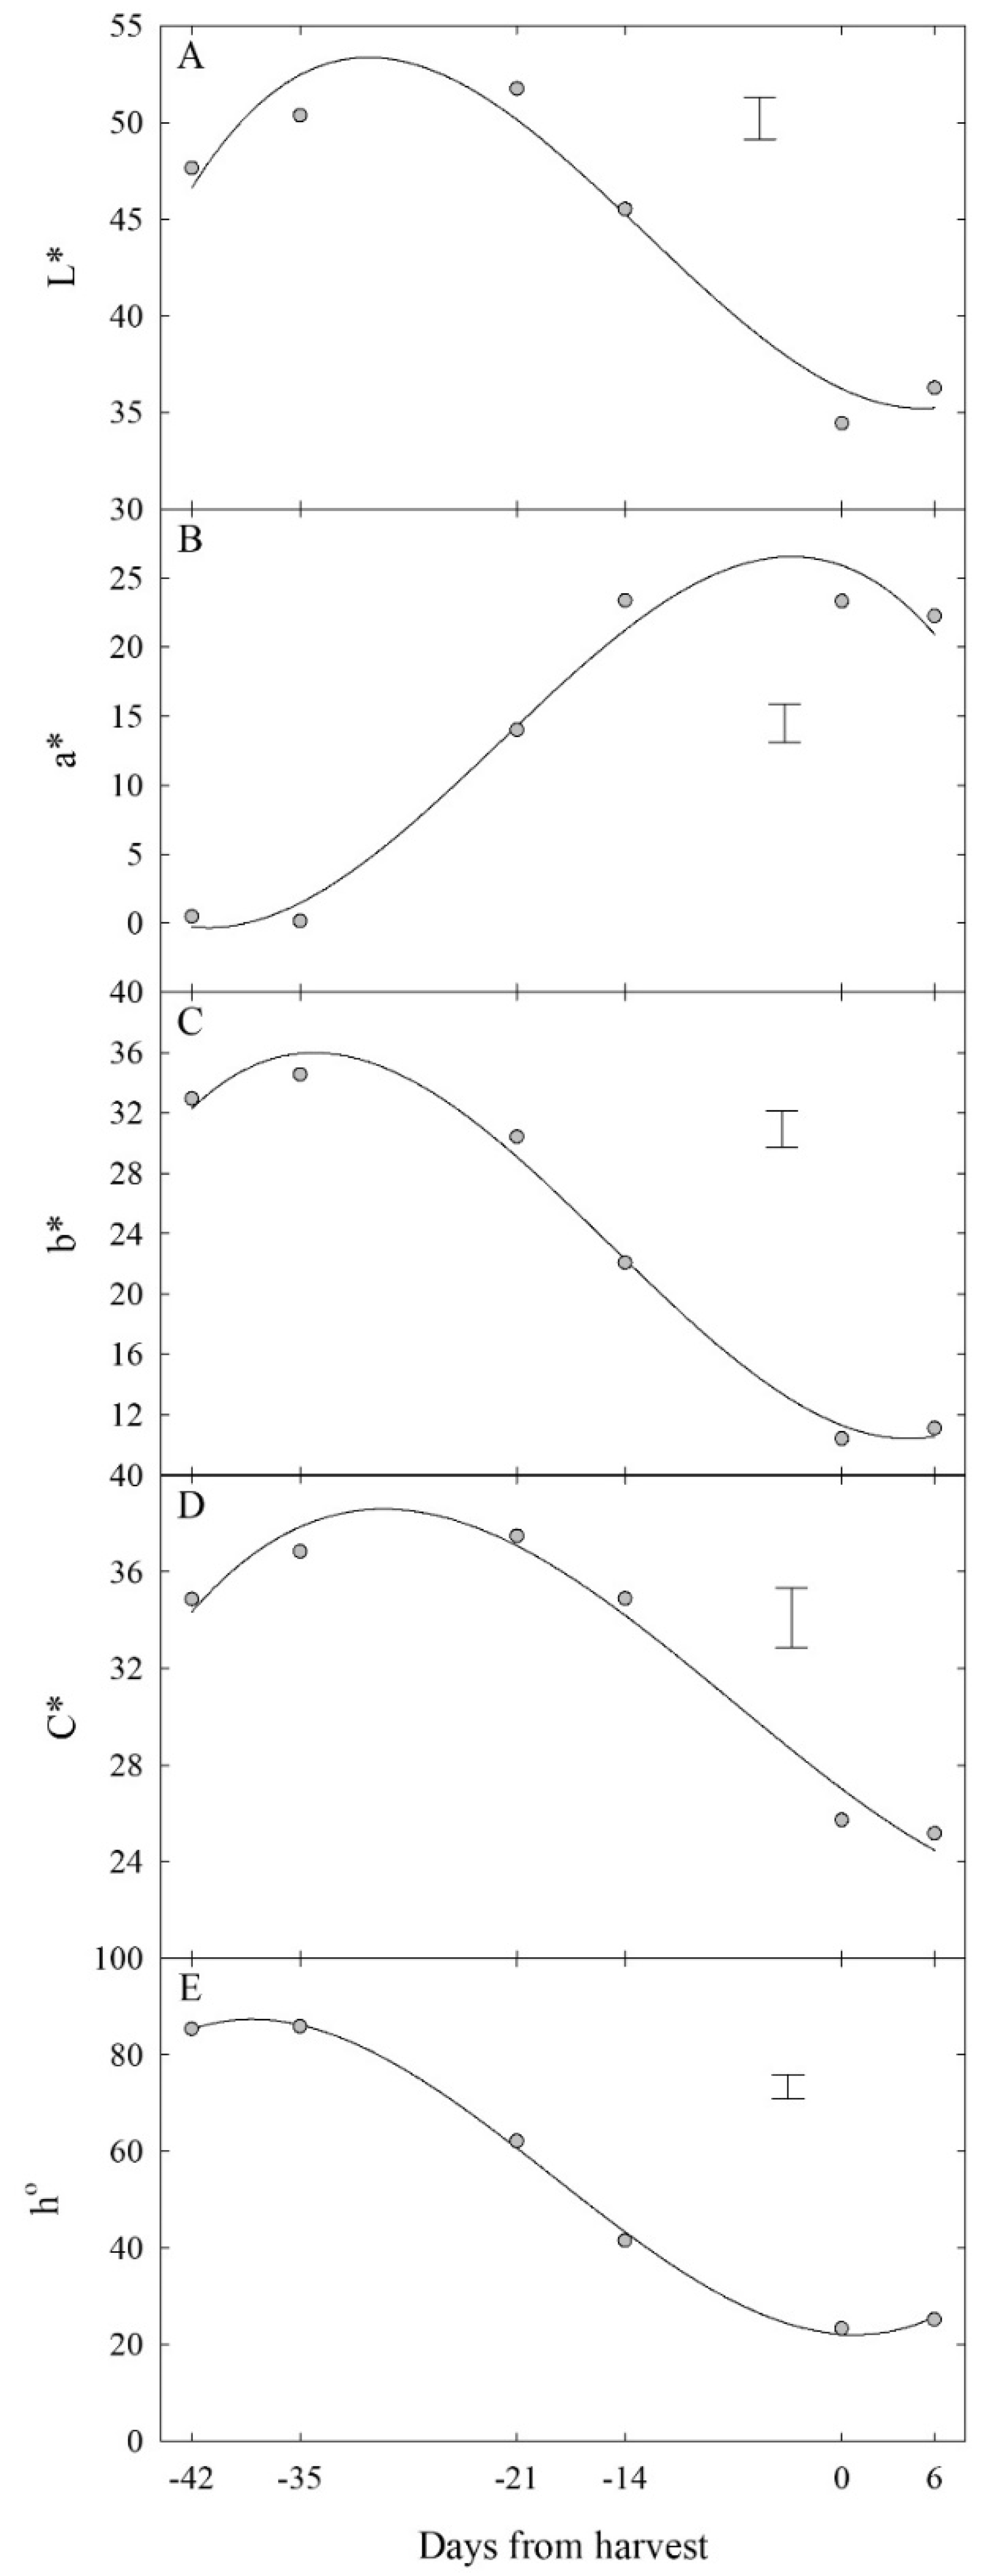
3.2.1. Colour Development over Time

The skin colour attributes of ‘Majestic Pearl’ nectarines changed from 42 days-before to 6 days-after commercial harvest (Figure 5) because of fruit maturation and the linked changes in pigment concentrations (i.e., decrease in chlorophyll and increase in anthocyanins).
The trends of L*, a*, b*, C* and h° over time were described using cubic regression fits (Figure 5). No significant changes were observed in any of the colour attributes between measurements recorded at harvest and at 6 days after harvest, as the fitted curves plateaued at harvest. L* did not significantly change between −42 and −21 days prior to harvest, although it reached a maximum value at −21 days and then dropped to its lowest value at harvest (Figure 5). Skin a* significantly increased from −35 days and stabilised at a value of approximately 23 at −14 days. Skin b* was highest at −35 days and then started a consistent decrease until b* ~10 at harvest. C* values remained at approximately 35 from −42 to −14 days from harvest and then dropped to 25 at harvest. Lastly, h° had the highest values (i.e., ~85) at −42 and −35 days from harvest and then gradually decreased towards harvest, when h° reached values <30°.
Table 3 shows the cubic regression equations used for the relationships between colour attributes and time from harvest. The relationships between colour attributes and time were very solid, as the Adj. R2 of the models were always > 0.75. The highest Adj. R2 was observed when using h° to predict harvest time (Table 3). Similarly, h° was the colour attribute that had the lowest percent standard error of the prediction, with an estimated relative error of approximately 13%. Therefore, h° can be considered the preferred colour attribute to describe colour changes in ‘Majestic Pearl’ nectarines within the time window selected in this study. The colour attributes at harvest (y0) represent a good indication of the values achieved when fruit are ripe. These skin colour values can be set as thresholds for automated harvest decision-making, as all the colour attributes plateaued at harvest time.

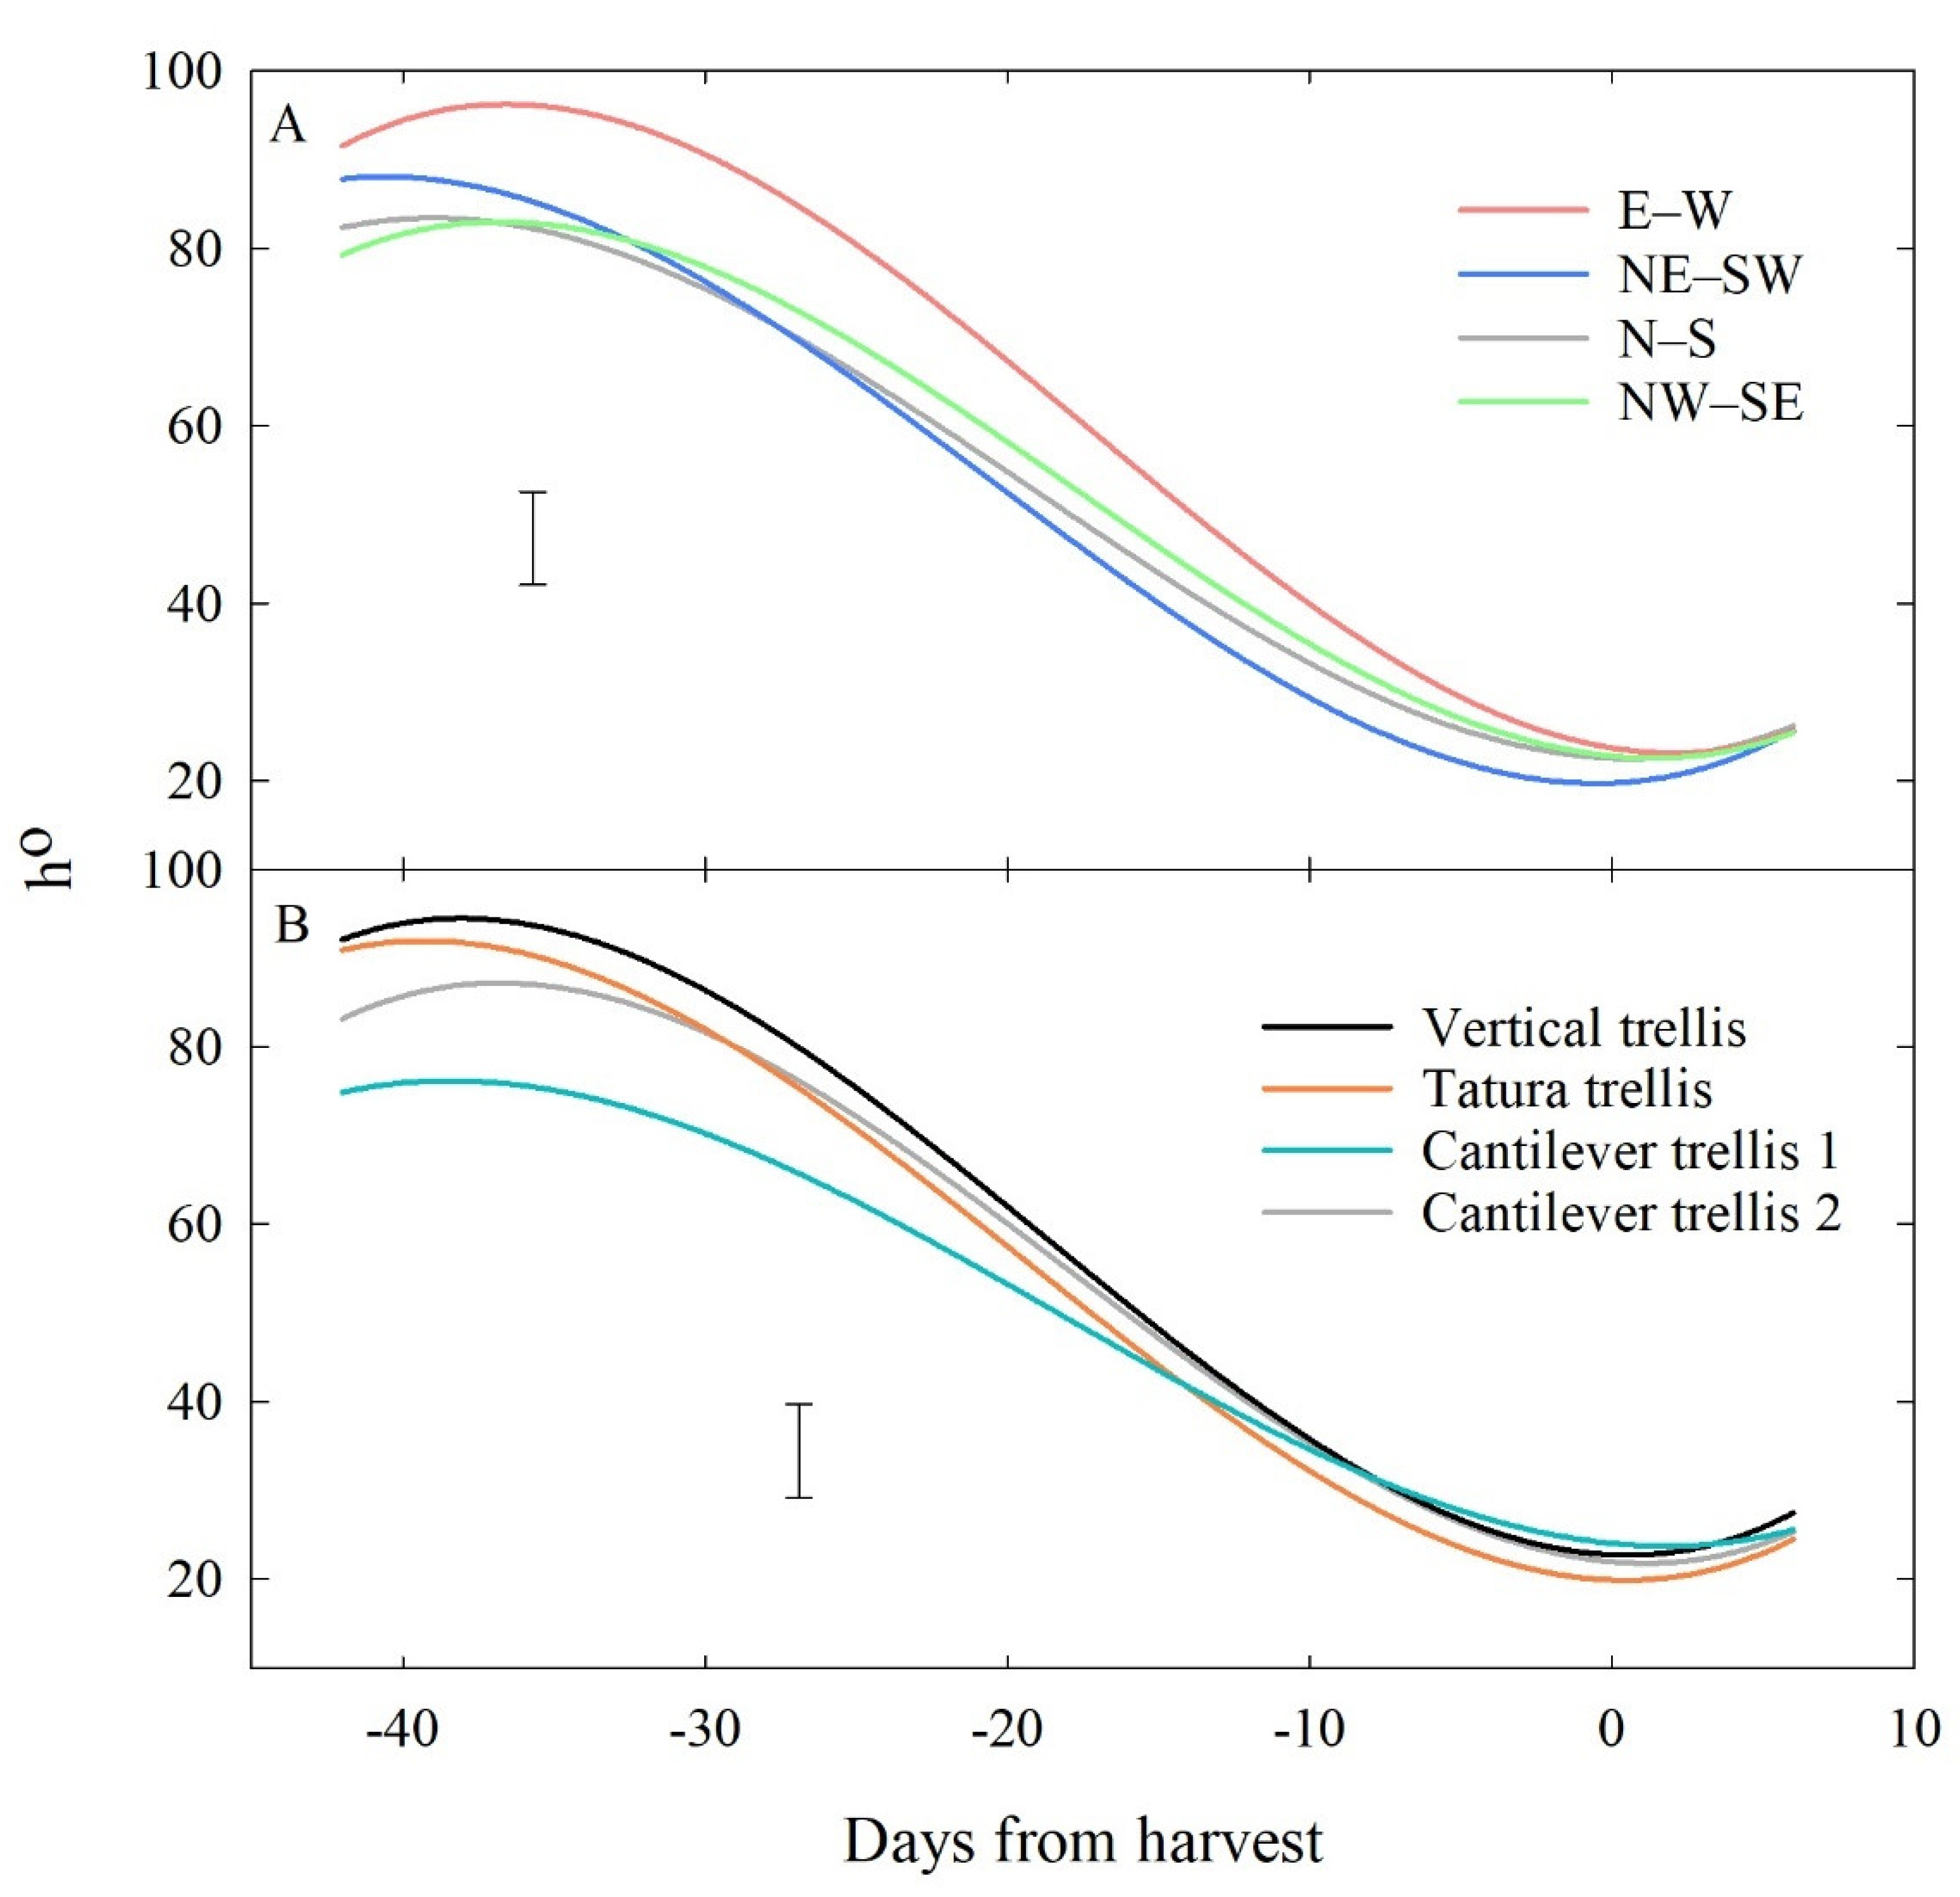
3.2.2. Effects of Row Orientation and Training System

Over the entire period of measurements (i.e., from −42 to +6 days from harvest) b* and h° were significantly affected (p < 0.05) by row orientation, whereas L*, a* and C* were not significantly affected (Table 4). In particular, the E–W row orientation appeared to significantly differ from other row orientations. Fruit measured in the E–W row orientation had significantly higher b* (i.e., yellower) and h° (i.e., more yellow than red) than fruit from NE–SW, N–S and NW–SE. Overall, fruit redness seemed to be penalised by planting trees in E–W rows.
In the same period of measurements, training systems had a significant effect (p < 0.05) on L*, C* and h° (Table 5). L* and C* were lowest in CT1 and CT2, respectively, indicating lighter skin colouration, and less yellowness and colour intensity in these training systems. Skin h° was lowest in CT1 and highest in VT; thus, fruit on trees trained to CT1 showed improved red colouration, whereas VT had a detrimental effect on redness.
The LSDs for the row orientation × days from harvest interaction (RO × D) in Table 4 and for the training system × days from harvest interaction (TS × D) in Table 5 show that significant differences caused by either row orientation or training system were cancelled at harvest. The h° trends in Figure 6 help visualise the moment at which differences between treatments disappeared. Initially, fruit from E–W trees had quite different responses in h° compared to other row orientations (Figure 6A), but colour attributes became very similar among row orientations in the last 10 days prior to harvest. Similarly, fruit from trees trained to CT1 had better red colouration and showed differences in h° compared to other training systems until 20 days prior to harvest, then drew closer to them (Figure 6B). Similar patterns were observed for the other colour attributes that were found significantly different (Table 4 and Table 5), but results were not presented as h° can be considered the most important skin colour measurement in nectarines.

4. Discussion

The handheld Bluetooth colourimeter used in this study proved accurate and precise for the detection of L*, a* and b* in stone fruit, as demonstrated by the cross-validation results shown in Figure 4 and Table 2 on a comprehensive dataset that included different stone fruit crops. The instrument allows for very rapid measurements and can be used for data collection in situ or post-harvest as it is interfaced via Bluetooth connectivity with a smartphone application that serves as data logger and stores data in the internal memory. The use of an external data logging device such as a smartphone or a tablet contributes to the reduction in the instrument’s size and weight, making it a portable tool that can be easily carried to the measurement site (i.e., orchard, packhouse, cool store, distribution centre).
The adoption of quantitative colour parameters such as L*, a*, b*, C* and h° for fruit quality and maturity determination helps overcome an often obsolete, qualitative and subjective classification into visual colour categories and opens the door to powerful machine learning algorithms that can quickly monitor fruit colour changes over time and in real time. For example, algorithms for the detection of L*, a*, b* C* and h° have a great potential for precision agriculture applications involving Agriculture technologies such as robots, drones and mobile platforms for automation of common practices such as fruit maturity estimation or robotic harvesting. However, this concept is only valid for fruit crops and cultivars that show a clear pattern of colour change when approaching maturity.
A distinct skin colour response in ‘Majestic Pearl’ nectarines was observed during the final 42 days prior to harvest. This response was reflected in all the colour attributes under study and was characterised by cubic regression fits, with a plateauing of the values at harvest (Figure 5). The colour attribute that best described fruit colour responses in this time range was h°—previously shown to be strongly correlated with anthocyanin content [24] and important maturity parameters in sweet peppers [25], peaches [13,14] and papaya [26]. This is an indication of the fact that h° could be successfully linked to maturity in crops whose fruit are subjected to colour changes (e.g., from green to yellow to orange, orange-red or red) during ripening, due to alterations in skin pigments (e.g., loss of chlorophyll and gain of flavonoids, carotenoids or anthocyanins). Our results agree with Ferrer et al. [14], who considered h° the best indicator of visual colour appreciation in ‘Calanda’ yellow peaches.
The plateauing of colour response curves observed in Figure 5 suggests that fruit colour in ‘Majestic Pearl’ nectarines can be tracked using sensors or machine vision prior to harvest, and fruit picking and associated harvest logistics can be scheduled upon reaching predefined thresholds of values, with stronger focus on h°. Based on the values of y0 reported in Table 3, a harvest threshold for ‘Majestic Pearl’ could be estimated for when average skin h° plateaus at ~22°.
The significant effects of row orientation and training system on colour was the weighed result of measurements performed at different times and did not reflect colour differences at harvest (Table 4 and Table 5). This suggests that trees that were either planted in E–W row orientations or trained to CT2, TT and VT managed to increase fruit redness and their colour approached values not significantly different from the treatments with best red colouration at harvest. Thus, skin colouration of ‘Majestic Pearl’ nectarines demonstrated very good plasticity and adaptation to different light environments as, by the time the fruit was harvested, significant differences in colour in fruit from different row orientations and training systems were cancelled. Differences among row orientations became inappreciable at approximately 10 days prior to harvest, whereas differences among training systems disappeared at approximately 20 days prior to harvest (Figure 6). The overall scarcer red colouration observed in the entire period between −42 and +6 days from harvest in fruit from trees planted in E–W rows is in keeping with the light regime models published by Trentacoste et al. [27]. The authors observed that N–S, NE–SW and NW–SE hedgerows intercept more light annually, than those oriented E–W, suggesting a potentially lower exposure of fruit to light over summer in rows orientated E–W. In contrast, DeJong and Doyle [28] measured no differences between the cumulative light intercepted by N–S and E–W hedgerows in peach, considering the total interception of the two sides of the hedgerows. Lal et al. [18] showed that ‘Fantasia’ nectarines on Tatura Trellis had higher a* and anthocyanin content than other training systems. In our study, TT trees were outperformed by CT1 in terms of red colouration (i.e., a* and h° in Table 5) over the period between −42 and +6 days from harvest, although differences disappeared at harvest. Overall, the exposure of fruit skin to direct light is subjected to the interaction of canopy architecture, row orientation, irrigation and pruning strategies, but this study highlighted the ability of ‘Majestic Pearl’ fruit to maintain uniform colour characteristics at harvest among a diverse combination of treatments.

5. Conclusions

In summary, the results of this study confirm the suitability and utility of a portable Bluetooth colourimeter for rapid in situ and post-harvest assessments of fruit skin colour in stone fruit. Furthermore, the use of the device to track colour development in ‘Majestic Pearl’ nectarines prior to harvest is encouraged. The most suitable quantitative colour attribute used as a harvest indicator in this cultivar was h° and it was observed that when this value plateaus at ~22°, fruit colour variations over time become non-significant and fruit are ready for harvest.
Different light exposure of fruit due to different training systems and row orientations did not significantly affect skin colour at harvest. Results need to be validated over several years of data to take into account the size of growing trees that might, at some stage, influence fruit colour by excessive foliage shading. In addition, only fruit positioned between 1.20 and 1.80 m above ground level were considered in this study; hence, fruit located elsewhere in the canopy may react differently. Nevertheless, the results of this study suggest that growers’ efforts to manage tree architecture and planting design in ‘Majestic Pearl’ should be focused mostly on improving other crop characteristics (e.g., sugar content, yield, crop load), as there was a distinct “catch up” in colour in this cultivar in the different row orientations and training systems. This is likely to be the consequence of intense worldwide breeding programmes that have selected uniform fruit colour as one of the main traits for modern stone fruit cultivars, as colour remains a paramount indicator of fruit quality for consumers at retail stores.

Author Contributions

Conceptualization, A.S., M.O.C. and I.G.; methodology, A.S.; software, A.S., D.P. and S.C.; validation A.S., D.P. and S.C.; formal analysis, A.S. and S.C.; investigation, A.S.; resources, T.P. and C.F.; data curation, A.S.; writing—original draft preparation, A.S.; writing—review and editing, M.O.C., S.C. and I.G.; visualization, A.S., M.O.C. and D.P.; supervision, M.O.C. and I.G.; project administration, I.G.; funding acquisition, I.G. All authors have read and agreed to the published version of the manuscript.

Funding

This research was funded by the Food Agility CRC Ltd. through the Australian Commonwealth Government CRC Program with co-investment from Agriculture Victoria and Summerfruit Australia Limited. This study was a component of the project “Deploying real-time sensors to meet Summerfruit export requirements”. The CRC Program supports industry-led collaborations between industry, researchers and the community.

Institutional Review Board Statement

Not applicable.

Informed Consent Statement

Not applicable.

Data Availability Statement

All data is available upon request to the corresponding author.

Acknowledgments

The technical support and assistance of Dave Haberfield, Laura Phillips and Cameron O’Connell is gratefully acknowledged.

Conflicts of Interest

D.P., in his capacity of co-founder and CEO of Rubens Technologies Pty Ltd., has a commercial interest in the development of spectral sensors for fruit maturity assessment. A.S., M.O.C., T.P., C.F., S.C. and I.G. declare that they have no known competing financial interests or personal relationships that could have appeared to influence the work reported in this paper. The funders had no role in the design of the study, in the collection, analyses or interpretation of data, in the writing of the manuscript or in the decision to publish the results.

References

  1. Ravaglia, D.; Espley, R.V.; Henry-Kirk, A.R.; Andreotti, C.; Ziosi, V.; Hellens, R.P.; Costa, G.; Allan, A.C. Transcriptional Regulation of Flavonoid Biosynthesis in Nectarine (Prunus Persica) by a Set of R2R3 MYB Transcription Factors. BMC Plant Biol. 2013, 13, 68. [Google Scholar] [CrossRef] [PubMed] [Green Version]
  2. Gelly, M.; Recasens, I.; Mata, M.; Arbones, A.; Rufat, J.; Girona, J.; Marsal, J. Effects of Water Deficit during Stage II of Peach Fruit Development and Postharvest on Fruit Quality and Ethylene Production. J. Hortic. Sci. Biotechnol. 2003, 78, 324–330. [Google Scholar] [CrossRef]
  3. O’Connell, M.; Scalisi, A. Sensing Fruit and Tree Performance under Deficit Irrigation in ‘September Bright’ Nectarine. Acta Hortic. 2021, 9–16. [Google Scholar] [CrossRef]
  4. Crisosto, C.H.; Johnson, R.S.; Day, K.R.; Beede, B.; Andris, H. Contaminants and Injury induce Inking on Peaches and nectarines. Calif. Agric. 1999, 53, 19–23. [Google Scholar] [CrossRef]
  5. Nunes, M.C.d.N. Color Atlas of Postharvest Quality of Fruits and Vegetables; Wiley-Blackwell: Ames, IA, USA, 2008. [Google Scholar]
  6. Crisosto, C.H. Stone Fruit Maturity Indices: A Descriptive Review. Postharvest News Inf. 1994, 5, 65N–68N. [Google Scholar]
  7. Greer, D.H. Non-Destructive Chlorophyll Fluorescence and Colour Measurements of ‘Braeburn’ and ‘Royal Gala’ Apple (Malus Domestica) Fruit Development throughout the Growing Season. N. Z. J. Crop. Hortic. Sci. 2005, 33, 413–421. [Google Scholar] [CrossRef]
  8. International Organisation for Standardisation CIE 1976 L*a*b* Colour Space 1976. Available online: https://www.iso.org/standard/52497.html (accessed on 20 March 2021).
  9. McGuire, R.G. Reporting of Objective Color Measurements. HortScience 1992, 27, 1254–1255. [Google Scholar] [CrossRef] [Green Version]
  10. Peavey, M.; Goodwin, I.; McClymont, L.; Chandra, S. Effect of Shading on Red Colour and Fruit Quality in Blush Pears “ANP-0118” and “ANP-0131”. Plants 2020, 9, 206. [Google Scholar] [CrossRef] [PubMed] [Green Version]
  11. Byrne, D.H.; Nikolic, A.N.; Burns, E.E. Variability in Sugars, Acids, Firmness, and Color Characteristics of 12 Peach Genotypes. J. Am. Soc. Hortic. Sci. 1991, 116, 1004–1006. [Google Scholar] [CrossRef] [Green Version]
  12. Luchsinger, L.; Walsh, C. Development of an Objective and Non-Destructive Harvest Maturity Index for Peaches and Nectarines. Acta Hortic. 1998, 679–688. [Google Scholar] [CrossRef]
  13. Robertson, J.A.; Meredith, F.I.; Horvat, R.J.; Senter, S.D. Effect of Cold Storage and Maturity on the Physical and Chemical Characteristics and Volatile Constituents of Peaches (cv. Cresthaven). J. Agric. Food Chem. 1990, 38, 620–624. [Google Scholar] [CrossRef]
  14. Ferrer, A.; Remón, S.; Negueruela, A.I.; Oria, R. Changes during the Ripening of the very Late Season Spanish Peach Cultivar Calanda: Feasibility of Using CIELAB Coordinates as Maturity indices. Sci. Hortic. Amst. 2005, 105, 435–446. [Google Scholar] [CrossRef]
  15. Scalisi, A.; Pelliccia, D.; O’Connell, M.G. Maturity Prediction in Yellow Peach (Prunus Persica L.) Cultivars Using a Fluorescence Spectrometer. Sensors 2020, 20, 6555. [Google Scholar] [CrossRef] [PubMed]
  16. Loreti, F.; Morini, S.; Stefanelli, D. Observations on Sunlight Interception and Penetration into the Canopy of Peach Trees at Different Planting Densities. Riv. Della Ortoflorofruttic. Ital. 1980, 64, 315–323. [Google Scholar]
  17. Gullo, G.; Motisi, A.; Zappia, R.; Dattola, A.; Diamanti, J.; Mezzetti, B. Rootstock and Fruit Canopy Position Affect Peach [Prunus Persica (L.) Batsch] (cv. Rich May) Plant Productivity and Fruit Sensorial and Nutritional Quality. Food Chem. 2014, 153, 234–242. [Google Scholar] [CrossRef] [PubMed]
  18. Lal, S.; Sharma, O.C.; Singh, D.B. Effect of Tree Architecture on Fruit Quality and Yield Attributes of Nectarine (Prunus Persica var. Nectarina) cv. Fantasia under Temperate Condition. Indian J. Agric. Sci. 2017, 87, 1008–1012. [Google Scholar]
  19. Scalisi, A.; O’Connell, M.; Bianco, R.L. Field Non-Destructive Determination of Nectarine Quality under Deficit Irrigation. Acta Hortic. 2021, 91–98. [Google Scholar] [CrossRef]
  20. Instruments & Data Tools Pty, L. IDT Data Logger. 2021. Available online: https://apps.apple.com/app/id1555614905 (accessed on 15 April 2021).
  21. Pelliccia, D. RGB to Lab Conversion. 2021. Available online: https://github.com/nevernervous78/rgb_to_Lab (accessed on 10 May 2021).
  22. Agriculture Victoria Stonefruit Sundial Experiments. Available online: http://www.hin.com.au/networks/profitable-stonefruit-research/stonefruit-orchard-technology/stonefruit-sundial-experiments (accessed on 3 August 2021).
  23. Lin, L.I.-K. A Concordance Correlation Coefficient to Evaluate Reproducibility. Biometrics 1989, 45, 255–268. [Google Scholar] [CrossRef]
  24. Palapol, Y.; Ketsa, S.; Stevenson, D.; Cooney, J.; Allan, A.; Ferguson, I. Colour Development and Quality of Mangosteen (Garcinia Mangostana L.) Fruit during Ripening and after Harvest. Postharvest Biol. Technol. 2009, 51, 349–353. [Google Scholar] [CrossRef]
  25. Tadesse, T.; Hewett, E.W.; Nichols, A.M.; Fisher, K.J. Changes in Physicochemical Attributes of Sweet Pepper cv. Domino during Fruit Growth and Development. Sci. Hortic. Amst. 2002, 93, 91–103. [Google Scholar] [CrossRef]
  26. Bron, I.U.; Jacomino, A.P. Ripening and Quality of ‘Golden’ Papaya Fruit Harvested at Different Maturity Stages. Braz. J. Plant Physiol. 2006, 18, 389–396. [Google Scholar] [CrossRef] [Green Version]
  27. Trentacoste, E.; Connor, D.J.; Gomez-Del-Campo, M. Row Orientation: Applications to Productivity and Design of Hedgerows in Horticultural and Olive Orchards. Sci. Hortic. Amst. 2015, 187, 15–29. [Google Scholar] [CrossRef]
  28. DeJong, T.; Doyle, J. The Effect of Row Orientation on Light Distribution in Hedgerow Peach Tree Canopies. Acta Hortic. 1985, 159–166. [Google Scholar] [CrossRef]
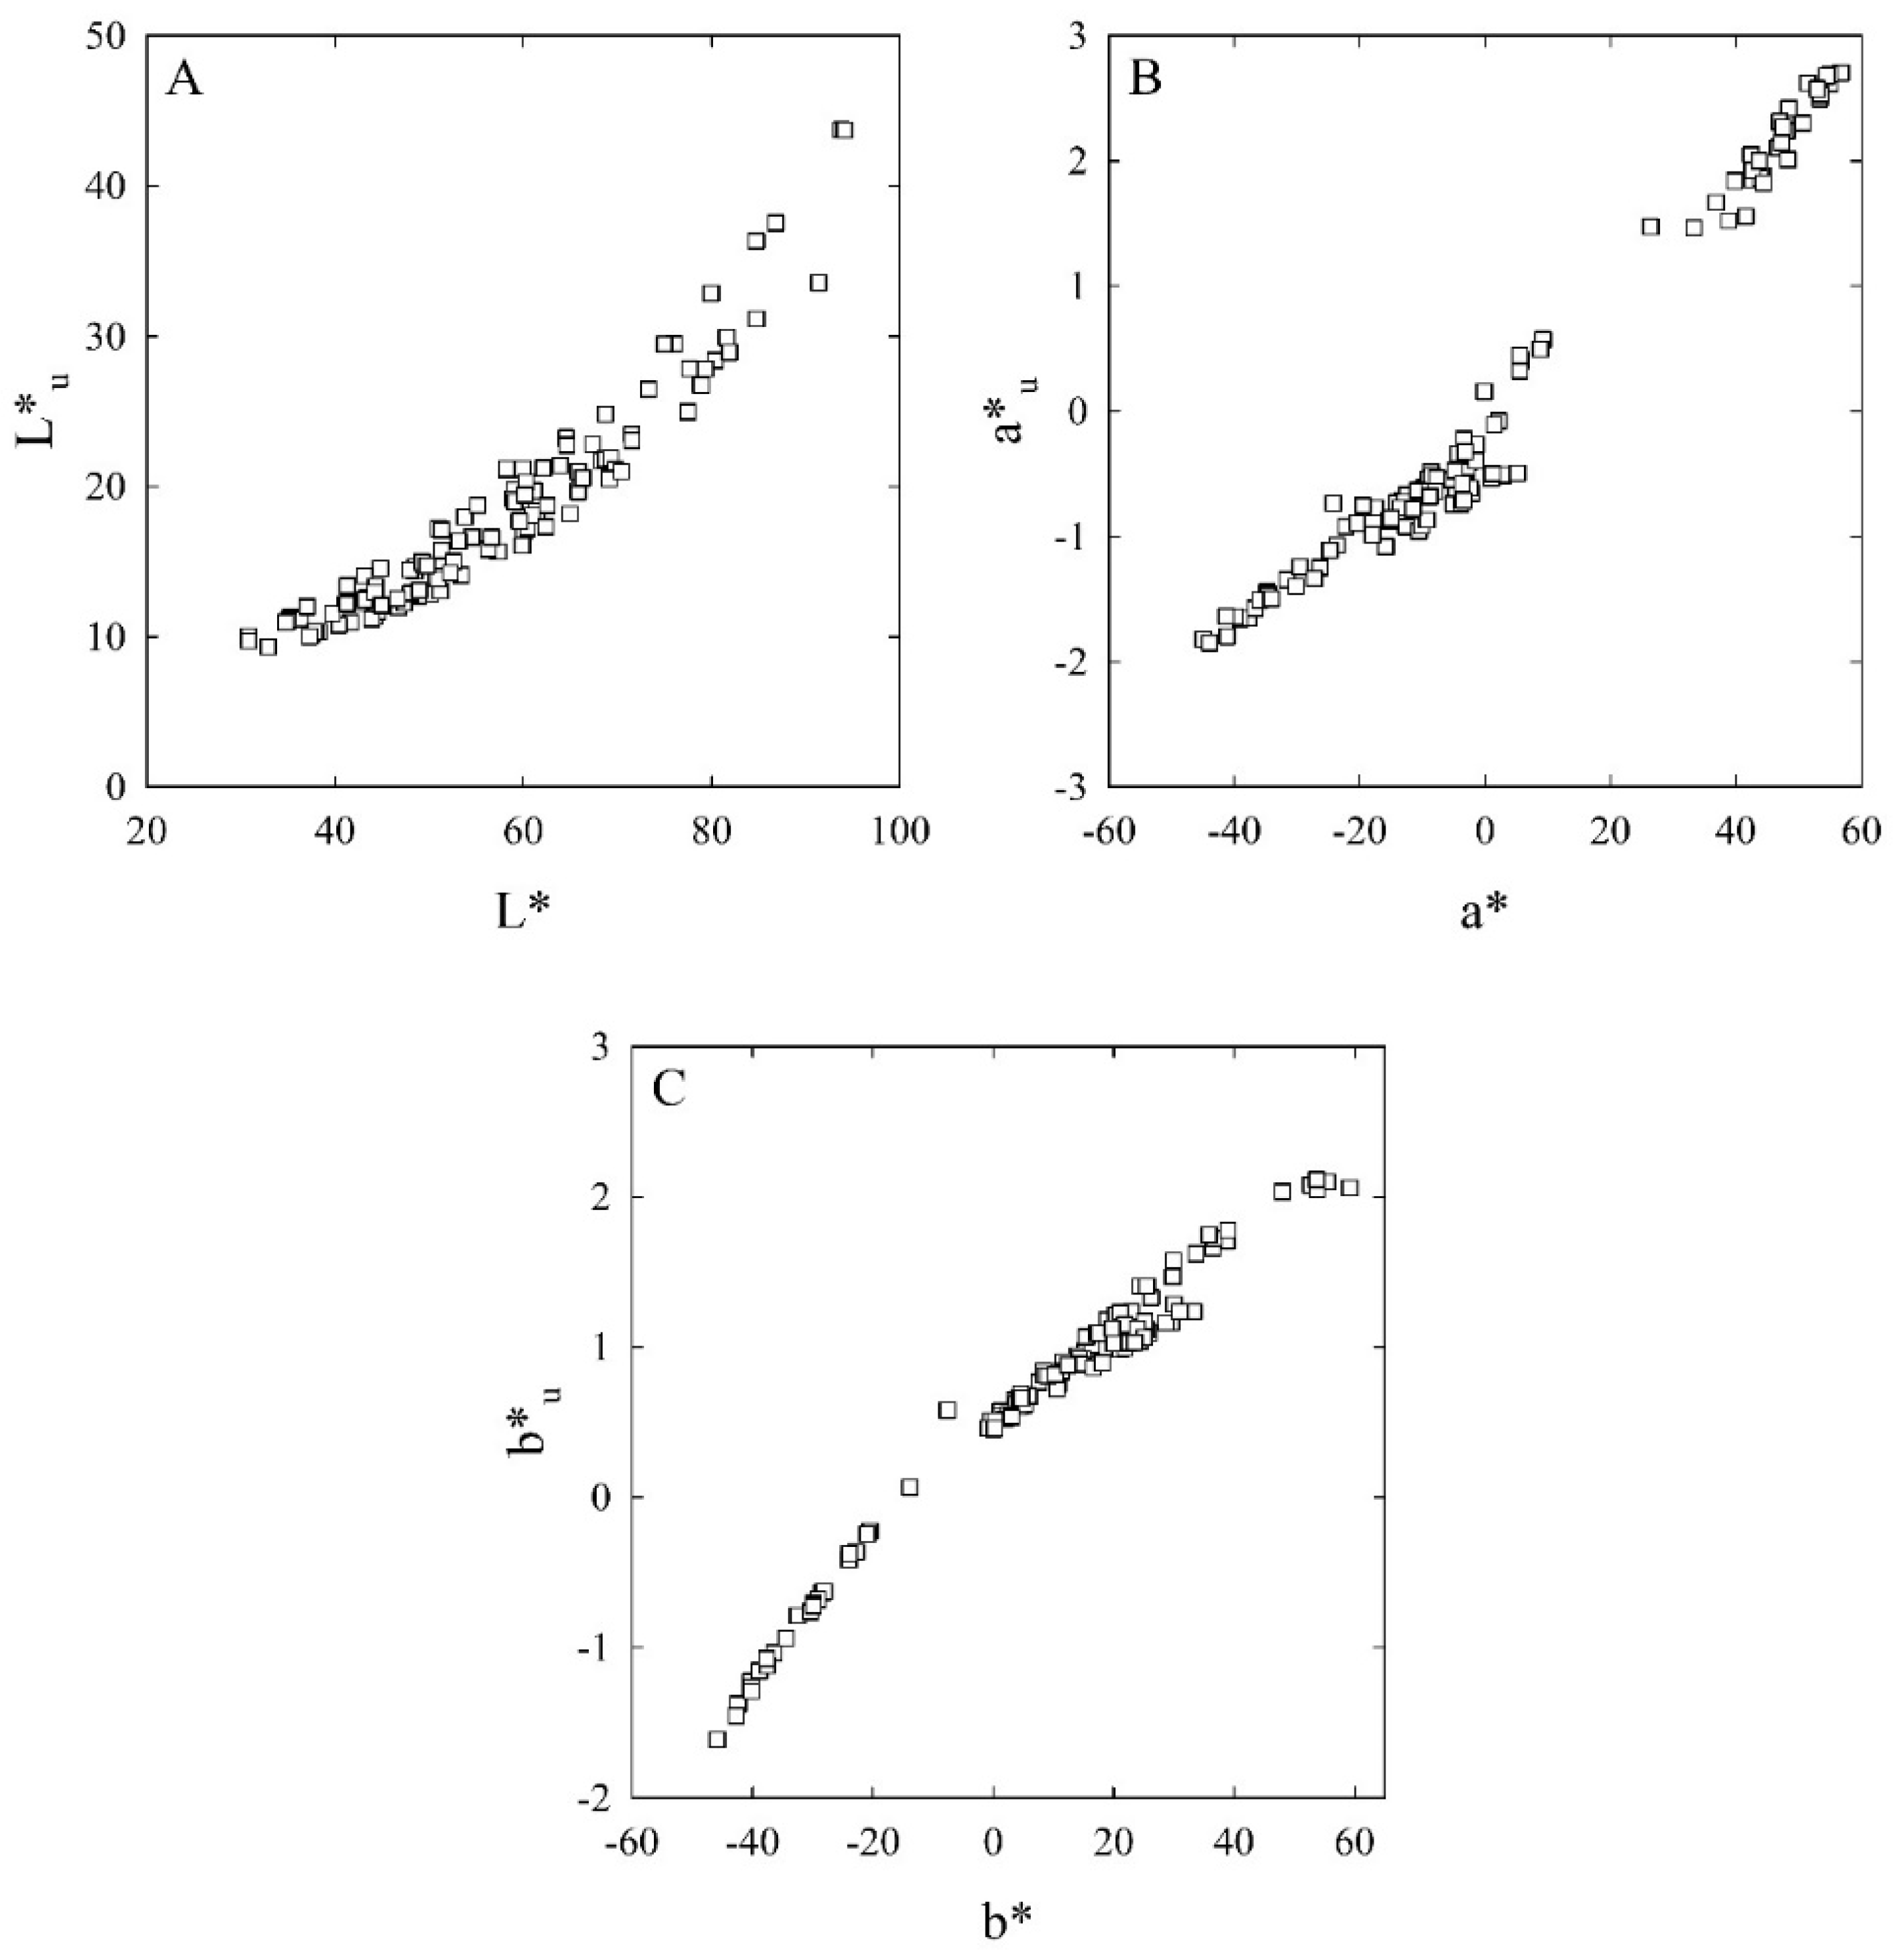
Figure 1. Schematic representation of L*, a*, b*, C* and h° in a three-dimensional colour space.
Horticulturae 07 00255 g001
Figure 2. Portable Bluetooth colourimeter used for in situ measurement of L*, a* and b* and calculation of C* and h° in a ‘September Sun’ peach fruit.
Horticulturae 07 00255 g002
Figure 3. Scatter plots of uncalibrated colourimeter’s L* (L*u, (A)), a* (a*u, (B)) and b* (b*u, (C)) against reference spectrophotometer’s L*, a and b* completed on 115 colour cards (calibration set).
Horticulturae 07 00255 g003
Figure 4. Scatter plots of validation datasets of colourimeter’s L* (A), a* (B) and b* (C) (predicted) against reference spectrophotometer’s L*, a* and b* (observed), respectively.
Horticulturae 07 00255 g004
Figure 5. Cubic regression fits of skin L* (A), a* (B), b* (C), C* (D) and h° (E) against time (n days from harvest) in ‘Majestic Pearl’ nectarine fruit. Significant differences are shown with Fisher’s Least Significant Difference (LSD, 5%) bars.
Horticulturae 07 00255 g005
Figure 6. Cubic models of skin hue angle (h°) against time (n days from harvest) in ‘Majestic Pearl’ nectarine fruit subjected to different row orientations (A) and training systems (B). Significant differences are shown with Fisher’s Least Significant Difference (LSD, 5%) bars.
Horticulturae 07 00255 g006
Table 1. Quadratic equations used to calibrate the uncalibrated colourimeter’s L* (L*u), a* (a*u) and b* (b*u) against reference spectrophotometer’s L*, a* and b*. Standard errors reported in brackets after each coefficient. Coefficient of determination (R2), significance level (p) and sample size (n) reported.
Colour
Attribute
EquationR2pn
L*L* = 1.58 + 3.92 L*u − 0.0423 L*u20.947<0.001115
a*a* = 5.87 + 22.9 a*u − 1.87 a*u20.976<0.001115
b*b* = − 12.5 + 26.2 b*u + 2.90 b*u20.983<0.001115
Table 2. Lin’s concordance correlation coefficient (rc) with 95% confidence intervals (in brackets) and root mean square error (RMSE) reported for the validation models obtained with colourimeter’s L*, a* and b* (predicted variables) against spectrophotometer’s L*, a* and b* (observed variables).
Colour ParametersnrcRMSE
L*1600.930 (0.040)5.158
a*1600.924 (0.043)5.747
b*1600.946 (0.033)4.373
Table 3. Cubic regressions models for skin colour attributes (y) against time in days from harvest (x) in ‘Majestic Pearl’ nectarine fruit.
Colour
Attribute
EquationAdj. R2 xy0 y% RMSE z
L*y = 36.2 − 0.375 x + 0.0304 x2 + 0.000797 x30.80536.2 (0.748)20.2
a*y = 25.9 − 0.399 x − 0.0664 x2 − 0.0100 x30.84625.9 (1.16)20.5
b*y = 11.3 − 0.398 x + 0.0403 x2 + 0.000903 x30.89711.3 (0.946)16.0
C*y = 27.0 − 0.480 x + 0.00721 x2 + 0.000345 x30.75427.0 (0.683)25.8
y = 22.2 − 0.225 x + 0.123 x2 + 0.00220 x30.93122.2 (2.19)13.3
x Adjusted coefficient of determination; y predicted values at harvest and their standard error in brackets; z percent root mean square error of the model.
Table 4. Skin colour attributes of ‘Majestic Pearl’ nectarines subjected to different row orientations. Means, ANOVAs’ p-values and Fisher Least Significant Differences (LSD, 5%) reported.
Colour
Attribute
Row Orientation (RO)Days from Harvest (D)Mean (RO)
−42−35−21−1406
L*E–W49.5952.3454.6249.3133.6836.4045.99
NE–SW48.0150.8350.4942.1534.6836.6043.79
N–S47.1348.8851.0344.6734.6836.6343.84
NW–SE45.8349.4450.8845.9434.7335.4443.71
Mean (D)47.6450.3751.7645.5234.4436.27-
p: 0.106 (RO), <0.001 (D), 0.351 (RO × D); LSD (5%): 2.138 (RO), 2.176 (D), 4.469 (RO × D).
a*E–W−3.17−3.687.5220.5123.6421.9611.13
NE–SW−0.470.8415.9926.7823.9624.7815.31
N–S1.811.8217.3523.9722.3521.6814.83
NW–SE3.731.6315.0922.2223.3520.5914.43
Mean (D)0.470.1513.9923.3723.3322.25-
p: 0.053 (RO), <0.001 (D), 0.173 (RO × D); LSD (5%): 3.128 (RO), 2.761 (D), 5.851 (RO × D).
b*E–W36.1637.7334.2326.099.9011.4825.93
NE–SW33.7234.4028.6518.5110.5711.8422.95
N–S32.2032.8129.0121.3010.2311.1122.78
NW–SE29.6633.2529.7822.3710.929.9222.65
Mean (D)32.9434.5530.4122.0710.4111.09-
p: 0.044 (RO), <0.001 (D), 0.289 (RO × D); LSD (5%): 2.502 (RO), 2.430 (D), 5.041 (RO × D).
C*E–W37.4939.4838.6536.9025.6825.0133.87
NE–SW34.9736.7536.6833.5026.3327.8032.67
N–S34.9635.5837.0334.6524.7824.6131.93
NW–SE32.0535.5937.5934.5726.1323.2331.53
Mean (D)34.8736.8537.4934.9025.7325.17-
p: 0.109 (RO), <0.001 (D), 0.558 (RO × D); LSD (5%): 2.004 (RO), 2.455 (D), 4.910 (RO × D).
E–W92.992.9673.1549.5522.0526.5959.53
NE–SW87.5984.657.5933.6122.8424.1951.74
N–S82.0682.2357.3940.1423.7325.5551.85
NW–SE78.7183.7360.4142.7524.5724.4352.43
Mean (D)85.3185.8862.1441.5123.325.19-
p: 0.019 (RO), <0.001 (D), 0.167 (RO × D); LSD (5%): 5.094 (RO), 5.032 (D), 10.440 (RO × D).
Table 5. Skin colour attributes of ‘Majestic Pearl’ nectarines subjected to different training systems. Means, ANOVAs’ p-values and Fisher Least Significant Differences (LSD, 5%) reported.
Colour AttributeTraining System (TS)Days from Harvest (D)Mean (TS)
−42−35−21−406
L*Cantilever trellis 145.6246.2249.0845.5134.1335.8742.74
Cantilever trellis 246.3849.6651.545.0034.8234.6543.67
Tatura Trellis50.8954.1953.1245.8334.0036.0445.68
Vertical Trellis47.6851.4053.3245.7334.8338.545.24
Mean (D)47.6450.3751.7645.5234.4436.27-
p: 0.041 (TS), <0.001 (D), 0.277 (TS × D); LSD (5%): 2.138 (TS), 2.176 (D), 4.469 (TS × D).
a*Cantilever trellis 15.065.3417.4623.6323.1221.3616.00
Cantilever trellis 21.83−0.6512.4221.4222.2621.2313.09
Tatura Trellis−2.21−2.1015.6024.7323.6223.3213.83
Vertical Trellis−2.80−1.9810.4623.6824.3023.1012.79
Mean (D)0.470.1513.9923.3723.3322.25-
p: 0.158 (TS), <0.001 (D), 0.122 (TS × D); LSD (5%): 3.128 (TS), 2.761 (D), 5.851 (TS × D).
b*Cantilever trellis 129.2529.6427.5822.3210.3110.8621.66
Cantilever trellis 231.5934.5030.8021.6010.459.8823.14
Tatura Trellis36.4137.3830.3421.729.6710.6624.36
Vertical Trellis34.5036.6632.9422.6411.1912.9425.15
Mean (D)32.9434.5530.4122.0710.4111.09-
p: 0.052 (TS), <0.001 (D), 0.267 (TS × D); LSD (5%): 2.502 (TS), 2.430 (D), 5.041 (TS × D).
C*Cantilever trellis 132.2833.5436.1435.1225.4224.2931.13
Cantilever trellis 234.0936.7237.1432.9824.9823.5231.57
Tatura Trellis37.7738.7938.3636.1625.5525.8433.75
Vertical Trellis35.3238.3638.3135.3626.9627.0033.55
Mean (D)34.8736.8537.4934.9025.7325.17-
p: 0.033 (TS), <0.001 (D), 0.734 (TS × D); LSD (5%): 2.004 (TS), 2.455 (D), 4.910 (TS × D).
Cantilever trellis 174.9275.0155.2341.6623.9525.6049.40
Cantilever trellis 282.9387.0163.9942.2423.9324.3754.08
Tatura Trellis90.4290.4860.5139.9721.7123.5554.44
Vertical Trellis92.9891.0368.8142.1723.6027.2357.64
Mean (D)85.3185.8862.1441.5123.3025.19-
p: 0.033 (TS), <0.001 (D), 0.114 (TS × D); LSD (5%): 5.094 (TS), 5.032 (D), 10.440 (TS × D).
Publisher’s Note: MDPI stays neutral with regard to jurisdictional claims in published maps and institutional affiliations.

