
Neglected Potential of Wild Garlic (Allium ursinum L.)—Specialized Metabolites Content and Antioxidant Capacity of Wild Populations in Relation to Location and Plant Phenophase

 ,
,  , and
, and 
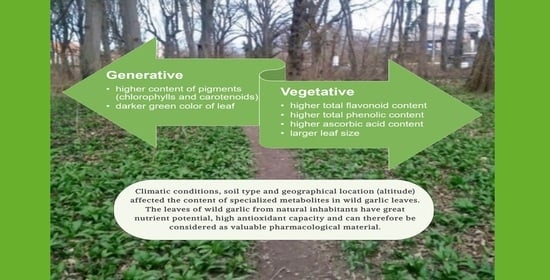
Abstract
:
1. Introduction
2. Materials and Methods
2.1. Plant Material
2.2. Determination of Morphological and Physicochemical Characteristics of Leaves
2.3. Determination of Specialized Metabolites and Antioxidant Capacity of Fresh Leaves
2.4. Statistical Analysis
3. Results and Discussion
3.1. Morphological and Physico-Chemical Characteristics of Wild Garlic Leaves
3.2. Specialized Metabolites and Antioxidant Capacity of Fresh Leaves
4. Conclusions
Author Contributions
Funding
Conflicts of Interest
List of Abbreviations
| GAE | gallic acid |
| TE | Trolox |
| AsA | ascorbic acid |
| DCPIP | 2,6-dichloroindophenol |
| TPC | total phenolic content |
| TFC | total flavonoid content |
| TNFC | total non-flavonoid content |
| Chl_a | chlorophyll a content |
| Chl_b | chlorophyll b content |
| TCh | total chlorophyll content |
| TCa | total carotenoid content |
| L | location |
| P | phenophase |
| L × P | location and phenophase |
| DM | total dry matter content |
| TA | total acid content |
References
- Prakash, B. Functional and Preservative Properties of Phytochemicals; Academic Press Elsevier: London, UK, 2020. [Google Scholar]
- Cena, H.; Calder, P.C. Defining a Healthy Diet: Evidence for the Role of Contemporary Dietary Patterns in Health and Disease. Nutrients 2020, 12, 334. [Google Scholar] [CrossRef] [Green Version]
- Demasi, S.; Mellano, M.G.; Falla, N.M.; Caser, M.; Scariot, V. Sensory Profile, Shelf Life, and Dynamics of Bioactive Compounds during Cold Storage of 17 Edible Flowers. Horticulturae 2021, 7, 166. [Google Scholar] [CrossRef]
- Oborny, B.; Botta-Dukát, Z.; Rudolf, K.; Morschhauser, T. Population ecology of Allium ursinum, a space-monopolizing clonal plant. Acta Bot. Hung. 2011, 53, 371–388. [Google Scholar] [CrossRef]
- Lenkova, M.; Bystricka, J.; Toth, T.; Hrstkova, M. Evaluation and comparison of the content of total polyphenols and antioxidant activity of selected species of the genus Allium. J. Cent. Eur. Agric. 2016, 17, 1119–1133. [Google Scholar] [CrossRef] [Green Version]
- Sobolewska, D.; Podolak, I.; Makowska-Wąs, J. Allium ursinum: Botanical, phytochemical and pharmacological overview. Phytochem. Rev. 2015, 14, 81–97. [Google Scholar] [CrossRef] [Green Version]
- Jeong, M.J.; Song, H.J.; Kim, H.G.; Park, D.J.; Yong, S.H.; Choi, E.; Seol, Y.; Ghimire, B.; Choi, M.S. The optimal cultivation conditions for wild garlic (Allium victorialis var. Platyphyllum) under the forests as a non-timber forest product (NTFP). Agrofor. Syst. 2019, 94, 747–760. [Google Scholar] [CrossRef]
- Kim, T.K. Edible Medicinal and Non-Medicinal Plants; Springer: Dordrecht, Germany, 2014; Volume 7. [Google Scholar]
- Pavlović, D.R.; Veljković, M.; Stojanović, N.M.; Gočmanac-Ignjatović, M.; Mihailov-Krstev, T.; Branković, S.; Sokolović, D.; Marčetić, M.; Radulović, N.; Radenković, M. Influence of different wild-garlic (Allium ursinum) extracts on the gastrointestinal system: Spasmolytic, antimicrobial and antioxidant properties. J. Pharm. Pharm. 2017, 69, 1208–1218. [Google Scholar] [CrossRef]
- Murugesan, S.; Pandiyan, A.; Saravanakumar, L.; Moodley, K.; Mackraj, I. Protective role of wild garlic on isoproterenol-induced myocardial necrosis in wistar rats. J. Ethnopharmacol 2019, 237, 108–115. [Google Scholar] [CrossRef]
- Stanisavljević, N.; Bajić, S.S.; Jovanović, Ž.; Matić, I.; Tolinački, M.; Popović, D.; Popović, N.; Terzić-Vidojević, A.; Golić, N.; Beškoski, V.; et al. Antioxidant and Antiproliferative Activity of Allium ursinum and Their Associated Microbiota During Simulated in vitro Digestion in the Presence of Food Matrix. Front. Microbiol. 2020, 11, 1–17. [Google Scholar] [CrossRef]
- Forma, A.; Chilimoniuk, Z.; Januszewski, J.; Sitarz, R. The Potential Application of Allium Extracts in the Treatment of Gastrointestinal Cancers. Gastroenterol. Insights 2021, 2, 136–146. [Google Scholar] [CrossRef]
- Rankovic, M.; Krivokapic, M.; Bradic, J.; Petkovic, A.; Zivkovic, V.; Sretenovic, J.; Jeremic, N.; Bolevich, S.; Kartashova, M.; Jeremic, J.; et al. New Insight into the Cardioprotective Effects of Allium ursinum L. Extract Against Myocardial Ischemia-Reperfusion Injury. Front. Physiol. 2021, 12, 1–14. [Google Scholar] [CrossRef]
- Coulston, A.M.; Rock, C.L.; Monsen, E.R. Nutrition in the Prevention and Treatment of Disease; Academic Press: Orlando, FL, USA, 2001. [Google Scholar]
- Wu, H.; Dushenkov, S.; Ho, C.-T.; Sang, S. Novel acetylated flavonoid glycosides from the leaves of Allium ursinum. Food Chem. 2009, 115, 592–595. [Google Scholar] [CrossRef]
- Gîtin, L.; Dinicǎ, R.; Parnavel, R. The influence of extraction method on the apparent content of bioactive compounds in Romanian Allium spp. leaves. Not. Bot. Horti Agrobot. Cluj-Napoca 2012, 40, 93–97. [Google Scholar] [CrossRef] [Green Version]
- Oszmiański, J.; Kolniak-Ostek, J.; Wojdyło, A. Characterization and content of flavonol derivatives of Allium ursinum L. plant. J. Agric Food Chem. 2013, 61, 176–184. [Google Scholar] [CrossRef]
- Piatkowska, E.; Kopeć, A.; Leszczynska, T. Basic chemical composition, content of micro and macroelements and antioxidant activity of different varieties of garlic’s leaves polish origin. Nauka Technol. Jakość 2015, 98, 181–192. [Google Scholar]
- Lachowicz, S.; Oszmiański, J.; Wiśniewski, R. Determination of triterpenoids, carotenoids, chlorophylls, and antioxidant capacity in Allium ursinum L. at different times of harvesting and anatomical parts. Eur. Food Res. Technol. 2018, 244, 1269–1280. [Google Scholar] [CrossRef] [Green Version]
- Ostročki, L. Statistical Yearbook of the Republic of Croatia; Croatian Bureau of Statistics: Zagreb, Croatia, 2018; pp. 1–158. [Google Scholar]
- IUSS Working Group WRB. World Reference Base for Soil Resources 2014-International Soil Classification System for Naming Soils and Creating Legends for Soil Maps; World Soil Resources Reports No. 106; FAO: Rome, Italy, 2014. [Google Scholar]
- Association of Officiating Analytical Chemists. Official Methods of Analysis: Method 1995, 6th ed.; AOAC International: Washington, DC, USA, 1995. [Google Scholar]
- Association of Officiating Analytical Chemists. Official Methods of Analysis: Method 2002, 17th ed.; AOAC International: Washington, DC, USA, 2002. [Google Scholar]
- Ough, C.S.; Amerine, M.A. Methods for Analysis of Musts and Wines; John Wiley and Sons: New York, NY, USA, 1988; pp. 1–377. [Google Scholar]
- Holm, G. Chlorophyll mutations in barley. Acta Agric. Scand. 1954, 4, 457–471. [Google Scholar] [CrossRef]
- Wettstein, D. Chlorophyll-letale und der submikroskopische Formwechsel der Plastiden. Exp. Cell Res. 1957, 12, 427–434. [Google Scholar] [CrossRef]
- Re, R.; Pellegrini, N.; Proteggente, A.; Pannala, A.; Yang, M.; Rice-Evans, C. Antioxidant activity applying an improved ABTS radical cation decolorization assay. Free Radic Biol. Med. 1999, 26, 1231–1237. [Google Scholar] [CrossRef]
- SAS Institute. SAS®/STAT 9.3; SAS Institute Inc.: Cary, NC, USA, 2011. [Google Scholar]
- Todorović, V.; Lazić, B.; Igić, R.; Đurovka, M. The characteristics of different populations of spring onion Allium ursinum L. In the area of Republic of Srpska. In Proceedings of the 44th Croatian & 4th International Symposium on Agriculture, Opatija, Croatia, 16–20 February 2009; Faculty of Agriculture, University of Josip Juraj Strossmayer in Osijek: Osijek, Croatia, 2009; pp. 454–458. [Google Scholar]
- Błażewicz-Woźniak, M.; Michowska, A. The growth, flowering and chemical composition of leaves of three ecotypes of Allium ursinum L. Acta Agrobot. 2011, 64, 171–180. [Google Scholar] [CrossRef] [Green Version]
- Hunter, L.H. a, b Color Scale. Applications Note 8(9). 2012. Available online: http://www.hunterlab.se/wp-content/uploads/2012/11/Hunter-L-a-b.pdf (accessed on 15 June 2021).
- Dyduch, J.; Najda, A. Estimation of the biological value of winter garlic leaves from early cultivation on bunch crop. Part II. Plants grown from planting air bulbs. Electron J. Pol. Agric Univ. 2011, 3. Available online: http://www.ejpau.media.pl/volume3/issue2/horticulture/art-05.html (accessed on 28 February 2019).
- Ahanger, M.A.; Singh Tomar, N.; Tittal, M.; Argal, S.; Agarwal, R.M. Plant growth under water/salt stress: ROS production; antioxidants and significance of added potassium under such conditions. Physiol. Mol. Biol. Plants 2017, 23, 731–744. [Google Scholar] [CrossRef]
- Akram, N.; Shafiq, F.; Ashraf, M. Ascorbic Acid-A Potential Oxidant Scavenger and Its Role in Plant Development and Abiotic Stress Tolerance. Front. Plant Sci. 2017, 8, 613. [Google Scholar] [CrossRef] [PubMed]
- Abdelgawad, K.F.; El-Mogy, M.M.; Mohamed, M.I.A.; Garchery, C.; Stevens, R.G. Increasing Ascorbic Acid Content and Salinity Tolerance of Cherry Tomato Plants by Suppressed Expression of the Ascorbate Oxidase Gene. Agronomy 2019, 9, 51. [Google Scholar] [CrossRef] [Green Version]
- An, H.; Jiang, S.; Zhang, J.; Xu, F.; Zhang, X. Comparative Transcriptomic Analysis of Differentially Expressed Transcripts Associated with Flowering Time of Loquat (Eriobotya japonica Lindl.). Horticulturae 2021, 7, 171. [Google Scholar] [CrossRef]
- Gaafar, A.A.; Ali, S.I.; El-Shawadfy, M.A.; Salama, Z.A.; Sękara, A.; Ulrichs, C.; Abdelhamid, M.T. Ascorbic Acid Induces the Increase of Secondary Metabolites, Antioxidant Activity, Growth, and Productivity of the Common Bean under Water Stress Conditions. Plants 2020, 9, 627. [Google Scholar] [CrossRef]
- Barth, C.; De Tullio, M.; Conklin, P.L. The role of ascorbic acid in the control of flowering time and the onset of senescence. J. Exp. Bot. 2006, 57, 1657–1665. [Google Scholar] [CrossRef]
- Gallie, D.R. L-Ascorbic Acid: A Multifunctional Molecule Supporting Plant Growth and Development. Scientifica 2013, 2013, 795964. [Google Scholar] [CrossRef] [Green Version]
- Paciolla, C.; Fortunato, S.; Dipierro, N.; Paradiso, A.; De Leonardis, S.; Mastropasqua, L.; de Pinto, M.C. Vitamin C in Plants: From Functions to Biofortification. Antioxidants 2019, 8, 519. [Google Scholar] [CrossRef] [Green Version]
- Isah, T. Stress and defense responses in plant secondary metabolites production. Biol. Res. 2019, 52, 1–25. [Google Scholar] [CrossRef] [Green Version]
- Marchiosi, R.; dos Santos, W.D.; Constantin, P.P.; de Lima, R.B.; Soares, A.R.; Finger-Teixeira, A.; Mota, T.R.; de Oliveira, D.M.; Foletto-Felipe, M.P.; Abrahão, J.; et al. Biosynthesis and metabolic actions of simple phenolic acids in plants. Phytochem. Rev. 2020, 19, 865–906. [Google Scholar] [CrossRef]
- Šamec, D.; Karalija, E.; Šola, I.; Vujčić Bok, V.; Salopek-Sondi, B. The Role of polyphenols in abiotic stress response: The influence of molecular structure. Plants 2021, 10, 118. [Google Scholar] [CrossRef] [PubMed]
- Ahmad, S.S.; Tahir, I. Regulatory role of phenols in flower development and senescence in the genus Iris. Ind J Plant Physiol. 2017, 22, 135–140. [Google Scholar] [CrossRef]
- Shahri, W.; Tahi, I.; Islam, S.T.; Bhat, M.A. Physiological and biochemical changes associated with flower development and senescence in so far unexplored Helleborus orientalis Lam. cv. Olympicus. Physiol. Mol. Biol. Plants 2011, 17, 33–39. [Google Scholar] [CrossRef] [Green Version]
- Dar, R.A.; Tahir, I.; Ahmad, S.S. Sugars and sugar alcohols have their say in the regulation of flower senescence in Dianthus chinensis L. Sci. Hortic. 2014, 174, 24–28. [Google Scholar] [CrossRef]
- Dar, R.A.; Tahir, I.; Ahmad, S.S. Physiological and biochemical changes associated with flower development and senescence in Dianthus chinensis L. Indian J. Plant Physiol. 2014, 19, 215–221. [Google Scholar] [CrossRef]
- Nisar, S.; Tahir, I.; Ahmad, S.S. Modulation of flower senescence in Nicotiana plumbaginifolia L. by polyamines. Indian J. Plant Physiol. 2015, 20, 186–190. [Google Scholar] [CrossRef]
- Lattanzio, M.; Lattanzio, V.M.T.; Cardinali, A. Role of phenolics in the resistance mechanisms of plants against fungal pathogens and insects. Phytochem. Adv. Res. 2006, 661, 23–67. [Google Scholar]
- Schmitzer, V.; Veberic, R.; Osterc, G.; Stampar, F. Color and phenolic content changes during flower development in groundcover rose. J. Am. Chem. Soc. 2010, 135, 195–202. [Google Scholar] [CrossRef] [Green Version]
- Hasan, M.M.; Bashir, T.; Ghosh, R.; Lee, S.K.; Bae, H. An Overview of LEDs’ Effects on the Production of Bioactive Compounds and Crop Quality. Molecules 2017, 22, 1420. [Google Scholar] [CrossRef] [Green Version]
- Matsuda, R.; Ito, H.; Fujiwara, K. Effects of Artificially Reproduced Fluctuations in Sunlight Spectral Distribution on the Net Photosynthetic Rate of Cucumber Leaves. Front. Plant Sci. 2021, 12, 675810. [Google Scholar] [CrossRef] [PubMed]
- Ma, Y.; Xu, A.; Cheng, Z.-M. Effects of light emitting diode lights on plant growth, development and traits a meta-analysis. Hortic. Plant J. 2021, 7, 552–564. [Google Scholar] [CrossRef]
- Sousa-Souto, L.; Bocchiglieri, A.; Dias, D.M.; Ferreira, A.S.; Filho, J.P.L. Changes in leaf chlorophyll content associated with flowering and its role in the diversity of phytophagous insects in a tree species from a semiarid Caatinga. PeerJ 2018, 6, e5059. [Google Scholar] [CrossRef] [PubMed]
- Azigwe, C.; Zoryeku, P.A.D.; Asante, I.K.; Oppong-Adjei, F. Effect of gamma irradiation on chlorophyll content in the cowpea (Vigna unguiculata (L.) Walp). Ghana J. Sci. 2020, 61, 113–117. [Google Scholar] [CrossRef]
- Wink, M. Functions and Biotechnology of Plant Secondary Metabolites; Blackwell Publishing Ltd.: West Sussex, UK; John Wiley & Sons Ltd.: West Sussex, UK, 2010. [Google Scholar]
- Li, N.; Jia, Z.; Trush, M.A. Defining ROS in Biology and Medicine. React Oxyg Species 2016, 1, 1–10. [Google Scholar] [CrossRef] [Green Version]


| Location Name/No. | Location Coordinates | Area | Altitude (m) | Air Temperatures (°C) * | Precipitation (mm) * | Number of Sunny Days * | Soil Type |
|---|---|---|---|---|---|---|---|
| ZG I (LO 1) | 45.837714, 16.019946 | Zagreb | 132 | 12.6 | 897 | 69 | stagnosol albi |
| ZG II (LO 2) | 45.812264, 16.035347 | 125 | 12.6 | 897 | 69 | alluvial soil | |
| ZG III (LO 3) | 45.828827, 15.950356 | 250 | 13.6 | 888.5 | 59 | stagnosol albi | |
| S-R (LO 4) | 45.774578, 15.684153 | Samobor mountain | 287 | 11.7 | 1 167.6 | 42 | sour brown on clasts |
| Location | L* | a* | b* | C | h° |
|---|---|---|---|---|---|
| Before flowering | |||||
| LO 1 | 22.65 ab ± 0.94 | −11.66 ab ± 0.27 | 17.01 bc ± 0.91 | 20.1 bc ± 1.55 | 125.77 b ± 2.12 |
| LO 2 | 21.82 c ± 0.24 | −12.54 a ± 0.55 | 15.33 cd ± 0.61 | 19.8 bc ± 0.79 | 129.27 a ± 0.59 |
| LO 3 | 19.42 c ± 2.54 | −9.29 b ± 1.02 | 12.26 d ± 1.34 | 15.39 d ± 1.68 | 127.63 ab ± 2.71 |
| LO 4 | 29.44 a ± 1.01 | −12.19 ab ± 0.61 | 24.45 a ± 1.95 | 27.34 a ± 1.45 | 116.62 d ± 1.16 |
| Flowering stage | |||||
| LO 1 | 28.94 a ± 0.27 | −11.99 ab ± 0.37 | 20.39 b ± 0.09 | 22.55 b ± 0.89 | 120.74 c ± 0.34 |
| LO 2 | 21.65 c ± 1.01 | −10.78 b ± 0.87 | 13.21 d ± 1.74 | 17.06 cd ± 1.89 | 129.33 ± 1.53 |
| LO 3 | 21.58 c ± 1.09 | −10.78 b ± 0.74 | 13.84 cd ± 1.14 | 17.54 cd ± 1.34 | 127.76 ab ± 0.56 |
| LO 4 | 26.06 ab ± 4.52 | −11.61 ab ± 0.25 | 18.95 b ± 1.02 | 22.23 b ± 0.95 | 121.51 c ± 3.06 |
| ANOVA | p ≤ 0.0002 | p ≤ 0.0580 | p ≤ 0.0001 | p ≤ 0.0006 | p ≤ 0.0001 |
| LSD | 3.4298 | 1.8496 | 3.435 | 3.8643 | 3.1166 |
| Location (L) | 0.0001 | 0.0189 | 0.0001 | 0.0001 | 0.0001 |
| Phenophase (P) | 0.1715 | 0.7596 | 0.4312 | 0.3859 | 0.9801 |
| L × P | 0.0083 | 0.0815 | 0.0080 | 0.0251 | 0.0032 |
| Location | DM (%) | TA (%) | pH |
|---|---|---|---|
| Before flowering | |||
| LO 1 | 10.69 a ± 0.54 | 0.077 ab ± 0.008 | 5.42 c ± 0.03 |
| LO 2 | 10.03 bc ± 0.08 | 0.06 cd | 5.39 c ± 0.03 |
| LO 3 | 9.74 c ± 0.1 | 0.05 d ± 0.001 | 5.55 b ± 0.05 |
| LO 4 | 8.86 d ± 0.1 | 0.05 d ± 0.001 | 5.54 b ± 0.05 |
| Flowering stage | |||
| LO 1 | 8.99 d ± 0.32 | 0.06 cd ± 0.011 | 5.56 b ± 0.13 |
| LO 2 | 9.72 c ± 0.02 | 0.06 cd ± 0.001 | 5.67 a ± 0.06 |
| LO 3 | 9.24 d ± 0.1 | 0.077 ab ± 0.001 | 5.74 a ± 0.02 |
| LO 4 | 10.39 ab ± 0.12 | 0.087 a ± 0.001 | 5.71 a ± 0.06 |
| ANOVA | p ≤ 0.0001 | p ≤ 0.0005 | p ≤ 0.0001 |
| LSD | 0.4294 | 0.0123 | 0.0994 |
| Location (L) | 0.0430 | 0.0007 | 0.2506 |
| Phenophase (P) | 0.0238 | 0.0001 | 0.0004 |
| L × P | 0.0001 | 0.2718 | 0.0001 |
| Location | AsA (mg/100g fw) | TPC (mg GAE/100g fw) | TFC (mg CTH 100/g fw) | TNFC (mg GAE 100/g fw) |
|---|---|---|---|---|
| Before flowering | ||||
| LO 1 | 50.06 c ± 2.21 | 184.05 a ± 7.09 | 105.48 a ± 1.69 | 78.56 bc ± 8.79 |
| LO 2 | 63.31 a ± 1.18 | 184.09 a ± 2.04 | 109.98 a ± 2.15 | 74.31 cd ± 0.34 |
| LO 3 | 57.46 b ± 0.001 | 186.18 a ± 2.52 | 110.65 a ± 2.84 | 75.61 cd ± 0.72 |
| LO 4 | 51.73 c ± 2.67 | 138.41 cd ± 0.36 | 75.49 c ± 1.1 | 62.92 ef ± 1.02 |
| Flowering stage | ||||
| LO 1 | 24.06 f ± 2.78 | 164.72 b ± 11.51 | 97 b ± 3.85 | 67.72 de ± 7.66 |
| LO 2 | 30.23 e ± 1.47 | 132.15 d ± 0.53 | 76.57 c ± 0.84 | 55.53 f ± 1.06 |
| LO 3 | 27.58 ef ± 2.71 | 147.2 c ± 1.45 | 61.53 d ± 1.26 | 85.67 ab ± 0.26 |
| LO 4 | 39.17 c ± 1.47 | 167.63 b ± 0.92 | 79.28 c ± 1.73 | 88.35 a ± 1.25 |
| ANOVA | p ≤ 0.0001 | p ≤ 0.0001 | p ≤ 0.0001 | p ≤0.0001 |
| LSD | 4.5199 | 11.545 | 5.4827 | 9.6124 |
| Location (L) | 0.0001 | 0.0001 | 0.0001 | 0.0001 |
| Phenophase (P) | 0.0001 | 0.0001 | 0.0001 | 0.4049 |
| L × P | 0.0001 | 0.0001 | 0.0001 | 0.0001 |
| Location | Chl_a (mg/g) | Chl_b (mg/g) | TCh (mg/g) | TCa (mg/g) |
|---|---|---|---|---|
| Before flowering | ||||
| LO 1 | 0.81 b ± 0.015 | 0.4 bc ± 0.05 | 1.20 bc ± 0.07 | 0.56 b ± 0.02 |
| LO 2 | 0.73 c ± 0.001 | 0.34 cd ± 0.06 | 1.07 cde ± 0.01 | 0.50 c ± 0.01 |
| LO 3 | 0.69 cd ± 0.001 | 0.29 d ± 0.001 | 0.99 de ± 0.001 | 0.49 c ± 0.01 |
| LO 4 | 0.66 d ± 0.001 | 0.28 d ± 0.001 | 0.94 e ± 0.001 | 0.46 c ± 0.001 |
| Flowering stage | ||||
| LO 1 | 0.82 b ± 0.08 | 0.45 ab ± 0.07 | 1.28 b ± 0.14 | 0.58 ab ± 0.05 |
| LO 2 | 0.89 a ± 0.001 | 0.52 a ± 0.001 | 1.42 a ± 0.001 | 0.62 a ± 0.001 |
| LO 3 | 0.71 cd ± 0.001 | 0.39 bc ± 0.02 | 1.10 cd ± 0.02 | 0.49 c ± 0.001 |
| LO 4 | 0.65 d ± 0.001 | 0.43 b ± 0.001 | 1.07 cde ± 0.001 | 0.48 c ± 0.01 |
| ANOVA | p ≤ 0.0001 | p ≤ 0.0001 | p ≤ 0.0001 | p ≤ 0.0001 |
| LSD | 0.0725 | 0.076 | 0.1394 | 0.0456 |
| Location (L) | 0.0001 | 0.0001 | 0.0001 | 0.0001 |
| Phenophase (P) | 0.0031 | 0.0001 | 0.0001 | 0.0001 |
| L × P | 0.0007 | 0.0105 | 0.0025 | 0.0003 |
Publisher’s Note: MDPI stays neutral with regard to jurisdictional claims in published maps and institutional affiliations. |
© 2021 by the authors. Licensee MDPI, Basel, Switzerland. This article is an open access article distributed under the terms and conditions of the Creative Commons Attribution (CC BY) license (https://creativecommons.org/licenses/by/4.0/).
Share and Cite
Voća, S.; Šic Žlabur, J.; Fabek Uher, S.; Peša, M.; Opačić, N.; Radman, S. Neglected Potential of Wild Garlic (Allium ursinum L.)—Specialized Metabolites Content and Antioxidant Capacity of Wild Populations in Relation to Location and Plant Phenophase. Horticulturae 2022, 8, 24. https://0-doi-org.brum.beds.ac.uk/10.3390/horticulturae8010024
Voća S, Šic Žlabur J, Fabek Uher S, Peša M, Opačić N, Radman S. Neglected Potential of Wild Garlic (Allium ursinum L.)—Specialized Metabolites Content and Antioxidant Capacity of Wild Populations in Relation to Location and Plant Phenophase. Horticulturae. 2022; 8(1):24. https://0-doi-org.brum.beds.ac.uk/10.3390/horticulturae8010024
Chicago/Turabian StyleVoća, Sandra, Jana Šic Žlabur, Sanja Fabek Uher, Marija Peša, Nevena Opačić, and Sanja Radman. 2022. "Neglected Potential of Wild Garlic (Allium ursinum L.)—Specialized Metabolites Content and Antioxidant Capacity of Wild Populations in Relation to Location and Plant Phenophase" Horticulturae 8, no. 1: 24. https://0-doi-org.brum.beds.ac.uk/10.3390/horticulturae8010024