
Effects of Yeast Product Addition and Fermentation Temperature on Lipid Composition, Taste and Mouthfeel Characteristics of Pinot Noir Wine


Abstract
:
1. Introduction
2. Materials and Methods
2.1. Chemicals
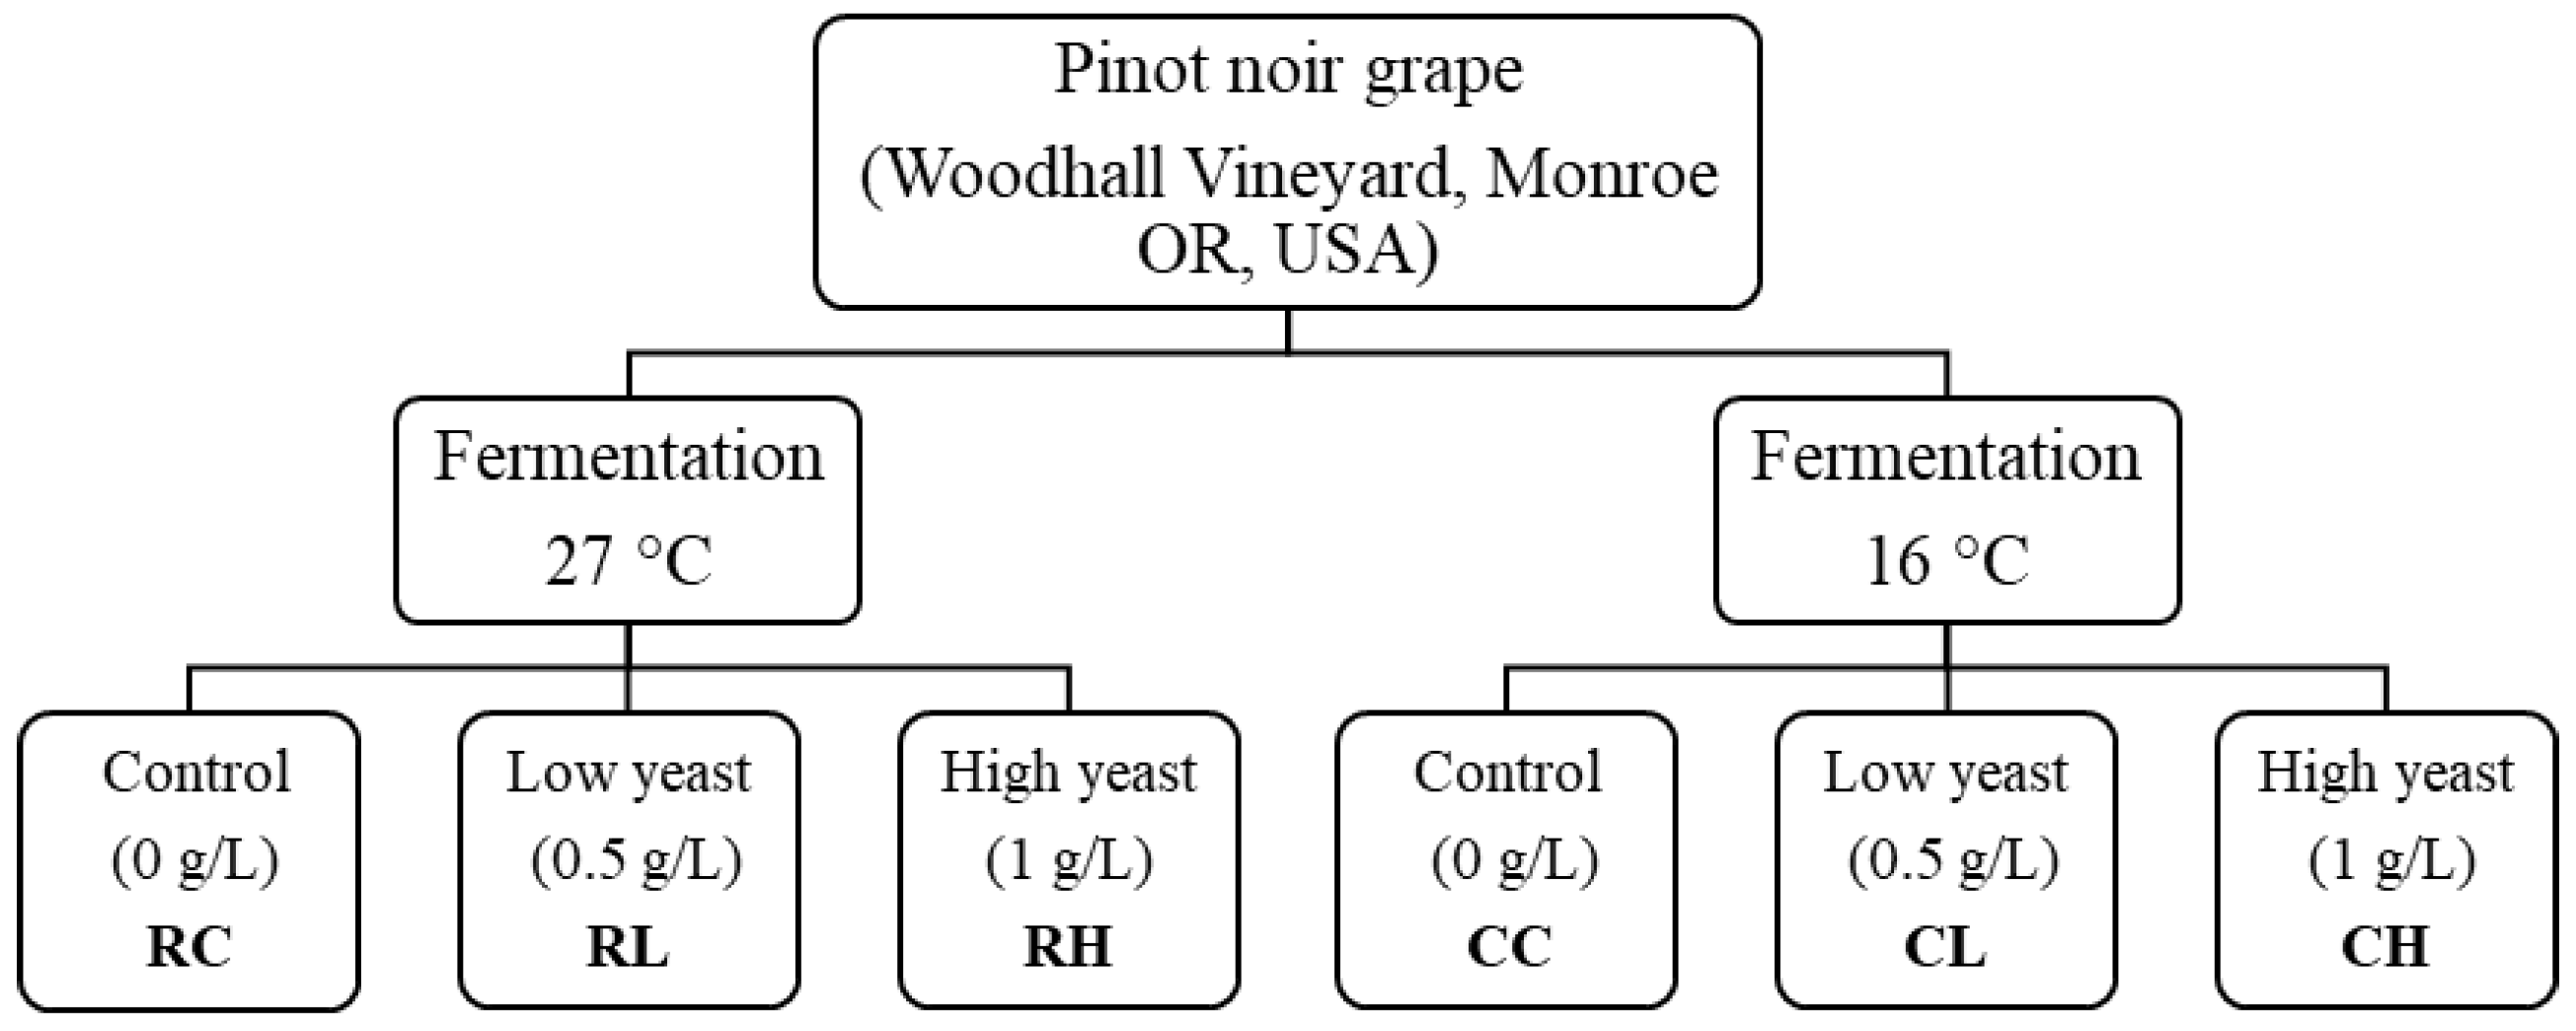
2.2. Winemaking
2.3. Basic Chemistry Analyses
2.4. Lipid Analyses
2.5. Sensory Setup
2.6. Panelists
2.7. Descriptive Analysis
2.8. Check-All-That-Apply (CATA)
2.9. Statistical Analyses
2.9.1. Wine Chemistry
2.9.2. Wine Sensory
3. Results
3.1. Basic Chemistry
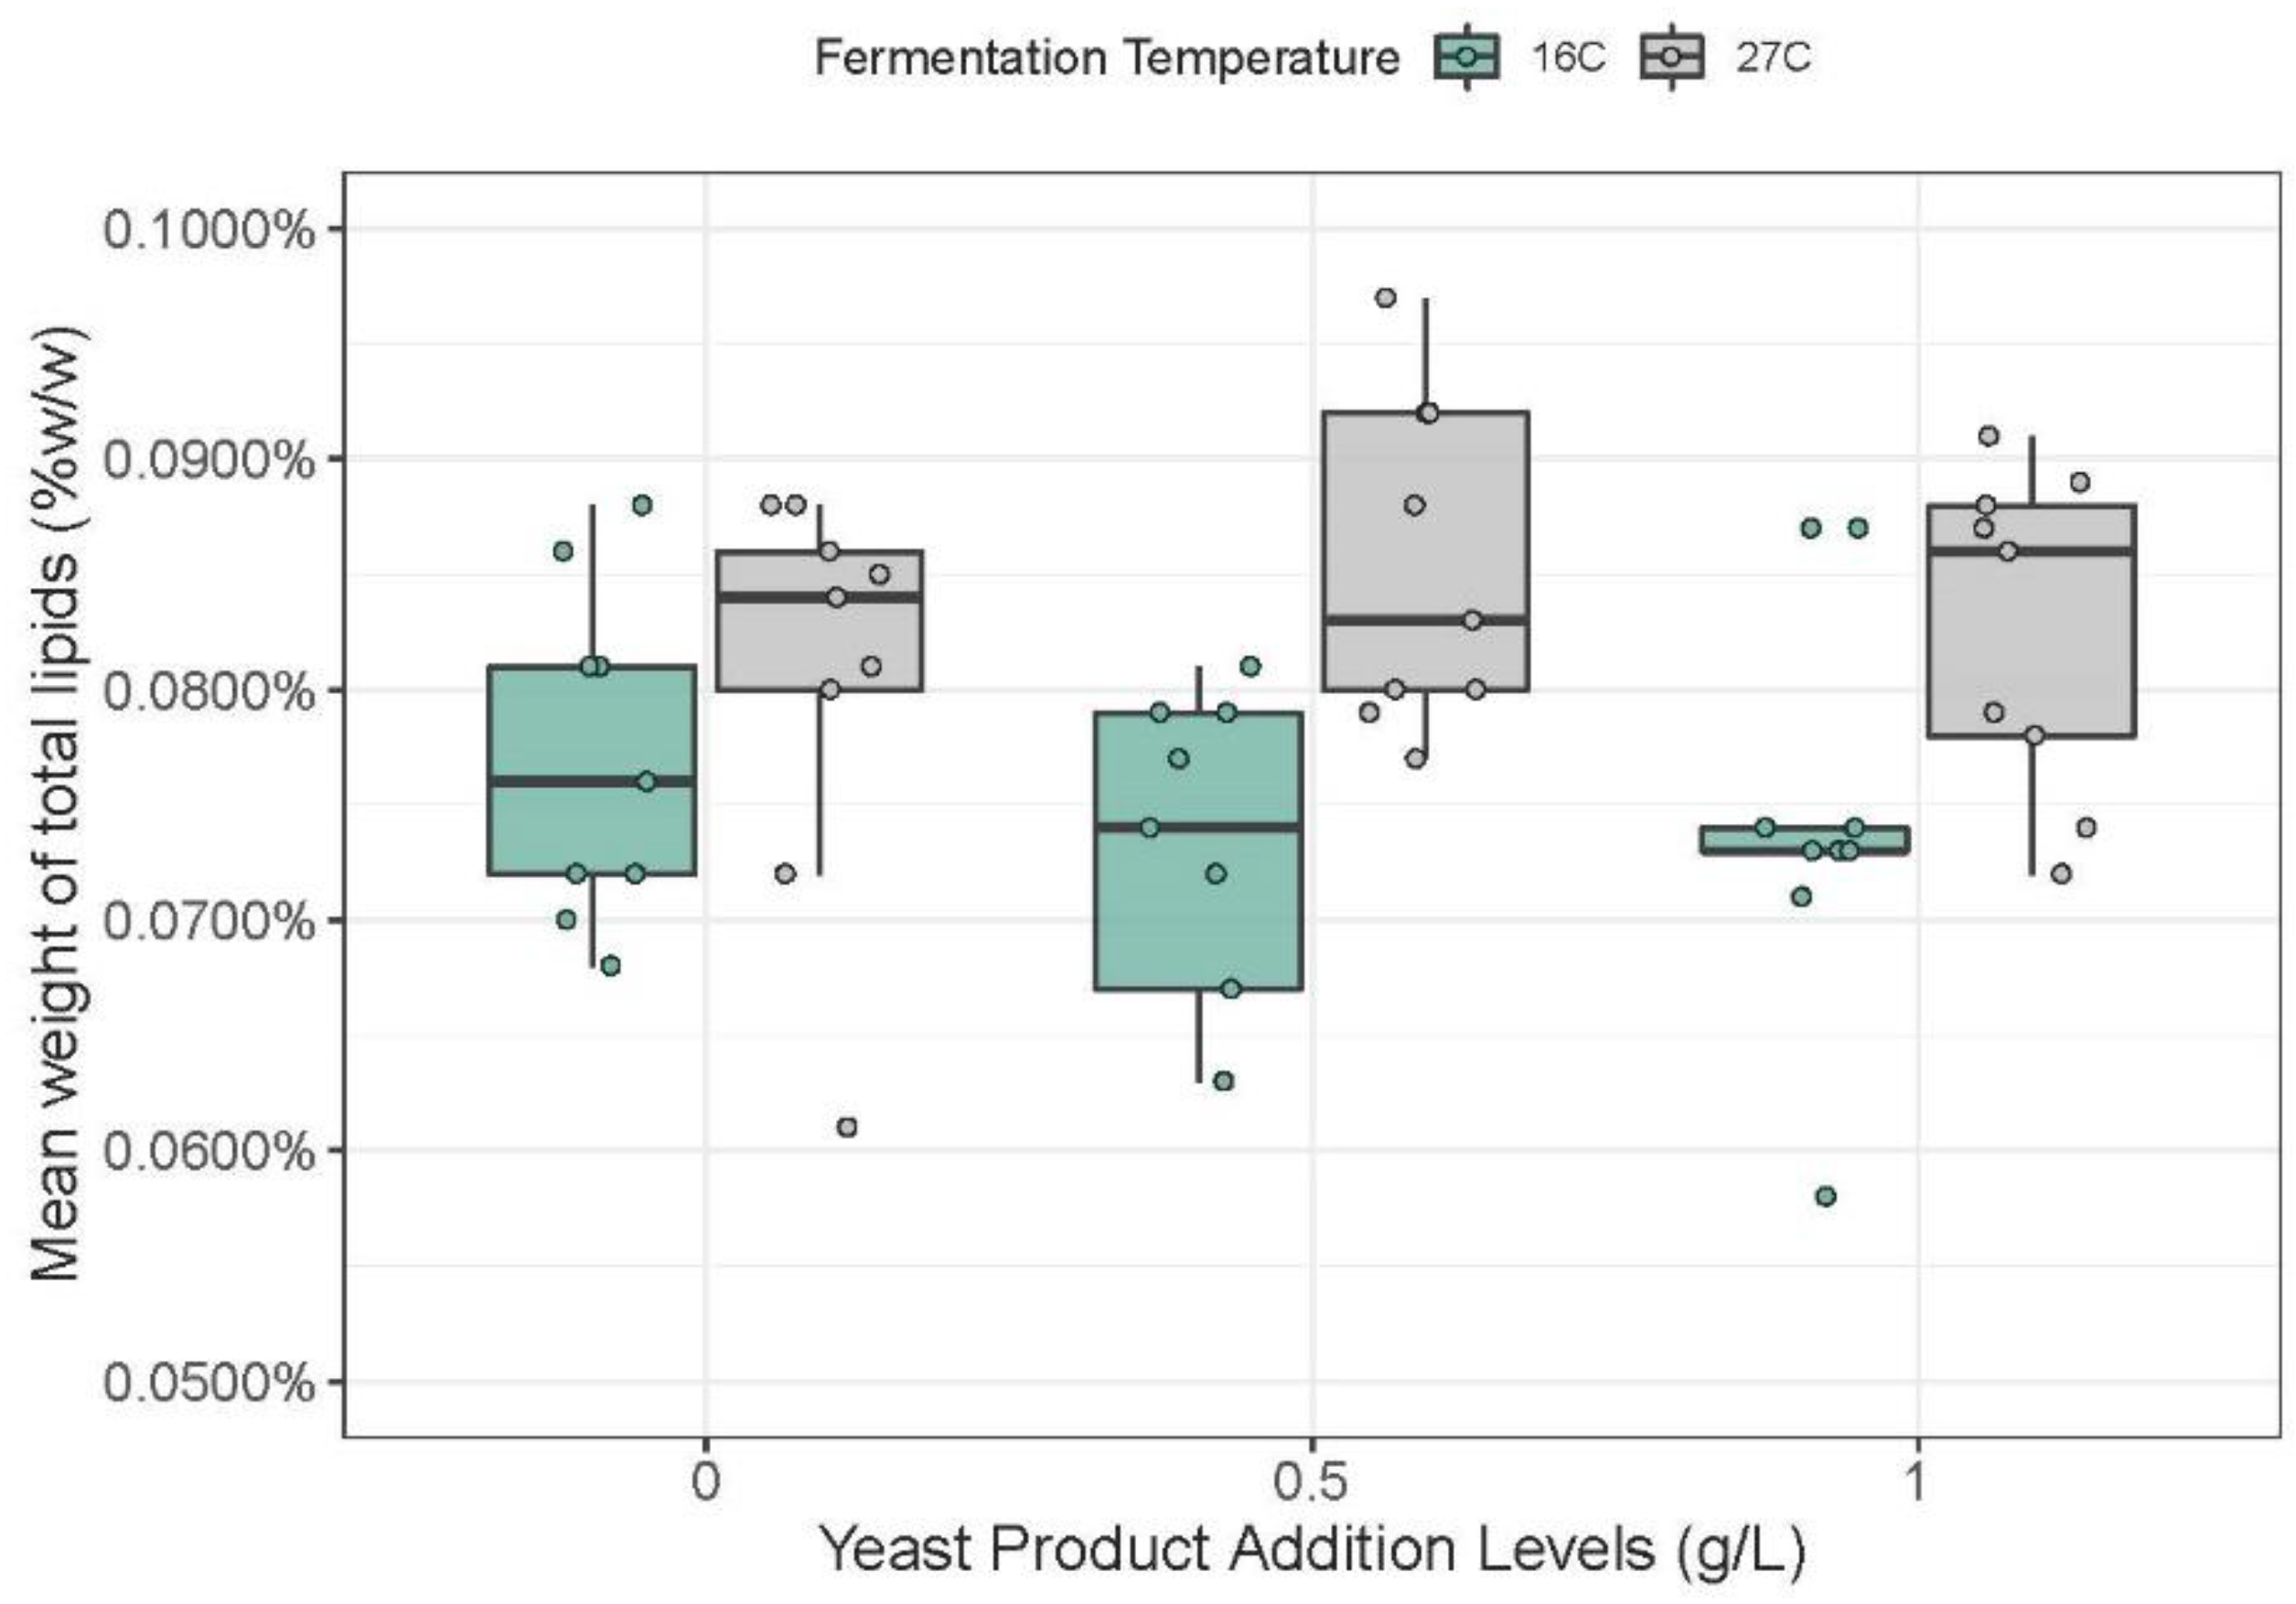
3.2. Total Lipids
3.3. Lipid Profiles
3.4. Sensory-Descriptive Analysis
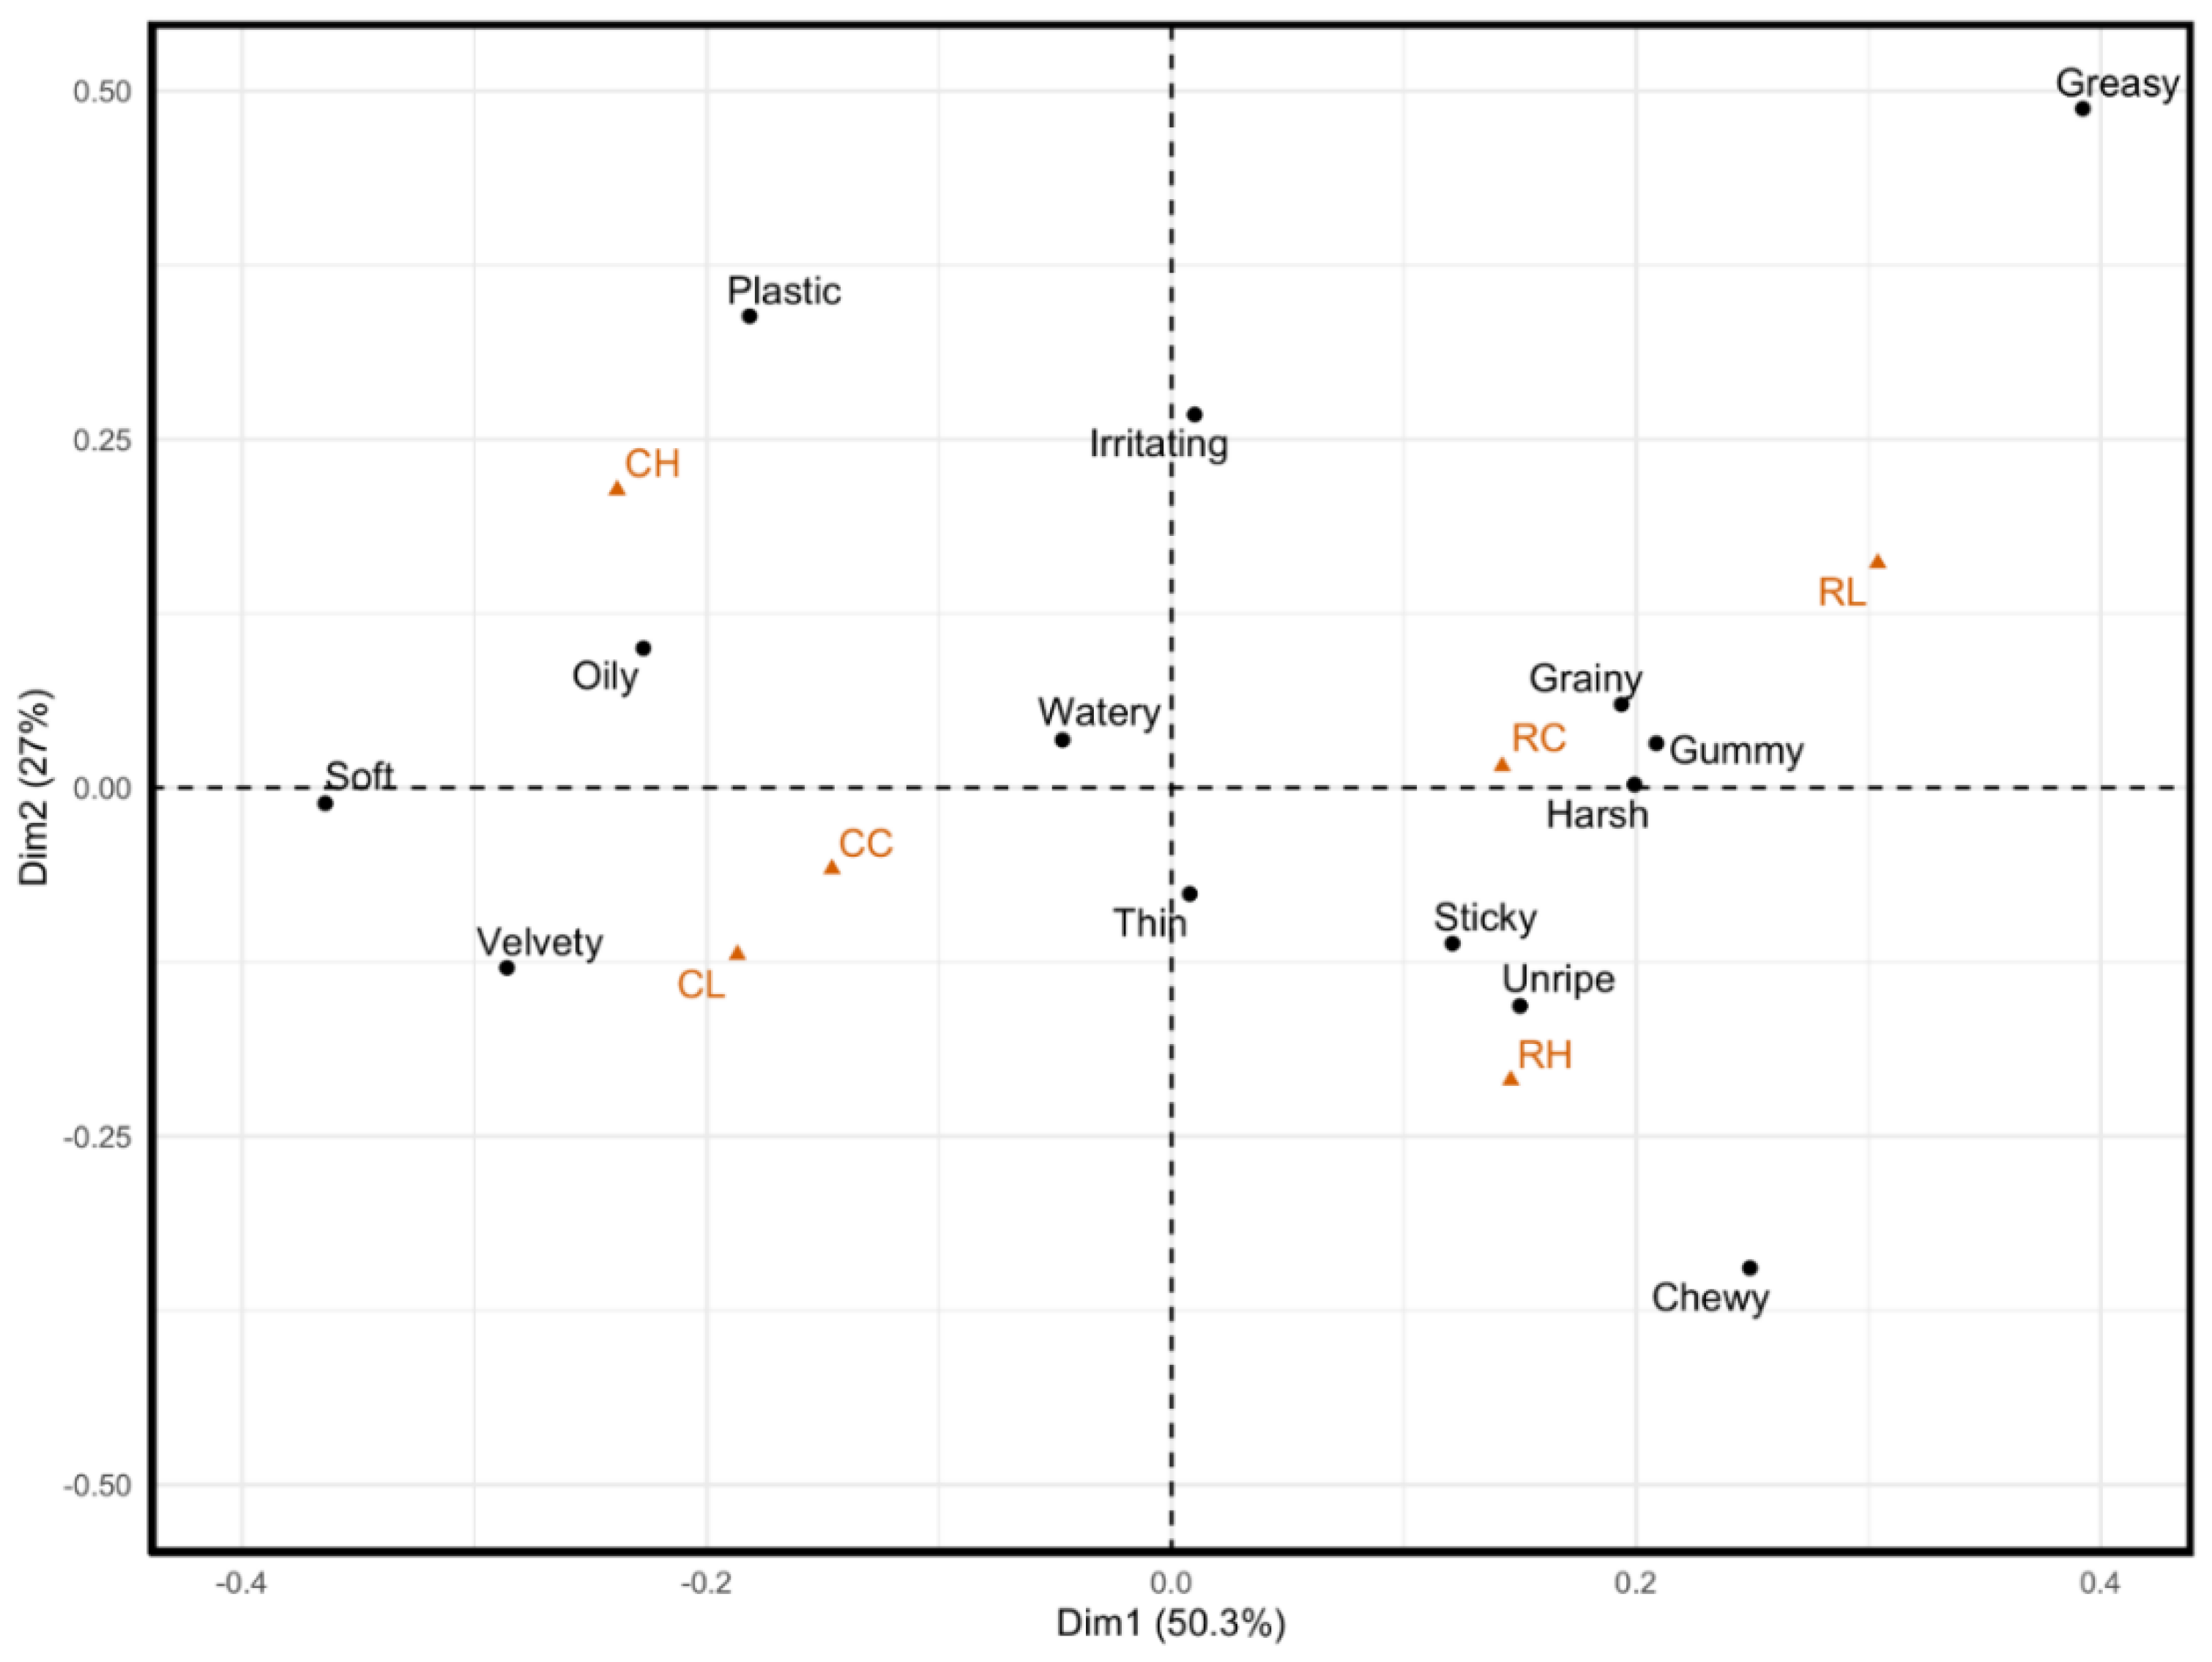
3.5. Sensory—CATA
4. Discussion
4.1. Impacts of Yeast Fermentation Temperature on Wine Lipids, Taste and Mouthfeel Perception
4.2. Impacts of Yeast Product Addition on Wine Lipids, Taste and Mouthfeel Perception
4.3. Impacts of Wine Lipids on Taste and Mouthfeel Perception
5. Conclusions
Supplementary Materials
Author Contributions
Funding
Institutional Review Board Statement
Informed Consent Statement
Acknowledgments
Conflicts of Interest
References
- Bertino, M.; Lawless, H.T. Understanding Mouthfeel Attributes: A Multidimensional Scaling Approach. J. Sens. Stud. 1993, 8, 101–114. [Google Scholar] [CrossRef]
- Cosme, F.; Vilela, A.; Jordão, A.M.; Desk, S. Wine Phenolics: Looking for a Smooth Mouthfeel. J. Food Sci. Technol. 2016, 1, 20–28. [Google Scholar]
- Laguna, L.; Bartolomé, B.; Moreno-Arribas, M.V. Mouthfeel Perception of Wine: Oral Physiology, Components and Instrumental Characterization. Trends Food Sci. Technol. 2017, 59, 49–59. [Google Scholar] [CrossRef]
- Niimi, J.; Danner, L.; Li, L.; Bossan, H.; Bastian, S.E.P. Wine Consumers’ Subjective Responses to Wine Mouthfeel and Understanding of Wine Body. Food Res. Int. 2017, 99, 115–122. [Google Scholar] [CrossRef] [Green Version]
- Runnebaum, R.C.; Boulton, R.B.; Powell, R.L.; Heymann, H. Key Constituents Affecting Wine Body—An Exploratory Study. J. Sens. Stud. 2011, 26, 62–70. [Google Scholar] [CrossRef]
- Furlan, A.L.; Castets, A.; Nallet, F.; Pianet, I.; Grélard, A.; Dufourc, E.J.; Géan, J. Red Wine Tannins Fluidify and Precipitate Lipid Liposomes and Bicelles. A Role for Lipids in Wine Tasting? Langmuir 2014, 30, 5518–5526. [Google Scholar] [CrossRef]
- Phan, Q.; Hoffman, S.; Tomasino, E. Contribution of Lipids to Taste and Mouthfeel Perception in a Model Wine Solution. ACS Food Sci. Technol. 2021, 1, 1561–1566. [Google Scholar] [CrossRef]
- Jackson, R.S. Wine Tasting: A Professional Handbook; Academic Press: San Diego, CA, USA, 2016; ISBN 978-0-12-801826-2. [Google Scholar]
- Phan, Q.; Tomasino, E. Untargeted Lipidomic Approach in Studying Pinot Noir Wine Lipids and Predicting Wine Origin. Food Chem. 2021, 355, 129409. [Google Scholar] [CrossRef] [PubMed]
- Waterhouse, A.L.; Sacks, G.L.; Jeffery, D.W. Understanding Wine Chemistry; John Wiley & Sons, Inc.: West Sussex, UK, 2016; ISBN 978-1-118-62780-8. [Google Scholar]
- Harbertson, J.F.; Hodgins, R.E.; Thurston, L.N.; Schaffer, L.J.; Reid, M.S.; Landon, J.L.; Ross, C.F.; Adams, D.O. Variability of Tannin Concentration in Red Wines. Am. J. Enol. Vitic. 2008, 59, 210–214. [Google Scholar]
- Vidal, S.; Courcoux, P.; Francis, L.; Kwiatkowski, M.; Gawel, R.; Williams, P.; Waters, E.; Cheynier, V. Use of an Experimental Design Approach for Evaluation of Key Wine Components on Mouth-Feel Perception. Food Qual. Prefer. 2004, 15, 209–217. [Google Scholar] [CrossRef]
- Woody, R.C.; Schmidt, R. Following the Roots of Oregon Wine. Or. Hist. Q. 2013, 114, 324–339. [Google Scholar] [CrossRef]
- Li, S.; Bindon, K.; Bastian, S.E.P.; Jiranek, V.; Wilkinson, K.L. Use of Winemaking Supplements to Modify the Composition and Sensory Properties of Shiraz Wine. J. Agric. Food Chem. 2017, 65, 1353–1364. [Google Scholar] [CrossRef] [PubMed]
- Dequin, S.; Escudier, J.-L.; Bely, M.; Noble, J.; Albertin, W.; Masneuf-Pomarède, I.; Marullo, P.; Salmon, J.-M.; Sablayrolles, J.M. How to Adapt Winemaking Practices to Modified Grape Composition under Climate Change Conditions. OENO One 2017, 51, 205–214. [Google Scholar] [CrossRef]
- Sacchi, K.L.; Bisson, L.F.; Adams, D.O. A Review of the Effect of Winemaking Techniques on Phenolic Extraction in Red Wines. Am. J. Enol. Vitic. 2005, 56, 197–206. [Google Scholar]
- Unterkofler, J.; Muhlack, R.A.; Jeffery, D.W. Processes and Purposes of Extraction of Grape Components during Winemaking: Current State and Perspectives. Appl. Microbiol. Biotechnol. 2020, 104, 4737–4755. [Google Scholar] [CrossRef]
- Hunter, K.; Rose, A.H. Lipid Composition of Saccharomyces Cerevisiae as Influenced by Growth Temperature. Biochim. Biophys. Acta (BBA) Lipids Lipid Metab. 1972, 260, 639–653. [Google Scholar] [CrossRef]
- Coleman, M.C.; Fish, R.; Block, D.E. Temperature-Dependent Kinetic Model for Nitrogen-Limited Wine Fermentations. Appl. Environ. Microbiol. 2007, 73, 5875–5884. [Google Scholar] [CrossRef] [Green Version]
- Henderson, C.M.; Block, D.E. Examining the Role of Membrane Lipid Composition in Determining the Ethanol Tolerance of Saccharomyces Cerevisiae. Appl. Environ. Microbiol. 2014, 80, 2966–2972. [Google Scholar] [CrossRef] [Green Version]
- Gil-Muñoz, R.; Moreno-Pérez, A.; Vila-López, R.; Fernández-Fernández, J.I.; Martínez-Cutillas, A.; Gómez-Plaza, E. Influence of Low Temperature Prefermentative Techniques on Chromatic and Phenolic Characteristics of Syrah and Cabernet Sauvignon Wines. Eur. Food Res. Technol. 2009, 228, 777–788. [Google Scholar] [CrossRef]
- Reynolds, A.; Cliff, M.; Girard, B.; Kopp, T.G. Influence of Fermentation Temperature on Composition and Sensory Properties of Semillon and Shiraz Wines. Am. J. Enol. Vitic. 2001, 52, 235–240. [Google Scholar]
- Ndlovu, T.; Divol, B.; Bauer, F.F. Yeast Cell Wall Chitin Reduces Wine Haze Formation. Appl. Environ. Microbiol. 2018, 84, e00668-18. [Google Scholar] [CrossRef] [Green Version]
- Ángeles Pozo-Bayón, M.; Andújar-Ortiz, I.; Moreno-Arribas, M.V. Scientific Evidences beyond the Application of Inactive Dry Yeast Preparations in Winemaking. Food Res. Int. 2009, 42, 754–761. [Google Scholar] [CrossRef]
- Aguilar-Uscanga, B.; François, J.M. A Study of the Yeast Cell Wall Composition and Structure in Response to Growth Conditions and Mode of Cultivation. Lett. Appl. Microbiol. 2003, 37, 268–274. [Google Scholar] [CrossRef]
- Rattray, J.B.; Schibeci, A.; Kidby, D.K. Lipids of Yeasts. Bacteriol. Rev. 1975, 39, 197–231. [Google Scholar] [CrossRef] [PubMed]
- Sáenz-Navajas, M.-P.; Ferreira, V.; Dizy, M.; Fernández-Zurbano, P. Characterization of Taste-Active Fractions in Red Wine Combining HPLC Fractionation, Sensory Analysis and Ultra Performance Liquid Chromatography Coupled with Mass Spectrometry Detection. Anal. Chim. Acta 2010, 673, 151–159. [Google Scholar] [CrossRef] [PubMed]
- Iland, P. Chemical Analysis of Grapes and Wine; Patrick Iland Wine Promotions PTYLTD: Adelaide, Australia, 2004; ISBN 978-0-9581605-1-3. [Google Scholar]
- Gallander, J.; Briner, L.; Stetson, J.; Liu, J.-W.; Krielow, L.; Wilker, K.; Romberger, R.; Stamp, C.; Riesen, R. Manual for Wine Analysis and Laboratory Techniques; Ohio State University, OARDC: Wooster, OH, USA, 1991. [Google Scholar]
- Waterhouse, A.L. Determination of Total Phenolics. Curr. Protoc. Food Anal. Chem. 2002, 6, I1.1.1–I1.1.8. [Google Scholar] [CrossRef]
- Choi, J.; Leonard, S.W.; Kasper, K.; McDougall, M.; Stevens, J.F.; Tanguay, R.L.; Traber, M.G. Novel Function of Vitamin E in Regulation of Zebrafish (Danio Rerio) Brain Lysophospholipids Discovered Using Lipidomics. J. Lipid Res. 2015, 56, 1182–1190. [Google Scholar] [CrossRef] [Green Version]
- Definition of SWEET. Available online: https://www.merriam-webster.com/dictionary/sweet (accessed on 28 July 2021).
- Sparrow, A.M.; Holt, H.E.; Pearson, W.; Dambergs, R.G.; Close, D.C. Accentuated Cut Edges (ACE): Effects of Skin Fragmentation on the Composition and Sensory Attributes of Pinot Noir Wines. Am. J. Enol. Vitic. 2016, 67, 169–178. [Google Scholar] [CrossRef]
- Williamson, P. Sensory Descriptive Analysis on Commercial Wines of Varied Styles; The Australian Wine Research Institute: Urrbrae, Australia, 2013. [Google Scholar]
- Gawel, R.; Oberholster, A.; Francis, I.L. A ‘Mouth-Feel Wheel’: Terminology for Communicating the Mouth-Feel Characteristics of Red Wine. Aust. J. Grape Wine Res. 2000, 6, 203–207. [Google Scholar] [CrossRef]
- Guinard, J.-X.; Mazzucchelli, R. The Sensory Perception of Texture and Mouthfeel. Trends Food Sci. Technol. 1996, 7, 213–219. [Google Scholar] [CrossRef]
- R Core Team. R: A Language and Environment for Statistical Computing; R Foundation for Statistical Computing: Vienna, Austria, 2021. [Google Scholar]
- Wickham, H. Ggplot2: Elegant Graphics for Data Analysis; Springer: New York, NY, USA, 2016; ISBN 978-3-319-24277-4. [Google Scholar]
- Campo, E.; Ballester, J.; Langlois, J.; Dacremont, C.; Valentin, D. Comparison of Conventional Descriptive Analysis and a Citation Frequency-Based Descriptive Method for Odor Profiling: An Application to Burgundy Pinot Noir Wines. Food Qual. Prefer. 2010, 21, 44–55. [Google Scholar] [CrossRef]
- Lê, S.; Josse, J.; Husson, F. FactoMineR: An R Package for Multivariate Analysis. J. Stat. Softw. 2008, 25, 1–18. [Google Scholar] [CrossRef] [Green Version]
- Kassambara, A.; Mundt, F. Factoextra: Extract and Visualize the Results of Multivariate Data Analyses; 2020. Available online: https://cran.r-project.org/web/packages/factoextra/readme/README.html (accessed on 18 January 2021).
- Gao, L.; Girard, B.; Mazza, G.; Reynolds, A.G. Changes in Anthocyanins and Color Characteristics of Pinot Noir Wines during Different Vinification Processes. J. Agric. Food Chem. 1997, 45, 2003–2008. [Google Scholar] [CrossRef]
- Girard, B.; Yuksel, D.; Cliff, M.A.; Delaquis, P.; Reynolds, A.G. Vinification Effects on the Sensory, Colour and GC Profiles of Pinot Noir Wines from British Columbia. Food Res. Int. 2001, 34, 483–499. [Google Scholar] [CrossRef]
- Frost, S.C.; Harbertson, J.F.; Heymann, H. A Full Factorial Study on the Effect of Tannins, Acidity, and Ethanol on the Temporal Perception of Taste and Mouthfeel in Red Wine. Food Qual. Prefer. 2017, 62, 1–7. [Google Scholar] [CrossRef]
- Nurgel, C.; Pickering, G. Contribution of Glycerol, Ethanol and Sugar to the Perception of Viscosity and Density Elicited by Model White Wines. J. Texture Stud. 2005, 36, 303–323. [Google Scholar] [CrossRef]
- Saad, A.; Bousquet, J.; Fernandez-Castro, N.; Loquet, A.; Géan, J. New Insights into Wine Taste: Impact of Dietary Lipids on Sensory Perceptions of Grape Tannins. J. Agric. Food Chem. 2021, 69, 3165–3174. [Google Scholar] [CrossRef]
- Furlan, A.L.; Saad, A.; Dufourc, E.J.; Géan, J. Grape Tannin Catechin and Ethanol Fluidify Oral Membrane Mimics Containing Moderate Amounts of Cholesterol: Implications on Wine Tasting? Biochimie 2016, 130, 41–48. [Google Scholar] [CrossRef]
- Scollary, G.R.; Pásti, G.; Kállay, M.; Blackman, J.; Clark, A.C. Astringency Response of Red Wines: Potential Role of Molecular Assembly. Trends Food Sci. Technol. 2012, 27, 25–36. [Google Scholar] [CrossRef]
- Bajec, M.R.; Pickering, G.J. Astringency: Mechanisms and Perception. Crit. Rev. Food Sci. Nutr. 2008, 48, 858–875. [Google Scholar] [CrossRef]
- Martin, C.; Passilly-Degrace, P.; Gaillard, D.; Merlin, J.; Chevrot, M.; Besnard, P. The Lipid-Sensor Candidates CD36 and GPR120 Are Differentially Regulated by Dietary Lipids in Mouse Taste Buds: Impact on Spontaneous Fat Preference. PLoS ONE 2011, 6, e24014. [Google Scholar] [CrossRef] [PubMed] [Green Version]
- Zhou, X.; Shen, Y.; Parker, J.K.; Kennedy, O.B.; Methven, L. Relative Effects of Sensory Modalities and Importance of Fatty Acid Sensitivity on Fat Perception in a Real Food Model. Chem. Percept. 2016, 9, 105–119. [Google Scholar] [CrossRef] [PubMed] [Green Version]
- Aglione, A.; Cassutt, K.; Dragan, S.; Gravina, S.; Kurash, Y.; Johnson, W. Modulation of Bitterness and Mouthfeel via Synergistic Mixtures of Long Chain Fatty Acids. U.S. Patent Application No. 15/106,179, 3 November 2016. [Google Scholar]
- Besnard, P.; Passilly-Degrace, P.; Khan, N.A. Taste of Fat: A Sixth Taste Modality? Physiol. Rev. 2016, 96, 151–176. [Google Scholar] [CrossRef] [PubMed] [Green Version]
- Mattes, R.D. Is There a Fatty Acid Taste? Annu. Rev. Nutr. 2009, 29, 305–327. [Google Scholar] [CrossRef] [Green Version]


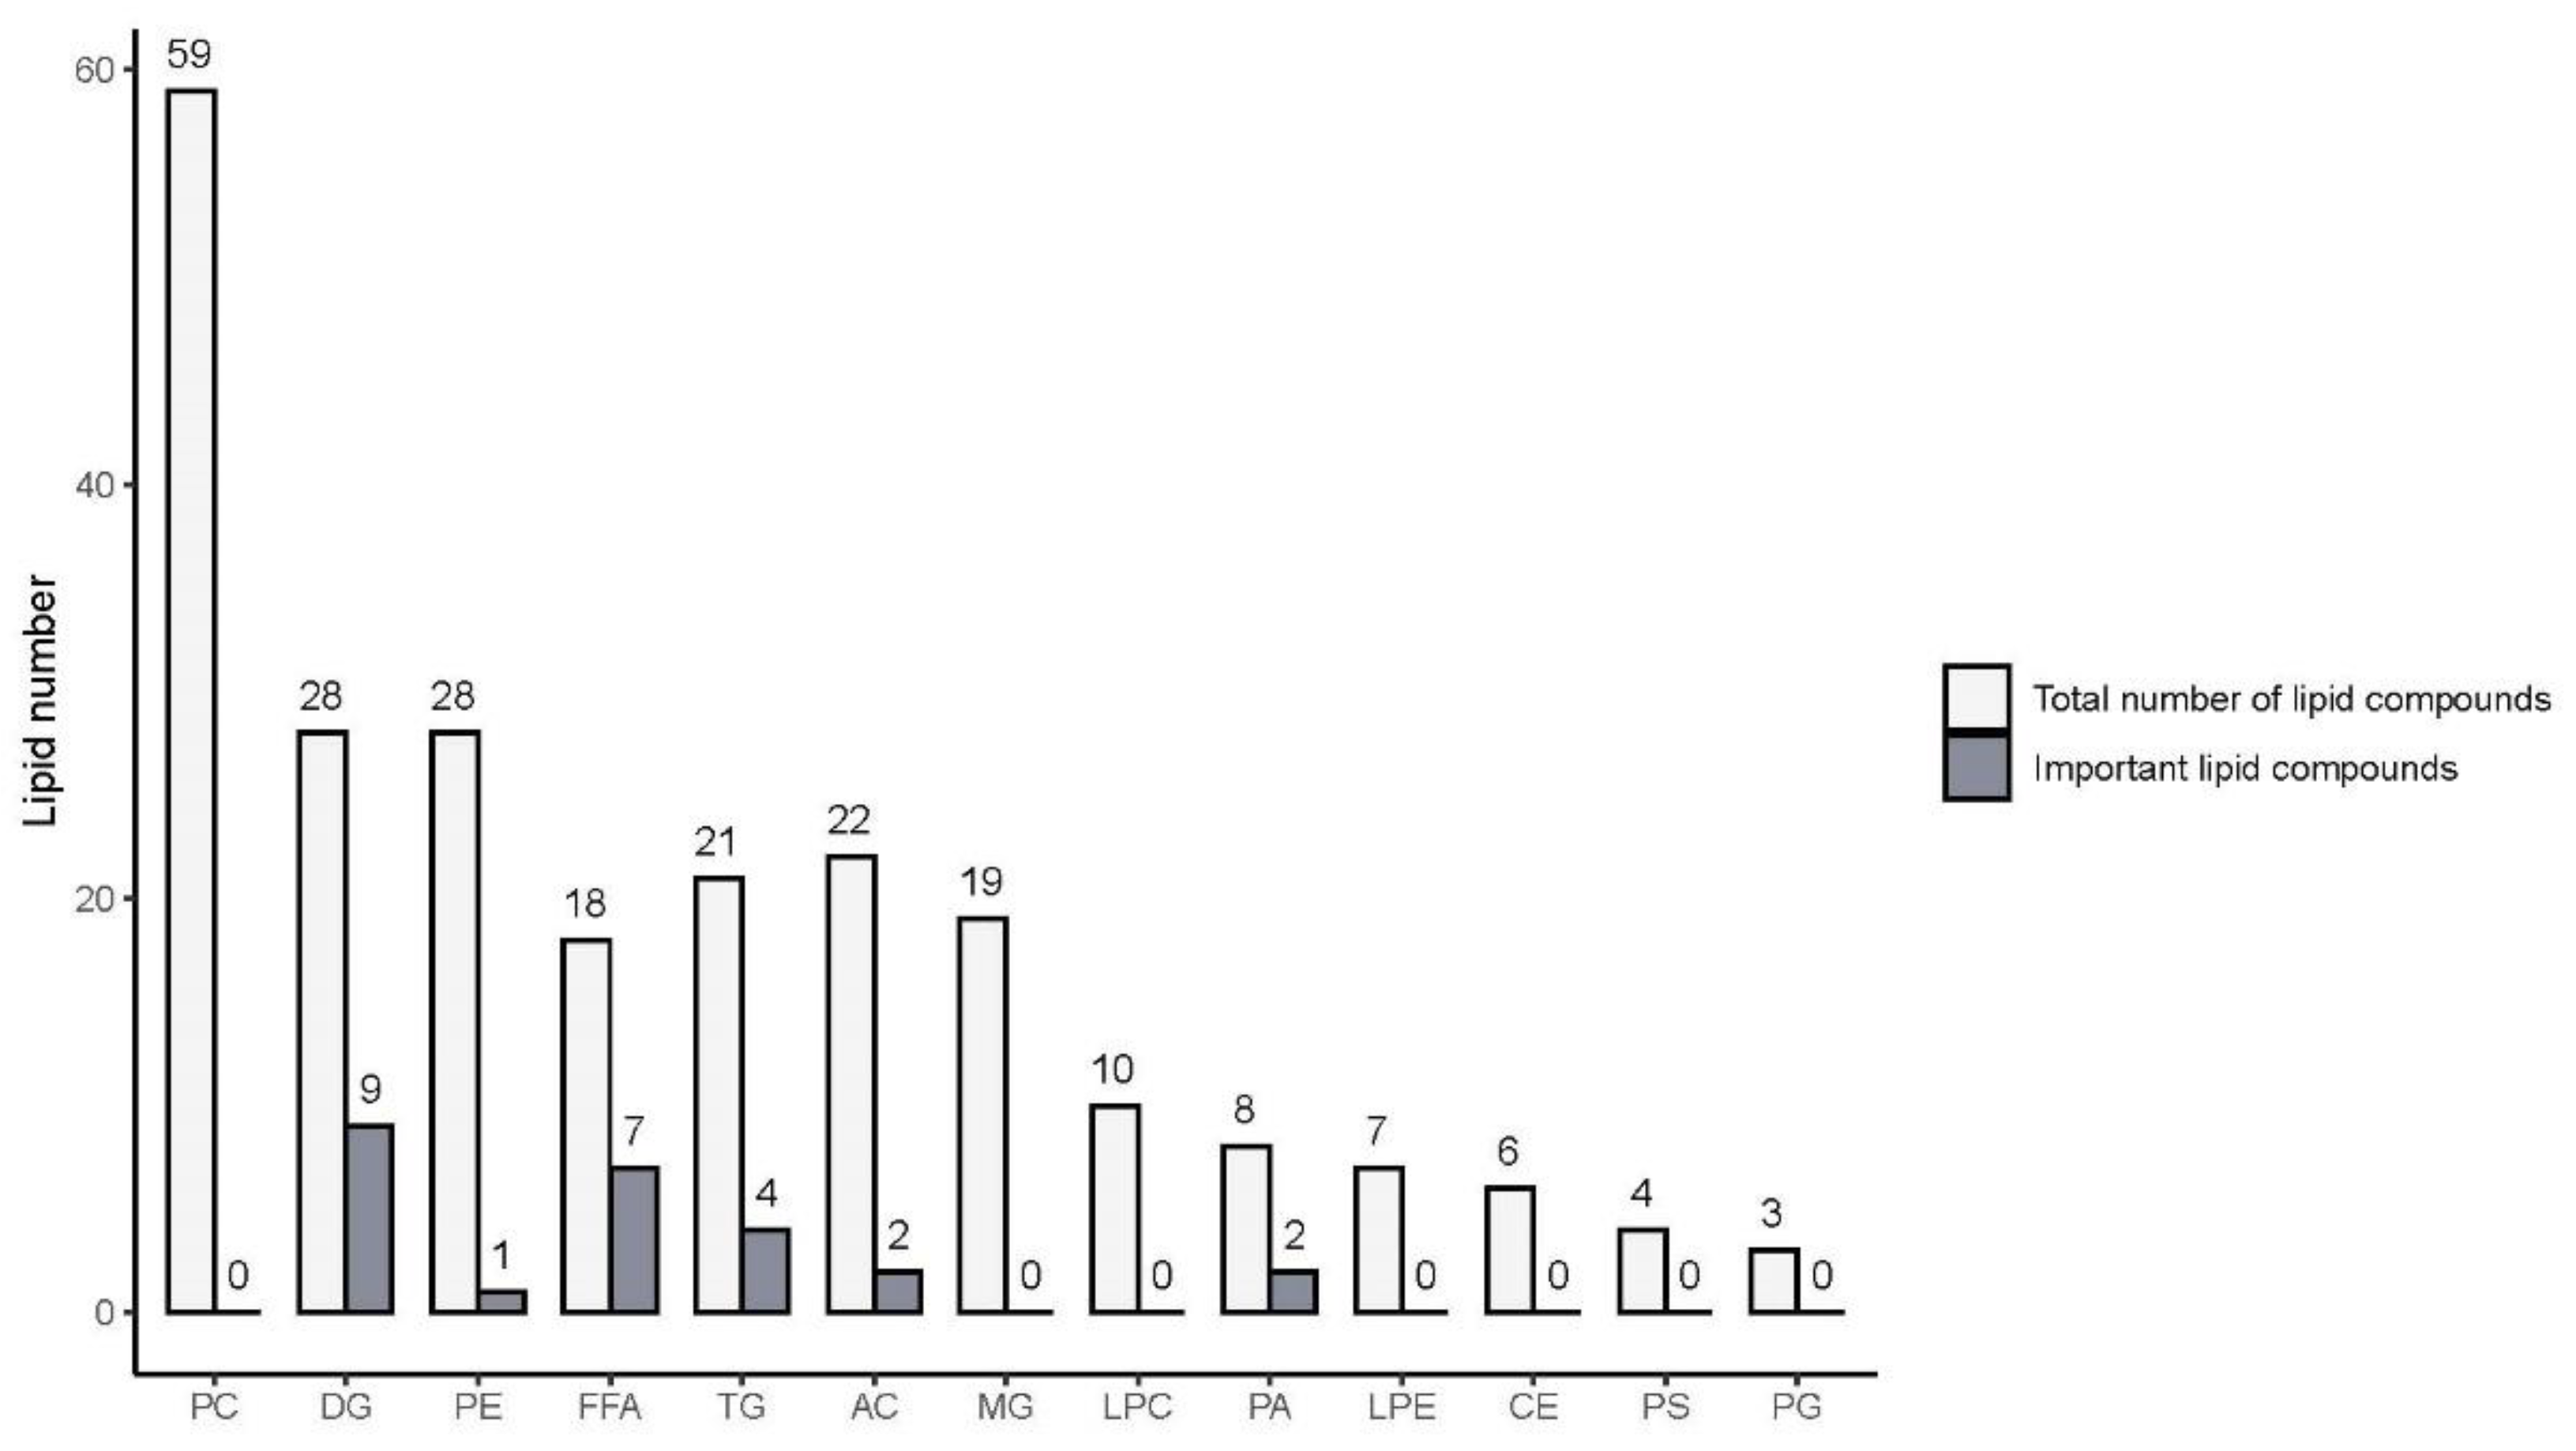
 ) and number of important lipid compounds within each class selected by random forest method (
  ). See Table 3 for lipid classification names.
) and number of important lipid compounds within each class selected by random forest method ( ). See Table 3 for lipid classification names.
). See Table 3 for lipid classification names.
) and number of important lipid compounds within each class selected by random forest method ( ). See Table 3 for lipid classification names.


| Attribute | Definition |
|---|---|
| Sweetness | Being one of the five basic taste sensations that is usually pleasing to the taste and typically induced by sugar. In beverage, containing a sweet ingredient is equivalent to not dry [32]. |
| Bitterness | Intensity of bitter taste perceived in the mouth [33]. |
| Acidity | Intensity of the acid taste perceived in the mouth [34]. |
| Astringency | Intensity of the drying and mouth puckering sensation in the mouth [33]. |
| Viscosity | Perception of body, weight, or thickness of the wine in the mouth [33]. |
| Warmth | Warming effect of the mouth surfaces primarily due to alcohol [35]. |
| Drying | Feeling of lack of lubrication or moisture in the mouth [35]. |
| Fermentation Temperature (°C) | 16 | 27 | p-Value (α = 0.05) | ||||||
|---|---|---|---|---|---|---|---|---|---|
| Yeast Product Concentration (g/L) | 0 | 0.5 | 1 | 0 | 0.5 | 1 | Temp. | Yeast Product | Temp × Yeast Product |
| Total phenol (mg/L) | 107.76 a | 92.44 b | 101.14 a,b | 138.06 c | 135.66 c | 136.36 c | <0.001 *** | 0.001 ** | 0.014 ** |
| (1.91) | (1.54) | (1.71) | (1.96) | (2.26) | (2.86) | ||||
| pH | 3.67 a | 3.70 b | 3.73 c | 3.67 a | 3.66 a | 3.67 a | <0.001 *** | 0.008 ** | 0.003 ** |
| (0.01) | (0.00) | (0.00) | (0.01) | (0.00) | (0.01) | ||||
| Titratable acidity (g/L) | 2.46 a | 2.48 a,b | 2.50 b,c | 2.46 a | 2.45 a | 2.46 a | <0.001 *** | 0.008 ** | 0.003 ** |
| (0.01) | (0.00) | (0.00) | (0.00) | (0.00) | (0.01) | ||||
| Alcohol (% v/v) | 14.47 a | 14.83 b | 14.38 a | 13.60 c | 14.10 d | 13.89 e | <0.001 *** | <0.001 *** | <0.001 *** |
| (0.01) | (0.01) | (0.01) | (0.02) | (0.02) | (0.02) | ||||
| Acetic acid (g/L) | 0.39 a | 0.34 a | 0.39 a | 0.43 a | 0.42 a | 0.38 a | 0.252 | 0.686 | 0.404 |
| (0.03) | (0.01) | (0.01) | (0.07) | (0.02) | (0.03) | ||||
| Malic acid (g/L) | 0.07 a | 0.06 a,b | 0.06 a,b | 0.07 a | 0.07 a,b | 0.06 a,b | 0.195 | 0.011 ** | 0.932 |
| (0.00) | (0.00) | (0.00) | (0.00) | (0.00) | (0.00) | ||||
| Glucose/Fructose (g/L) | 0.56 a | 0.63 a | 0.58 a | 0.70 a | 0.65 a | 0.62 a | 0.055 | 0.558 | 0.24 |
| (0.08) | (0.02) | (0.03) | (0.03) | (0.02) | (0.03) | ||||
| Source | Df | Sum of Square | Mean Square | F Value | Pr(>F) | |
|---|---|---|---|---|---|---|
| Fermentation Temperature | 1 | 2.827 × 10⁻⁸ | 2.827 × 10⁻⁸ | 10.014 | 0.00815 | * |
| Yeast Product Addition | 2 | 1.600 × 10⁻¹⁰ | 8.000 × 10⁻¹⁰ | 0.028 | 0.97225 | |
| Fermentation Temperature × Yeast Product Addition | 2 | 5.650 × 10⁻⁹ | 2.827 × 10⁻⁹ | 1.001 | 0.39612 | |
| Residuals | 12 | 3.387 × 10⁻⁸ | 2.823 × 10⁻⁹ |
| Lipid Class Name | Abbreviation |
|---|---|
| Phosphatidylcholine | PC |
| Diglyceride | DG |
| Phosphatidylethanolamine | PE |
| Free fatty acids | FFA |
| Triglycerides | TG |
| Acylcarnitine | AC |
| Monoglycerides | MG |
| Lysophosphatidylcholine | LPC |
| Phosphatidic acids | PA |
| Lysophosphatidylethanolamine | LPE |
| Cholesteryl esters | CE |
| Phosphatidylserines | PS |
| Phosphatidylglycerols | PG |
Publisher’s Note: MDPI stays neutral with regard to jurisdictional claims in published maps and institutional affiliations. |
© 2022 by the authors. Licensee MDPI, Basel, Switzerland. This article is an open access article distributed under the terms and conditions of the Creative Commons Attribution (CC BY) license (https://creativecommons.org/licenses/by/4.0/).
Share and Cite
Phan, Q.; DuBois, A.; Osborne, J.; Tomasino, E. Effects of Yeast Product Addition and Fermentation Temperature on Lipid Composition, Taste and Mouthfeel Characteristics of Pinot Noir Wine. Horticulturae 2022, 8, 52. https://0-doi-org.brum.beds.ac.uk/10.3390/horticulturae8010052
Phan Q, DuBois A, Osborne J, Tomasino E. Effects of Yeast Product Addition and Fermentation Temperature on Lipid Composition, Taste and Mouthfeel Characteristics of Pinot Noir Wine. Horticulturae. 2022; 8(1):52. https://0-doi-org.brum.beds.ac.uk/10.3390/horticulturae8010052
Chicago/Turabian StylePhan, Quynh, Aubrey DuBois, James Osborne, and Elizabeth Tomasino. 2022. "Effects of Yeast Product Addition and Fermentation Temperature on Lipid Composition, Taste and Mouthfeel Characteristics of Pinot Noir Wine" Horticulturae 8, no. 1: 52. https://0-doi-org.brum.beds.ac.uk/10.3390/horticulturae8010052