Brief Report

Correlation of the Grapevine (Vitis vinifera L.) Leaf Chlorophyll Concentration with RGB Color Indices

by
Péter Bodor-Pesti
1,*,†,
Dóra Taranyi
1,†,
Diána Ágnes Nyitrainé Sárdy
2,
Lien Le Phuong Nguyen
3,4 and
László Baranyai
3
1
Department of Viticulture, Institute for Viticulture and Oenology, Buda Campus, Hungarian University of Agriculture and Life Sciences, Villányi Str. 29-43., H-1118 Budapest, Hungary
2
Department of Oenology, Institute for Viticulture and Oenology, Buda Campus, Hungarian University of Agriculture and Life Sciences, Villányi Str. 29-43., H-1118 Budapest, Hungary
3
Institute of Food Science and Technology, Hungarian University of Agriculture and Life Sciences, Villányi Str. 35-43., H-1118 Budapest, Hungary
4
Industrial University of Ho Chi Minh City, Ho Chi Minh 727000, Vietnam
*
Author to whom correspondence should be addressed.
These authors contributed equally to this work.
Horticulturae 2023, 9(8), 899; https://doi.org/10.3390/horticulturae9080899
Submission received: 19 June 2023 / Revised: 16 July 2023 / Accepted: 2 August 2023 / Published: 7 August 2023

Abstract

:
Spectral investigation of the canopy has an increasing importance in precision viticulture to monitor the effect of biotic and abiotic stress factors. In this study, RGB (color model, red, green, blue)-based vegetation indices were evaluated to find a correlation with grapevine leaf chlorophyll concentration. ‘Hárslevelű’ (Vitis vinifera L.) leaf samples were obtained from a commercial vineyard and digitalized. The chlorophyll concentration of the samples was determined with a portable chlorophyll meter. Image processing and color analyses were performed to determine the RGB average values of the digitized samples. According to the RGB values, 31 vegetation indices were calculated and evaluated with a correlation test and multivariate regression. The Pearson correlation between the chlorophyll concentration and most of the indices was significant (p < 0.01), with some exceptions. The same results were obtained with the Spearman correlation as the relationship had high significance (p < 0.01) for most of the indices. The highest Pearson correlation was obtained with the index PCA2 (Principal Component Analysis 2), while Spearman correlation was the highest for RMB (difference between red and blue) and GMB (difference between green and blue). The multivariate regression model also showed a high correlation with the pigmentation. We consider that our results would be applicable in the future to receive information about the canopy physiological status monitored with on-the-go sensors.

Graphical Abstract

1. Introduction

Similar to the main purposes of precision agriculture (PA), precision viticulture (PV) aims to reduce the environmental impact of production while increasing the yield and quality of grape and wine. To achieve these goals, remote sensing-based decision support systems (DSSs) are usually established to provide information for differentiated nutrient and water supply, plant protection, and harvest [1]. Among passive devices, RGB, thermal, multispectral, and hyperspectral cameras are the most widespread devices used to receive information about biomass and plant physiology or to predict yield and, moreover, to support microclimatic monitoring and terroir zoning [2,3,4,5,6]. Physical traits of the plants such as size, shape, and color are investigated most frequently on the whole canopy or individual leaves, shoots, and moreover on bunches, berries, or even on seeds or roots.
RGB-based image capturing and evaluation provide useful information in viticulture, for example, in canopy architecture analysis [7], predicting fruit maturity and berry composition [8], evaluating the morphometric diversity of genotypes [9], or describing the effect of postharvest treatments [10,11]. For these purposes, both UAV-mounted cameras [12], on-to-go human-driven multi-sensor platforms [13], and tabletop-stand-built DSLR cameras [14,15] are involved.
The grapevine canopy is built up by the individual leaves developed on the main and lateral shoots. Morphological traits—in particular, individual leaf size, leaf shape, lobature, hirsuteness, and coloration of the leaf—may be typical to the cultivar [16]. Nevertheless, vineyard structure [17], cultivation practices [18], and further factors could significantly modify these attributes. Concerning the leaf coloration, the main pigment is the chlorophyll produced in the epidermal cells [19], while anthocyanins are also present in some cases on the young organs such as shoot tips, primarily for photoprotective purposes [20]. Chlorophyll concentration is a key indicator of the nutrient status and lime-induced iron chlorosis [21,22], fungal infections [23], and water stress [24]; therefore, evaluating the seasonal pattern has high importance in viticultural DSSs. Several studies based on portable chlorophyll meters concluded that those devices have a huge benefit compared to the laboratory spectrophotometric investigations as these handheld tools are easy to use, lightweight, fast, and reliable. Among others, for example, Porro et al. [25], Zulini et al. [26], and Ates and Kaya [21], have used the Minolta SPAD-502 leaf chlorophyll meter in viticultural research. In addition to the undoubted advantages, it should be noted that the portable chlorophyll meters also have some disadvantages, too. One could be the small size of the sensor opening which requires multiple measurements to be taken on the samples. For example, the Apogee MC10 measurement area is 63.9 mm2, the TYS-A Handheld Plant Chlorophyll Meter measures 4 mm2, and the CCM-200 plus Chlorophyll Content Meter uses a 9.52 mm (3/8”) diameter circle (71 mm2). Considering that the average leaf size of, for example, grapevine (Vitis vinifera L.) cultivar ‘Chardonnay’ ranges from 46.5 to 80.2 cm2, influenced by the bud load of the plants [18], several measurements are suggested on a single leaf to characterize the lamina pigmentation.
Remote and proximal sensing-based chlorophyll evaluations are more frequently applied in PV. Several studies emphasized that chlorophyll concentration correlates with RGB values and RGB-based vegetation indices, which was evaluated according to digital image analysis on, for example, wheat and rye [27], barley [28], apple [29], pomegranate [30], birch [31], sugar beet [32], and, moreover, on amaranth and quinoa [33]. Nevertheless, results are not coincident and in the different reports, the correlation of the color indices with the chlorophyll concentration does not point in the same direction.
For this reason, we aimed to evaluate the correlation of different RGB vegetation indices with the leaf chlorophyll concentration of the ‘Hárslevelű’ grapevine (Vitis vinifera L.) cultivar. Evaluation of the individual leaf coloration has certain limitations, and different symptoms develop at different phenological stages of the organs and at different positions on the shoot. For example, nutrient deficiency of the mobile elements appears on older leaves, while those elements which are immovable show symptoms on the young organs such as the shoot tip. For this reason, monitoring the whole canopy would be more beneficial than the individual organs. In line with this, we aimed to find those RGB-based vegetation indices which could be applied in field investigations according to digital cameras to predict the chlorophyll concentration of the canopy.

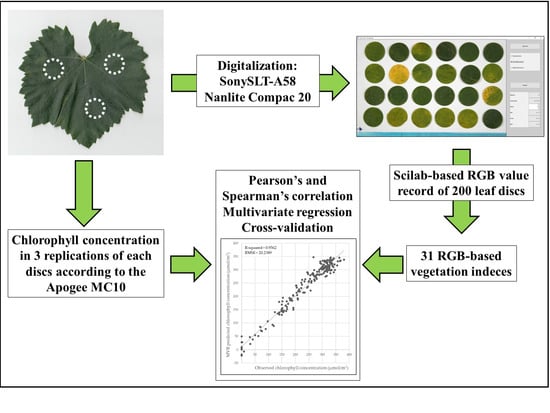
2. Materials and Methods

2.1. Sampling and Digitalization

Leaf samples were obtained from a commercial vineyard without irrigation in Tata (Hungary) in September 2022. Weather conditions were obtained from a meteorological station located at the sampling plot. The precipitation was 233.8 mm (between 1 January 2022 and 30 September 2022), the total heat sum from April 2022 until the sampling (September 2022) was 3036.43 °C (with 2945 °C active heat sum), the leaf wetness hour (time) was 2 h on average, and the relative humidity was 57% on average.
The 6 year-old ‘Hárslevelű’ grapevine (Vitis vinifera L., white Hungarian grapevine variety) plantation was trained on an umbrella training system with 2.5 × 1 m row and plant distance. Asymptomatic, healthy leaf blades with different age, i.e., phenological stages, were collected and stored in plastic bags at 4 °C until further analysis. From each leaf, 3 to 4 leaf discs of equal size (r = 10 mm; 314.2 mm2) were cut, and altogether 200 leaf discs were digitalized with a SonySLT-A58 camera to sRGB file format. Illumination was standardized in a dark room with two LED light panels (Nanlite Compac 20, ta = 45 °C/113 °F. Color Temperature: 5600 K, Guangdong NanGuang Photo&Video Systems Co. Ltd., Shantou City, China). Camera settings were uniform for all pictures: ISO (ISO100), F-value (f/5.6), exposition time (1/100 s). Color temperature was standardized with a ColorChecker Passport Photo 2 (X-Rite, Grand Rapids, MI, USA).

2.2. Chlorophyll Concentration Measurement

The chlorophyll concentration of each disc was measured in 3 replications with an Apogee MC10 (Apogee Instruments, S/N:1999, Logan, UT, USA). The instrument is calibrated to define the µmol of chlorophyll per m2 units. The measurement area is 63.9 mm2, resolution is ±10 µmol/m2, and the chlorophyll concentration was determined using a generic equation (Apogee) [34]. The average of the 3 measurements was considered as the chlorophyll concentration of the disc.

2.3. Image Analysis and RGB-Based Color Index Calculation

Digital image processing was performed using Scilab (version 6.1.1., Scilab Enterprises, Rungis, France) with Image Processing and Computer Vision Toolbox (IPCV, version 4.1.2). A graphical user interface was made to process recorded pictures of the sample discs. Samples of 24 discs per picture were arranged in a grid layout. The resolution was adjusted to 350 DPI. To prevent any effect of changing illumination, images were preprocessed to standardize color. Acquisition used the same white background for all samples, and this background was used in preprocessing. The average color of the top ribbon of 5-pixel height was used as reference. Segmentation of discs was performed with thresholding on the blue color layer. The results were saved in text files with CSV (comma, space delimited values) format. The average red, green, and blue intensity values; the center coordinates (X, Y); and the surface area (in pixels) were saved for each sample disc.

2.4. Statistical Analysis

Statistical analysis was performed using R (version 4.2.1., R Foundation for Statistical Computing, Vienna, Austria). Correlation tests were run to discover relationship between chlorophyll content and measured color parameters. The Pearson’s linear correlation and Spearman’s rank correlation values were computed with their significance. The former test is appropriate to describe the linear correlation of two variables, while the latter one describes the strength and direction of a monotonic relationship. As, for example, many of the vegetation indices ranged from −1 to 1, we consider that relationship between the pigmentation and color indices are not fully linear. Therefore, the Spearman correlation method was also included in this study. The PLS package (version 2.8-1) was used to perform multivariate regression (MVR) analysis. Parameters were evaluated according to their contribution to the model. The standard deviation of the coefficients of the parameters in utilized latent variables was calculated and compared. Cross-validation was performed following the bootstrapping method with 5000 repetitions of random resampling using 80% (n = 160) and 20% (n = 40) of data for calibration and validation, respectively.

3. Results and Discussion

In this study, the leaf chlorophyll concentration of the ‘Hárslevelű’ grapevine cultivar was investigated with a portable chlorophyll meter to find a correlation between the measured values and RGB-based vegetation indices. In this experiment, the average chlorophyll concentration was 242 µmol/m2 (min: 0 µmol/m2, max: 380.5 µmol/m2). The coefficient of variation (c.v.) of the chlorophyll concentration was 40%. The chlorophyll concentration of the leaves varies among the plant species or even among cultivars. For instance, Casanova-Gascon et al. [22] found that green pigmentation has high variability among grapevine cultivars. For example, ‘Cabernet Sauvignon’ and ‘Aglianico’ had high chlorophyll concentration, while ‘Sauvignon’ had low values. In their study, the pigment content ranged from 0.1450 mg/100 mg to 0.3774 mg/100 mg for ‘Macabeo’ and ‘Aglianico’, respectively. Comparison of the results of different reports have limitations as the unit of chlorophyll concentration varies in the different papers. Chavarria et al. [35], for example, interpreted the results in mg/L−1, while Casanova-Gascon [22] expressed the data in mg/100 mg dry weight.
Based on the RGB values obtained from the digital images, altogether 31 vegetation indices were calculated according to Sánchez-Sastre et al. [32], Lu et al. [36], and citations therein (Table 1). In our experiment, the color values ranged from 47.37 to 240.86, from 59.18 to 199.68, and from 21.22 to 76.62 for the R, G, and B channels, respectively. These data show slight difference compared to those introduced by Fuentes et al. [37], who reported 94.9 to 128.9, from 111.2 to 145.3, and from 11.8 to 28.2 minimum and maximum average values for the three channels, R, G, and B, respectively. It must be highlighted that our study utilized a wide range of samples, since different developmental stages were collected, which could cause the wide range of the channel values. In this study, the highest variability was observed in the red channel as the coefficient of variation (c.v.) was 53.47%; contrary to this, the blue channel was the least variable with a c.v. of 20.76%. In recent years, several methods were developed for the evaluation of grapevine leaf coloration. Doğan and Uyak [38] used L*a*b* color attributes to introduce noticeable differences among 10 grapevine cultivars. This approach was complemented with the RGB values by Fuentes et al. [37], who used machine learning classification for grapevine cultivars according to leaf morpho-colorimetry. In this study, sRGB (standard RGB (red, green, blue) color space) was investigated. The sRGB color space is defined in the standard IEC 61966-2-1 for measurement and representation of color in multimedia devices. According to its standardization, sRGB values identify the same color with any instrument.
As a result, 31 indices were used to correlate the sRGB values with the chlorophyll concentration of the leaf samples. The highest variability was observed in the case of SLR5 (Stepwise Linear Regression 5), where the minimum value was −85.22 and the maximum value was 361.78 (c.v. 179.53%). The least variable index was the CIVE (Color Index for Vegetation Extraction), with a c.v. of 0.13%.
Table 1 presents Pearson’s and Spearman’s correlation values for all parameters and the standard deviation of their coefficients in the multivariate regression (SD MVR) model. We found that Pearson correlation is significant (p < 0.01) in most of the indices with the chlorophyll content except for SLR2 (Stepwise Linear Regression 2), where significance was p < 0.05, and g (green chromaticity), GLI (green leaf index), and CIVE, where significance was not fulfilled. Spearman correlation showed same results with high significance (p < 0.01), except for SLR4 (Stepwise Linear Regression 4) and SLR5. The highest correlation (−0.9709; p < 0.01) was obtained with the index PCA2 reported by Sánchez-Sastre et al. [32], where they found −0.9065 to be the coefficient of correlation. Concerning the Spearman correlation, the highest correlation was obtained with the RMB and GMB (−0.9183, p < 0.01). Our data were compared with recent publications, and it was found that the correlation with pigmentation varies among different reports (Table 1). For example, Kawashima et al. [27] and Sala et al. [31] showed negative correlation with the R, G, and B channels; in contrast with this, Cheng et al. [29] found that both chlorophyll a+b and SPAD values have a positive correlation with chlorophyll concentration. Other indices also showed differences among the reports. Prediction of the chlorophyll concentration using multivariate regression showed high accuracy (R2 = 0.9562, RMSE = 20.24) for calibration (Figure 1). Cross-validation with bootstrapping also achieved high accuracy in terms of R2 = 0.9476 (with 95% confidence interval of 0.9471–0.9482) and RMSE = 21.93 (with 95% confidence interval of 21.83–22.02). The evaluation of the contribution of parameters to the MVR model revealed that SLR2 obtained the highest sensitivity. It is followed by SLR4, SLR5, RGRI (Red Green Ratio Index), SLR1 (Stepwise Linear Regression 1), and VARI (visible atmospherically resistant index), in this order. These parameters resulted with a standard deviation higher than 0.3.
Table 1. RGB-based vegetation indices calculated in this study according to Sánchez-Sastre et al. [32], Lu et al. [36], and citations therein, and correlation values and standard deviation of coefficients (SD MVR) for all parameters and direction of the relationship of the vegetation indices with chlorophyll concentration reported in earlier studies.
Index FormulaPresent Study[27][28][29][30][31][32]
Pearson’s Corr.Spearman’s Corr.SD MVR††
Red—R0–255−0.9468 **−0.8942 **0.2027-+++---
Green—G 0–255−0.9678 **−0.9109 **0.2214-++++--
Blue—B 0–2550.05010.4790 **0.2013-+++--+
Red chromaticity—r R/(R + G + B)−0.9431 **−0.8723 **0.0003-+-- -
Green chromaticity—gG/(R + G + B)−0.0079−0.4178 **0.0007- -- +
Blue chromaticity—bB/(R + G + B)0.8805 **0.8898 **0.0009+ ++ +
RMG (Difference between red and green)R − G−0.7832 **−0.4217 **0.2663- ++ -
RMB (Difference between red and blue)R − B−0.9656 **−0.9183 **0.1041- -- -
GMB (Difference between green and blue)G − B−0.9656 **−0.9183 **0.1041- -- -
NRGVI (Normalized red-green difference index)(R − G)/(R + G)−0.8921 **−0.6729 **0- +-- -
NRBVI (Normalized red-blue difference index)(R − B)/(R + B)−0.9043 **−0.8931 **0.0036- --+ -
NGBVI (Normalized green-blue difference index)(G − B)/(G + B)−0.8437 **−0.8810 **0.0027- --- -
(R − G)/(R + G + B)(R − G)/(R + G + B)−0.8734 **−0.6042 **0.0004- -- -
(R − B)/(R + G + B)(R − B)/(R + G + B)−0.9271 **−0.8966 **0.0012- -- -
(G − B)/(R + G + B)(G − B)/(R + G + B)−0.7453 **−0.8412 **0.0016- -- -
RGRI (Red-Green Ratio Index)R/G−0.8838 **−0.6729 **0.3204 ++- -
GLI (Green leaf index)(2G − R − B)/(2G + R + B)0.0045−0.4178 **0.0567 +
VARI (Visible atmospherically resistance index)(G − R)/(G + R − B)0.9160 **0.7482 **0.3116 +
IPCA0.994|R − B| + 0.961|G − B| + 0.914|G − R|−0.9671 **−0.9182 **0.1879 -
ExR (Excess red vegetation index)1.4r − g−0.8734 **−0.6042 **0.0006 -
ExB (Excess blue vegetation index)1.4b − g0.7453 **0.8412 **0.0022 +
ExG (Excess green vegetation index) 2g − r − b−0.9431 **−0.8723 **0.0013 +
ExGR (Excess green minus Excess red)ExG − ExR−0.9244 **−0.8972 **0.0017 +
Gray0.2898r + 0.5870g + 0.1140b−0.6522 **−0.7845 **0.0004 -
CIVE (Color Index for Vegetation Extraction)0.441r − 0.811g + 0.385b + 18.78−0.1030.3466 **0.0008 -
PCA1 (Principal Compoment Analysis 1)−0.977b + 0.916((G − B)/(G + B)) + 0.995((R − B)/(R + B)) + 0.771((R − G)/(R + G))−0.9060 **−0.8940 **0.007 -
PCA2 (Principal Compoment Analysis 2)0.999|R − B| + 0.92|G − B| + 0.886|R − G|−0.9709 **−0.9163 **0.1569 -
I1 R + G − 2B−0.9706 **−0.9162 **0.1755 -
SLR1 (Stepwise Linear Regression 1)−60.430 − 0.7316B + 69.680b + 112.800g + 28.270((G − B)/(G + B)) − 23.890((R − B)/(R + B)) + 68.380((R − G)/(R + G))−0.8920 **−0.6728 **0.3164 +
SLR2 (Stepwise Linear Regression 2)−46.240 − 2.678B + 1.05G + 52.570b + 87.420g + 20.720((G − B)/(G + B)) − 18.240((R − B)/(R + B)) + 52.500((R − G)/(R + G))−0.1812 *0.2924 **0.3849 +
SLR3 (Stepwise Linear Regression 3)−25.373 + 30.106b + 46.539g + 12776((G − B)/(G + B)) − 10.507((R − B)/(R + B)) + 28.821((R − G)/(R + G))−0.2822 **0.2148 **0.2778 +
SLR4 (Stepwise Linear Regression 4)−44.312 + 51.689b + 81.995g + 21.751((G − B)/(G + B)) − 18.156((R − B)/(R + B)) + 50.425((R − G)/(R + G))−0.4961 **−0.10380.3728 +
SLR5 (Stepwise Linear Regression 5)−41.048 + 46.964b + 76.841g + 19.998((G − B)/(G + B)) − 17.173((R − B)/(R + B)) + 47.162((R − G)/(R + G))−0.4242 **−0.02890.36 +
I20.55 + 11.4((G − B)/(G + B)) − 12.5((R − B)/(R + B)) + 9((R − G)/(R + G))0.7945 **0.8455 **0.0156 +
Where * indicates significant correlation at p < 0.05, ** indicates significant correlation at p < 0.001, Cheng et al. [29] correlated Chl. (a+b) (†), and SPAD values (††) to the RGB-based indices.

4. Conclusions

In this study, sRGB values and 31 vegetation indices were correlated to the chlorophyll concentration of leaves obtained from the ‘Hárslevelű’ grapevine cultivar. We found that most of the indices had significant correlation with pigmentation. The parameters’ contribution to the MVR (Multivariate Regression) model showed that SLR2 is the most sensitive followed by SLR4, SLR5, RGRI, SLR1, and VARI. Based on former reports and our recent results, we conclude that those vegetation indices which could predict the leaf pigmentation are possibly species- or cultivar-specific. This finding foreshadows the need for more detailed intraspecific color investigations of the grapevine leaf and canopy. We consider that ground-based or areal monitoring of vineyards according to RGB vegetation indices would provide a cheap and reliable methodology for growers to evaluate the individual leaf and, moreover, the canopy’s physiological status and discover the reasons of different symptoms causing disorder in the pigmentation.

Author Contributions

Conceptualization, P.B.-P.; methodology, P.B.-P. and L.B.; software, L.B.; statistical analysis, L.B. and L.L.P.N.; investigation, P.B.-P. and D.T., writing—original draft preparation, P.B.-P., L.B., D.T. and L.L.P.N.; writing—review and editing, P.B.-P., L.B., D.T., L.L.P.N. and D.Á.N.S.; visualization, L.B. and P.B.-P.; supervision: D.Á.N.S. All authors have read and agreed to the published version of the manuscript.

Funding

This research received no external funding.

Data Availability Statement

Data is available upon request to the corresponding author.

Acknowledgments

We are grateful for Nárcisz Mikóczy for her helpful contribution.

Conflicts of Interest

The authors declare no conflict of interest.

References

  1. Ammoniaci, M.; Kartsiotis, S.P.; Perria, R.; Storchi, P. State of the art of monitoring technologies and data processing for precision viticulture. Agriculture 2021, 11, 201. [Google Scholar] [CrossRef]
  2. De Bei, R.; Fuentes, S.; Gilliham, M.; Tyerman, S.; Edwards, E.; Bianchini, N.; Collins, C. VitiCanopy: A free computer App to estimate canopy vigor and porosity for grapevine. Sensors 2019, 16, 585. [Google Scholar] [CrossRef] [PubMed] [Green Version]
  3. Briglia, N.; Montanaro, G.; Petrozza, A.; Summerer, S.; Cellini, F.; Nuzzo, V. Drought phenotyping in Vitis vinifera using RGB and NIR imaging. Sci. Hortic. 2019, 256, 108555. [Google Scholar] [CrossRef]
  4. Acevedo-Opazo, C.; Tisseyre, B.; Guillaume, S.; Ojeda, H. Test of NDVI information for a relevant vineyard zoning related to vine water status. In Proceedings of the 6th ECPA-European Conference on Precision Agriculture, Skiathos, Greece, 3–6 June 2007; pp. 547–554. [Google Scholar]
  5. Palacios, F.; Diago, M.P.; Melo-Pinto, P.; Tardaguila, J. Early yield prediction in different grapevine varieties using computer vision and machine learning. Precis. Agric. 2022, 24, 407–435. [Google Scholar] [CrossRef]
  6. Arnó, J.; Martínez Casasnovas, J.A.; Ribes Dasi, M.; Rosell Polo, J.R. Precision viticulture. Research topics, challenges and opportunities in site-specific vineyard management. Span. J. Agric. Res. 2009, 7, 779–790. [Google Scholar] [CrossRef] [Green Version]
  7. Matese, A.; Di Gennaro, S.F. Technology in precision viticulture: A state of the art review. Int. J. Wine Res. 2015, 7, 69–81. [Google Scholar] [CrossRef] [Green Version]
  8. Seng, K.P.; Ang, L.M.; Schmidtke, L.M.; Rogiers, S.Y. Computer vision and machine learning for viticulture technology. IEEE Access 2018, 6, 67494–67510. [Google Scholar] [CrossRef]
  9. Bodor-Pesti, P.; Taranyi, D.; Deák, T.; Nyitrainé Sárdy, D.Á.; Varga, Z. A Review of Ampelometry: Morphometric Characterization of the Grape (Vitis spp.) Leaf. Plants 2023, 12, 452. [Google Scholar] [CrossRef]
  10. Angulo, O.; Fidelibus, M.W.; Heymann, H. Grape cultivar and drying method affect sensory characteristics and consumer preference of raisins. J. Sci. Food Agric. 2007, 87, 865–870. [Google Scholar] [CrossRef]
  11. Chironi, S.; Sortino, G.; Allegra, A.; Saletta, F.; Caviglia, V.; Ingrassia, M. Consumer assessment on sensory attributes of fresh table grapes cv “Italia” and “Red Globe” after long cold storage treatment. Chem. Eng. Trans. 2017, 58, 421–426. [Google Scholar]
  12. Baofeng, S.; Jinru, X.; Chunyu, X.; Yuyang, S.; Fuentes, S. Digital surface model applied to unmanned aerial vehicle based photogrammetry to assess potential biotic or abiotic effects on grapevine canopies. Int. J. Agric. Biol. Eng. 2016, 9, 119–130. [Google Scholar]
  13. Diago, M.P.; Aquino, A.; Millan, B.; Palacios, F.; Tardáguila, J. On-the-go assessment of vineyard canopy porosity, bunch and leaf exposure by image analysis. Aust. J. Grape Wine Res. 2019, 25, 363–374. [Google Scholar] [CrossRef]
  14. Somogyi, E.; Lázár, J.; Baranyai, L.; Bodor-Pesti, P.; Nyitrainé Sárdy, D.Á. Outline analysis of the grapevine (Vitis vinifera L.) berry shape by elliptic Fourier descriptors. Vitis 2022, 61, 63–70. [Google Scholar]
  15. Bodor, P.; Somogyi, E.; Baranyai, L.; Lázár, J.; Bálo, B. Analysis of the grapevine (Vitis vinifera L.) berry shape by using elliptic Fourier descriptors. Agric. Eng. Sci. 2020, 16, 87–93. [Google Scholar] [CrossRef]
  16. OIV. OIV Descriptor List for Grape Varieties and Vitis Species, 2nd ed.; Office International de la Vigne et du Vin: Paris, France, 2009; p. 177. [Google Scholar]
  17. Bodor, P.; Baranyai, L.; Parrag, V.; Bisztray, G. Effect of row orientation and elevation on leaf morphology of grapevine (Vitis vinifera L.) cv Furmint. Prog. Agric. Eng. Sci. 2014, 10, 53–69. [Google Scholar]
  18. Poni, S.; Intrieri, C.; Magnanini, E. Seasonal growth and gas exchange of conventionally and minimally pruned Chardonnay canopies. Vitis 2000, 39, 13–18. [Google Scholar]
  19. Ruberti, C.; Barizza, E.; Bodner, M.; La Rocca, N.; De Michele, R.; Carimi, F.; Lo Schiavo, F.; Zottini, M. Mitochondria change dynamics and morphology during grapevine leaf senescence. PLoS ONE 2014, 9, e102012. [Google Scholar] [CrossRef]
  20. Liakopoulos, G.; Nikolopoulos, D.; Klouvatou, A.; Vekkos, K.A.; Manetas, Y.; Karabourniotis, G. The photoprotective role of epidermal anthocyanins and surface pubescence in young leaves of grapevine (Vitis vinifera). Ann. Bot. 2006, 98, 257–265. [Google Scholar] [CrossRef] [Green Version]
  21. Ates, F.; Kaya, O. The relationship between iron and nitrogen concentrations based on Kjeldahl method and SPAD-502 readings in grapevine (Vitis vinifera L. cv.‘Sultana Seedless’). Erwerbs-Obstbau 2021, 63, 53–59. [Google Scholar] [CrossRef]
  22. Casanova-Gascón, J.; Martín-Ramos, P.; Martí-Dalmau, C.; Badía-Villas, D. Nutrients assimilation and chlorophyll contents for different grapevine varieties in calcareous soils in the Somontano DO (Spain). Beverages 2018, 4, 90. [Google Scholar] [CrossRef] [Green Version]
  23. Petit, A.N.; Vaillant, N.; Boulay, M.; Clément, C.; Fontaine, F. Alteration of photosynthesis in grapevines affected by esca. Phytopathology 2006, 96, 1060–1066. [Google Scholar] [CrossRef] [PubMed] [Green Version]
  24. Pavlousek, P. Evaluation of drought tolerance of new grapevine rootstock hybrids. J. Environ. Biol. 2011, 32, 543. [Google Scholar] [PubMed]
  25. Porro, D.; Dorigatti, C.; Stefanini, M.; Ceschini, A. Use of SPAD meter in diagnosis of nutritional status in apple and grapevine. Acta Hortic. 2001, 564, 243–252. [Google Scholar] [CrossRef]
  26. Zulini, L.; Rubinigg, M.; Zorer, R.; Bertamini, M. Effects of drought stress on chlorophyll fluorescence and photosynthetic pigments in grapevine leaves (Vitis vinifera cv. ‘White Riesling’). Int. Workshop Adv. Grapevine Wine Res. 2005, 754, 289–294. [Google Scholar]
  27. Kawashima, S.; Nakatani, M. An Algorithm for Estimating Chlorophyll Content in Leaves Using a Video Camera. Ann. Bot. 1998, 81, 49–54. [Google Scholar] [CrossRef] [Green Version]
  28. Guendouz, A.; Bendada, H.; Benniou, R. A comparative study of chlorophyll content estimation in barley (Hordeum vulgare L.) genotypes based on RGB (Red, Green, Blue) image analysis. Agric. Sci. Dig. Res. J. 2022, 42, 68–71. [Google Scholar] [CrossRef]
  29. Cheng, L.; Zhu, X.; Gao, L.; Li, C.; Wang, L.; Zhao, G.; Jiang, Y. Estimation of chlorophyll content in apple leaves based on RGB model using digital camera. Acta Hortic. Sin. 2017, 44, 381–390. [Google Scholar]
  30. Özreçberoğlu, N.; Kahramanoğlu, İ. Mathematical models for the estimation of leaf chlorophyll content based on RGB colours of contact imaging with smartphones: A pomegranate example. Folia Hortic. 2020, 32, 57–67. [Google Scholar] [CrossRef]
  31. Sala, F.; Datcu, A.D.; Kolozsvári, A.G. RGB color parameters in the characterization of chlorophyll deficiency in leaves. Case study: Birch. Ann. West Univ. Timis. Ser. Biol. 2020, 23, 241–250. [Google Scholar]
  32. Sánchez-Sastre, L.F.; Alte da Veiga, N.M.S.; Ruiz-Potosme, N.M.; Carrión-Prieto, P.; Marcos-Robles, J.L.; Navas-Gracia, L.M.; Martín-Ramos, P. Assessment of RGB Vegetation Indices to Estimate Chlorophyll Content in Sugar Beet Leaves in the Final Cultivation Stage. AgriEngineering 2020, 2, 128–149. [Google Scholar] [CrossRef] [Green Version]
  33. Riccardi, M.; Mele, G.; Pulvento, C.; Lavini, A.; d’Andria, R.; Jacobsen, S.E. Non-destructive evaluation of chlorophyll content in quinoa and amaranth leaves by simple and multiple regression analysis of RGB image components. Photosynth. Res. 2014, 120, 263–272. [Google Scholar] [CrossRef]
  34. Apogee Chlorophyll Meter Support. Available online: https://www.apogeeinstruments.com/chlorophyll-meter-support/#specifications (accessed on 1 February 2023).
  35. Chavarria, G.; Santos, H.P.D.; Castro, L.A.S.D.; Marodin, G.A.B.; Bergamaschi, H. Anatomy, chlorophyll content and photosynthetic potential in grapevine leaves under plastic cover. Rev. Bras. Frutic. 2012, 34, 661–668. [Google Scholar] [CrossRef] [Green Version]
  36. Lu, J.; Eitel, J.U.; Engels, M.; Zhu, J.; Ma, Y.; Liao, F.; Zheng, H.; Wang, X.; Yao, X.; Cheng, T.; et al. Improving Unmanned Aerial Vehicle (UAV) remote sensing of rice plant potassium accumulation by fusing spectral and textural information. Int. J. Appl. Earth Obs. Geoinf. 2021, 104, 102592. [Google Scholar] [CrossRef]
  37. Fuentes, S.; Hernández-Montes, E.; Escalona, J.M.; Bota, J.; Viejo, C.G.; Poblete-Echeverría, C.; Tongson, E.; Medrano, H. Automated grapevine cultivar classification based on machine learning using leaf morpho-colorimetry, fractal dimension and near-infrared spectroscopy parameters. Comput. Electron. Agric. 2018, 151, 311–318. [Google Scholar] [CrossRef]
  38. Doğan, A.; Uyak, C. A different approach for grape leaf color. J. Agric. Fac. Gaziosmanpasa Univ. 2020, 37, 44–52. [Google Scholar]
Figure 1. MVR prediction result for chlorophyll concentration using LV = 10.
Horticulturae 09 00899 g001
Disclaimer/Publisher’s Note: The statements, opinions and data contained in all publications are solely those of the individual author(s) and contributor(s) and not of MDPI and/or the editor(s). MDPI and/or the editor(s) disclaim responsibility for any injury to people or property resulting from any ideas, methods, instructions or products referred to in the content.

