Article

Tuning of Structural, Dielectric, and Electronic Properties of Cu Doped Co–Zn Ferrite Nanoparticles for Multilayer Inductor Chip Applications

1
Department of Physics and Astronomy, College of Science, King Saud University, P.O. Box 2455, Riyadh 11451, Saudi Arabia
2
King Abdullah Institute for Nanotechnology, King Saud University, P.O. Box 2455, Riyadh 11451, Saudi Arabia
3
School of Physics and Materials Science, Shoolini University of Biotechnology & Management Sciences, Bajhol, Solan 173212, India
4
Engineering Technology Research Center of Magnetic Materials, Anhui Province, School of Physics & Materials Science, Anhui University, Hefei 230601, China
*
Author to whom correspondence should be addressed.
Magnetochemistry 2021, 7(4), 53; https://doi.org/10.3390/magnetochemistry7040053
Submission received: 12 March 2021 / Revised: 9 April 2021 / Accepted: 13 April 2021 / Published: 14 April 2021
(This article belongs to the Special Issue Advances in Fine Particle Magnetism and Bio-Magnetic Materials)

Abstract

:
Herein, we report the synthesis of nanoparticles and doping of Cu-doped Co–Zn ferrites using the auto-combustion sol–gel synthesis technique. X-ray diffraction studies confirmed the single-phase structure of the samples with space group Fd3m and crystallite size in the range of 20.57–32.69 nm. Transmission electron microscopy micrographs and selected area electron diffraction patterns confirmed the polycrystalline nature of the ferrite nanoparticles. Energy-dispersive X-ray spectroscopy revealed the elemental composition in the absence of any impurity phases. Fourier-transform infrared studies showed the presence of two prominent peaks at approximately 420 cm−1 and 580 cm−1, showing metal–oxygen stretching and the formation of ferrite composite. X-ray photoelectron spectroscopy was employed to determine the oxidation states of Fe, Co, Zn, and Cu and O vacancies based on which cationic distributions at tetrahedral and octahedral sites are proposed. Dielectric spectroscopy showed that the samples exhibit Maxwell–Wagner interfacial polarization, which decreases as the frequency of the applied field increases. The dielectric loss of the samples was less than 1, confirming that the samples can be used for the fabrication of multilayer inductor chips. The ac conductivity of the samples increased with increasing doping and with frequency, and this has been explained by the hopping model. The hysteresis loops revealed that coercivity decreases slightly with doping, while the highest saturation magnetization of 55.61 emu/g was obtained when x = 0.1. The magnetic anisotropic constant was found to be less than 0.5, which suggests that the samples exhibit uniaxial anisotropy rather than cubic anisotropy. The squareness ratio indicates that the samples are useful in high-frequency applications.

1. Introduction

Nanoparticles exhibit novel material properties because of their small particle size, which differs from the bulk solid state. Many reports have shown that the evolution of metallic particle properties depends on their size [1,2]. Ferrites have attracted considerable attention in the scientific community over the past few decades because of their unique and promising electrical, optical, and magnetic properties. Ferrites are one of the good dielectric materials, which have low conductivity or high resistivity that make them an appropriate choice for various applications in devices such as microwave devices, transformers, electric generators, and storage devices [3]. Among the various spinel ferrites that have important properties, cobalt ferrite (CoFe2O4) has been the center of attention and the subject of much interest. It has been studied extensively by the scientific community because of its high coercivity, moderate saturation magnetization, high chemical stability, and magnetic and electrical conductivity [4,5].
CoFe2O4 possesses an inverse spinel structure, while ZnFe2O4 has a normal spinel structure. Substituting Co for Zn in CoFe2O4 results in a deformed spinel structure depending on the ratio of Co:Zn within the precursor solutions [6]. It is more interesting to substitute magnetic Co2+ ions with non-magnetic Zn2+ in Co-ferrite to understand the difference in the properties of the new system. Spinel ferrites have a general formula AB2O4, where A = Zn, Co, Mg, Mn, etc., in which the metal cations A and B represent tetrahedral and octahedral sites [7]. In a spinel ferrite, 8 tetrahedral sites are occupied by divalent cations and 16 octahedral sites are occupied by trivalent cations. This type of ferrite has attracted considerable attention in the scientific community because of its wide range of applications in various fields, from the biomedical to electronic industries and for uses such as in magneto-optical devices [8], a contrast agent for magnetic resonance imaging (MRI) [9], drug delivery systems [10], spintronic devices [11], and magneto hyperthermia [12]. Halder et al. studied the influence of the annealing temperature and concentration of the Co0.5Zn0.5Fe2O4 nanoparticles as a heat generation material for hyperthermia therapy and found that all the samples possessed a single-phase cubic spinel structure [13]. Feng et al. synthesized CoxZn1−xFe2O4 by employing an auto-combustion route, and the XRD patterns showed a single-phase cubic spinel structure. The M–H curves showed superparamagnetic behavior at room temperature [14]. Köseoğlu et al. studied the CoxZn1-xFe2O4 nanocrystals and reported that the sample has a large grain structure, and the value of magnetization sharply increases with an applied magnetic field [15]. Cu2+ is a highly electrically conductive Jahn-Teller ion in the ground state with degenerate orbitals that are influenced by the distortion. The crystal distortions are caused by the incorporation of Cu2+ ions in the spinel ferrites, which is directly linked with enhancement in electrical and magnetic properties [16,17,18]. It has been reported that the crystal distortion caused by Cu2+ ions depend on their occupancy at tetrahedral and octahedral sites [19].
Multilayer chip inductors (MLCIs) are the major component of radio-frequency circuits in electronic devices required for the amplification of signals, filtration, and modulation [20]. The main requirement of MLCIs is a high permeability value for the reduced number of layers in the chip for enhancing the miniaturization of electronic devices [21]. The soft ferrite materials are co-fired layer by layer with internal contact materials [22]. Electromagnetic interference (EMI) is a major threat to human health, it also affects the functionality of electronic devices. The synergetic effect of magnetic and dielectric loss influences the microwave absorption properties of ferrites and is composition-dependent [23,24].
Gurusiddesh et al. investigated the microwave absorption properties of polyalanine-decorated CoFe2O4 nanoparticles with shielding effectiveness values of 39.9 dB and 58.22 dB at 50 Hz for pure and polyalanine-decorated CoFe2O4 nanoparticles, respectively [25]. Sulaiman et al. observed that at a 1:1 concentration of Co0.5 Zn0.5 Fe2 O4/PANI-PTSA, reflection losses were −2.3 dB (>40% power absorption) at 8.1 GHz, −17.08 dB (98% power absorption) at 9 GHz, and −24.86 dB (99.73% power absorption) at 10.9 GHz, revealing its potential as a microwave absorbing material [26].
Various methods have been adopted to synthesize cobalt–zinc ferrite nanoparticles, such as co-precipitation, sol–gel, solid-state, micro-emulsions, combustion, and hydrothermal methods. Among the different chemical methods reported in the literature used to synthesize Co–Zn ferrite nanoparticles, the sol–gel process is likely an effective method, which results in inhomogeneous and crystalline nanoparticles. The sol–gel auto-combustion method is a low-temperature synthesis process, which involves the hydrolysis and condensation reactions of metal precursors, prompting the arrangement of a three-dimensional inorganic system [27]. In this paper, we report the structural, morphological, electronic, and dielectric properties of the Cu-substituted Co–Zn ferrites prepared by the sol–gel auto-combustion method for MLCI and EMI filter applications.

2. Materials and Method

2.1. Materials

All the chemicals used to synthesize the nanoparticles of Cu-doped Co–Zn ferrite were of analytical grade (AR) and were used without any further purification. The chemicals used in the fabrication of the ferrites included cobalt nitrate hexahydrate (Co(NO3)2·6H2O), ferric nitrate hexahydrate (Fe(NO3)3·9H2O), zinc nitrate hexahydrate (Zn(NO3)2·6H2O), copper nitrate hexahydrate (Cu(NO3)2·6H2O), citric acid (C6H8O7·H2O), ethylene glycol (C2H6O2), and ammonia (NH3·H2O). Triple distilled water was used for the synthesis of the Co–Zn ferrite nanoparticles.

2.2. Method

Copper ion-substituted Co–Zn ferrite powders with a general formula of Co0.5Zn0.5Fe2-xCuxO4 (where, x = 0.0, 0.5, 0.1, and 0.05, respectively) were synthesized using the sol–gel auto-combustion method. The ratio of a chelating agent, citric acid, to metal nitrate was 1:1. First, the stoichiometric weight of (Co(NO3)2·6H2O), (Zn(NO3)2·6H2O), (Cu(NO3)2·6H2O), (Fe(NO3)3·9H2O), and (C6H8O7·H2O) were individually dissolved in deionized water for a hydrolysis reaction at 60 ℃ with continuous stirring for 45 min. Ammonia solution was added dropwise to maintain the pH value at 7. After some time, ethylene glycol (gelating reagent) was added to the solution as a polymerization promoter; the solution began to turn into a brown gel, which was heated at 80 °C under continuous stirring for 3 h. The gel was dried at 120 °C, and a self-propagating combustion process occurred, in which most of the organic solvents were burned and an almost-black powder was left. The powder was calcined at 400 °C for 12 h and then milled using a mortar and pestle for 30 min. The samples were pressed to circular disk-shaped pellets with opposite sides coated with a silver paste to create a parallel plate capacitor geometry for the dielectric measurements.

2.3. Characterization

The structure and crystallite sizes of the as-prepared nanoparticles (NPs) were characterized by X-ray diffraction (XRD, Rigaku Miniflex-600, Japan), with CuKα radiation (λ = 1.5405 Å) between 20° and 80° at a scanning rate of 2 °/min at room temperature. The surface morphology was studied using a field emission scanning electron microscope (FESEM, JSM 7600F JEOL, Japan). The cross-sections and particle sizes of the nanoparticles were studied using a field emission transmission electron microscope (FETEM, JEM-2100F, JEOL, Japan) coupled with energy-dispersive X-ray (EDX) analysis, operating at an accelerating voltage of 200 kV. Fourier-transform infrared (FTIR) spectroscopy measurements were carried out using a Perkin-Elmer 580B IR spectrometer by the KBr pellet technique. X-ray photoelectron spectroscopy (XPS) measurements were carried out using a Sigma2 XPS and a ThetaProbe manufactured by Thermo Fisher Scientific Inc., East Grinstead, UK. Sigma 2 was equipped with an Al/Mg Ka twin source. Dielectric measurements were carried out using the HIOKI LCR meter IM3536 model.

3. Results and Discussion
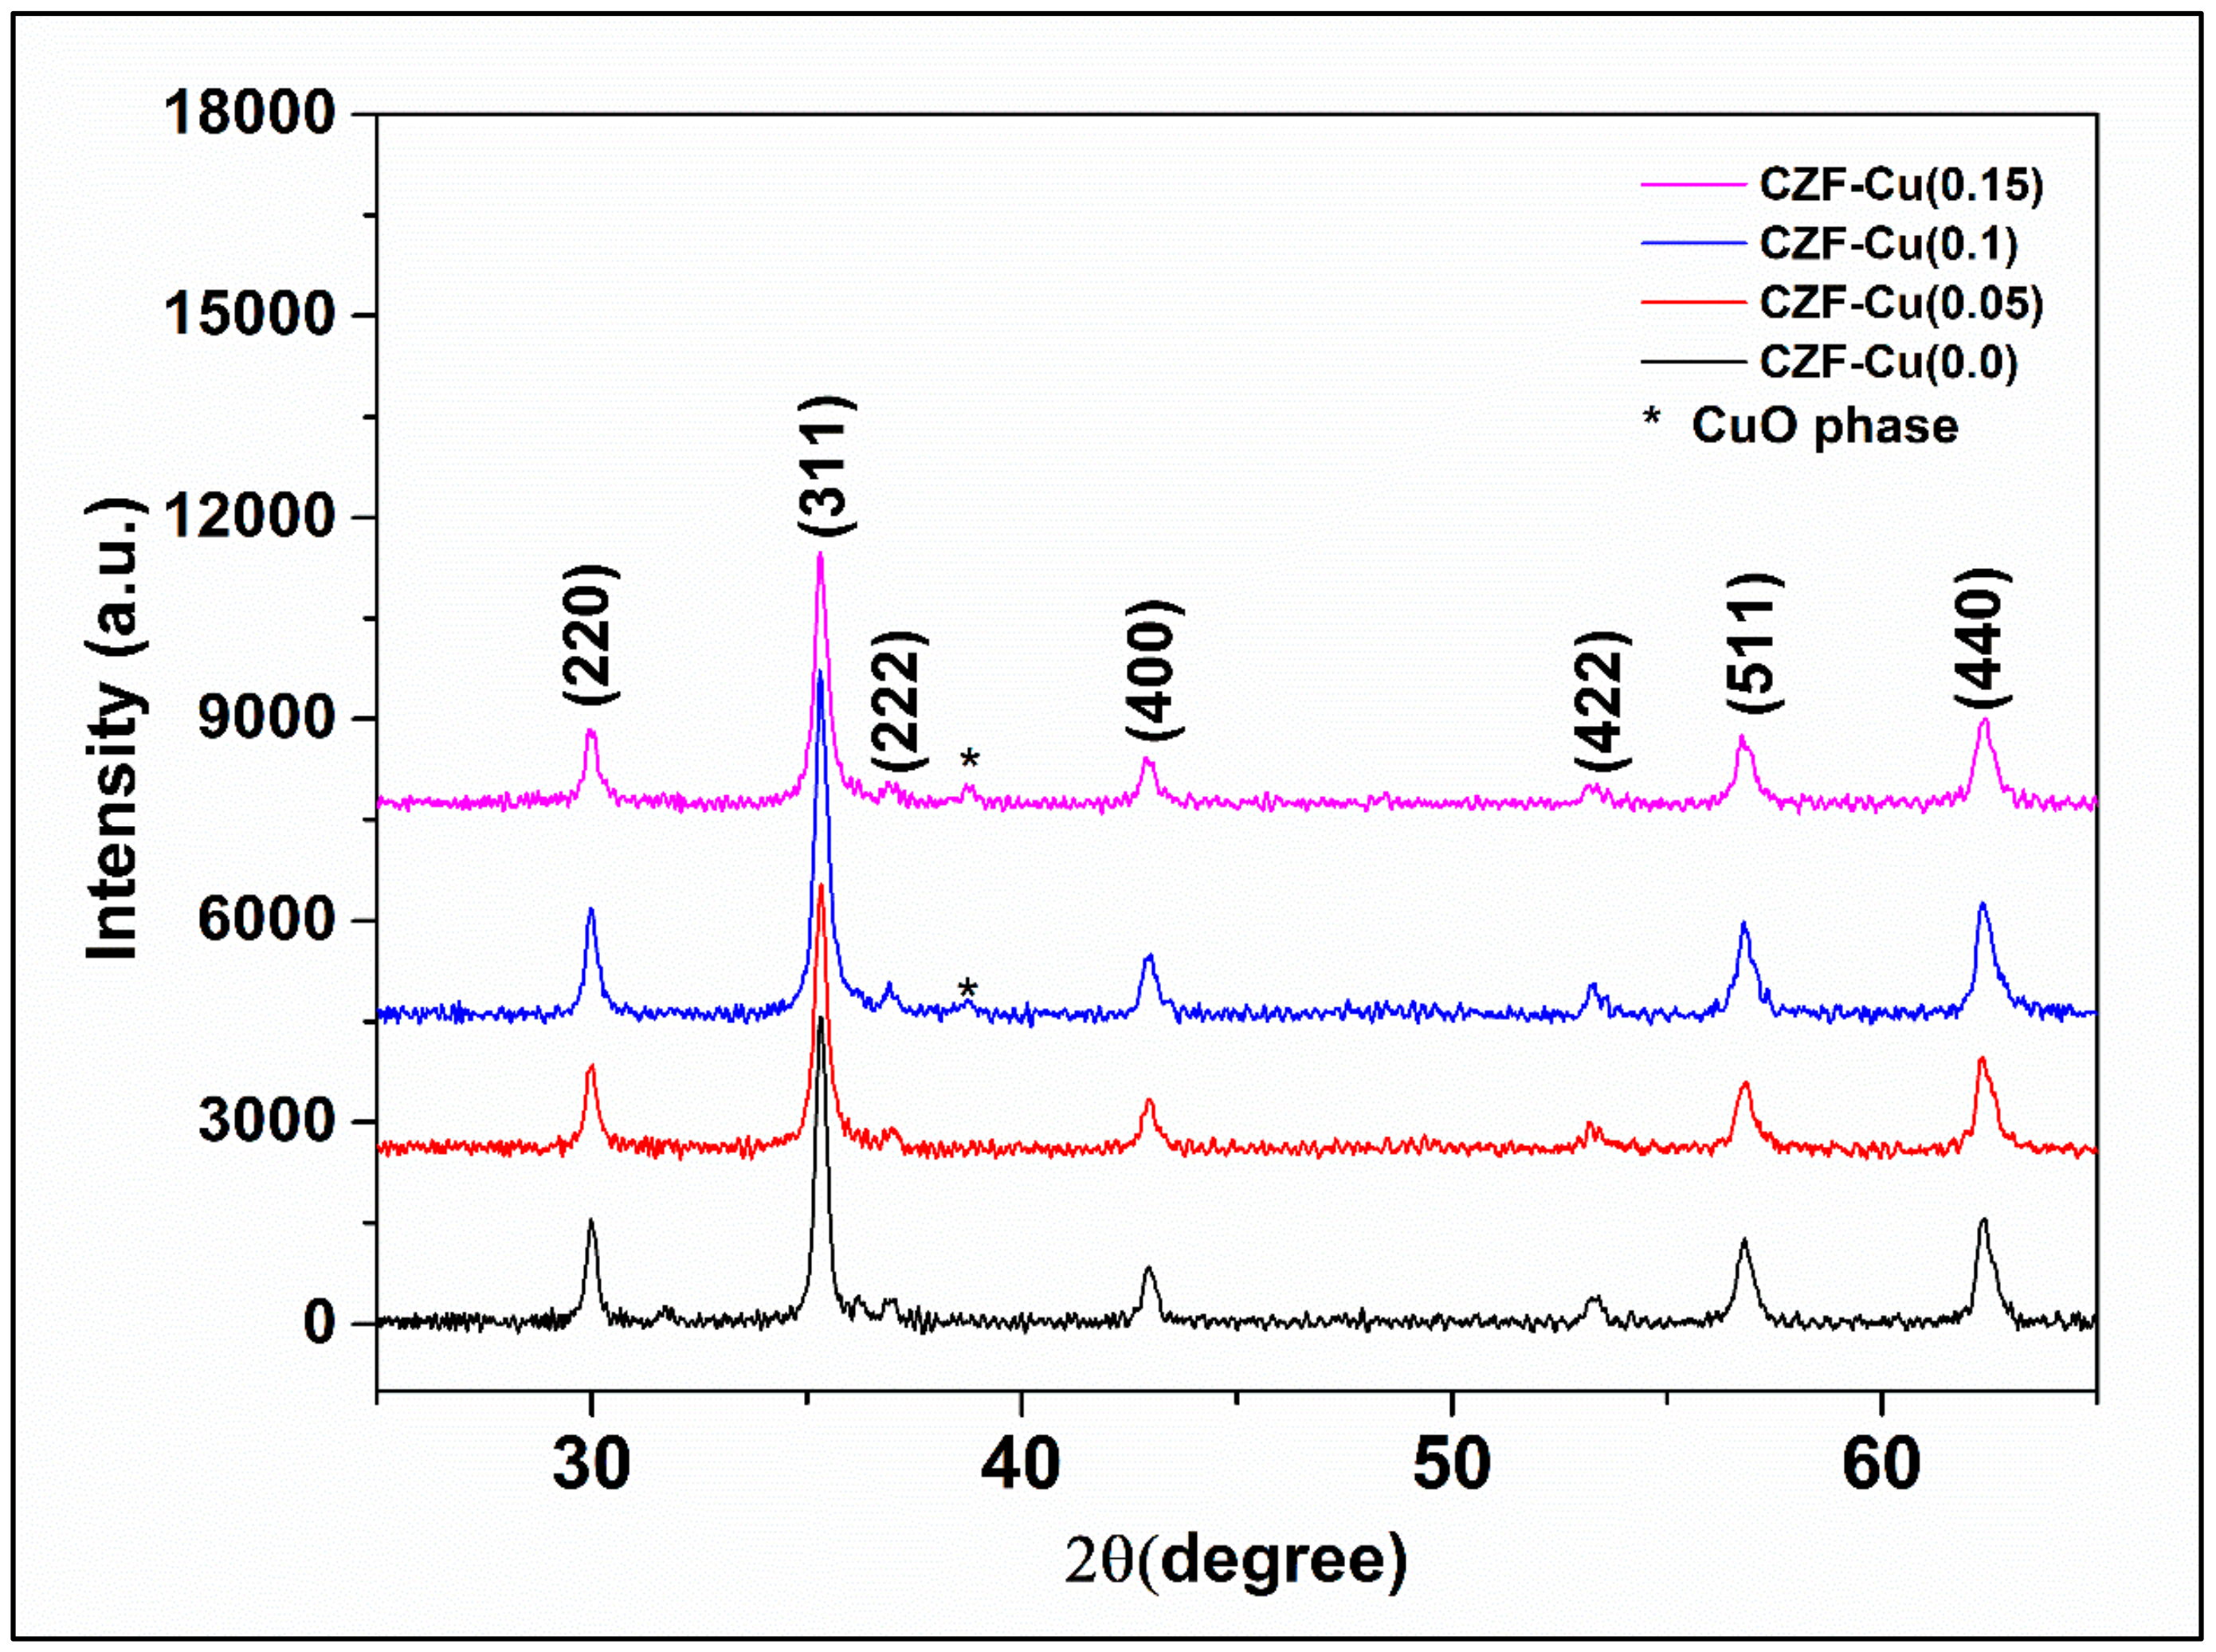
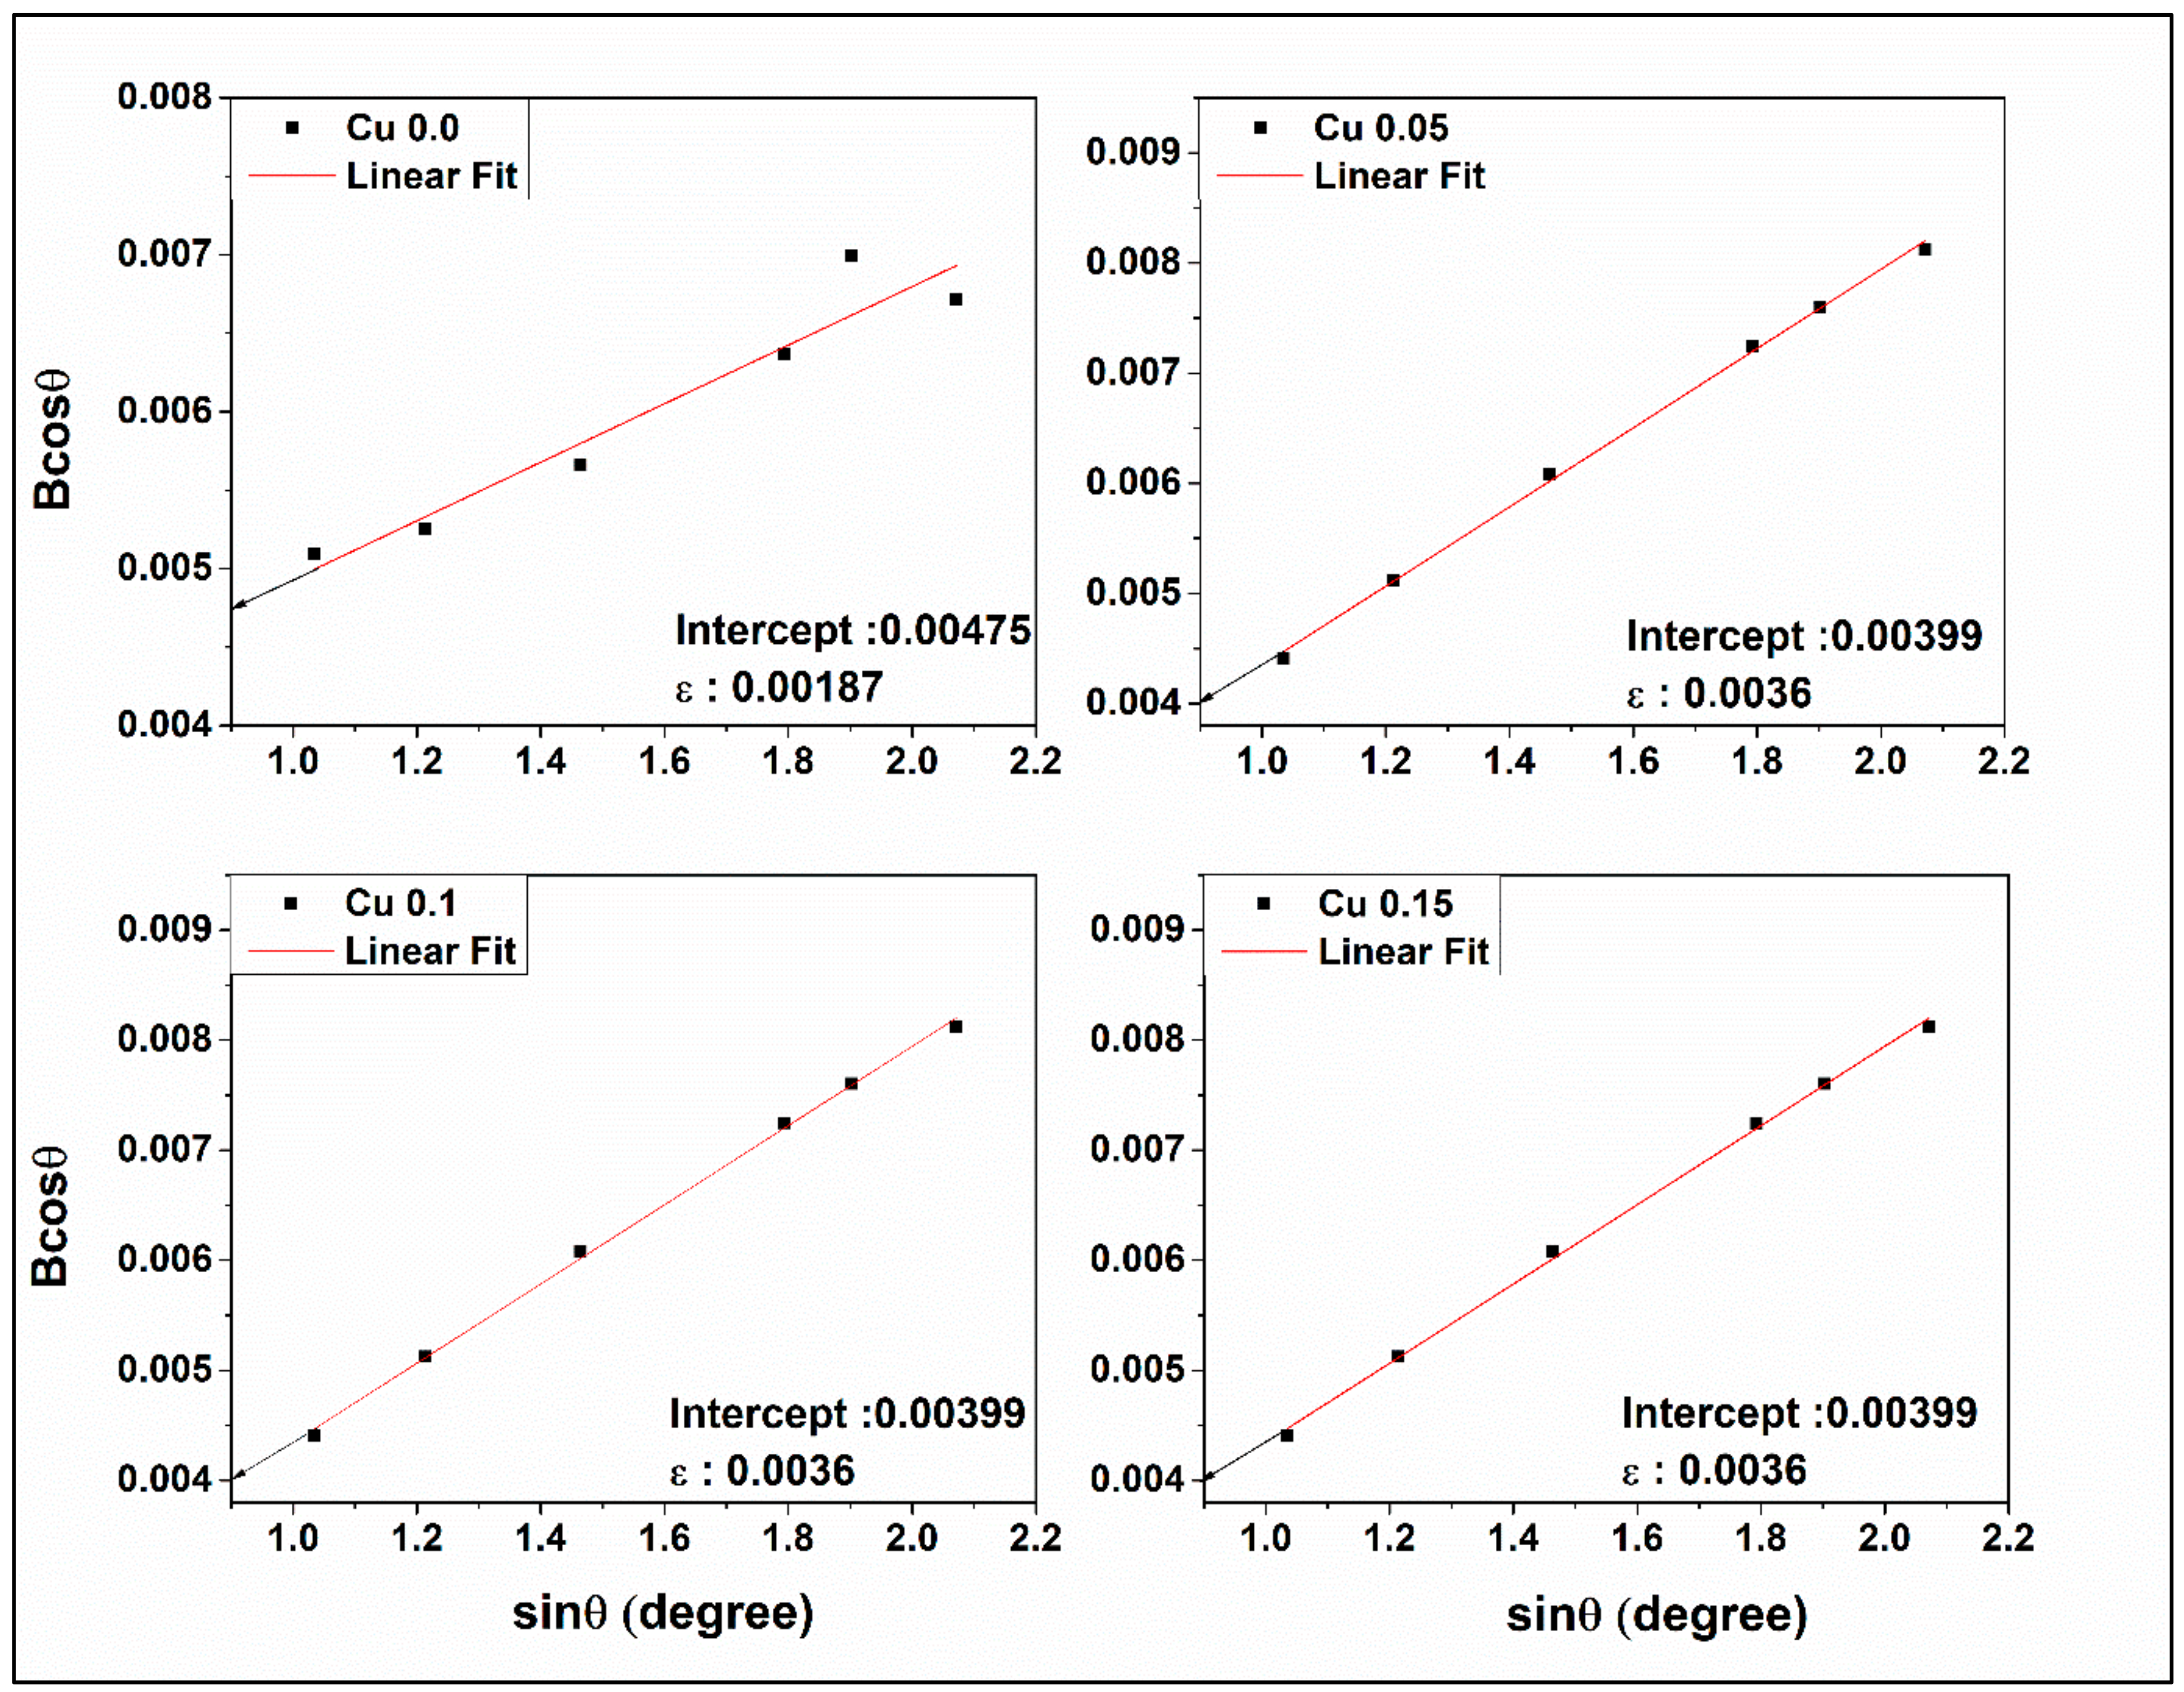
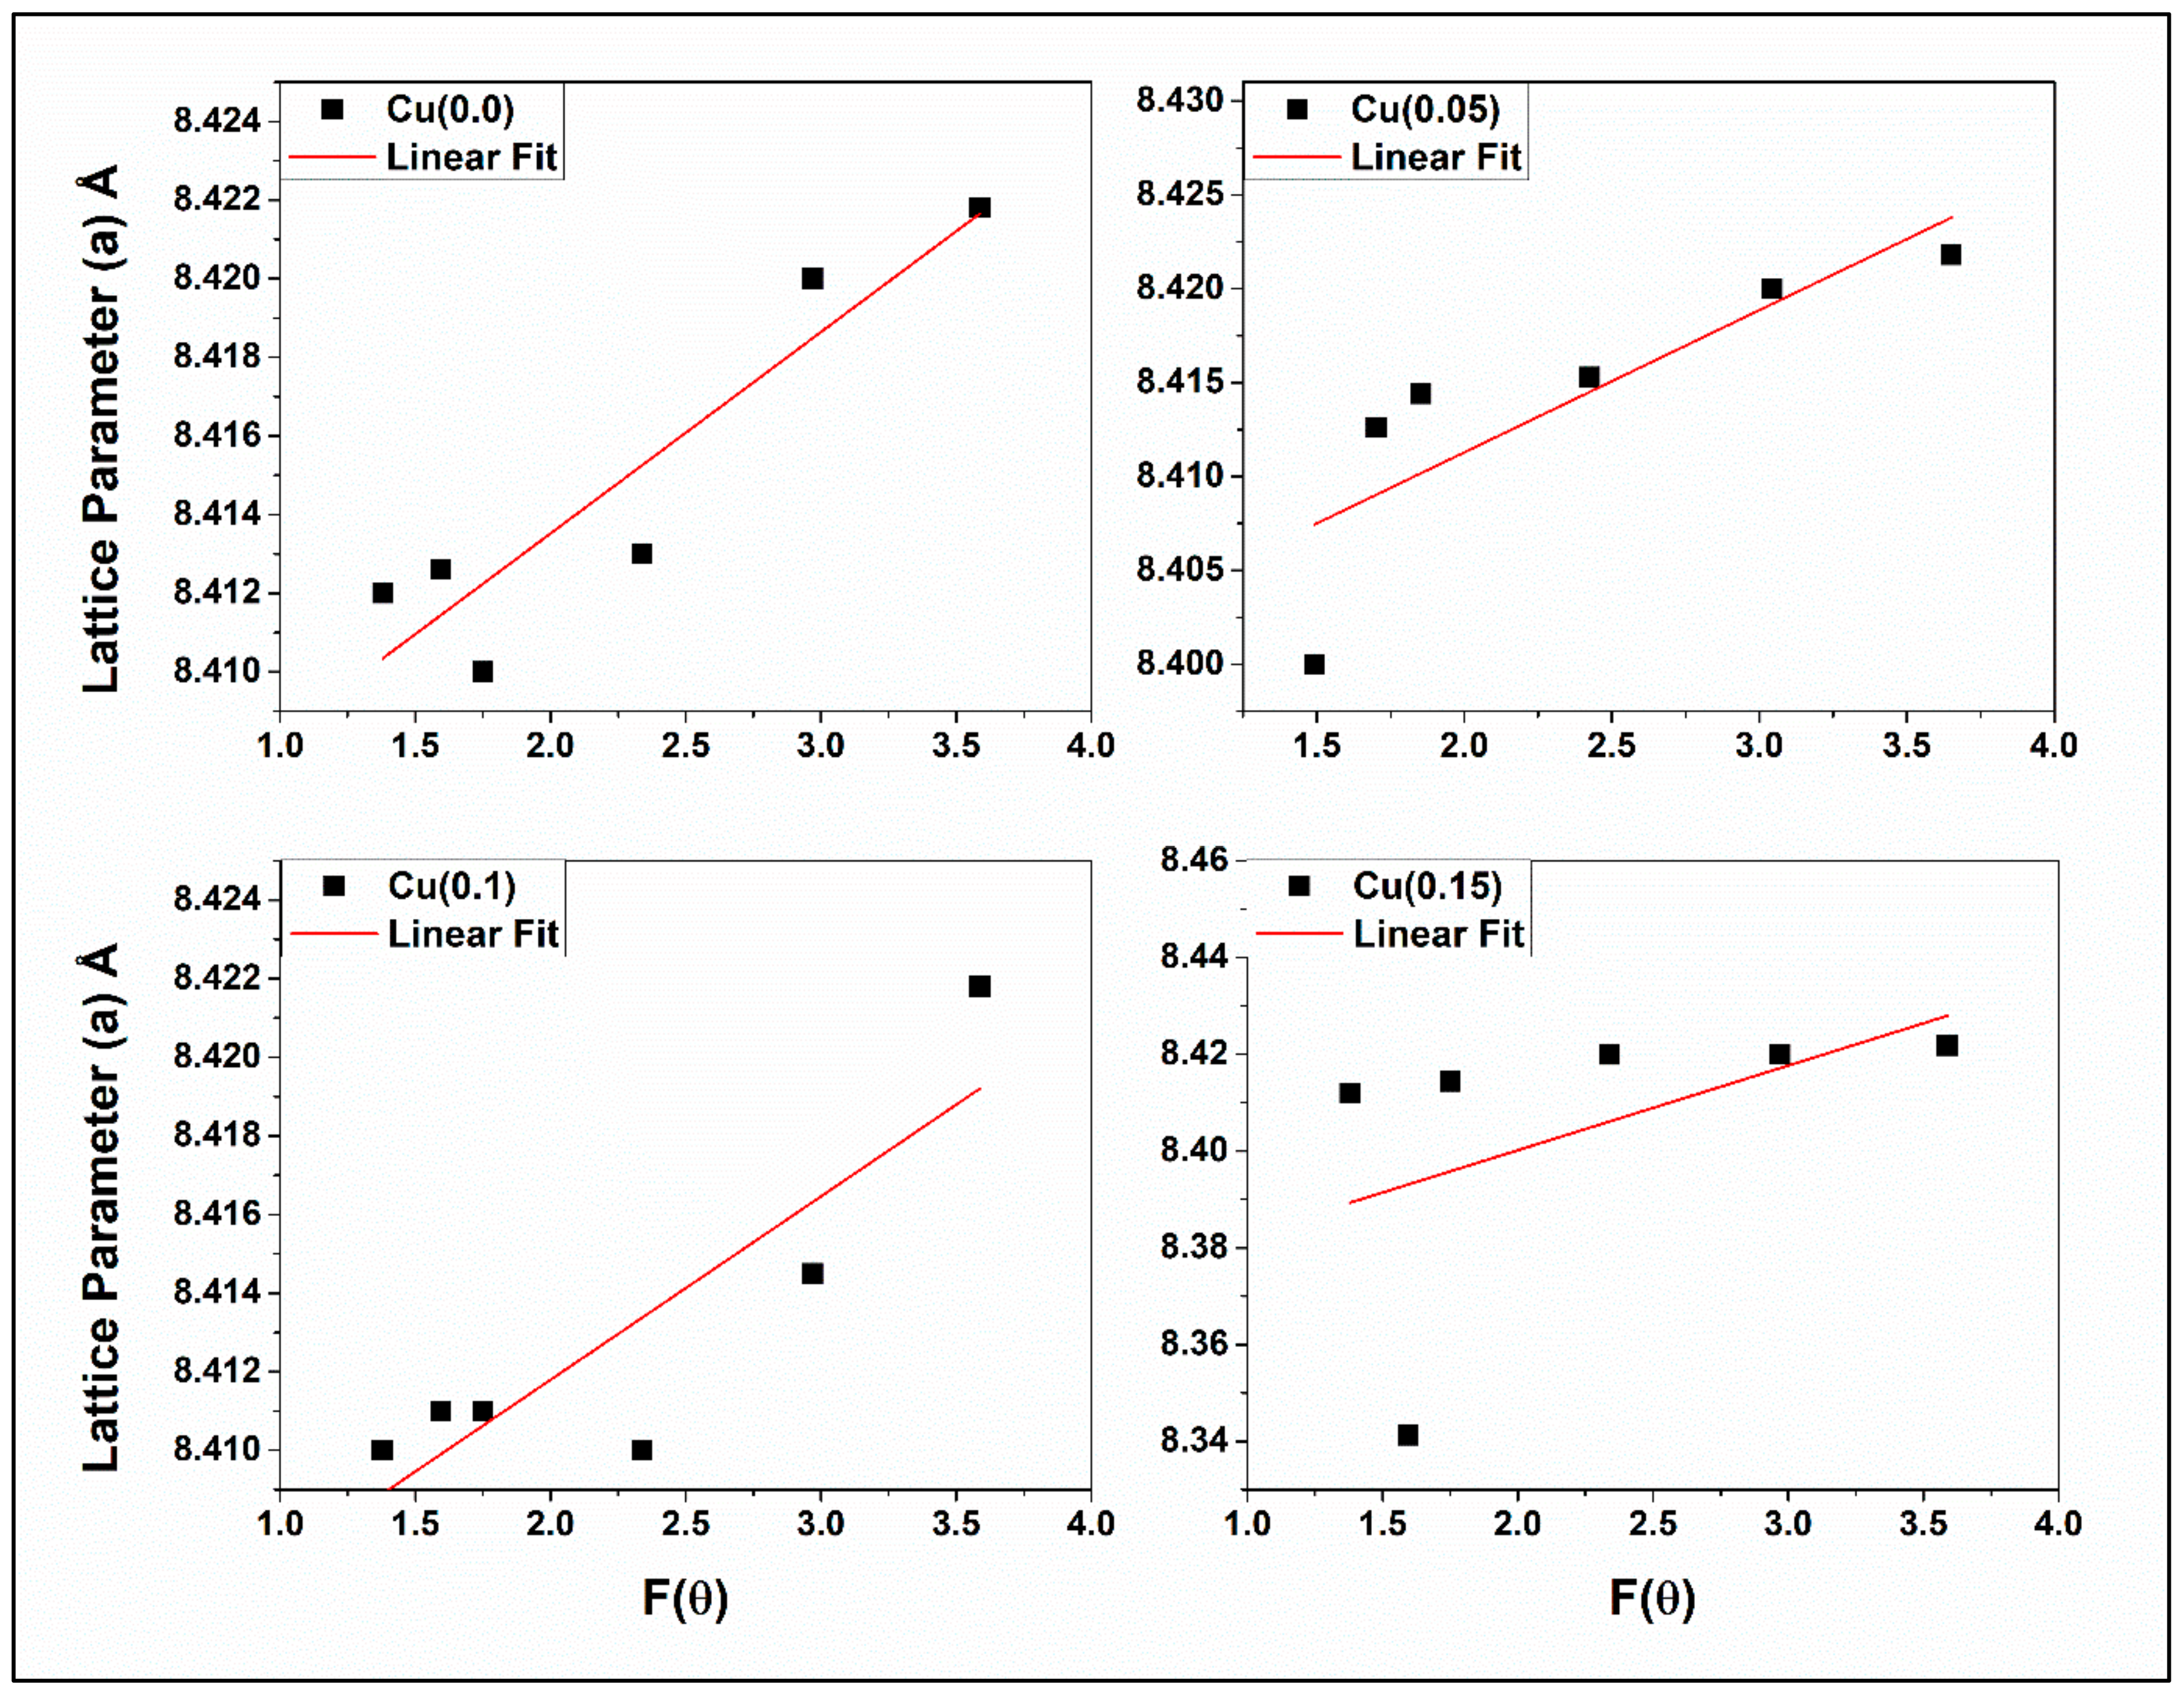
3.1. XRD

The XRD patterns of the calcined Co0.5 Zn0.5Fe2-xCuxO4 ferrites are given in Figure 1. The peaks are indexed as (220), (311), (222), (400), (422), (511), and (440) corresponding to the angular positions of 30°, 35.6°, 37.2°, 43.3°, 53.7°, 57.2°, and 62.8° 2θ values, respectively, and they correspond to the standard peaks of CoFe2O4 with JCPDS file no. 22-1086. The XRD patterns revealed that all the samples possessed single-phase cubic spinel structures with a Fd3m space group, with an impurity phase of copper oxide at a higher concentration JCPDS file no. 05-0661 ruling out the formation of any unwanted secondary phases corresponding to any structure. The average crystallite size (D) was estimated using the Debye–Scherrer formula [28]:
D = 0.9λ/βcosθ,
where λ is the XRD wavelength (1.54 Å), θ is the diffraction angle, and β is the full-width half maximum of the diffraction peaks. It can be observed from Table 1 that the crystallite size decreases with the increase in the Cu2+ concentration. The XRD peak broadening was attributed to the small crystallite size and the generation of an intrinsic microstrain. The microstrain was produced due to the changes in the lattice parameter, which resulted from the crystal imperfections and dislocations. Hence, the microstrain that developed inside the crystal was calculated by the Williamson–Hall method based on the uniform deformation model (UDM) given by the straight-line equation [29]:
β cos θ = K λ D + ε   4 sin θ .
The UDM model considers the isotropic nature of the crystals and the slope of the plot between βcosθ along the y-axis and 4sinθ along the x-axis corresponding to each peak of the sample. It can be observed from Figure 2 that a nearly uniform strain is generated among all the samples as the Cu concentration increases, and correlation value R2 is above 0.9, revealing a good fit. The values of lattice parameters a were calculated using the equation below [30] and are listed in Table 1:
a = d h 2 + k 2 + l 2
The most accurate determination of the lattice parameter a given in Table 1 was employed using the Nelson–Riley plot shown in Figure 3 by plotting the lattice constant to the Nelson–Riley function F(θ) [31], given as:
F θ = 1 / 2 cos θ 2 / sin θ   + cos θ 2 / θ
The ionic radii of the tetrahedral (rA) and octahedral (rB) sites, hopping lengths LA and LB of the magnetic ions at the tetrahedral and octahedral sites, tetrahedral and octahedral bond lengths (dAX and dBX), tetrahedral edge length (dAXE), and octahedral shared and unshared edge length (dBXE and dBXEU) were calculated using the following equations and are listed in Table 1 [32,33,34]:
d A X = 1.732 a u 0.25
d B X = a 3 u 2.75 u + 0.6719  
d A X E = 1.4142 a 2 u 0.5  
d B X E = 1.4142 a 1 2 u  
d B X E U = a 4 u 3 u + 0.6875  
r A = u 0.25 a 3 R o  
r B = 0.625 u a R o  
L A   = 3 4 a  
L B   = 2 4 a
where u is the oxygen parameter with the value of 0.381 Å and Ro is 1.32 Å. Table 1 shows that there is a decrease in the above-mentioned values that is mainly due to the substitution of Cu+2 at the tetrahedral site instead of the octahedral site.

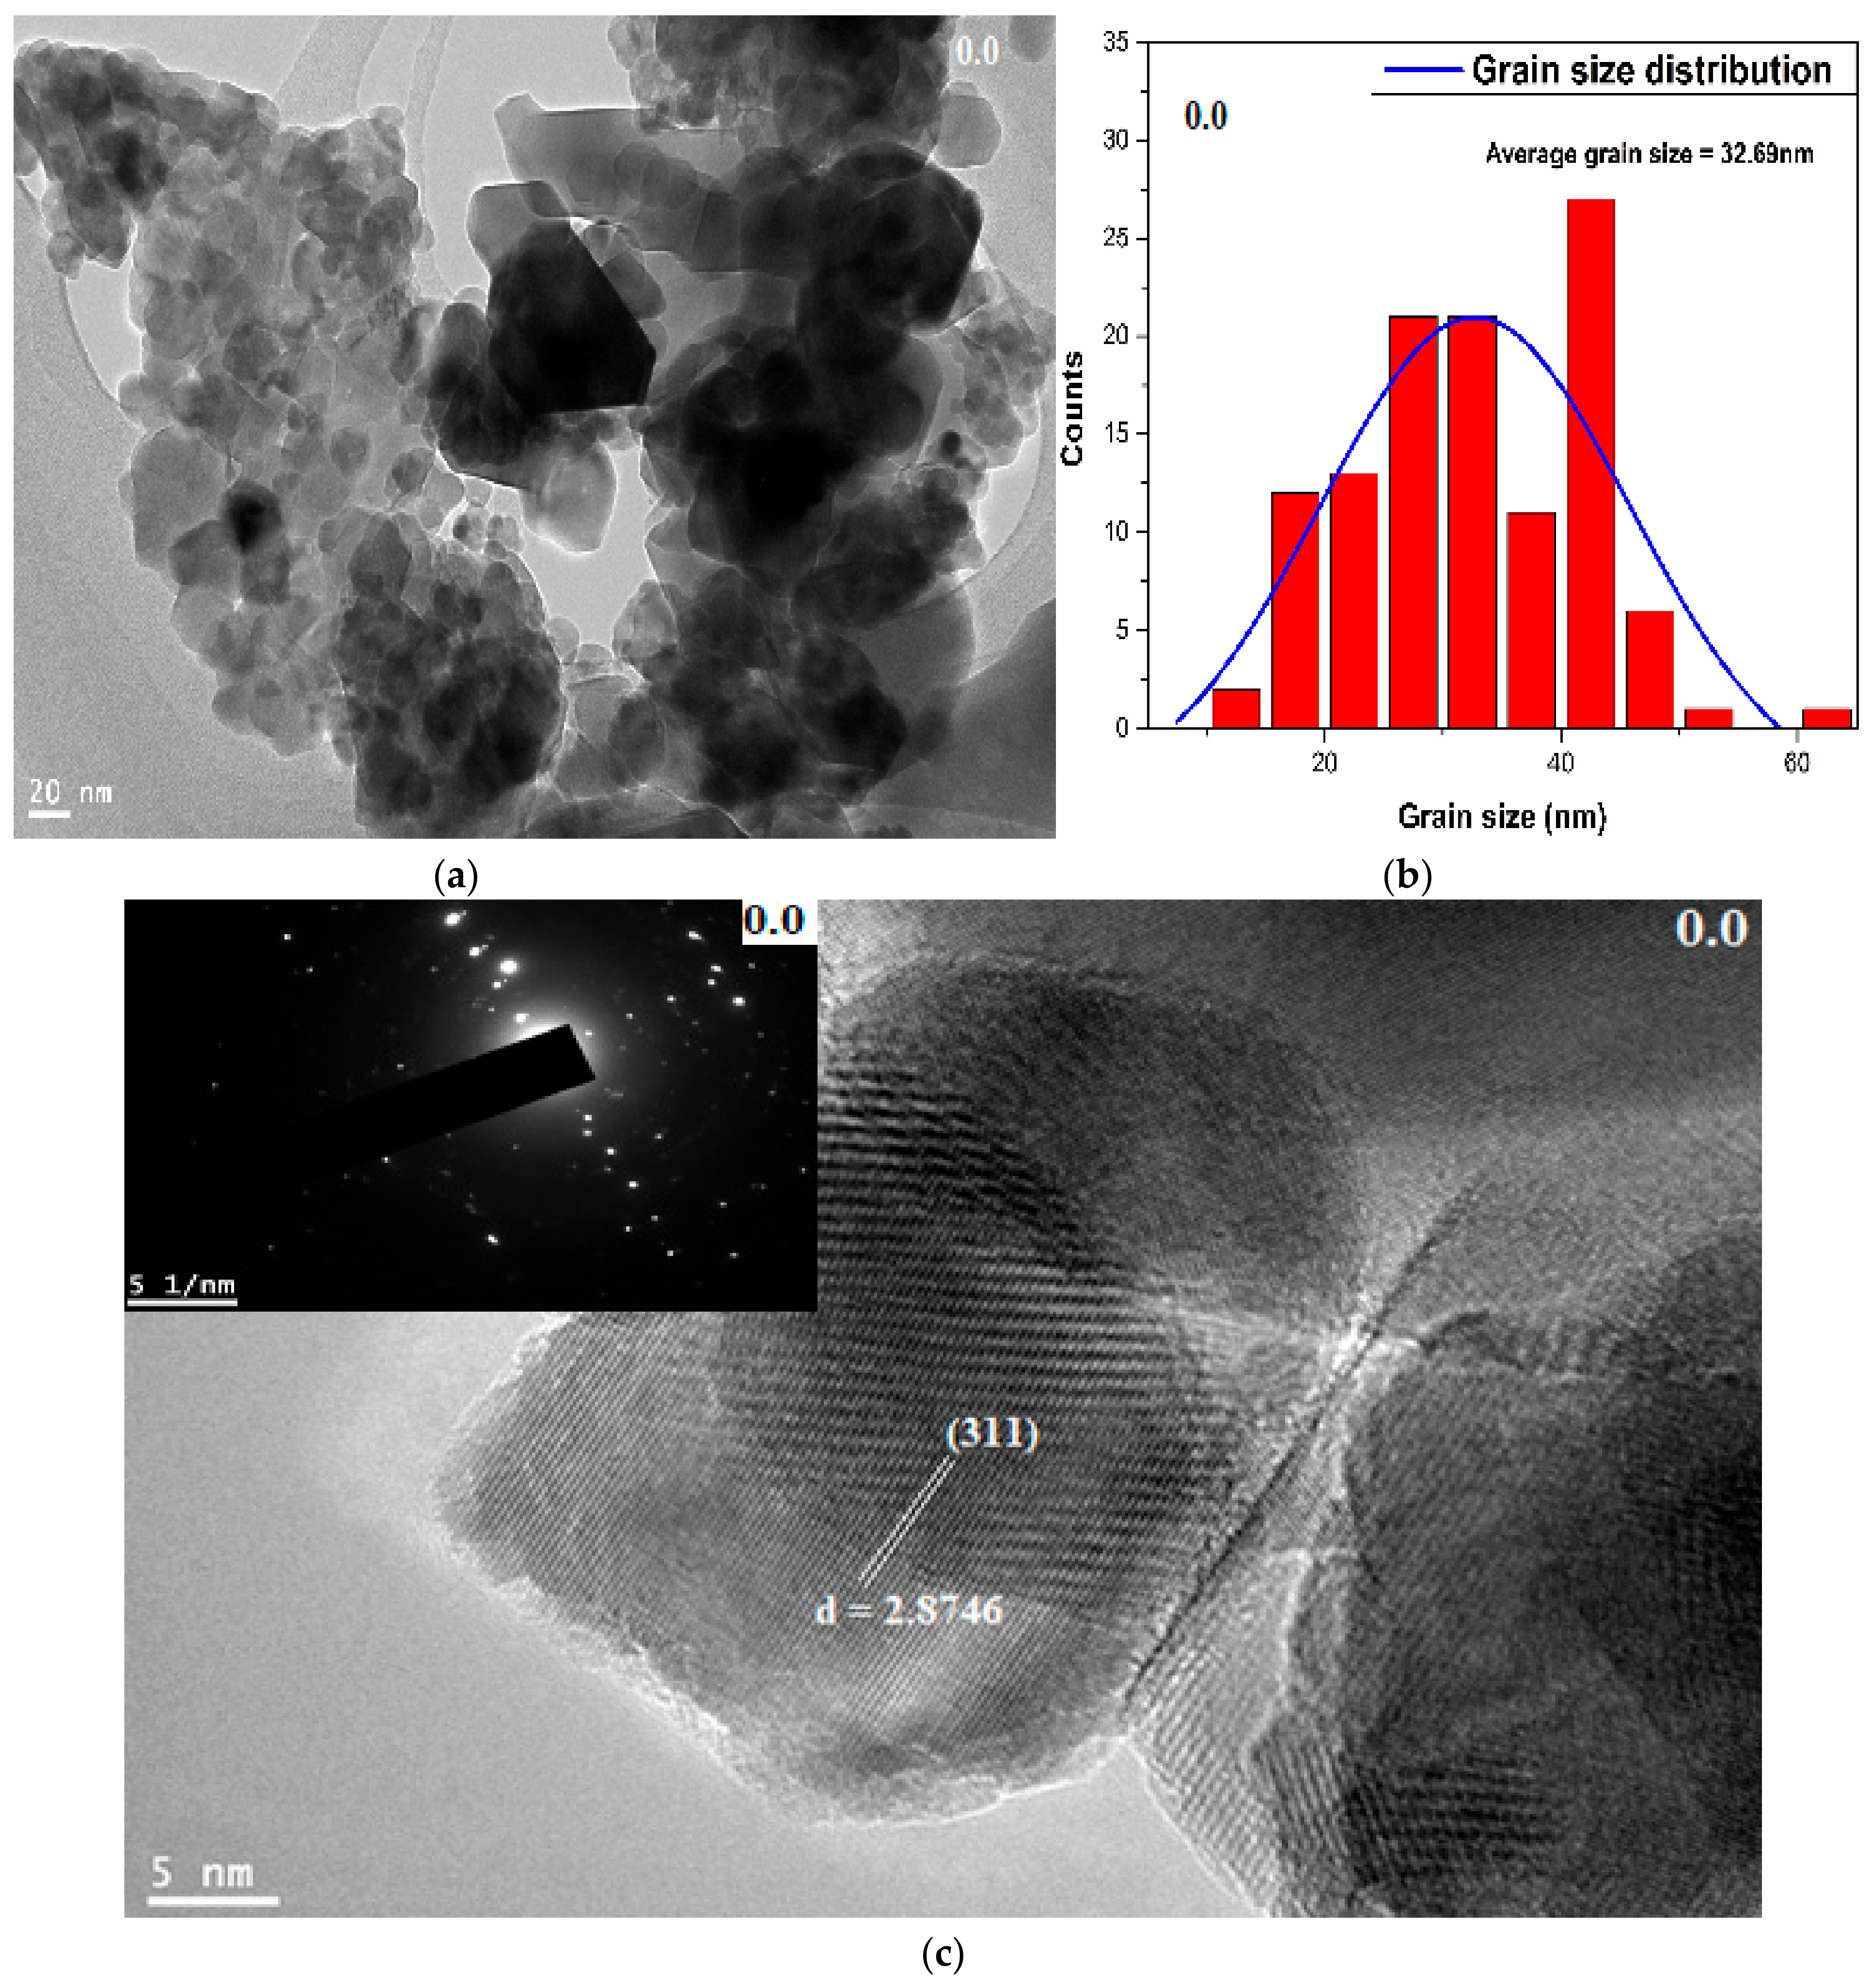
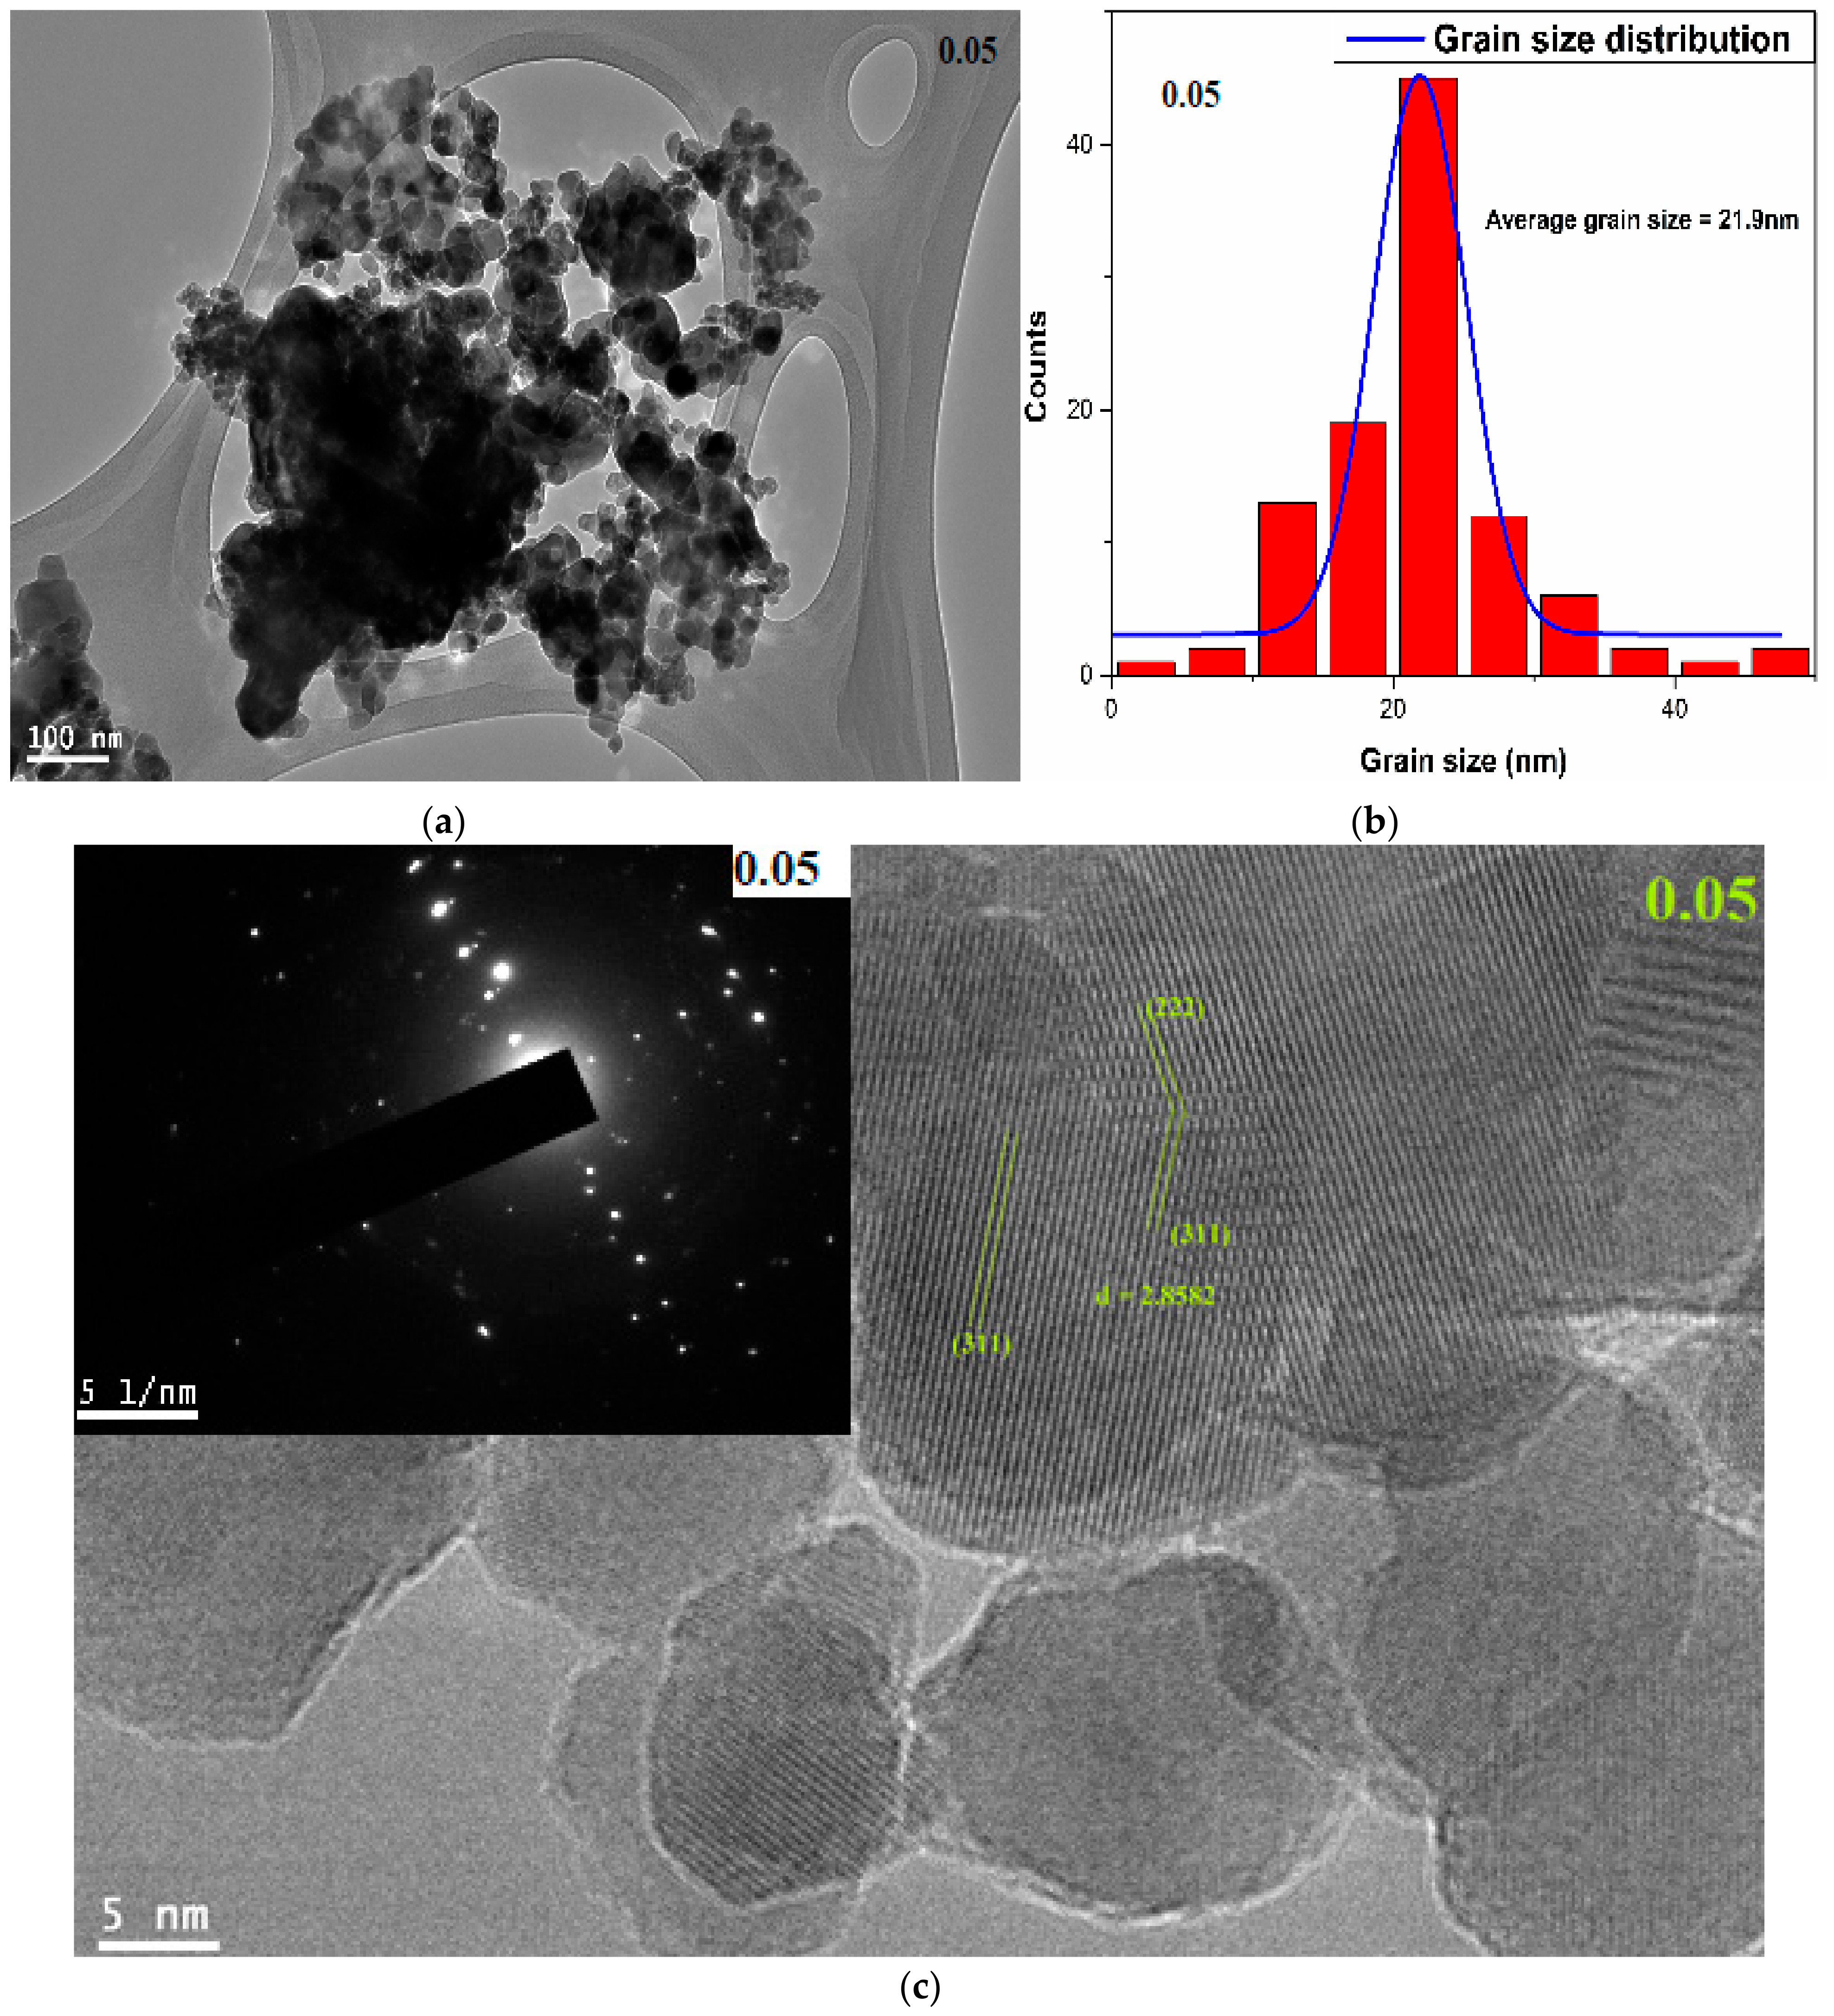
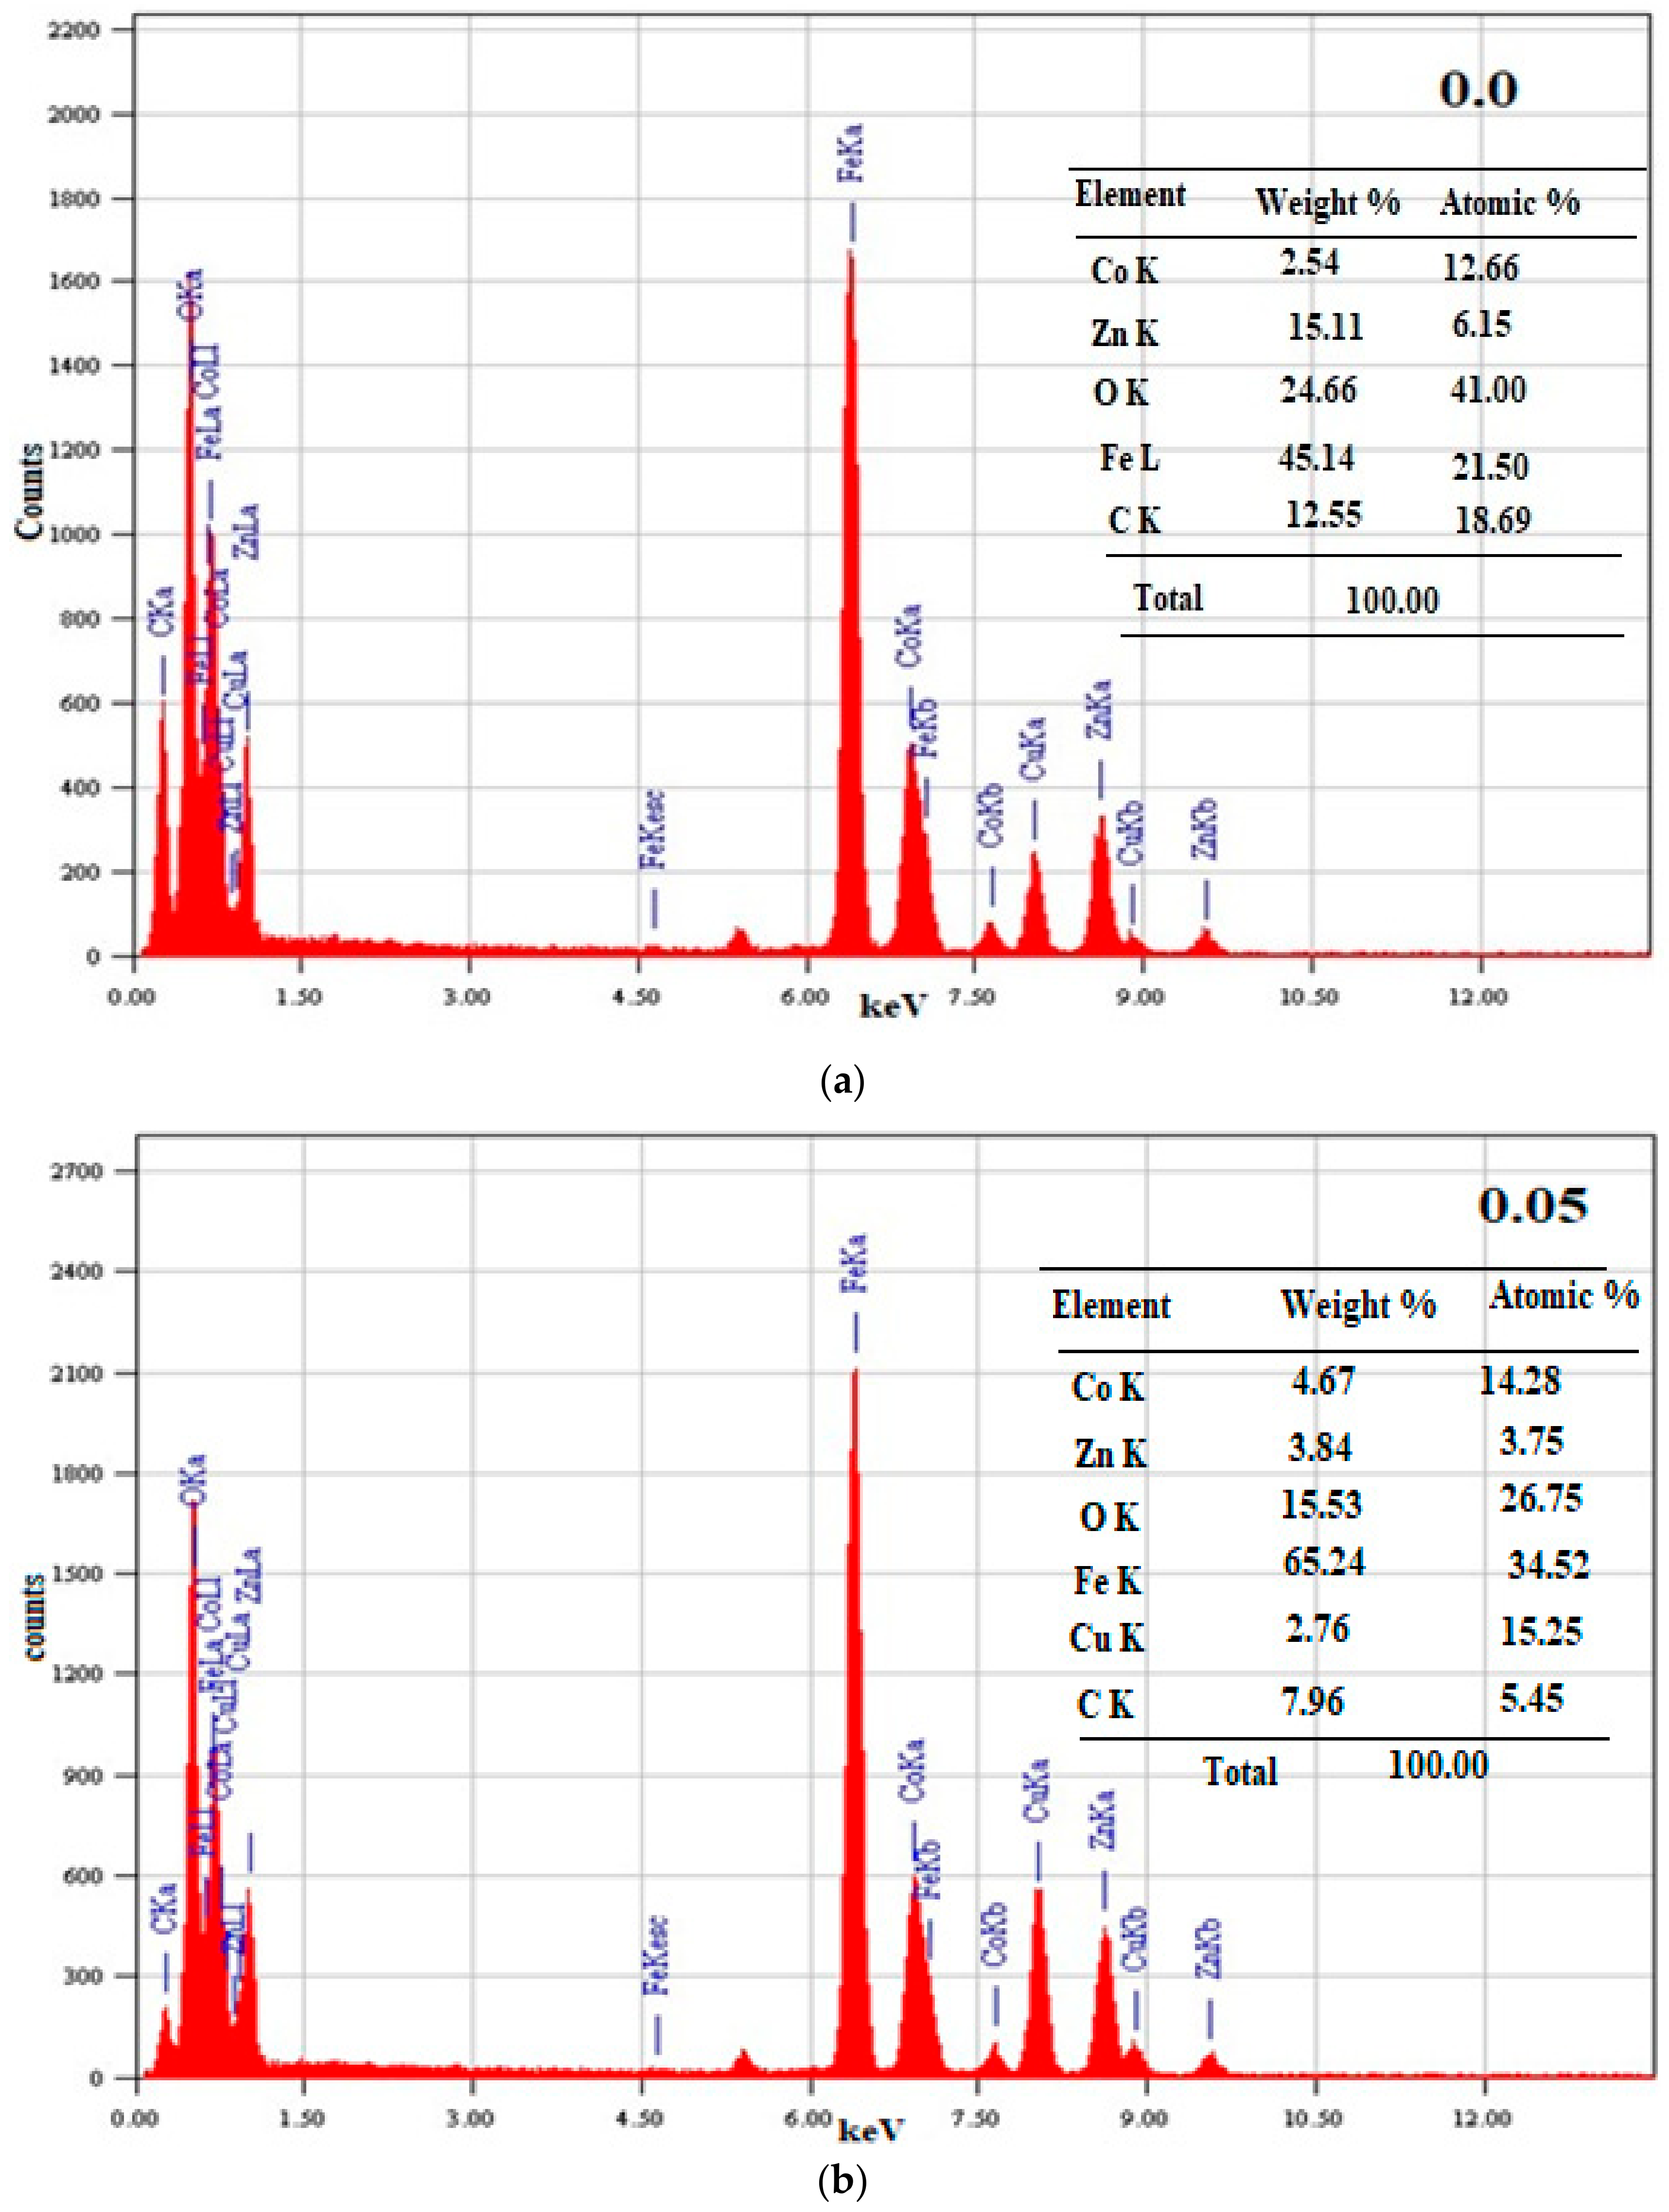
3.2. Morphology and EDX Analysis
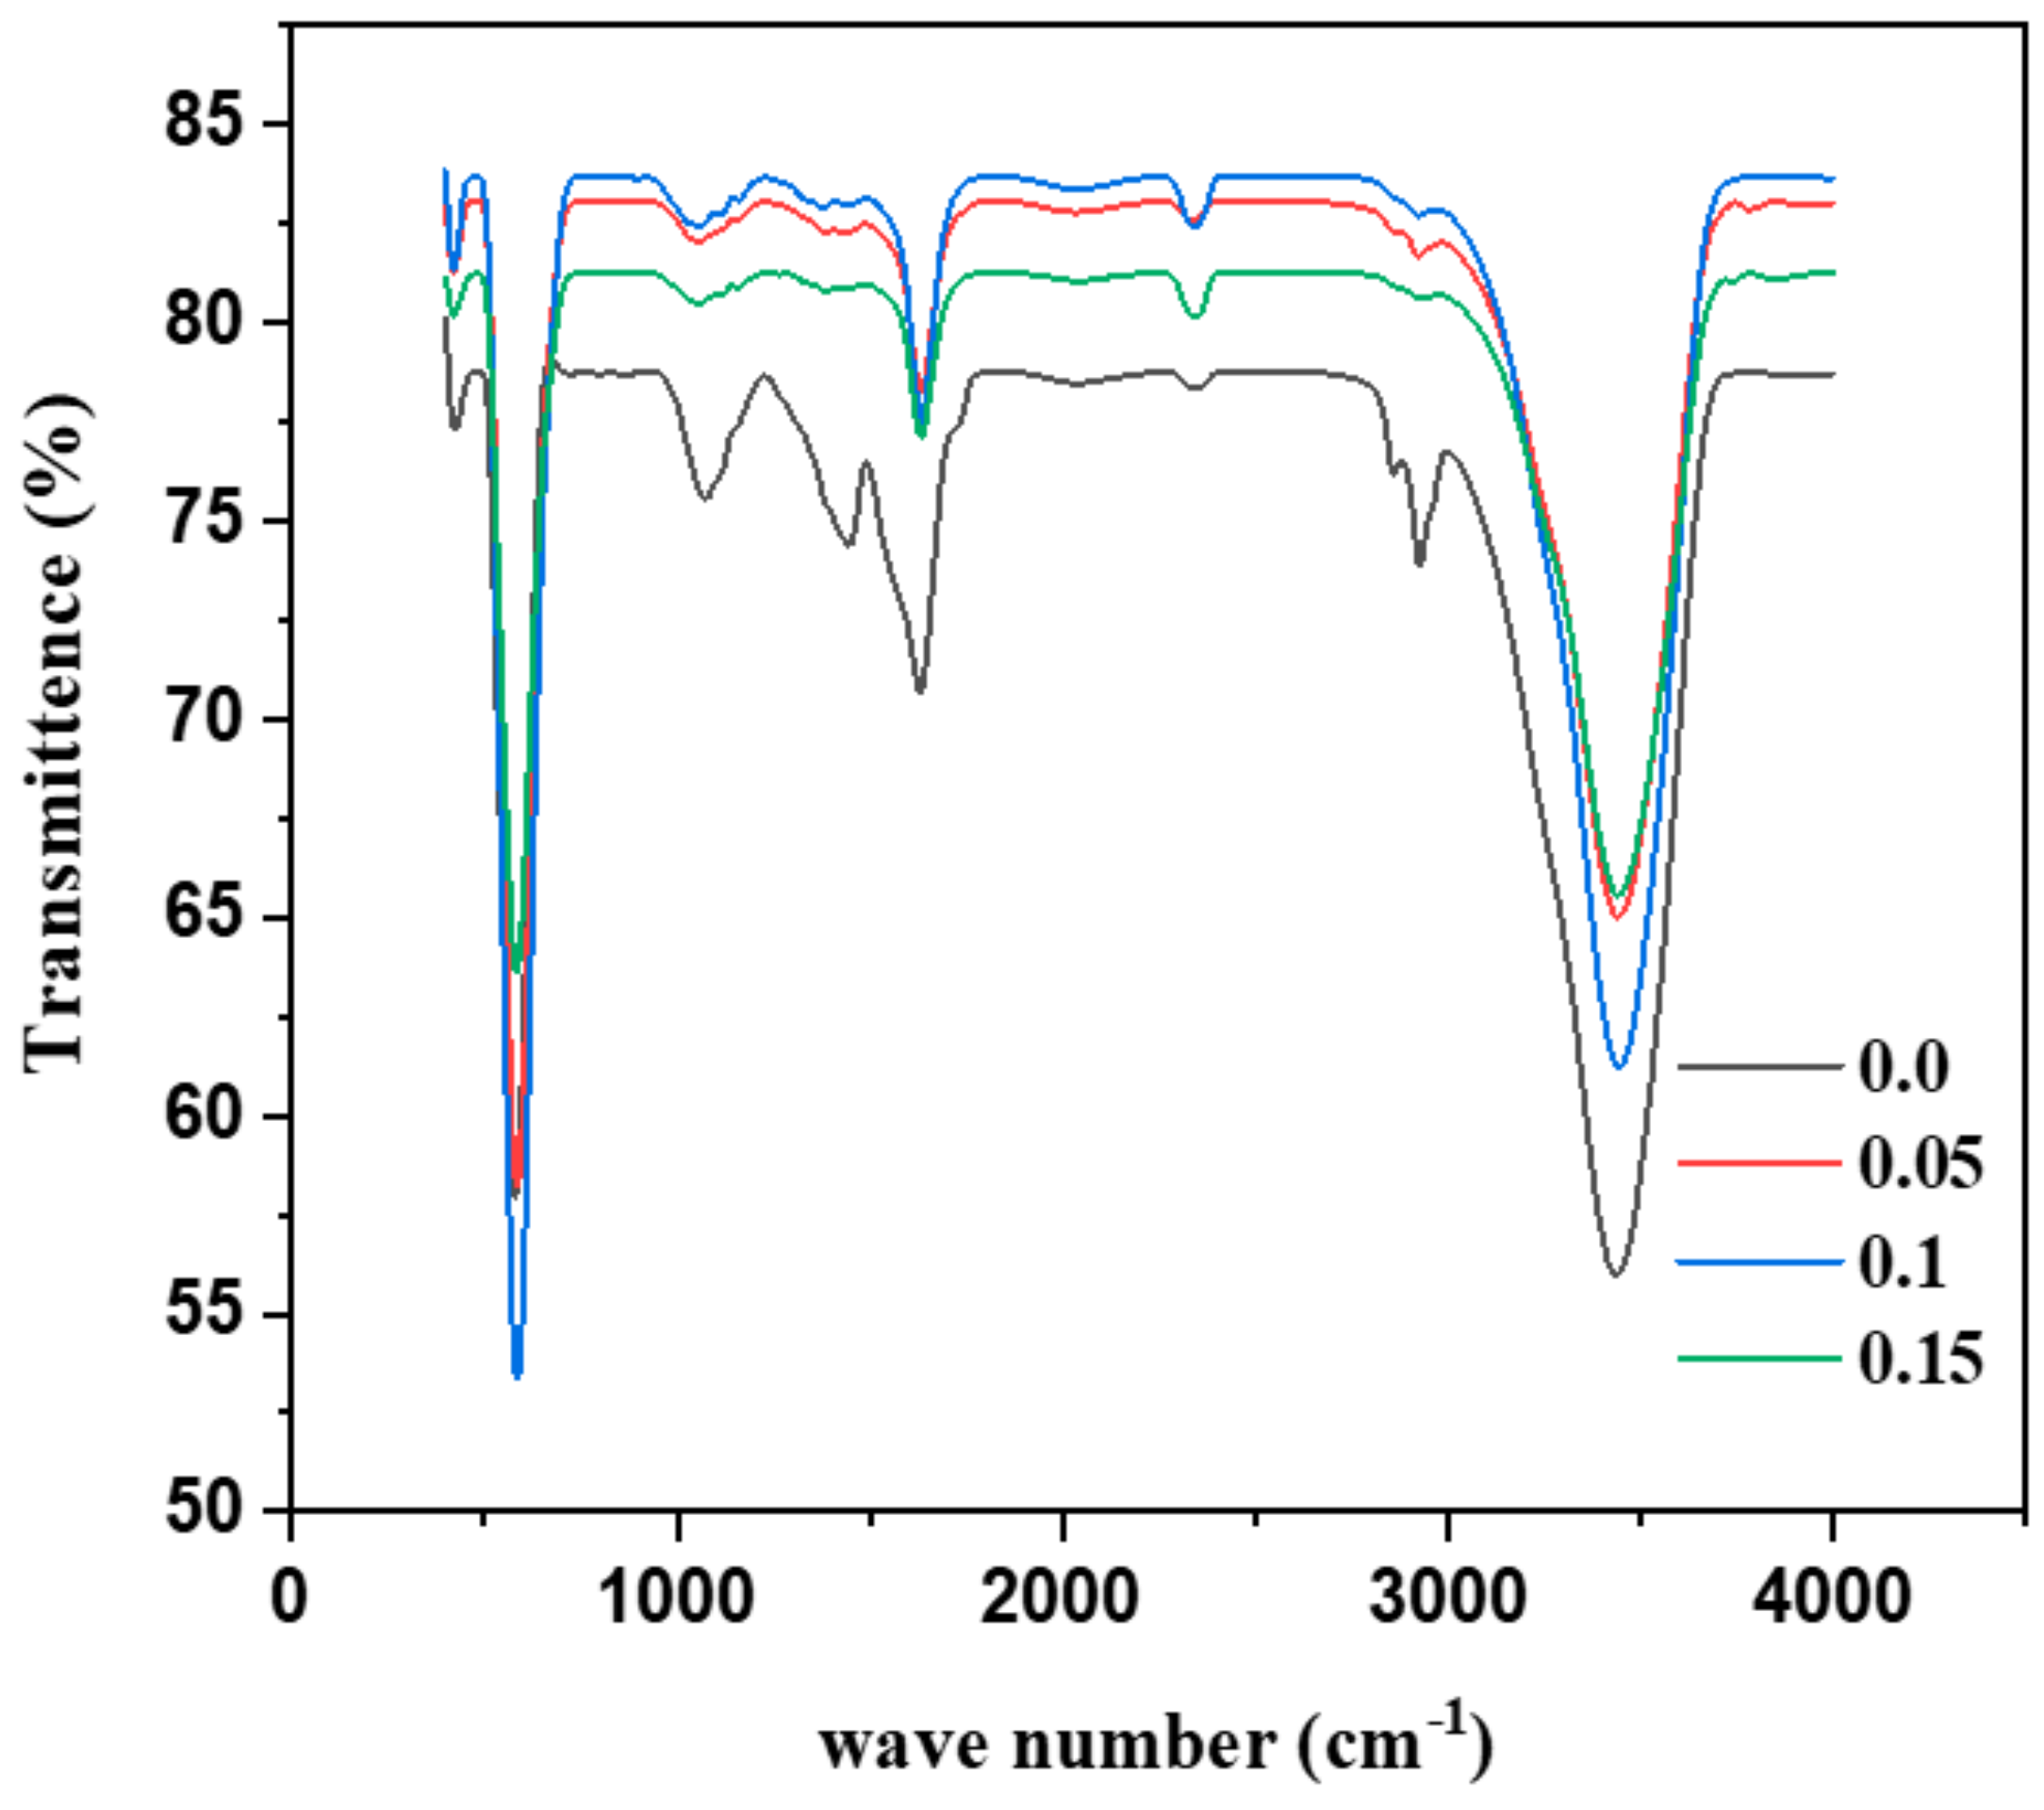
The surface and cross-sectional morphology of the samples was studied using SEM and TEM. The SEM analysis showed that the samples were almost spherical but were agglomerated. The samples possessed a high percentage of porosity. The TEM analysis also showed that the nanoparticles were almost spherical and were agglomerated. The average particle size distribution was estimated using image J software, shown in Figure 4b and Figure 5b for the compositions x = 0.0 and 0.05. It was observed that the average particle size was between 20.57 nm and 32.69 nm. The average particle size decreased with the increase in the doping concentration, which showed that doping caused a decrease in the grain size. The selective area electron diffractions presented as insets in Figure 4a and Figure 5b show dark and bright spots, which are signatures that confirm that the grown nanoparticles are highly crystalline in order.
The samples were further studied for the purity of the chemical composition through the EDX technique as shown in Figure 6a,b for the composition x = 0.0 and 0.05. The peaks showed the presence of elements, such as Zn, Fe, Co, Fe, and O, which were the materials of the elements prepared, and hence, the presence of any secondary assay in the material was ruled out. Therefore, the elemental purity of the as-prepared samples was confirmed.
The peaks corresponding to the copper in the sample, x = 0.0, is due to the copper grid used in the TEM preparation. The distinction between the dopant copper and the copper grid can be visualized clearly from the intensity of the peak in the EDX pattern. A significant amount of carbon was also noted in the EDX pattern, which is quite normal as some residual carbon elements could be possible since we used a low sintering temperature to fire the sample.

3.3. FTIR

The FTIR spectra of the Cu-doped ferrite nanoparticles were studied between the frequency range of 400–4000 cm−1, as is shown in Figure 7. Table 2 shows the transmittance frequencies observed for the samples during the measurement for the compositions. From the FTIR spectra, the formation of the various types of bonded crystals through ionic, covalent, or Van der Waals forces to the next lattice positions can be explained. The tetrahedral (A site) and octahedral (B site) positions in ferrites were occupied by metal ions for the geometrical configuration of the nearest oxygen positions. The broad frequency range between 3796–3788 cm−1 and 3377–3327 cm−1 represents the O–H stretch that corresponds to the –OH group attached to the metal oxide surface, which indicates that the water molecules were chemically adsorbed by the metal surface during the synthesis process. The vibrational modes observed in the frequency range of 580–588 cm−1 in the studied samples corresponded to Fe–O stretching at the octahedral site, while the modes present between 424 and 415 cm−1 represent the Fe–O stretching vibration at the tetrahedral site [35]. Notably, the vibrational modes at the tetrahedral site shifted towards the low-frequency region with the Cu2+ ion doping, showing the contraction of the metal–oxygen bonds. Conversely, the bands at 580 cm−1 shifted towards the relatively high-frequency side with the doping, showing the stretching of the metal–oxygen bond. The O–H in the plane and out of plane bond appears at 1626 cm−1 to 1631 cm−1, respectively. The presence of H2O absorption bands in and out of the plane and metal–oxygen bonds confirms the existence of Ni and Cu in the synthesized samples [36,37].

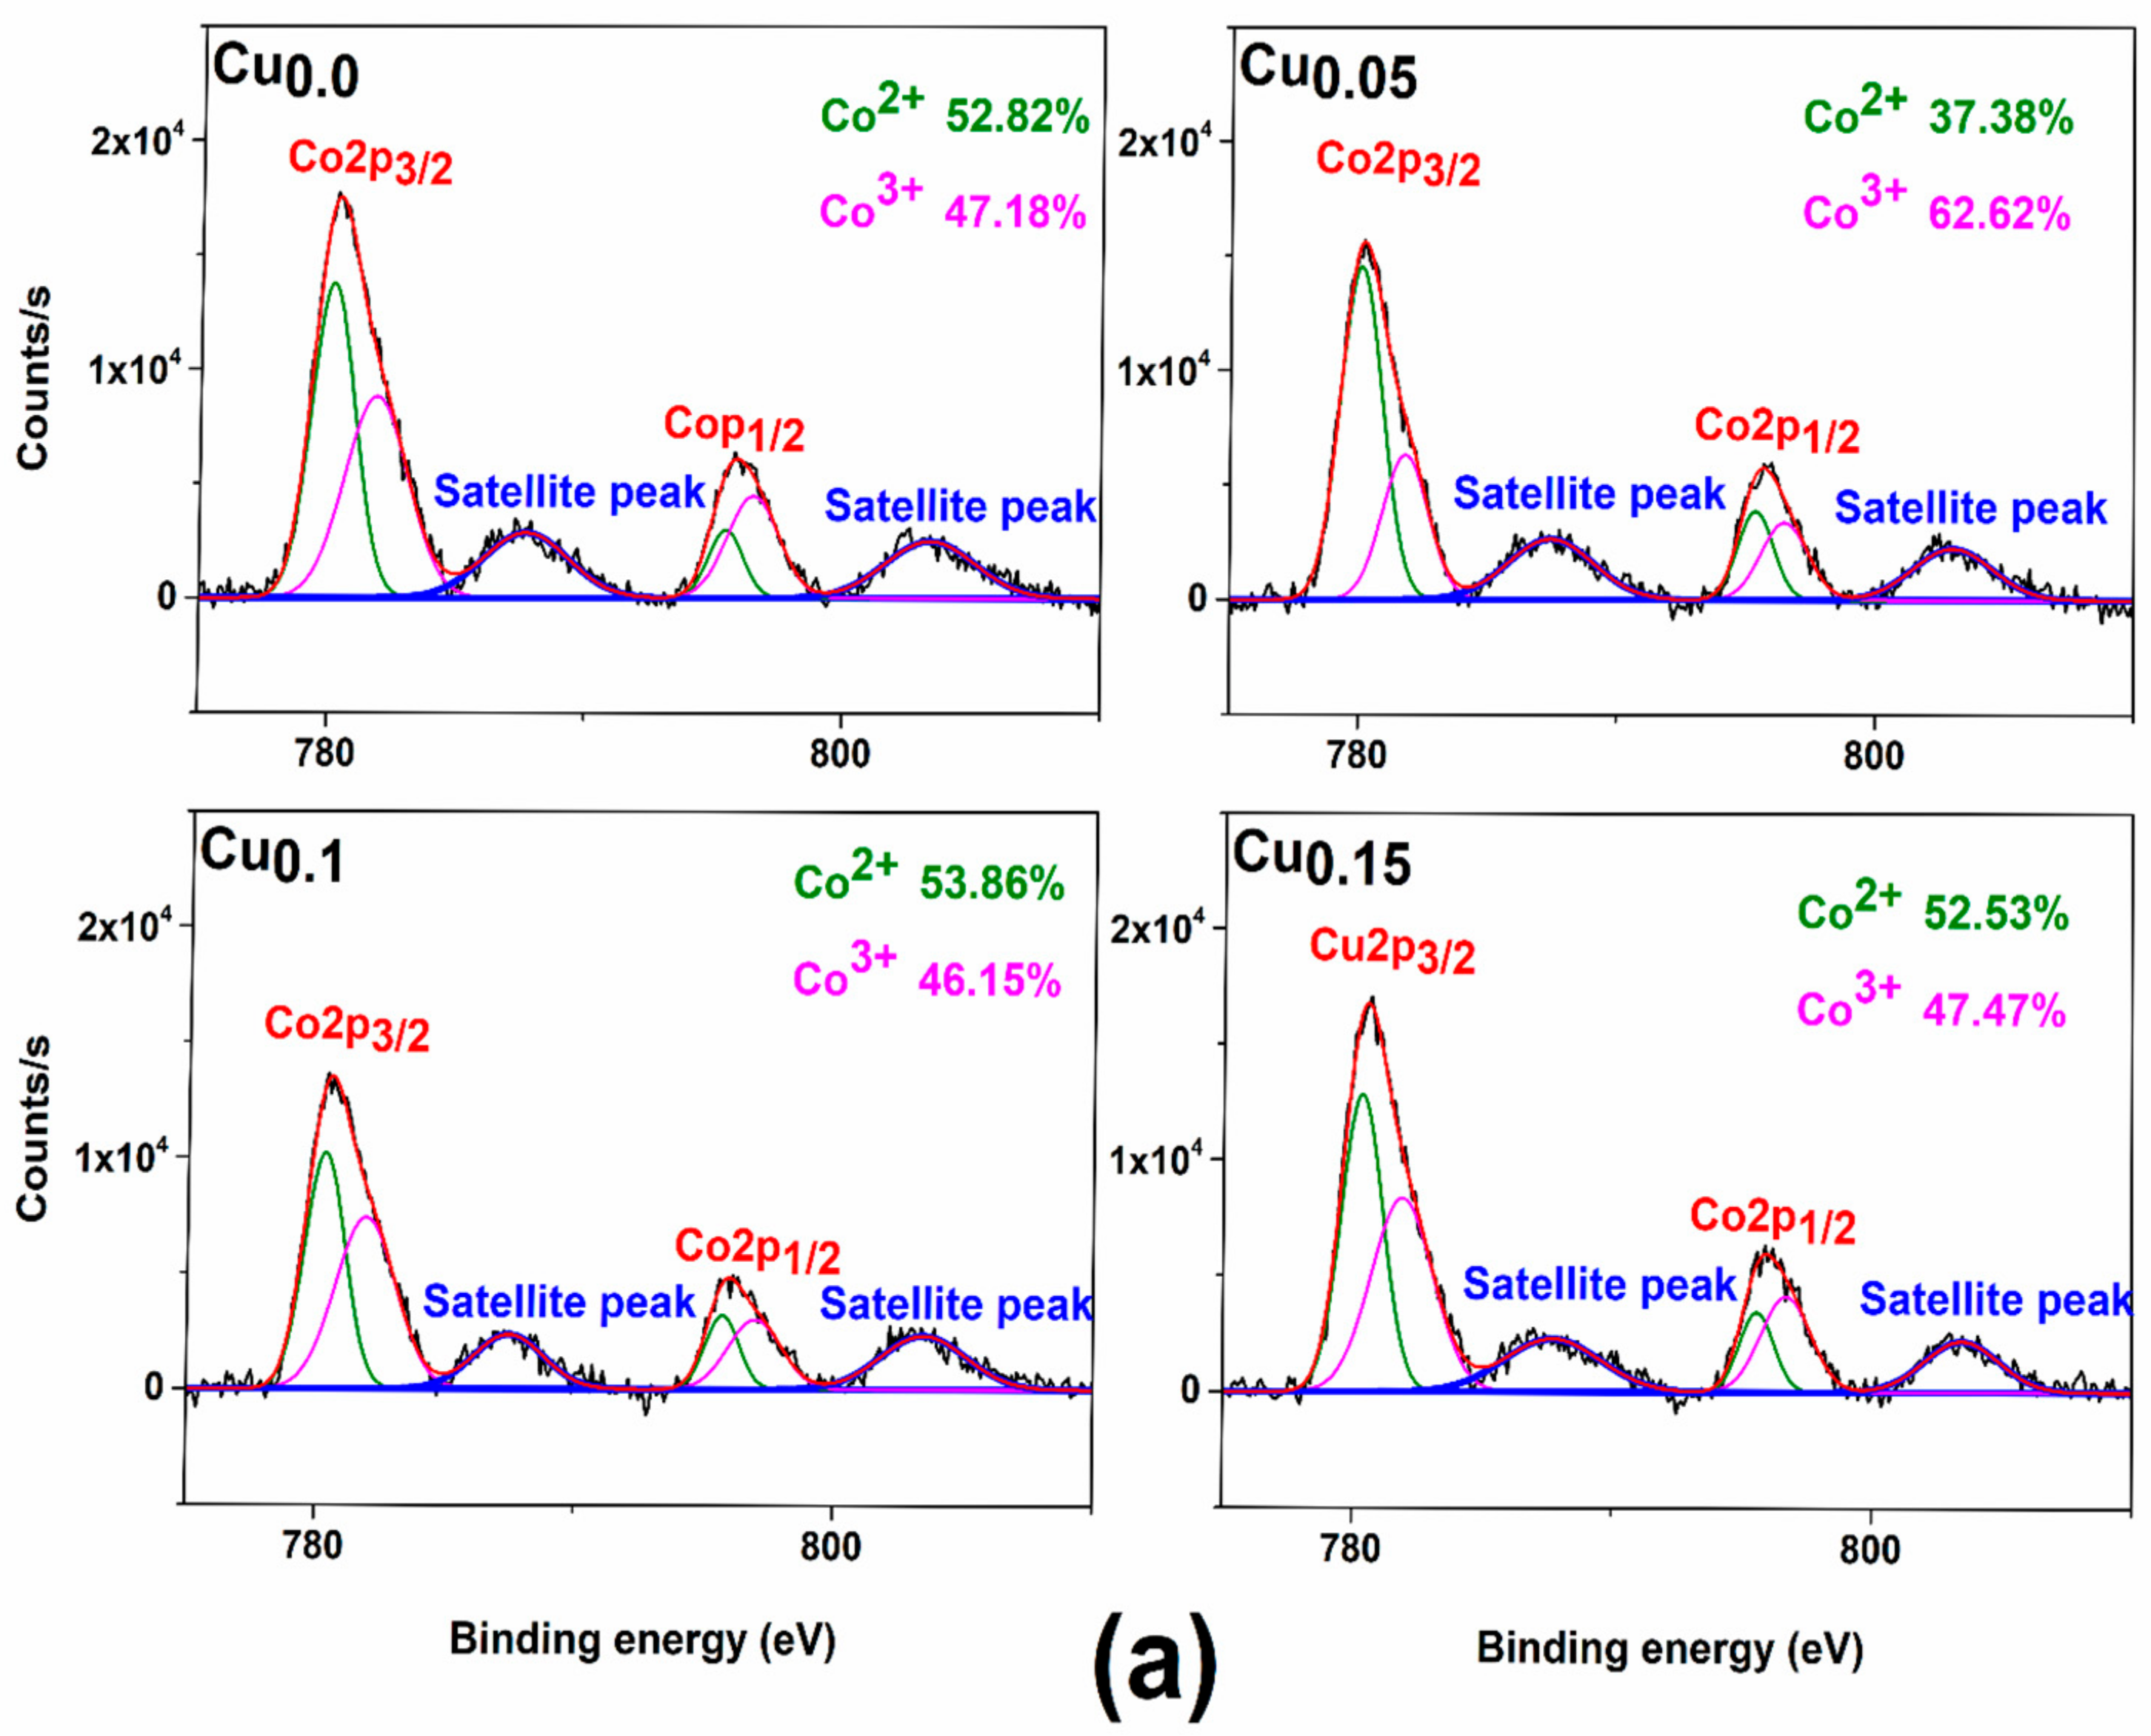
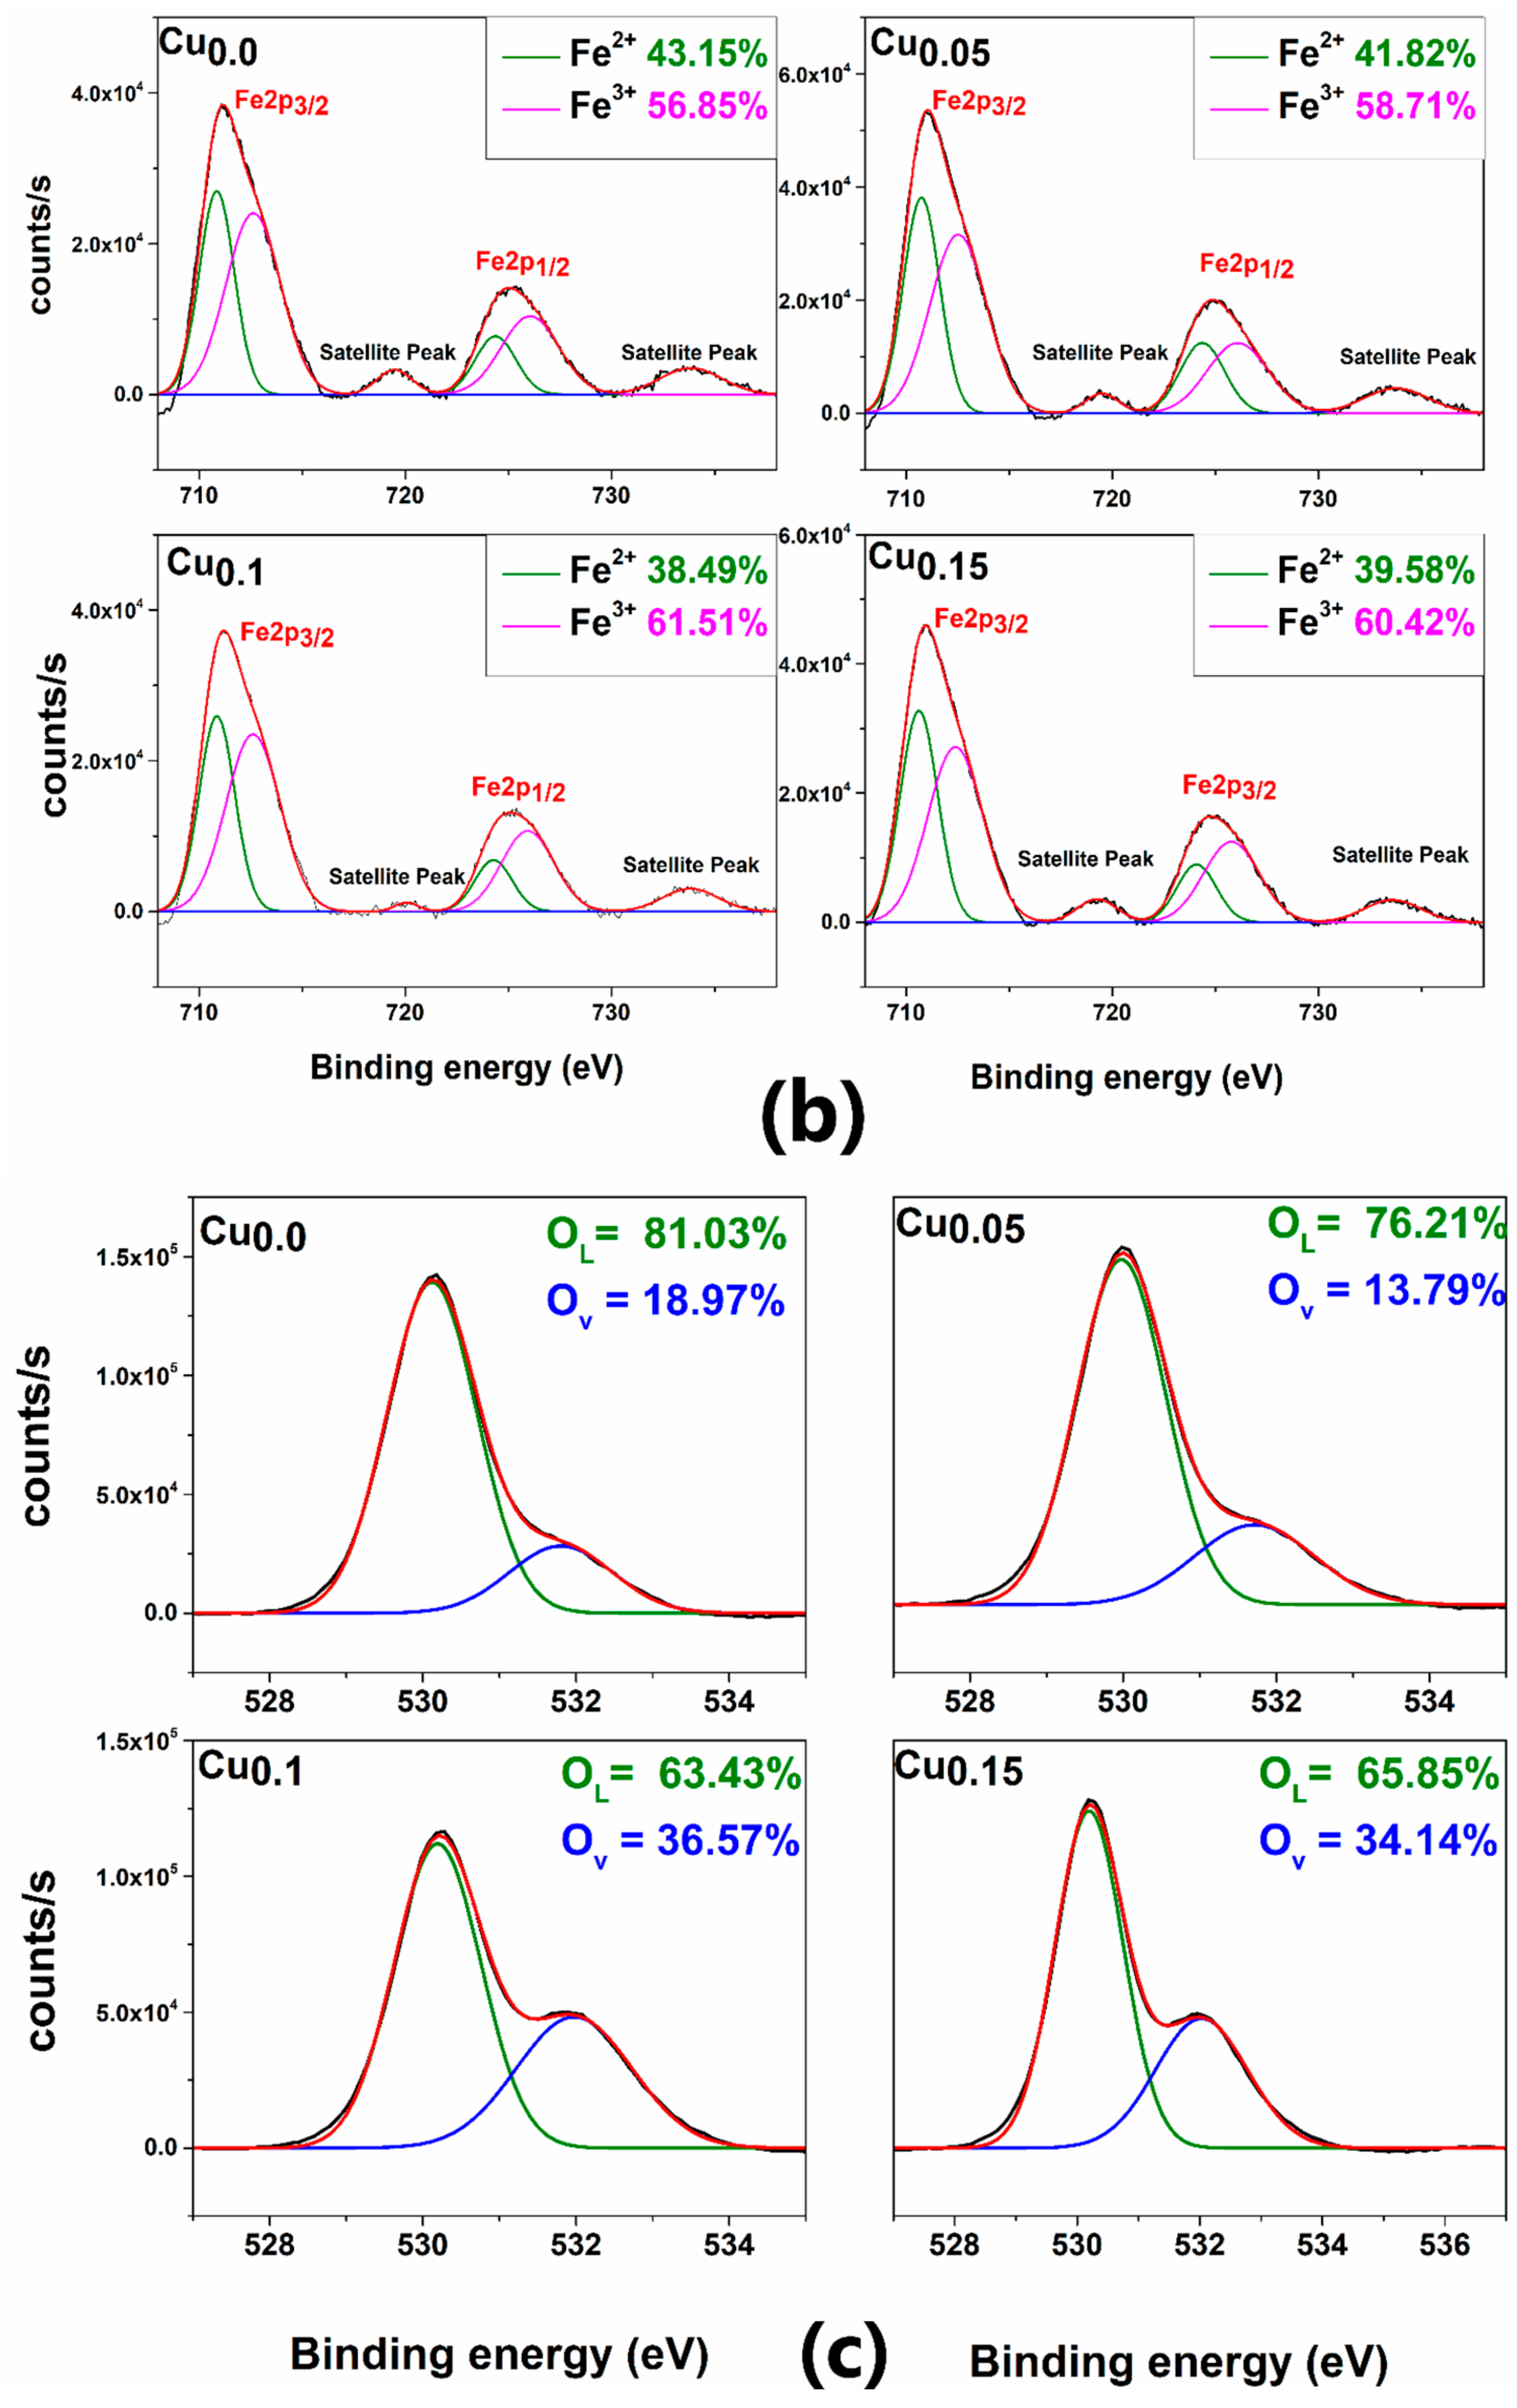
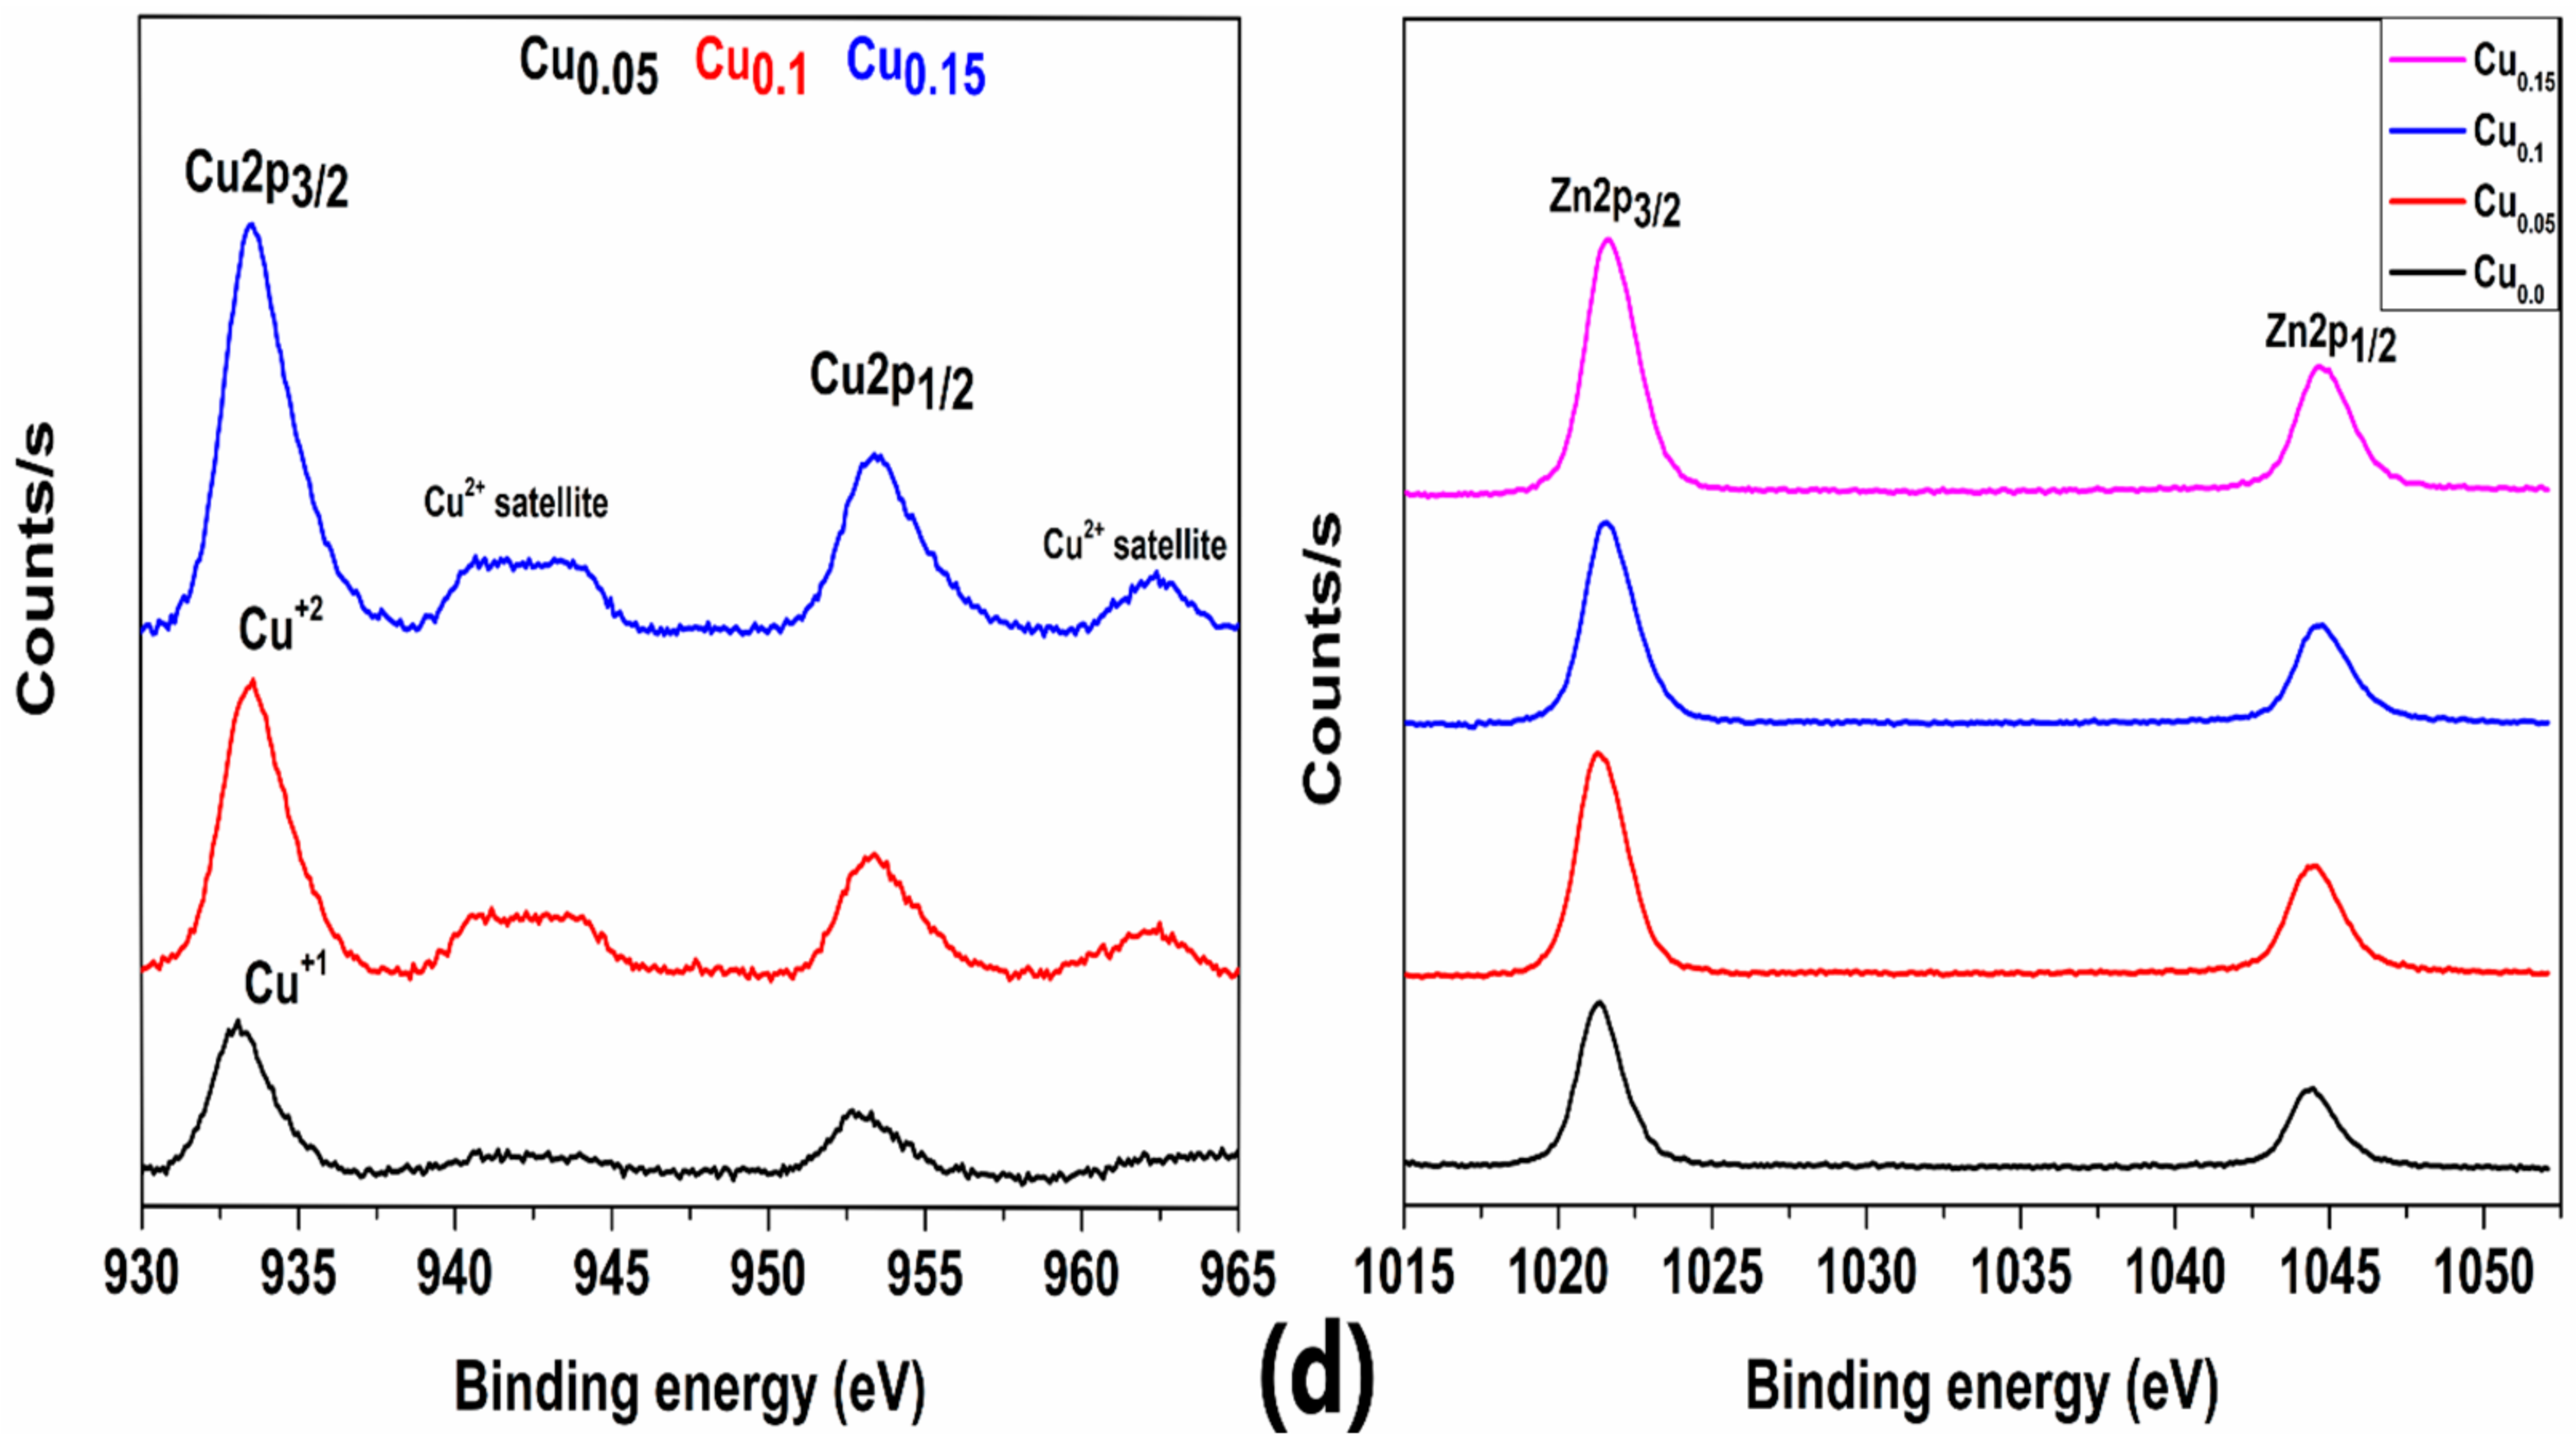
3.4. XPS and Cationic Distribution

The XPS Zn2p, Fe2p, Co2p, Cu2p, and 1Os spectra shown in Figure 8a–d reveal the presence of Co, Zn, Fe, and Cu in the present samples, with their oxidation states and oxygen vacancies created because of the introduction of copper ions in the lattice of Co–Zn ferrite. The Co 2p spectra given in Figure 8a show two peaks at ~780 eV and ~795 eV associated with Co2p3/2 and Co2p1/2 orbitals, respectively, with the presence of two satellite peaks, which reveal that cobalt exists in a Co2+ oxidation state (ionic radii, r = 0.58Å) with binding energy peaks at approximately 781 eV and 796 eV, respectively. The Co2+ ions have a strong site preference for octahedral sites but some of them occupy the tetrahedral sites in cobalt–zinc ferrite, as reported in the literature [38]. The peaks with binding energy around 780 eV and 795 eV, respectively, are attributed to Co3+ oxidation states that have strong octahedral site preference and would replace Fe3+ ions at the octahedral site (ionic radii, r = 0.61Å) [39,40]. The deconvoluted peaks’ areas under 780 eV and 781 eV correspond to the distribution of Co2+ ions at tetrahedral and octahedral sites, respectively, which determines the cationic distribution of cobalt ions in the lattice, similarly for other cations [32]. In Zn 2p spectra, the peaks at binding energy around 1021 eV and 1044 eV, respectively, belong to Zn 2p3/2 and Zn 2p1/2, which indicates the presence of zinc in the Zn2+ state, which preferably occupies tetrahedral sites (ionic radii, r = 0.60Å) in all the samples, as observed in Figure 8d [41]. The Fe 2p spectra shown in Figure 8b show the presence of iron in Fe3+ (ionic radii, r = 0.64Å) and Fe2+ oxidation states (ionic radii, r = 0.63Å) [40,42,43]. The Cu 2p spectra shown in Figure 8d show the presence of copper in the Cu1+ oxidation state (ionic radii, r = 0.60Å); as the copper concentration increased, it was observed that it existed in the Cu2+ oxidation state (ionic radii, r = 0.73Å), as confirmed by the strong Cu2+ satellite peaks [44]. Figure 8c shows that the oxygen vacancies decreased when x = 0.05, which was possibly due to the incorporation of Cu1+ ions, and they increased with the increase in the copper concentration, which may be due to the introduction of divalent Cu ions at the tetrahedral site. The oxygen vacancies were generated to maintain charge neutrality. This was due to the substitution of Fe3+ ions with Cu2+ ions with relatively low oxidation states [45,46]. Based on the oxidation states and their corresponding ionic radii, the cationic distribution was determined for all the samples.
(I)
Co 0.5 Zn0.5Fe2O4 = [Zn2+ 0.5Co2+0.15Fe3+0.86]T[Co2+0.11Co3+0.24Fe2+0.86Fe3+0.46]O
(II)
Cu0.05Co0.5Zn0.5Fe1.95O4 = [Cu1+0.05Zn2+0.5Co2+0.7Fe3+0.65]T [Co2+0.12Co3+0.31Fe2+0.8Fe3+0.5]O
(III)
Cu0.1Co0.5Zn0.5Fe1.90O4 = [Cu2+0.1Zn2+0.5Co2+0.15Fe3+0.66]T [Co2+0.12Co3+0.33Fe2+0.74Fe3+0.5]O
(IV)
Cu0.15Co0.5Zn0.5Fe1.90O4 = [Cu2+0.15Zn2+0.5Co2+0.16Fe3+0.63]T [Co2+0.13Co3+0.33Fe2+0.74Fe3+0.63]O
From the observed cationic distribution, it was concluded that Zn2+ occupied only the tetrahedral site because of its comparable ionic radius and charge. However, Co and Fe existed in 2+ and 3+ oxidation states and were preferably distributed among both A and B sites. When x = 0.05, the copper ions existed in the Cu1+ oxidation state with an ionic radius r = 0.60Å and occupied the A site, but at relatively high concentrations, copper existed in 2+ oxidation state with ionic radius r = 0.55Å and occupied the A site.

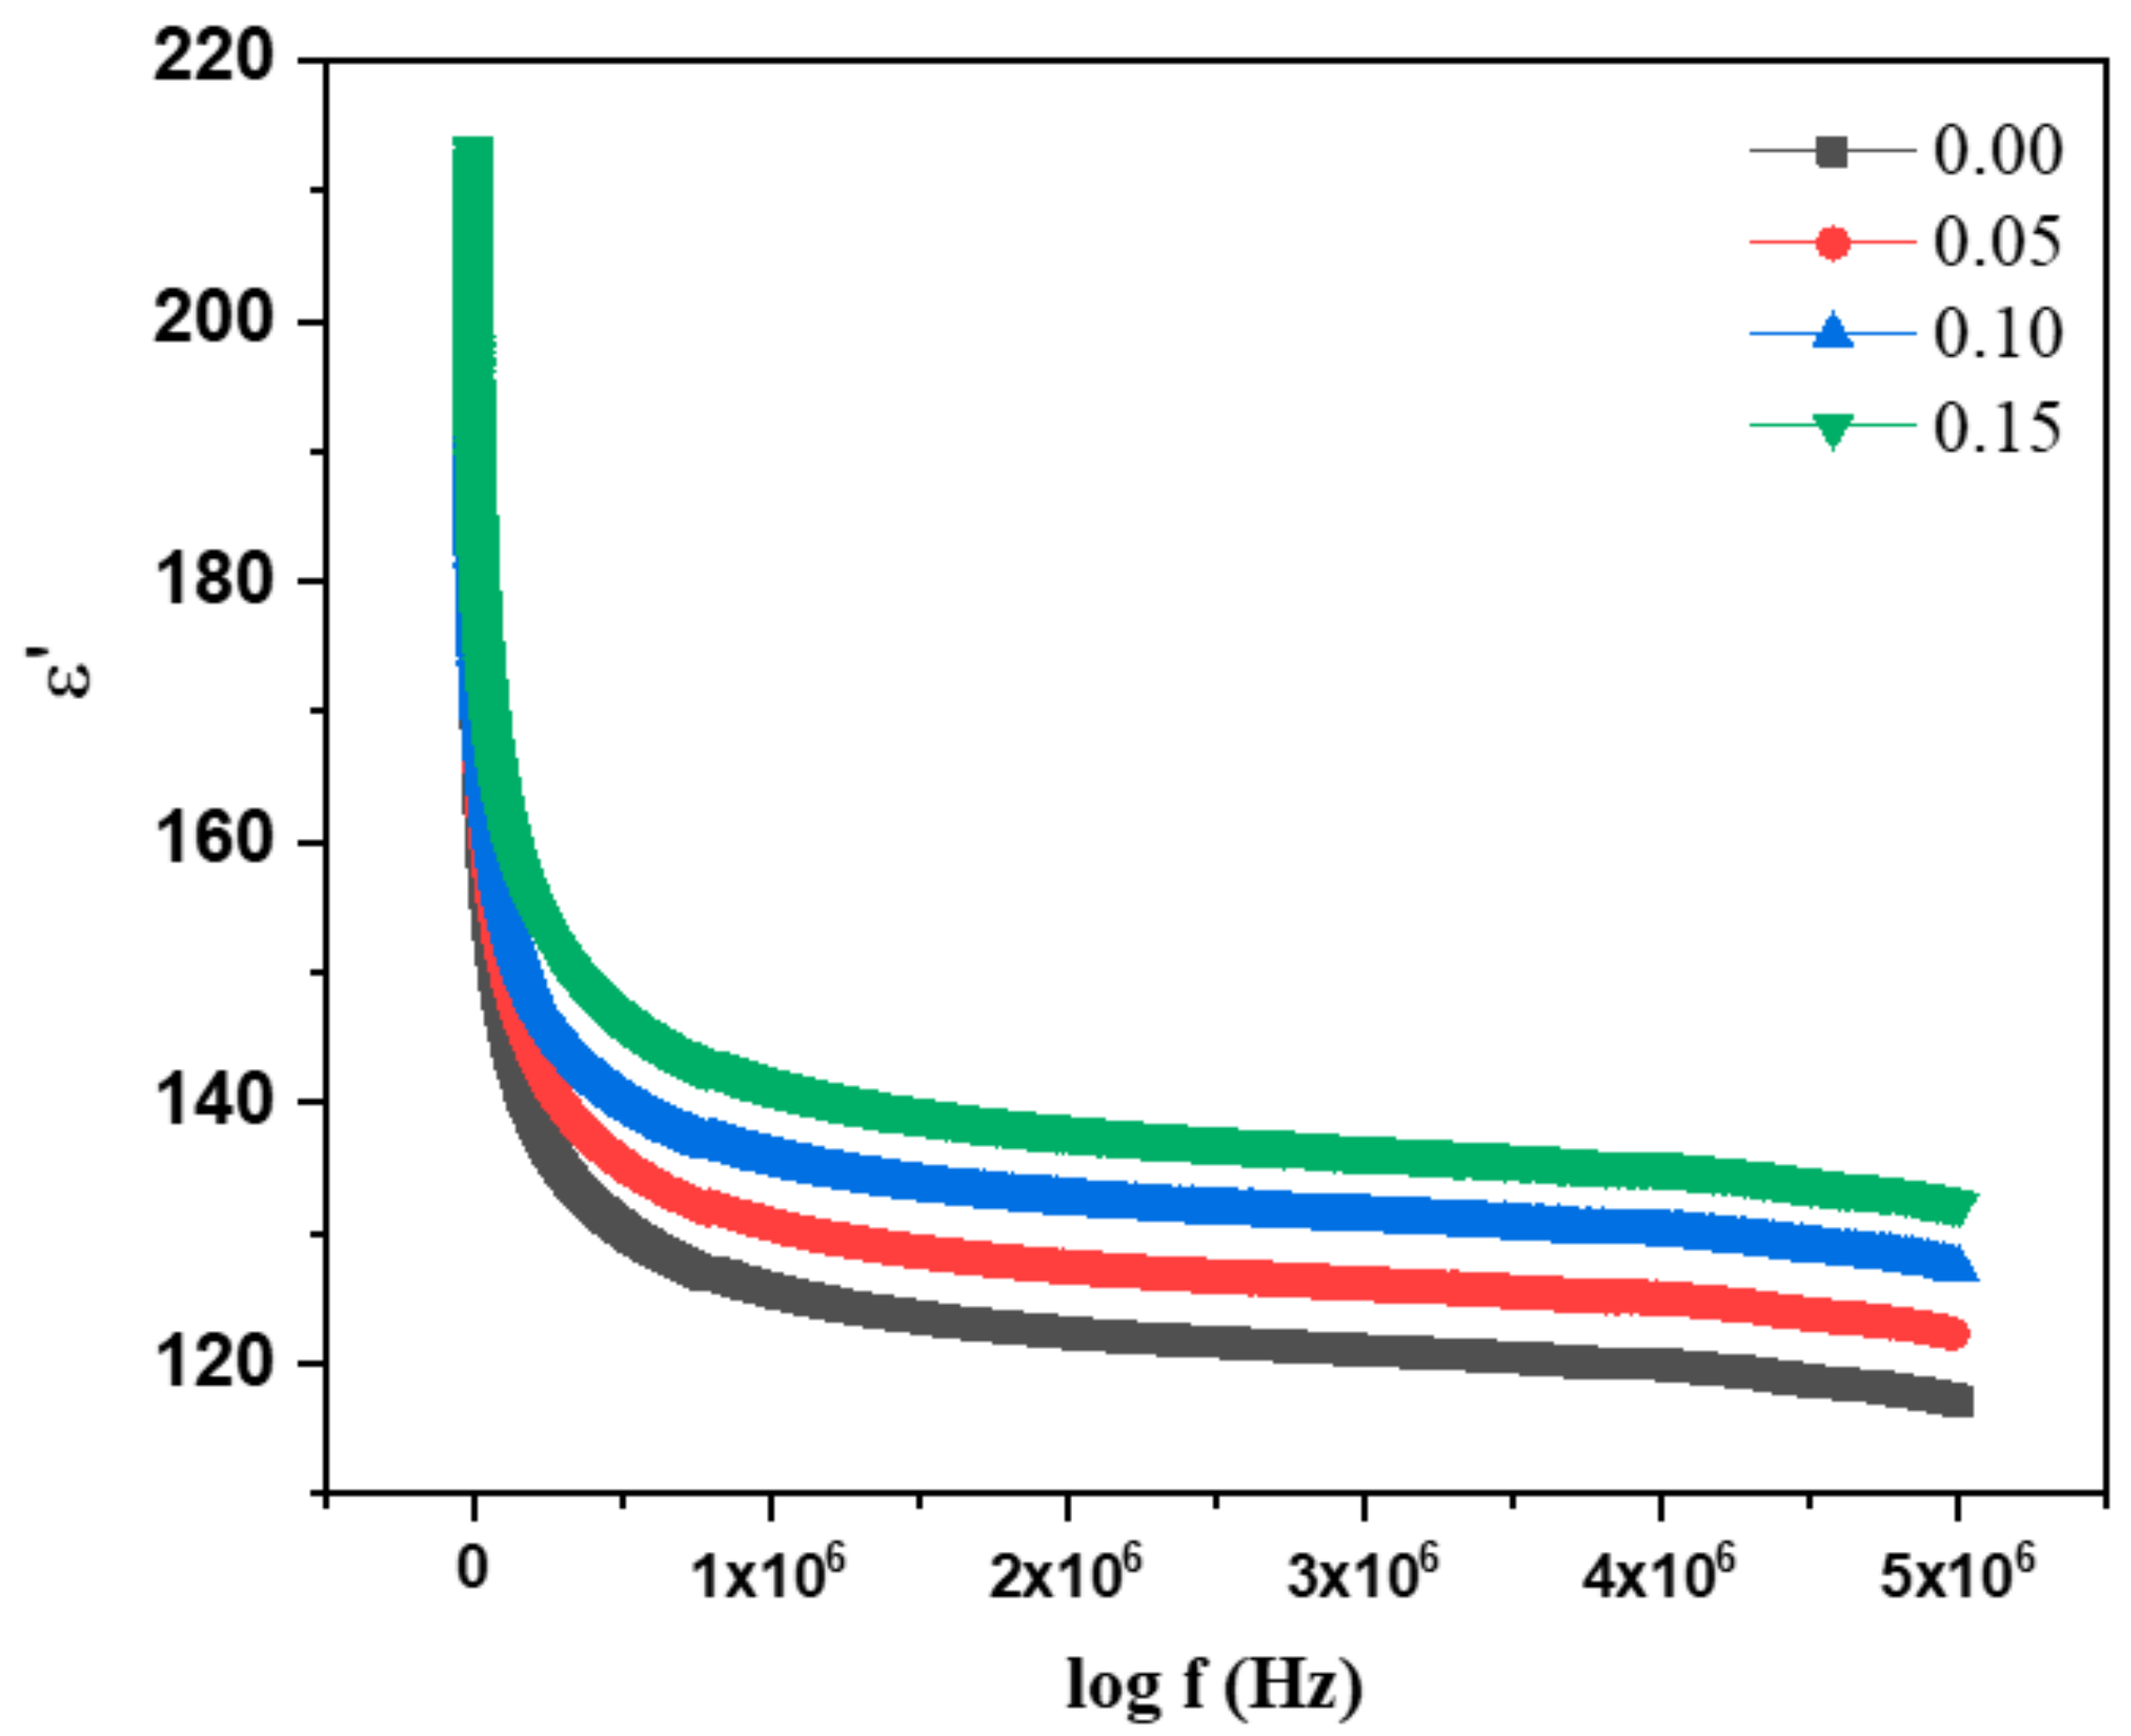
3.5. Dielectric Measurement

The samples were studied for the dielectric dispersion in the frequency range from 100 Hz to 5 MHz at room temperature. Figure 9 shows the real dielectric constant ( ε ) of the prepared Cu-doped Co–Zn ferrite nanoparticles versus the frequency of the applied field. The dielectric dispersion showed the normal Maxwell–Wagner type of interfacial polarization response, where it decreases with the increase in the frequency of the applied field [47]. The graph shows that the dielectric constant decreased sharply up to 5 kHz, and thereafter, it decreased very slowly and approached saturation or showed an almost frequency-independent response. This is because, initially, the domains in a dielectric material without an externally applied field were randomly oriented and they were oriented along the direction of the field once it was applied.
In the beginning, the domains aligned themselves along the direction of the applied field and they showed perfect switching response; however, as the field frequency increased further, the domains could not cope up with the frequency changes of the applied field, and hence, they lagged, which was seen above 5 kHz in the study. Furthermore, the dielectric constant increased with the increase in Cu doping, showing that the hopping of charges between the charge carriers, which was initially between Fe3+ and Fe2+, was further supported by the hopping of charges between the Cu1+ and Cu2+ state [48].

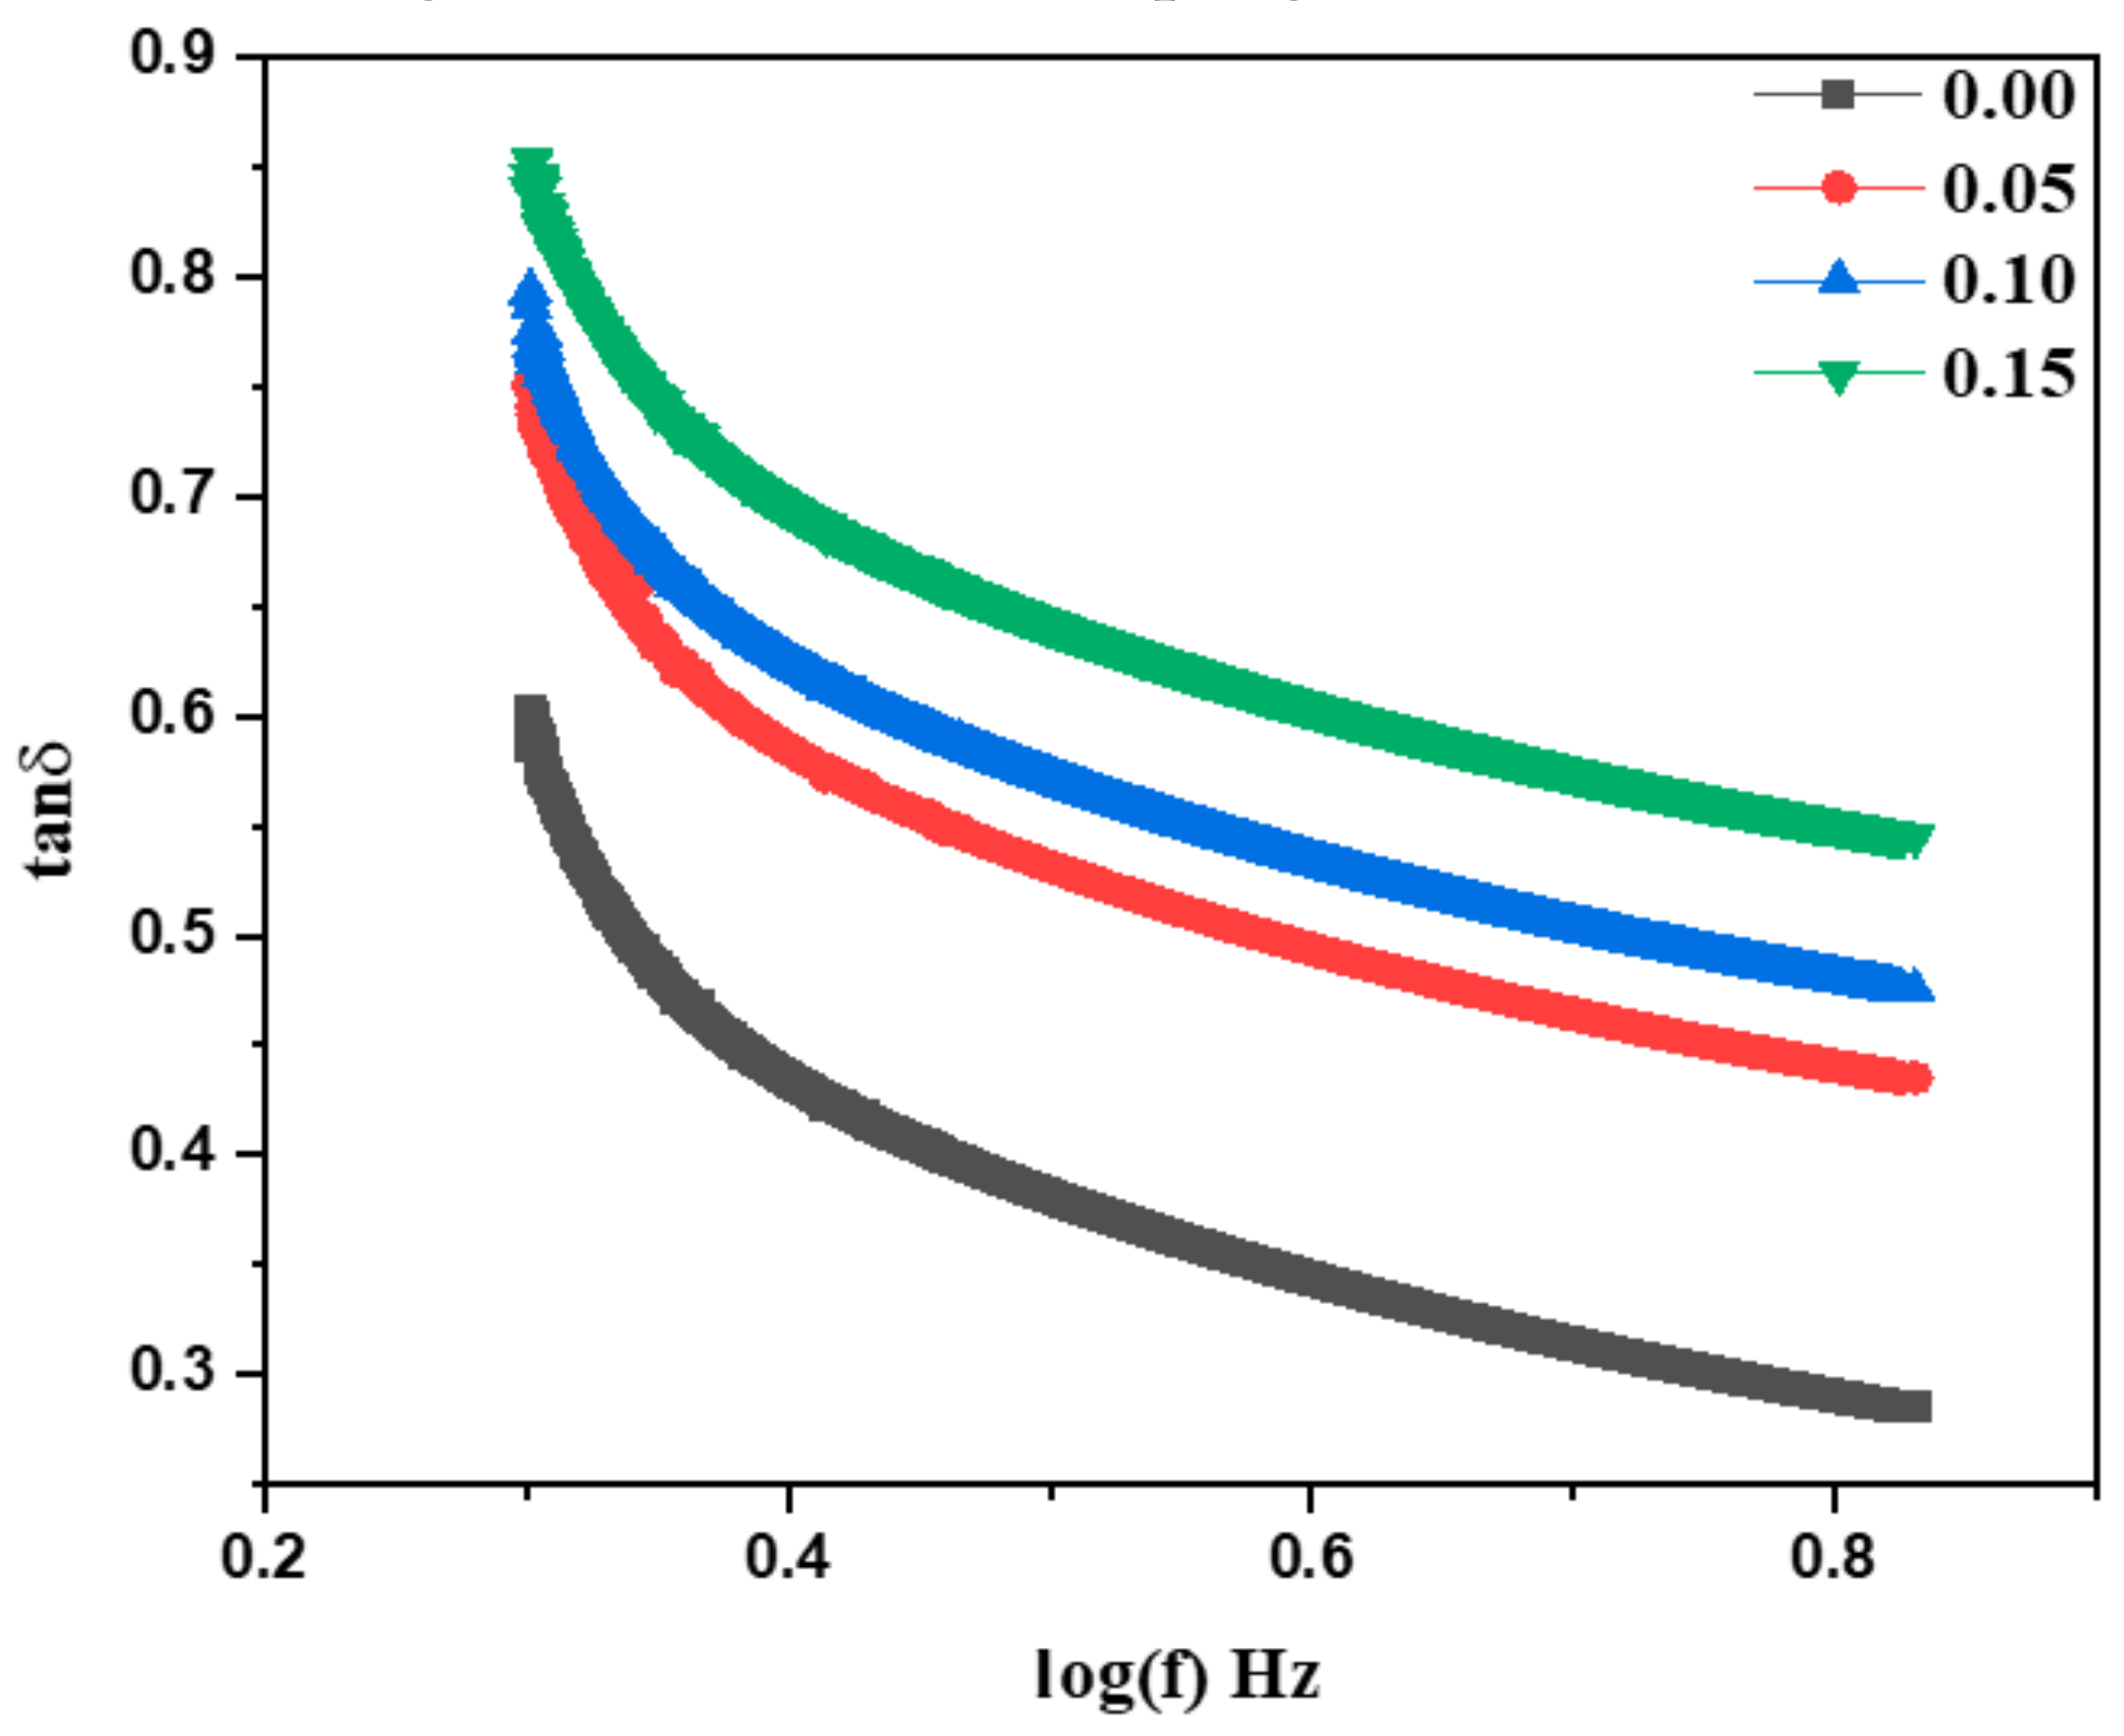
3.6. Dielectric Loss (tanδ)

The dielectric loss is an important measurement to help determine the feasibility of any material for electrical applications, especially in capacitor materials or bridge circuits. A material with a dielectric loss less than unity is considered the best material for any electronic application, especially in MLIC technology. The dielectric loss of the copper-doped Co–Zn nanoparticles was studied in the frequency range from 100 Hz to 5 MHz and is shown in Figure 10. The dielectric loss showed a normal response for the studied applied field frequency, where it decreased with the increase in the frequency of the field. The dielectric loss was notably less than unity, and hence, this showed that the prepared material is good for high resistance applications and the fabrication of the MLIC chips [20]. The dielectric loss was observed to increase with the increase in Cu concentration, and it was the highest for the 15% doping.

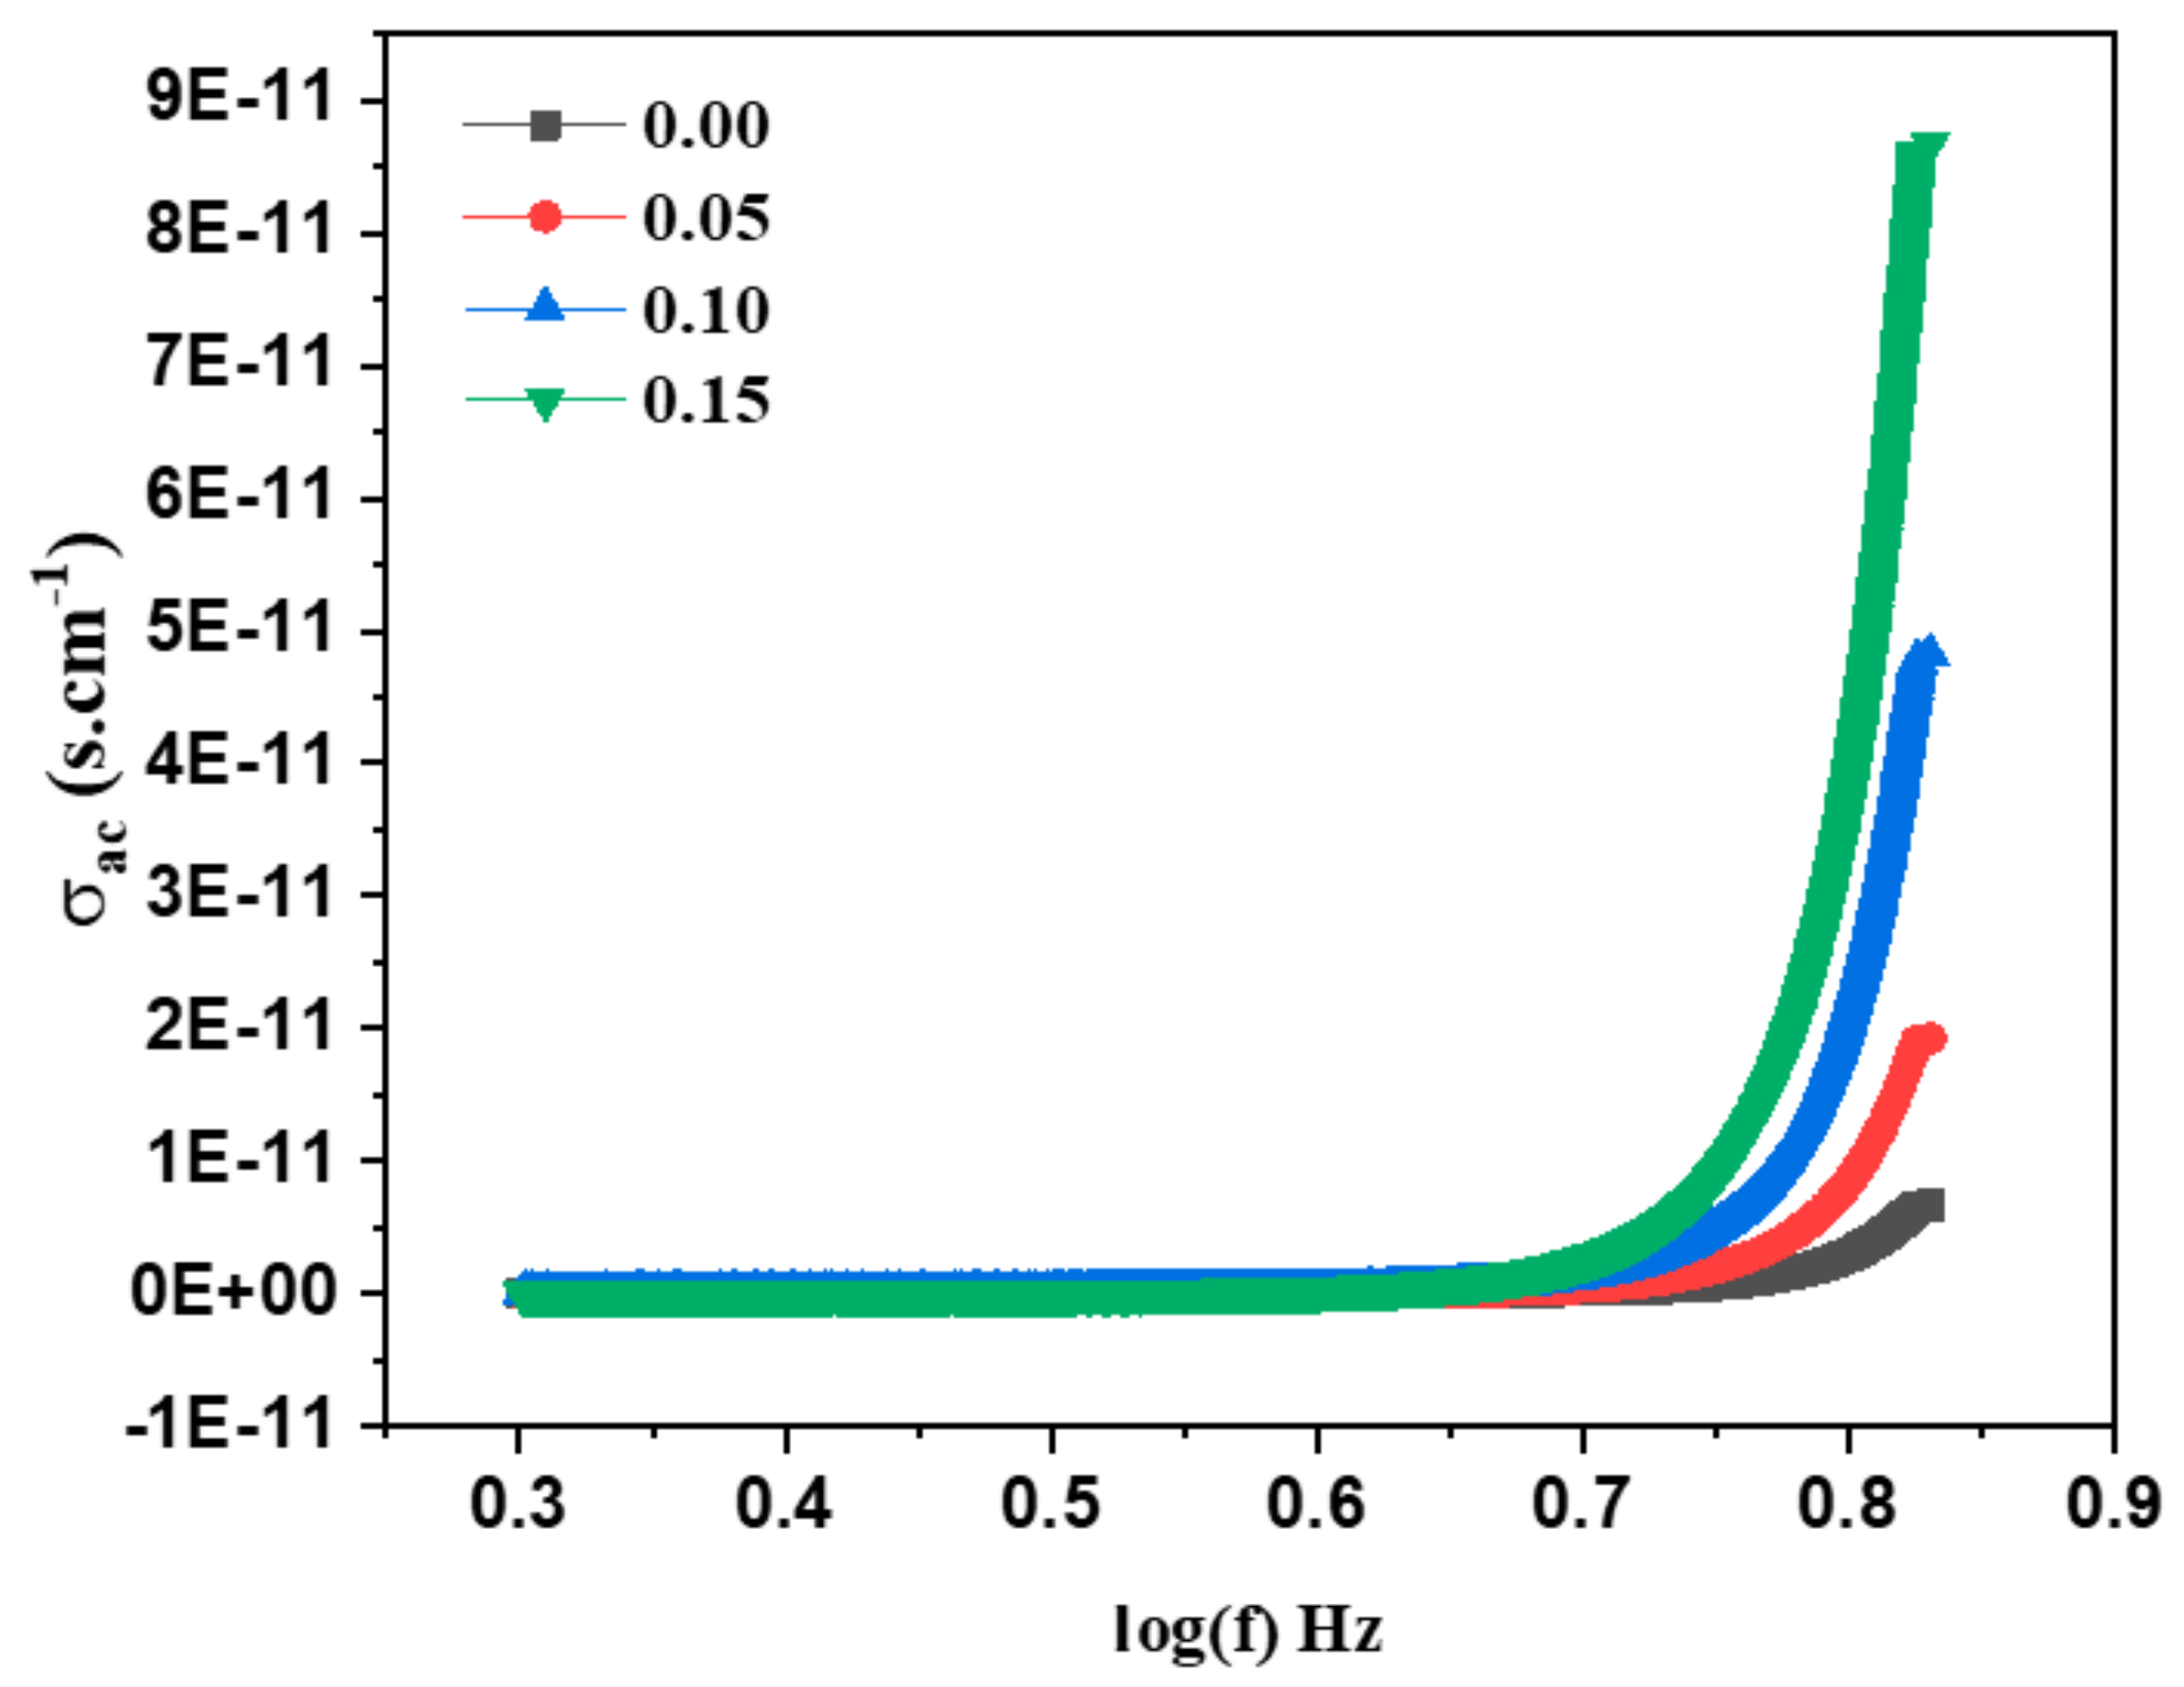
3.7. AC Conductivity (σac)

The AC conductivities of the as-grown copper substituted Co–Zn nanoparticles were studied in the frequency range of 100 Hz to 5 MHz at room temperature, as shown in Figure 11. The conductivity response with frequency shows the normal behavior, where it increases slowly in the low-frequency region and sharply in the high-frequency region. This can be explained with the hopping model of charges, where the hopping of charges between the charge carriers Fe3+ and Fe2+ increases with increasing frequency [49]. The hopping of charge between two Fe states is n-type while an additional type of hopping called p-type results due to the Cu doping between the two charge states of Cu2+ and Cu1+, which also contributes to the increase in conductivity of the samples and is seen to increase with an increasing copper concentration.

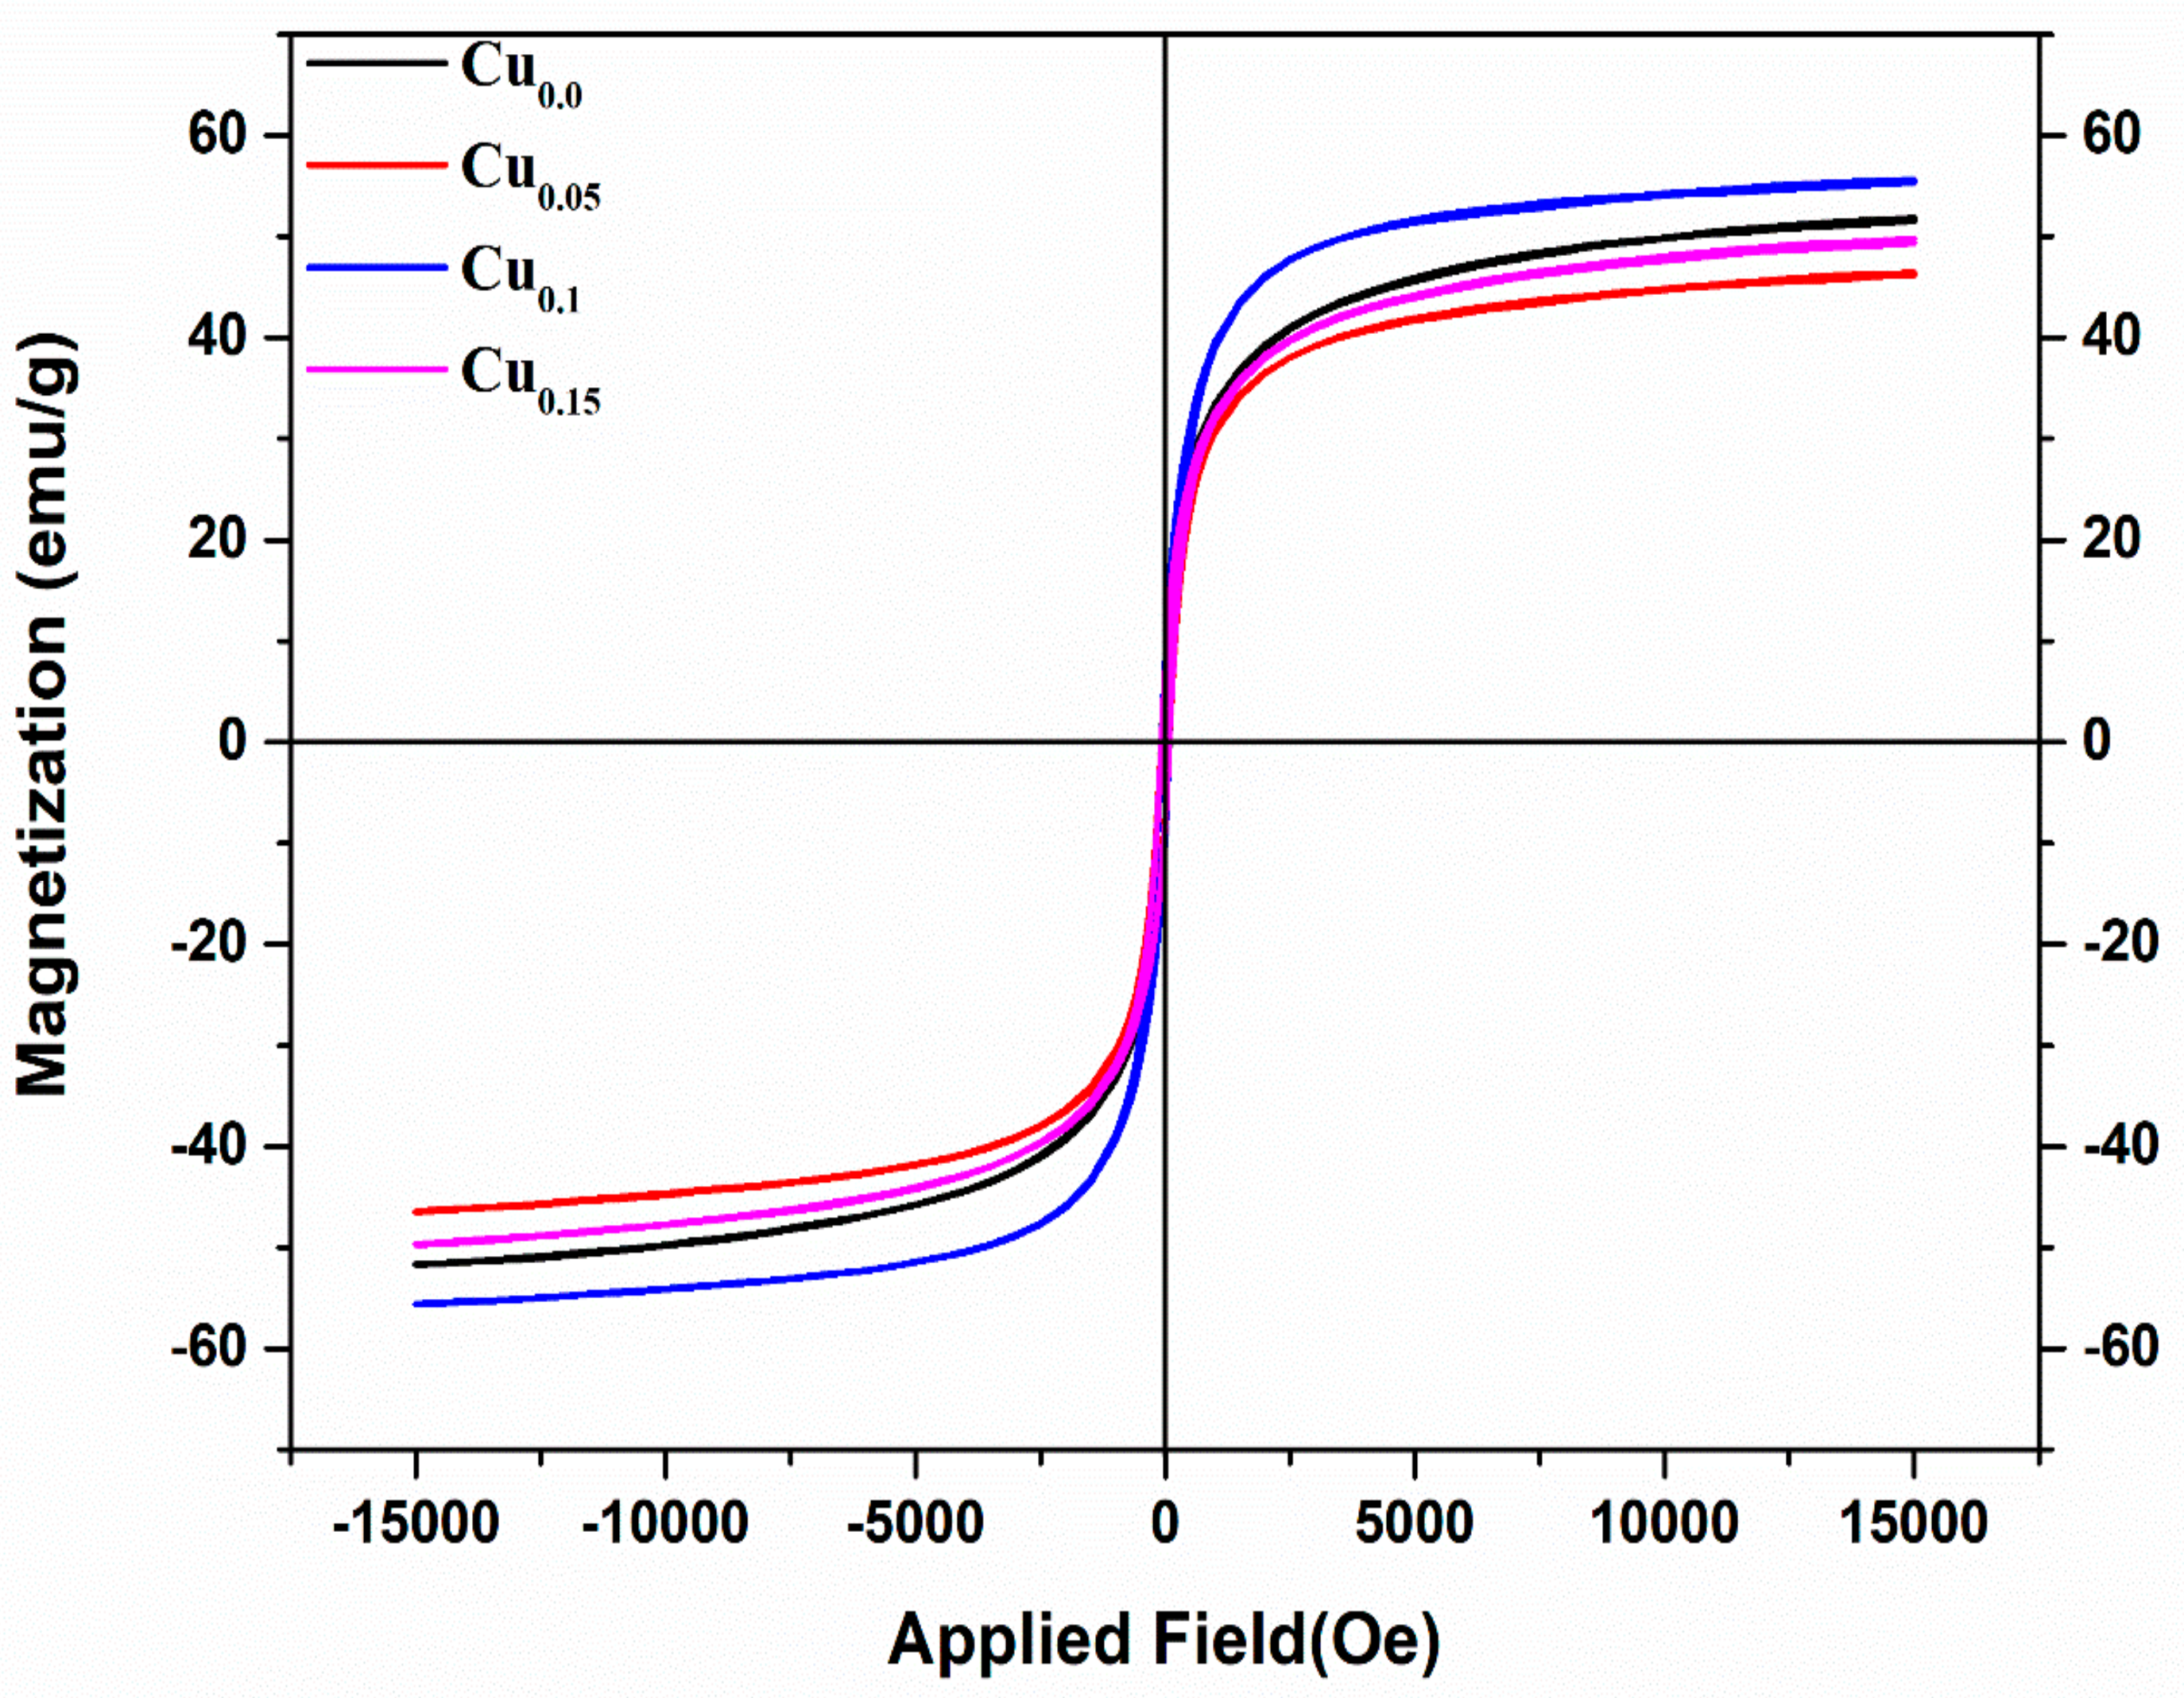
3.8. Magnetic Properties

The magnetic hysteresis measurement for the pure and Cu2+-doped Co–Zn ferrite nanoparticles are shown in Figure 12, which reveals the ferromagnetic response of the samples. Magnetic parameters such as magnetic saturation Ms, coercivity MH, remanence magnetization Mr, and magnetic moment ηB are listed in Table 3. The “S” shaped hysteresis loop reveals the ferromagnetic behavior of pure and Cu2+-doped Co–Zn ferrite nanoparticles [50]. The variation in the Ms value can be explained by the Neel model, where the A-B exchange interactions are more predominant than those of A-A and B-B superexchange ion interactions, and the net magnetic moment of the spinel lattice is equal to the difference of the magnetic moments of the A site and Bsite, i.e., M = |MB − MA| [51]. It can be seen that the saturation of magnetization Ms decreases with doping of Cu2+ ions, which is because the Fe3+ ions with magnetic moments of 5 μB are being replaced by the Cu2+ ions with lower magnetic moments of 1 μB at the tetrahedral site. However, the size of the tetrahedral site is small compared to that of the octahedral site and cannot accommodate excess copper ions. The saturation magnetization initially decreases but it increases when doping concentration is increased further, as noted when x = 0.1. The higher value of Ms for x = 0.1 can be attributed to the substitution of Cu2+ in the tetrahedral site where it pushes Fe3+ to the octahedral site and thus increases the superexchange ion interactions between Fe2+ and Fe3+, which results in an increase in the magnetic moment at the octahedral site, and an overall increase in the net magnetic moment is observed [52,53]. When copper concertation reaches x = 0.15, copper ions with lower magnetic moment concentrations increase in both tetrahedral and octahedral sites and decrease the saturation of magnetization. The net magnetic moment given in Table 3 was calculated using the given formula:
η B = M W ×   M S   5585
The incorporation of Cu2+ in the lattice of Co–Zn ferrite introduces the change in coercivity and magnetic anisotropic constant (K), which is listed in Table 3 and was calculated using the given equation [54]:
H C = 0.96 K   M S
The decrease in coercivity is a result of the change in the magnetic anisotropic constant, which can be due to lower magneto anisotropy of Cu2+ ions [55]. However, when x = 0.1, the copper ion present in the tetrahedral site has the lowest coercivity and highest value of magnetocrystalline anisotropy constant, which may be attributed to Jahn–Teller distortions induced by Cu2+ ions in the spinel ferrite system [52,54,56]. The squareness ratio (SQR) was calculated using the given formula [57]:
S Q R = M r   M S
From Table 3 it can be seen that the squareness ratio is less than 0.5, which proves the samples have uniaxial anisotropy rather than cubic anisotropy. The lower value of the SQR contributes to the application of the ferrites for high-frequency applications [55,58,59].

4. Conclusions

Single-phase cubic spinel ferrites of Cu-doped Co–Zn ferrite nanoparticles with average crystallite sizes ranging between 20.57 nm and 32.69 nm, as confirmed by the XRD analysis, were successfully synthesized using the sol–gel auto-combustion technique. The W–H plot revealed that a uniform strain developed in all directions at all doping concentrations of Cu. The TEM micrographs confirmed the polycrystalline nature of the samples when Cu = 0.0 and 0.05, and EDS revealed the elemental composition of both the samples without any impurity phases. FTIR studies showed the presence of two prominent peaks at approximately 420 cm−1 and 580 cm−1, showing metal–oxygen stretching and the formation of ferrite composite. The XPS revealed the oxidation states of the elements present in the ferrite samples. Based on the corresponding ionic radii of different oxidation states and the calculated ionic radii for the cations of the tetrahedral and octahedral sites, the cationic distribution was proposed. The dielectric spectroscopy showed that samples exhibited Maxwell–Wagner interfacial polarization, which decreased as the frequency of the applied field increased. The dielectric loss of the samples was less than 1, confirming that the samples can be used to fabricate MLICs. The AC conductivity of the samples increased with the increase in doping and with frequency, and this was explained based on the hopping model. Magnetic studies showed that the samples exhibit ferromagnetic properties and have uniaxial anisotropy rather than cubic anisotropy. The low value of the squareness ratio further suggests that the samples are a good choice for high-frequency applications.

Author Contributions

Funding acquisition, K.M.B.; Investigation, M.H. and A.C.; Methodology, K.M.B.; Project administration, R.V.; Resources, Y.Y.; Supervision, K.M.B. and O.M.A.; Writing—original draft, M.H., K.M.B. and A.C. All authors have read and agreed to the published version of the manuscript.

Funding

Deanship of Scientific research (DSR) provided the funding for this research work under the initiative of DSR (graduate students Research support).

Data Availability Statement

The data presented in this study are available within the article.

Acknowledgments

The authors would like to thank the Deanship of scientific research at King Saud University for funding and supporting this research through the initiative of DSR (graduate students Research Support).

Conflicts of Interest

The authors declare no conflict of interest.

References

  1. Lisiecki, I.; Pileni, M.P. Synthesis of copper metallic clusters using reverse micelles as microreactors. J. Am. Chem. Soc. 1993, 115, 3887–3896. [Google Scholar] [CrossRef]
  2. Petit, C.; Lixon, P.; Pileni, M.P. In situ synthesis of silver nanocluster in AOT reverse micelles. J. Phys. Chem. 1993, 97, 12974–12983. [Google Scholar] [CrossRef]
  3. Gubbala, S.; Nathani, H.; Koizol, K.; Misra, R.D.K. Magnetic properties of nanocrystalline Ni–Zn, Zn–Mn, and Ni–Mn ferrites synthesized by reverse micelle technique. Phys. B Condens. Matter 2004, 348, 317–328. [Google Scholar] [CrossRef]
  4. Berkowitz, E.A.; Schuele, J.W. Magnetic properties of some ferrite micropowders. J. Appl. Phys. 1959, 30, S134–S135. [Google Scholar] [CrossRef]
  5. Lee, J.G.; Park, J.Y.; Oh, Y.J.; Kim, C.S. Magnetic properties of CoFe 2 O 4 thin films prepared by a sol-gel method. J. Appl. Phys. 1998, 84, 2801–2804. [Google Scholar] [CrossRef]
  6. el Foulani, A.H.; Aamouche, A.; Mohseni, F.; Amaral, J.S.; Tobaldi, D.M.; Pullar, R.C. Effect of surfactants on the optical and magnetic properties of cobalt-zinc ferrite Co0. 5Zn0. 5Fe2O4. J. Alloy. Compd. 2019, 774, 1250–1259. [Google Scholar] [CrossRef]
  7. Yousefi, M.H.; Manouchehri, S.; Arab, A.; Mozaffari, M.; Amiri, G.R.; Amighian, J. Preparation of cobalt–zinc ferrite (Co0. 8Zn0. 2Fe2O4) nanopowder via combustion method and investigation of its magnetic properties. Mater. Res. Bull. 2010, 45, 1792–1795. [Google Scholar] [CrossRef]
  8. Tirosh, E.; Shemer, G.; Markovich, G. Optimizing cobalt ferrite nanocrystal synthesis using a magneto-optical probe. Chem. Mater. 2006, 18, 465–470. [Google Scholar] [CrossRef]
  9. Iatridi, Z.; Vamvakidis, K.; Tsougos, I.; Vassiou, K.; Dendrinou-Samara, C.; Bokias, G. Multifunctional polymeric platform of magnetic ferrite colloidal superparticles for luminescence, imaging, and hyperthermia applications. ACS Appl. Mater. Interfaces 2016, 8, 35059–35070. [Google Scholar] [CrossRef]
  10. Gu, H.; Xu, K.; Yang, Z.; Chang, C.K.; Xu, B. Synthesis and cellular uptake of porphyrin decorated iron oxide nanoparticles—a potential candidate for bimodal anticancer therapy. Chem. Commun. 2005, 34, 4270–4272. [Google Scholar] [CrossRef]
  11. Lüders, U.; Barthelemy, A.; Bibes, M.; Bouzehouane, K.; Fusil, S.; Jacquet, E.; Contour, J.P.; Bobo, J.F.; Fontcuberta, J.; Fert, A. NiFe2O4: A versatile spinel material brings new opportunities for spintronics. Adv. Mater. 2006, 18, 1733–1736. [Google Scholar] [CrossRef]
  12. Baldi, G.; Bonacchi, D.; Innocenti, C.; Lorenzi, G.; Sangregorio, C. Cobalt ferrite nanoparticles: The control of the particle size and surface state and their effects on magnetic properties. J. Magn. Magn. Mater. 2007, 311, 10–16. [Google Scholar] [CrossRef]
  13. Halder, S.; Liba, S.I.; Nahar, A.; Sikder, S.S.; Hoque, S.M. To study the surface modified cobalt zinc ferrite nanoparticles for application to magnetic hyperthermia. AIP Adv. 2020, 10, 125308. [Google Scholar] [CrossRef]
  14. Feng, J.; Xiong, R.; Liu, Y.; Su, F.; Zhang, X. Preparation of cobalt substituted zinc ferrite nanopowders via auto-combustion route: An investigation to their structural and magnetic properties. J. Mater. Sci. Mater. Electron. 2018, 29, 18358–18371. [Google Scholar] [CrossRef]
  15. Köseoğlu, Y.; Baykal, A.; Gözüak, F.A.; Kavas, H.Ü. Structural and magnetic properties of CoxZn1− xFe2O4 nanocrystals synthesized by microwave method. Polyhedron 2009, 28, 2887–2892. [Google Scholar] [CrossRef]
  16. Tang, X.X.; Manthiram, A.; Goodenough, J.B. Copper ferrite revisited. J. Solid State Chem. 1989, 79, 250–262. [Google Scholar] [CrossRef]
  17. Mahalakshmi, S.; Manja, K.S.; Nithiyanantham, S. Structural and morphological studies of copper-doped nickel ferrite. J. Supercond. Nov. Magn. 2015, 28, 3093–3098. [Google Scholar] [CrossRef]
  18. Ghosh, M.P.; Datta, S.; Sharma, R.; Tanbir, K.; Kar, M.; Mukherjee, S. Copper doped nickel ferrite nanoparticles: Jahn-Teller distortion and its effect on microstructural, magnetic and electronic properties. Mater. Sci. Eng. B 2021, 263, 114864. [Google Scholar]
  19. Köppel, H.; Yarkony, D.R.; Barentzen, H. (Eds.) The Jahn-Teller Effect: Fundamentals and Implications for Physics and Chemistry; Springer Science & Business Media: Berlin/Heidelberg, Germany, 2009; Volume 97. [Google Scholar]
  20. Villette, C.; Tailhades, P.; Rousset, A. Thermal behavior and magnetic properties of acicular copper-cobalt ferrite particles. J. Solid State Chem. 1995, 117, 64–72. [Google Scholar] [CrossRef]
  21. Kargar, Z.; Asgarian, S.M.; Mozaffari, M. Positron annihilation and magnetic properties studies of copper substituted nickel ferrite nanoparticles. Nucl. Instrum. Methods Phys. Res. Sect. B Beam Interact. Mater. At. 2016, 375, 71–78. [Google Scholar] [CrossRef]
  22. Humbe, A.V.; Nawle, A.C.; Shinde, A.B.; Jadhav, K.M. Impact of Jahn Teller ion on magnetic and semiconducting behaviour of Ni-Zn spinel ferrite synthesized by nitrate-citrate route. J. Alloy. Compd. 2017, 691, 343–354. [Google Scholar] [CrossRef]
  23. Batoo, K.M.; Ansari, M.S. Low temperature-fired Ni-Cu-Zn ferrite nanoparticles through auto-combustion method for multilayer chip inductor applications. Nanoscale Res. Lett. 2012, 7, 1–14. [Google Scholar] [CrossRef] [Green Version]
  24. Qindeel, R.; Alonizan, N.H. Structural, dielectric and magnetic properties of cobalt based spinel ferrites. Curr. Appl. Phys. 2018, 18, 519–525. [Google Scholar] [CrossRef]
  25. Sujatha, C.; Reddy, K.V.; Babu, K.S.; Reddy, A.R.; Rao, K.H. Structural and magnetic properties of Ni 0.5− X mg x cu 0.05 Zn 0.45 Fe 2 O 4 ferrites for multilayer chip inductor applications. In International Conference on Nanoscience, Engineering and Technology (ICONSET 2011); IEEE: New York, NY, USA, 2011; pp. 19–22. [Google Scholar]
  26. Radoń, A.; Hawełek, Ł.; Łukowiec, D.; Kubacki, J.; Włodarczyk, P. Dielectric and electromagnetic interference shielding properties of high entropy (Zn, Fe, Ni, Mg, Cd) Fe 2 O 4 ferrite. Sci. Rep. 2019, 9, 1–13. [Google Scholar] [CrossRef]
  27. Xie, J.; Han, M.; Chen, L.; Kuang, R.; Deng, L. Microwave-absorbing properties of NiCoZn spinel ferrites. J. Magn. Magn. Mater. 2007, 314, 37–42. [Google Scholar] [CrossRef]
  28. Gurusiddesh, M.; Madhu, B.J.; Shankaramurthy, G.J. Structural, dielectric, magnetic and electromagnetic interference shielding investigations of polyaniline decorated Co 0.5 Ni 0.5 Fe 2 O 4 nanoferrites. J. Mater. Sci. Mater. Electron. 2018, 29, 3502–3509. [Google Scholar] [CrossRef]
  29. Sulaiman, J.M.; Ismail, M.M.; Rafeeq, S.N.; Mandal, A. Enhancement of electromagnetic interference shielding based on Co 0.5 Zn 0.5 Fe 2 O 4/PANI-PTSA nanocomposites. Appl. Phys. A 2020, 126, 1–9. [Google Scholar] [CrossRef]
  30. Brinker, C.J.; Scherer, G.W. Sol.-Gel Science: The Physics and Chemistry of Sol.-Gel Processing; Academic Press: Cambridge, MA, USA, 2013. [Google Scholar]
  31. Patil, V.G.; Shirsath, S.E.; More, S.D.; Shukla, S.J.; Jadhav, K.M. Effect of zinc substitution on structural and elastic properties of cobalt ferrite. J. Alloy. Compd. 2009, 488, 199–203. [Google Scholar] [CrossRef]
  32. A.D.S. Blog, Publication: Journal of Molecular Structure Pub Date: February 2018. Available online: https://ui.adsabs.harvard.edu/abs/2017JMoSt1147..697./abstract (accessed on 1 April 2021).
  33. Anjum, S.; Sehar, F.; Awan, M.S.; Zia, R. Role of Bi 3+ substitution on structural, magnetic and optical properties of cobalt spinel ferrite. Appl. Phys. A 2016, 122, 436. [Google Scholar] [CrossRef]
  34. Zhang, C.F.; Zhong, X.C.; Yu, H.Y.; Liu, Z.W.; Zeng, D.C. Effects of cobalt doping on the microstructure and magnetic properties of Mn–Zn ferrites prepared by the co-precipitation method. Phys. B Condens. Matter 2009, 404, 2327–2331. [Google Scholar] [CrossRef]
  35. Yadav, R.S.; Kuřitka, I.; Vilcakova, J.; Havlica, J.; Masilko, J.; Kalina, L.; Tkacz, J.; Švec, J.; Enev, V.; Hajdúchová, M. Impact of grain size and structural changes on magnetic, dielectric, electrical, impedance and modulus spectroscopic characteristics of CoFe2O4 nanoparticles synthesized by honey mediated sol-gel combustion method. Adv. Nat. Sci. Nanosci. Nanotechnol. 2017, 8, 045002. [Google Scholar]
  36. Debnath, S.; Deb, K.; Saha, B.; Das, R. X-ray diffraction analysis for the determination of elastic properties of zinc-doped manganese spinel ferrite nanocrystals (Mn0. 75Zn0. 25Fe2O4), along with the determination of ionic radii, bond lengths, and hopping lengths. J. Phys. Chem. Solids 2019, 134, 105–114. [Google Scholar] [CrossRef]
  37. Mugutkar, A.B.; Gore, S.K.; Mane, R.S.; Batoo, K.M.; Adil, S.F.; Jadhav, S.S. Magneto-structural behaviour of Gd doped nanocrystalline Co-Zn ferrites governed by domain wall movement and spin rotations. Ceram. Int. 2018, 44, 21675–21683. [Google Scholar] [CrossRef]
  38. Asiri, S.; Sertkol, M.; Guner, S.; Gungunes, H.; Batoo, K.M.; Saleh, T.A.; Sozeri, H.; Almessiere, M.A.; Manikandan, A.; Baykal, A. Hydrothermal synthesis of CoyZnyMn1-2yFe2O4 nanoferrites: Magneto-optical investigation. Ceram. Int. 2018, 44, 5751–5759. [Google Scholar]
  39. Qamar, S.; Akhtar, M.N.; Batoo, K.M.; Raslan, E.H. Structural and magnetic features of Ce doped Co-Cu-Zn spinel nanoferrites prepared using sol gel self-ignition method. Ceram. Int. 2020, 46, 14481–14487. [Google Scholar] [CrossRef]
  40. Markova-Deneva, I. Infrared spectroscopy investigation of metallic nanoparticles based on copper, cobalt, and nickel synthesized through borohydride reduction method. J. Univ. Chem. Technol. Metall. 2010, 45, 351–378. [Google Scholar]
  41. Veverka, M.; Jirák, Z.; Kaman, O.; Knížek, K.; Maryško, M.; Pollert, E.; Závěta, K.; Lančok, A.; Dlouhá, M.; Vratislav, S. Distribution of cations in nanosize and bulk Co–Zn ferrites. Nanotechnology 2011, 22, 345701. [Google Scholar] [CrossRef]
  42. Murray, P.J.; Linnett, J.W. Cation distribution in the spinels CoxFe3− xO4. J. Phys. Chem. Solids 1976, 37, 1041–1042. [Google Scholar] [CrossRef]
  43. Bennet, J.; Tholkappiyan, R.; Vishista, K.; Jaya, N.V.; Hamed, F. Attestation in self-propagating combustion approach of spinel AFe2O4 (A= Co, Mg and Mn) complexes bearing mixed oxidation states: Magnetostructural properties. Appl. Surf. Sci. 2016, 383, 113–125. [Google Scholar] [CrossRef]
  44. Vinuthna, C.H.; Chandra Babu Naidu, K.; Dachepalli, R. Magnetic and antimicrobial properties of cobalt-zinc ferrite nanoparticles synthesized by citrate-gel method. Int. J. Appl. Ceram. Technol. 2019, 16, 1944–1953. [Google Scholar]
  45. Wang, W.P.; Yang, H.; Xian, T.; Jiang, J.L. XPS and magnetic properties of CoFe2O4 nanoparticles synthesized by a polyacrylamide gel route. Mater. Trans. 2012, 53, 1586–1589. [Google Scholar] [CrossRef] [Green Version]
  46. Shannon, R.T.; Prewitt, C.T. Revised values of effective ionic radii. Acta Crystallogr. Sect. B Struct. Crystallogr. Cryst. Chem. 1970, 26, 1046–1048. [Google Scholar] [CrossRef]
  47. Zhang, H.; Li, C.; Lyu, L.; Hu, C. Surface oxygen vacancy inducing peroxymonosulfate activation through electron donation of pollutants over cobalt-zinc ferrite for water purification. Appl. Catal. B Environ. 2020, 270, 118874. [Google Scholar] [CrossRef]
  48. Muthukumar, K.; Lakshmi, D.S.; Acharya, S.D.; Natarajan, S.; Mukherjee, A.; Bajaj, H.C. Solvothermal synthesis of magnetic copper ferrite nano sheet and its antimicrobial studies. Mater. Chem. Phys. 2018, 209, 172–179. [Google Scholar] [CrossRef]
  49. Jauhar, S.; Singhal, S. Substituted cobalt nano-ferrites, CoMxFe2− xO4 (M= Cr3+, Ni2+, Cu2+, Zn2+; 0.2≤ x≤ 1.0) as heterogeneous catalysts for modified Fenton’s reaction. Ceram. Int. 2014, 40, 11845–11855. [Google Scholar] [CrossRef]
  50. Yu, R.; Zhao, J.; Zhao, Z.; Cui, F. Copper substituted zinc ferrite with abundant oxygen vacancies for enhanced ciprofloxacin degradation via peroxymonosulfate activation. J. Hazard. Mater. 2020, 390, 121998. [Google Scholar] [CrossRef]
  51. Batoo, K.M.; Kumar, S.; Lee, C.G. Influence of Al doping on electrical properties of Ni–Cd nano ferrites. Curr. Appl. Phys. 2009, 9, 826–832. [Google Scholar] [CrossRef]
  52. Hashim, M.; Kumar, S.; Koo, B.H.; Shirsath, S.E.; Mohammed, E.M.; Shah, J.; Kotnala, R.K.; Choi, H.K.; Chung, H.; Kumar, R. Structural, electrical and magnetic properties of Co–Cu ferrite nanoparticles. J. Alloy. Compd. 2012, 518, 11–18. [Google Scholar] [CrossRef]
  53. Batoo, K.M.; Kumar, G.; Yang, Y.; Al-Douri, Y.; Singh, M.; Jotania, R.B.; Imran, A. Structural, morphological and electrical properties of Cd2+ doped MgFe2-xO4 ferrite nanoparticles. J. Alloy. Compd. 2017, 726, 179–186. [Google Scholar] [CrossRef]
  54. Batoo, K.M.; Raslan, E.H.; Yang, Y.; Adil, S.F.; Khan, M.; Imran, A.; Al-Douri, Y. Structural, dielectric and low temperature magnetic response of Zn doped cobalt ferrite nanoparticles. AIP Adv. 2019, 9, 055202. [Google Scholar] [CrossRef] [Green Version]
  55. Rao, P.A.; Rao, K.S.; Raju, T.P.; Kapusetti, G.; Choppadandi, M.; Varma, M.C.; Rao, K.H. A systematic study of cobalt-zinc ferrite nanoparticles for self-regulated magnetic hyperthermia. J. Alloy. Compd. 2019, 794, 60–67. [Google Scholar]
  56. Asgarian, S.M.; Pourmasoud, S.; Kargar, Z.; Sobhani-Nasab, A.; Eghbali-Arani, M. Investigation of positron annihilation lifetime and magnetic properties of Co1− xCuxFe2O4 nanoparticles. Mater. Res. Express 2018, 6, 015023. [Google Scholar] [CrossRef]
  57. Tedjieukeng, H.M.K.; Tsobnang, P.K.; Fomekong, R.L.; Etape, E.P.; Joy, P.A.; Delcorte, A.; Lambi, J.N. Structural characterization and magnetic properties of undoped and copper-doped cobalt ferrite nanoparticles prepared by the octanoate coprecipitation route at very low dopant concentrations. RSC Adv. 2018, 8, 38621–38630. [Google Scholar] [CrossRef] [Green Version]
  58. Baykal, A.; Guner, S.; Gungunes, H.; Batoo, K.M.; Amir, M.; Manikandan, A. Magneto optical properties and hyperfine interactions of Cr 3+ ion substituted copper ferrite nanoparticles. J. Inorg. Organomet. Polym. Mater. 2018, 28, 2533–2544. [Google Scholar] [CrossRef]
  59. Jiang, N.N.; Yang, Y.; Zhang, Y.X.; Zhou, J.P.; Liu, P.; Deng, C.Y. Influence of zinc concentration on structure, complex permittivity and permeability of Ni–Zn ferrites at high frequency. J. Magn. Magn. Mater. 2016, 401, 370–377. [Google Scholar] [CrossRef]
Figure 1. XRD patterns of Co0.5 Zn0.5CuxFe2−xO4.
Magnetochemistry 07 00053 g001
Figure 2. Williamson–Hall plot of Co0.5 Zn0.5 Fe2−xCuxO4.
Magnetochemistry 07 00053 g002
Figure 3. Nelson–Riley (N–R) plot of Co0.5 Zn0.5 Fe2−xCuxO4.
Magnetochemistry 07 00053 g003
Figure 4. Shows (a) TEM micrograph, (b) grain size distribution, (c) lattice plane with inset showing SAED pattern for the composition x = 0.0.
Magnetochemistry 07 00053 g004
Figure 5. Shows (a) TEM micrograph, (b) grain size distribution, (c) lattice plane with inset showing SAED pattern for the composition x = 0.05.
Magnetochemistry 07 00053 g005
Figure 6. (a,b): EDX pattern for the composition x = 0.0 and 0.05.
Magnetochemistry 07 00053 g006
Figure 7. FTIR spectra of Co0.5 Zn0.5 Fe2-xCuxO4 ferrites.
Magnetochemistry 07 00053 g007
Figure 8. (a) Co2p spectra (b) Fe 2p spectra (c) O1s spectra (d) Cu2p and Zn2p spectra (x = 0.0 − 0.15).
Magnetochemistry 07 00053 g008aMagnetochemistry 07 00053 g008bMagnetochemistry 07 00053 g008c
Figure 9. Variation of the real part of the dielectric constant with the frequency of Co0.5 Zn0.5 Fe2−xCuxO4 ferrites.
Magnetochemistry 07 00053 g009
Figure 10. Shows plot of loss tangent versus frequency for Co0.5 Zn0.5 Fe2−xCuxO4 ferrites.
Magnetochemistry 07 00053 g010
Figure 11. Shows plot AC conductivity versus frequency for Co0.5 Zn0.5 Fe2−xCuxO4 ferrites.
Magnetochemistry 07 00053 g011
Figure 12. M versus H hysteresis loop for Co0.5 Zn0.5 Fe2−xCuxO4 ferrites.
Magnetochemistry 07 00053 g012
Table 1. Structural parameters of Co0.5 Zn0.5 Fe2-xCuxO4 ferrites.
Co0.5Zn0.5Fe2−xCuxO4x = 0.0x = 0.05x = 0.1x = 0.15
Lattice constant “a” (Å)8.40328.39618.40248.3651
Crystallite size Dscherrer (nm)24.4323.1922.622.23
Strain(ε)0.001870.00360.00360.0036
Volume (Å)3593.38591.87593.21585.34
dAX (Å)1.90641.9051.90641.8979
dBX (Å)2.0522.05032.05182.0427
dAXE (Å)2.98013.11093.11323.0994
dBXE (Å)2.82832.82592.8282.8155
dBXEU (Å)2.97262.97012.78092.9592
rA (Å)0.58660.58500.58640.5780
rB (Å)0.73030.72860.73010.721
LA (Å)3.63803.63563.63913.6221
LB (Å)2.97092.96842.97062.9575
Table 2. FTIR vibrational mode positions.
CompositionGrain SizeVibrational Modes (υ1)Vibrational Modes (υ2)
xnmcm−1cm−1
x = 0.032.69424580
x= 0.0521.90421583
x = 0.124.29420584
x = 0.1523.72419586
Table 3. Magnetic parameters of the pure and Cu2+ cobalt–zinc ferrite.
Cu2+ M S   ( emu / g ) M H   ( Oe ) M R   ( emu / g ) K (erg/cm3)SQR η B
0.052.0382.718.034482.70.1542.2
0.0546.4179.517.23890.10.1551.97
0.155.6178.648.814555.30.1122.37
0.1549.4779.397.8140861.10.1572.1
Publisher’s Note: MDPI stays neutral with regard to jurisdictional claims in published maps and institutional affiliations.

