Article

Near-Infrared Emissive Cyanido-Bridged {YbFe2} Molecular Nanomagnets Sensitive to the Nitrile Solvents of Crystallization

1
Faculty of Chemistry, Jagiellonian University, Gronostajowa 2, 30-387 Krakow, Poland
2
Department of Chemistry, School of Science, The University of Tokyo, 7-3-1 Hongo, Bunkyo-ku, Tokyo 113-0033, Japan
*
Author to whom correspondence should be addressed.
Submission received: 13 May 2021 / Revised: 24 May 2021 / Accepted: 28 May 2021 / Published: 2 June 2021
(This article belongs to the Special Issue Advances in Lanthanide Coordination Chemistry)

Abstract

:
One of the pathways toward luminescent single-molecule magnets (SMMs) is realized by the self-assembly of lanthanide(3+) ions with cyanido transition metal complexes. We report a novel family of emissive SMMs, {YbIII(4-pyridone)4[FeII(phen)2(CN)2]2}(CF3SO3)3·solv (solv = 2MeCN, 1·MeCN; 2AcrCN, 1·AcrCN; 2PrCN, 1·PrCN; 2MalCN·1MeOH; 1·MalCN; MeCN = acetonitrile, AcrCN = acrylonitrile, PrCN = propionitrile, MalCN = malononitrile). They are based on paramagnetic YbIII centers coordinating diamagnetic [FeII(phen)2(CN)2] metalloligands but differ in the nitrile solvents of crystallization. They exhibit a field-induced slow magnetic relaxation dominated by a Raman process, without an Orbach relaxation as indicated by AC magnetic data and the ab initio calculations. The Raman relaxation is solvent-dependent as represented by the power “n” of the BRamanTn contribution varying from 3.07(1), to 2.61(1), 2.37(1), and 1.68(4) for 1·MeCN, 1·PrCN, 1·AcrCN, and 1·MalCN, respectively, while the BRaman parameter adopts the opposite trend. This was correlated with the variation of phonon modes schemes, including the number of available vibrational modes and their energies, dependent on the increasing complexity of the applied nitrile. 1·MeCN and 1·MalCN show the additional T-independent relaxation assignable to dipole-dipole interactions as confirmed by its suppression in 1·AcrCN and 1·PrCN revealing longer Yb–Yb distances and the disappearance in the LuIII-diluted 1·MeCN@Lu. All compounds exhibit YbIII–centered near-infrared photoluminescence sensitized by organic ligands.

Graphical Abstract

1. Introduction

Extensive scientific interest in novel functional materials is driven by the necessity of ensuring the development of hi-tech magnetic, optical, or electronic devices [1,2,3,4,5]. Technological progress needs the materials that fulfil requirements such as extreme miniaturization, high efficiency in demonstrating desired properties, and a low cost of production [6,7]. In this regard, the idea of multifunctional molecular materials emerged as they may realize diverse physical properties within a single-phase and the desired functionalities, e.g., magnetism, luminescence or ionic conductivity, and an ability to be programmed at the molecular level [8,9,10]. In the field of molecular materials, the application of lanthanide(3+) ions has been verified as a promising pathway [11]. They are the best candidates for single-molecule magnets (SMMs) that are molecular objects showing slow relaxation of magnetization [12,13,14,15]. This makes them promising for applications in data storage and molecular spintronics [16,17,18]. On the other hand, lanthanide(III) complexes have been investigated due to their luminescent properties originating from f–f electronic transitions [19,20]. The 4f-metal-based emissive materials were used for the development of light conversion systems, light-emitting devices, optical sensors, and bioimaging tools [21,22,23,24,25]. Moreover, they were recognized as great prerequisites for optical thermometers aimed at precise and contactless temperature detection at the nanoscale [26,27,28]. By combining magnetic and luminescent properties in a molecular system, white light, multicolored, or near-infrared (NIR) emissive molecular nanomagnets were obtained [29,30,31]. They offer a valuable correlation between magnetic anisotropy and luminescence, as both these properties originate from the electronic structure of 4f metal ions [32,33]. They also enable magnetic switching of emission and the construction of advanced opto-magnetic systems based on SMMs with optically self-monitored temperature [34,35].
Recently, NIR-emissive molecular nanomagnets, mainly based on Er(III) or Yb(III) complexes, have attracted considerable attention [29,36,37,38]. This is partially related to the increasing interest in the NIR-luminescent functional materials. For instance, the use of low-energy radiation in fluorescence imaging enabled the non-invasive detection of pathological changes at the cellular level [39,40]. Traditional near-infrared (NIR I, 650–900 nm) light-emitting optical probes with low tissue absorption are extensively explored in bioimaging [41]. However, their sensitivity and penetration depth are still limited by the high-NIR-light scattering loss [42,43]. This problem may be solved by high-NIR- emission-intensity probes with large optical penetration depth using lower-energy (over 1000 nm) emissive Er(III) and Yb(III) complexes. The unique photophysical and photochemical performance of NIR-emissive materials also opens the application horizon in optical telecommunication, sensing, lasers, and energy conversion [44,45,46,47].
NIR-emissive lanthanide SMMs are usually obtained by the attachment of the organic ligand to Er3+ or Yb3+ ions. The organic ligand serves as the sensitizer for 4f-based luminescence and constrains the lanthanide coordination geometry toward improved magnetic anisotropy [36,37,38,48]. Alternatively, cyanido transition metal complexes, that can efficiently transfer the energy to NIR–emissive lanthanides [49,50], can be used as advanced metalloligands for NIR-emissive SMMs [51,52,53,54]. In this context, we are continuously developing the idea of luminescent molecular magnets that can be achieved by inserting lanthanide ions into polycyanidometallate-based coordination systems. In the presented research, we used a neutral dicyanido iron(II) complex, [FeII(phen)2(CN)2] (phen = 1,10- phenanthroline) containing diamagnetic low-spin Fe(II) centers. Due to the strong visible light absorption and an efficient solvatochromic effect, this cyanido complex was recognized as a universal inorganic solvent polarity indicator [55,56,57,58] but here, we explore its ability to serve as a metalloligand for ensuring magnetic anisotropy and NIR luminescence of lanthanide ions. For this purpose, we selected Yb3+ ions showing characteristic NIR emission in the 900–1100 nm range, which can be sensitized by UV-to-vis-light absorbing chromophores [38,59,60]. The selected YbIII complexes also exhibit slow magnetic relaxation, which is usually dominated by the Raman relaxation rather than the Orbach relaxation that is typical for most of lanthanide SMMs [53,61]. Therefore, they are good systems for systematic studies on the structural and electronic factors that govern the Raman magnetic relaxation, which has been recently recognized as an important issue in the design of high-performance lanthanide SMMs [62,63,64]. Therefore, we report the structures as well as the magnetic and optical properties of novel molecular materials ({YbIII(4-pyridone)4 [FeII(phen)2(CN)2]2}(CF3SO3)3·solv (solv = 2MeCN in 1·MeCN, 2AcrCN in 1·AcrCN, 2PrCN in 1·PrCN, and 2MalCN·1MeOH in 1·MalCN, where MeCN = acetonitrile, AcrCN = acrylonitrile, PrCN = propionitrile, MalCN = malononitrile, and MeOH = methanol), composed on trinuclear {YbFe2} molecules crystallized with four different nitrile solvents of crystallization. They are the first examples of NIR-emissive lanthanide-based molecular nanomagnets exploring the metalloligand application of dicyanido iron(II) complexes. They combine sensitized NIR YbIII emission with slow magnetic relaxation characterized by a Raman relaxation process sensitive to the type of nitrile solvent which was investigated by structural X-ray diffraction methods, AC magnetic data supported by the ab initio calculations, and solid-state photoluminescence experiments.

2. Results and Discussion

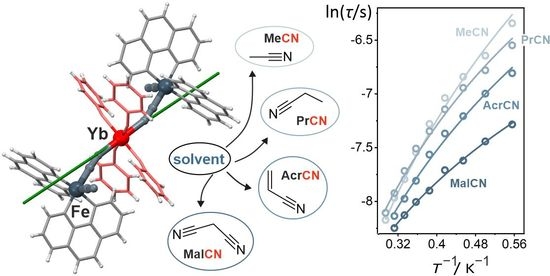
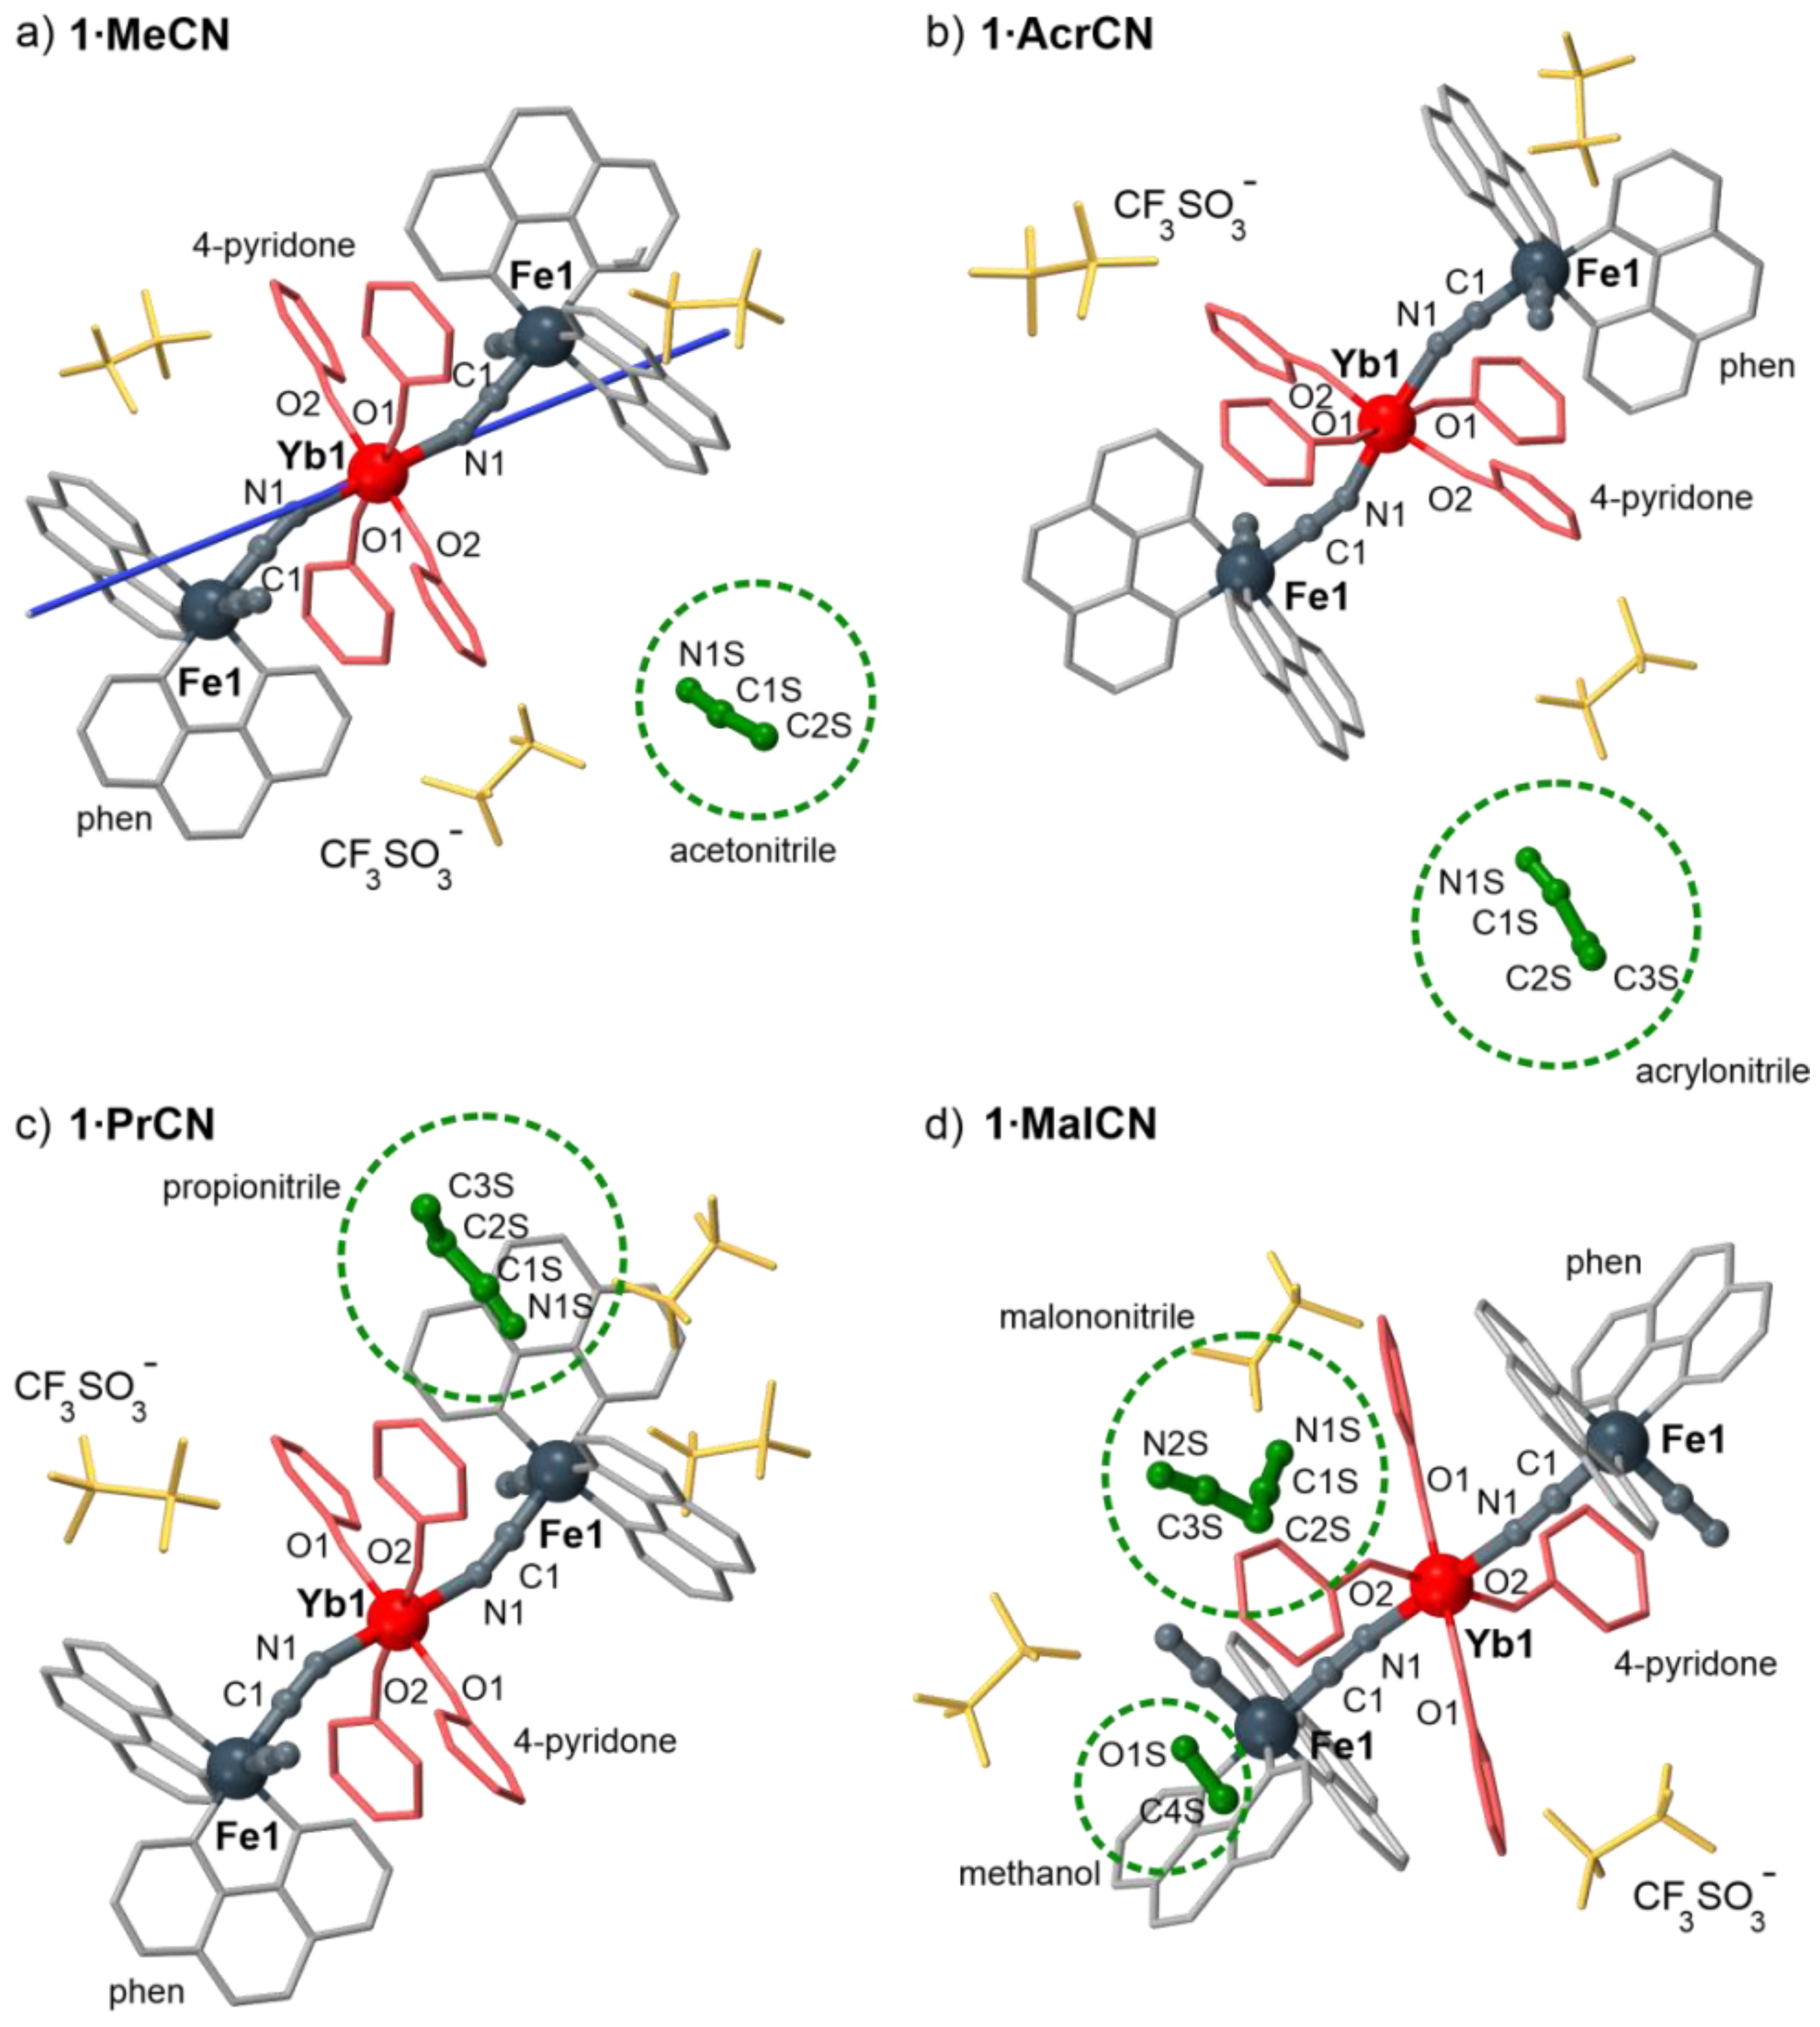
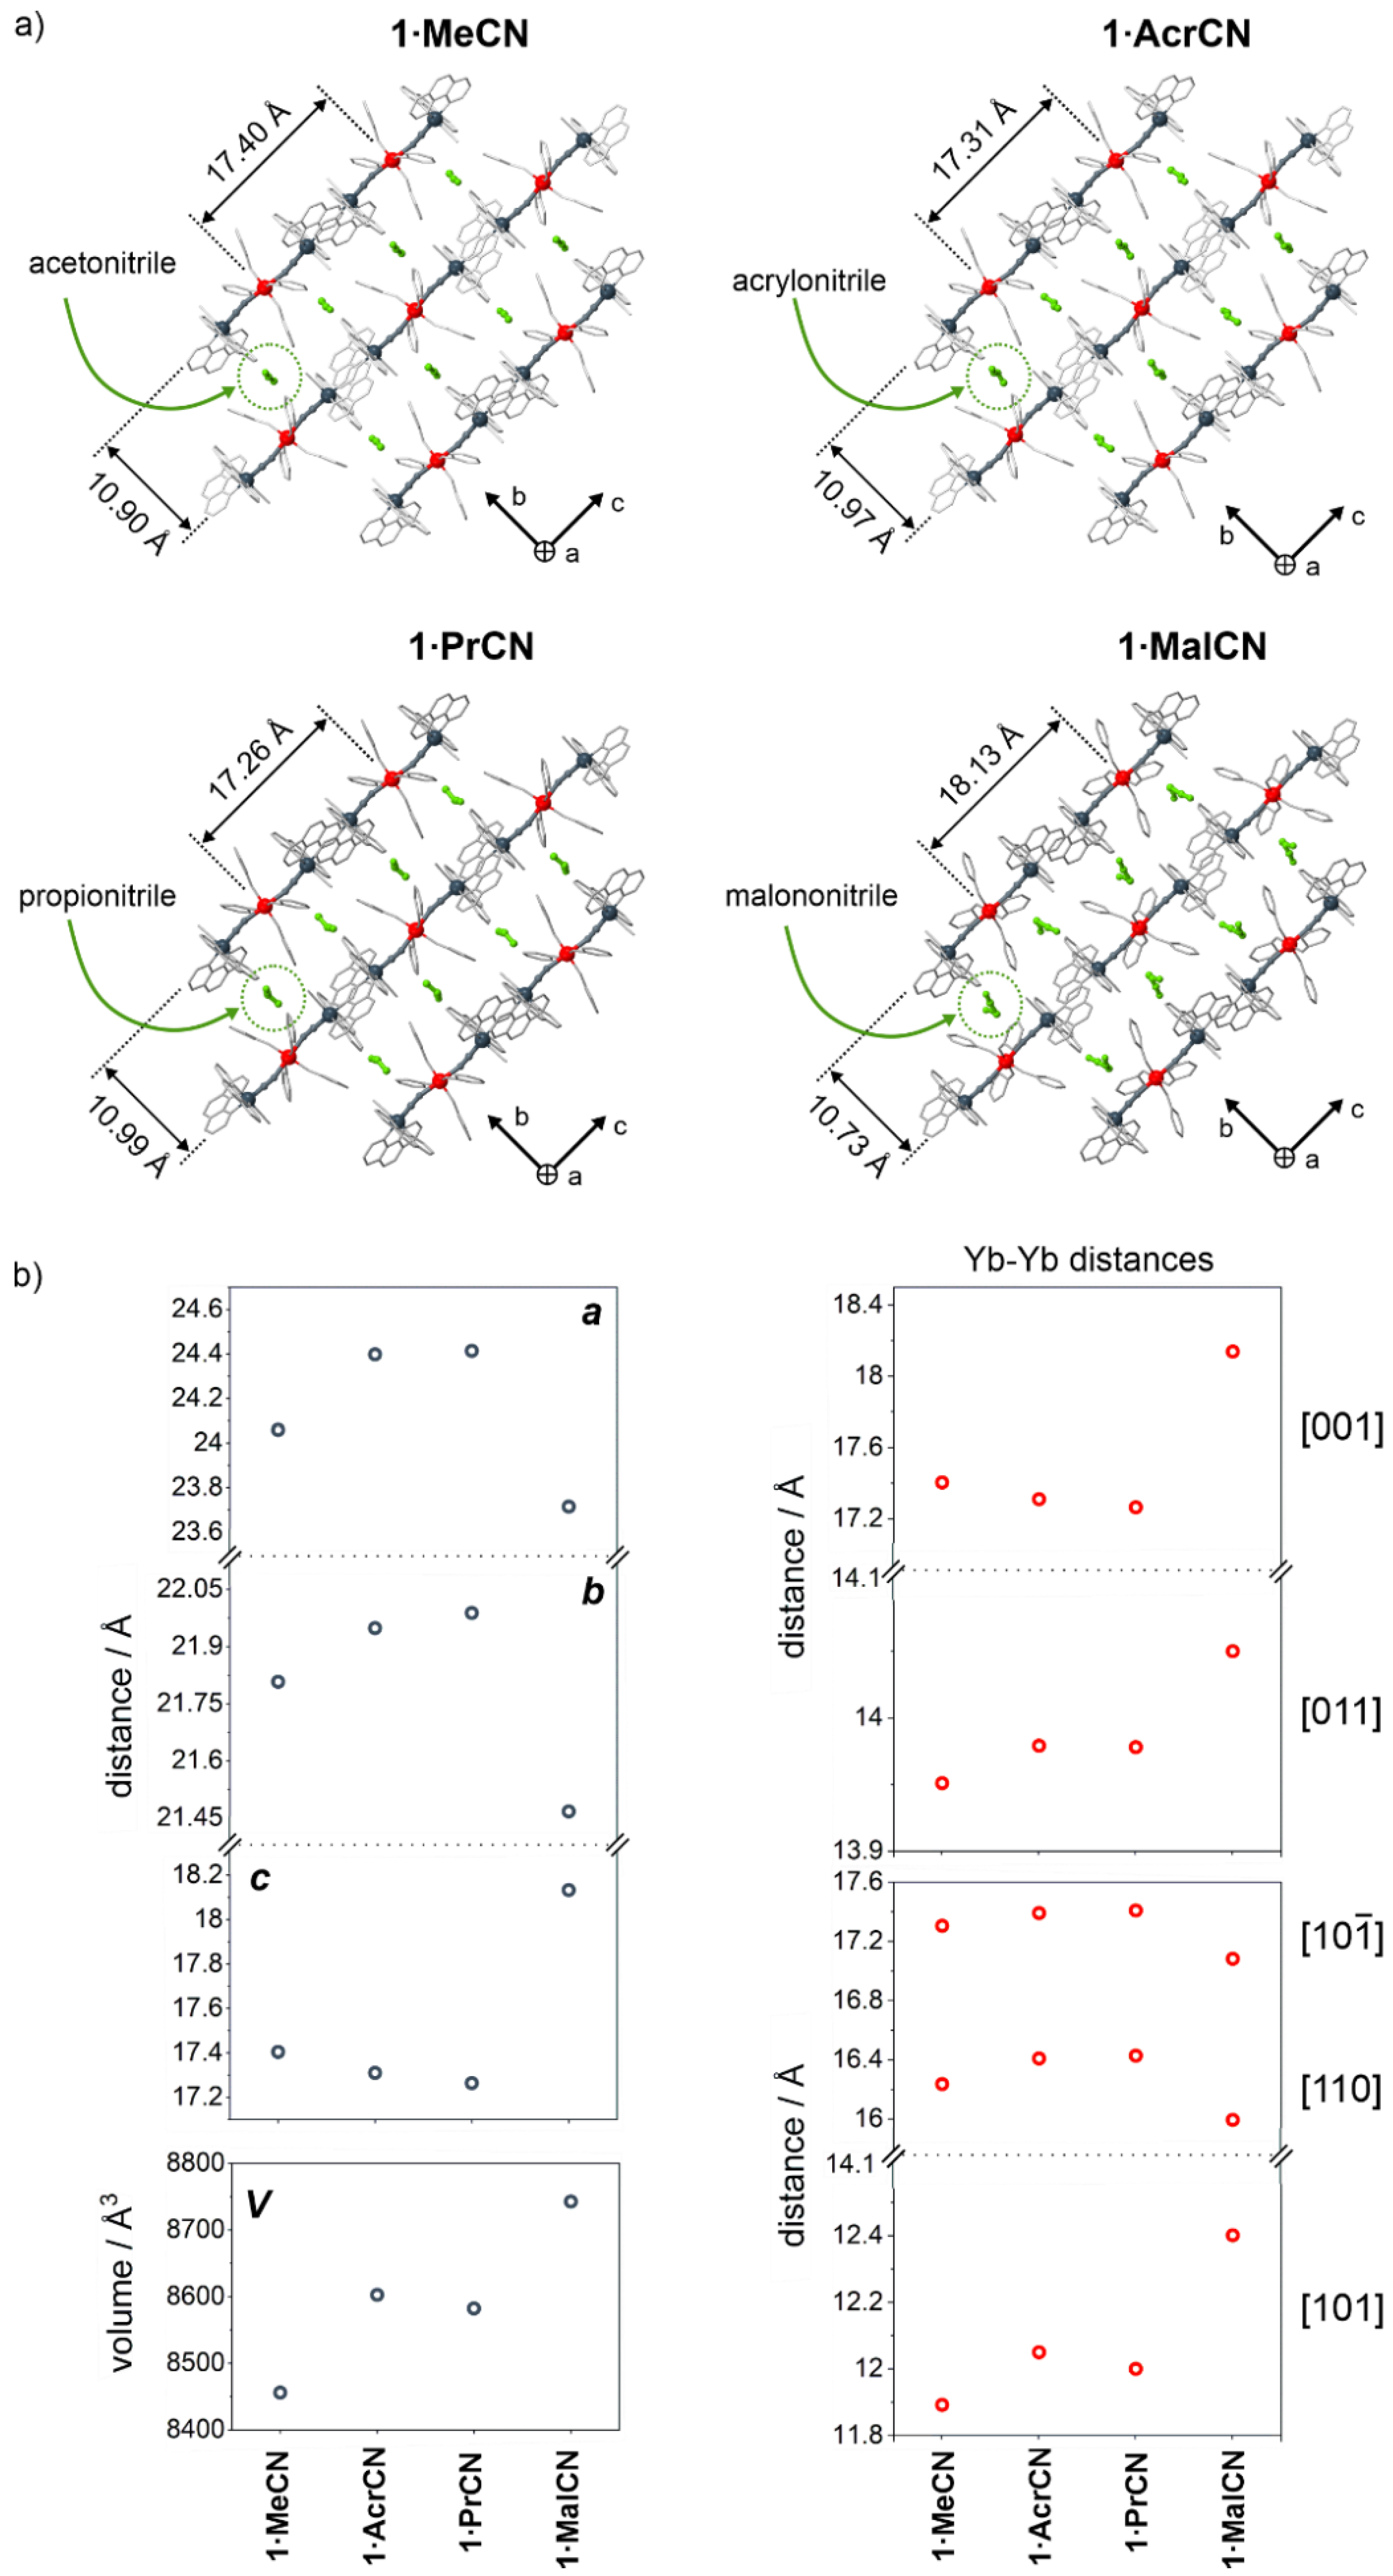
2.1. Structural Studies

Dark red crystals of 1∙MeCN were obtained by the spontaneous crystallization from the methanol/acetonitrile solvent mixture of [FeII(phen)2(CN)2]∙2H2O, YbIII(CF3SO3)3, and 4-pyridone (see Materials and Methods). After the preliminary characterization of the product by CHNS elemental analysis, SEM-EDX microanalysis of metal ions, IR spectroscopy, and thermogravimetry (Figures S1–S2 and Table S1, Supporting Information), its crystal structure was determined using a single-crystal X-ray diffraction (SC-XRD) method, which revealed that 1∙MeCN crystallizes in the monoclinic C2/c space group (Tables S2 and S3, Figure 1 and Figure 2 and Figures S3 and S5). 1∙MeCN is composed of cyanido-bridged {YbIIIFeII2}3+ molecular cations, trifluoromethanesulfonate counter-ions, and acetonitrile (MeCN) solvent molecules, which results in the composition of {YbIII(4-pyridone)4 [FeII(phen)2(CN)2]2}(CF3SO3)3∙2MeCN (Figure 1a). Each {YbIIIFeII2}3+ unit is built using one Yb(III) center surrounded by four 4-pyridone ligands and two axially positioned bridging cyanido ligands of neutral cis–[FeII(phen)2(µ–CN)(CN)] complexes. Both Fe(II) as well as [YbIII(4–pyridone)4(µ–NC)2]+ complexes reveal a slightly distorted octahedral geometry (Figure 1a and Figure S3a, Table S7). The FeII–Nphen/CCN bond distances lie within the 1.89–2.00 Å range, which are typical values for octahedral low-spin Fe2+ complexes (Table S3) [65]. In the supramolecular network of 1∙MeCN, the cationic {YbIIIFeII2}3+ complex is arranged collinearly along the c crystallographic axis (Figure 2a and Figure S4). Due to the formation of face-to-face π–stacking interactions between phen ligands of adjacent molecules, as well as collective 4-pyridone(1) phen(2) phen(1) 4-pyridone(2) π–π interactions, densely packed supramolecular layers are generated perpendicular to the b crystallographic axis (Figures S4 and S5). These positively charged layers are separated by weakly H-bonded trifluoromethanesulfonate anions and MeCN solvent molecules. The whole framework is additionally stabilized by weak N–H N hydrogen bonds between 4–pyridone and terminal cyanido ligands.
For the detailed investigation of the structural features governing magnetic relaxation effects in trinuclear {YbIIIFeII2}3+ ions, we tested the formation of several analogs of 1∙MeCN using more expanded nitrile solvents of crystallization, including acrylonitrile (AcrCN), propionitrile (PrCN), and malononitrile (MalCN). By modifying the synthetic procedure (see Materials and Methods), dark red crystals of 1∙AcrCN, 1∙PrCN, and 1∙MalCN crystalline phases were obtained. They were characterized by elemental analyses, IR spectra and TGA, and their crystal structures were determined using a SC-XRD analysis (Figure 1 and Figure 2, and Figures S1–S3, and S6–S12, Tables S2 and S4–S6). The obtained systems are very similar to 1∙MeCN, crystallizing in the monoclinic C2/c space group and consisting of isomorphous {YbIIIFeII2}3+ units, trifluoromethanesulfonate counter-ions, and respective nitrile solvent molecules (except for 1∙MalCN also incorporating crystallization MeOH molecules). Thus, their composition is depicted by the general formula of {YbIII(4-pyridone)4[FeII(phen)2(CN)2]2}(CF3SO3)3∙solv (solv = 2AcrCN in 1∙AcrCN, 2PrCN in 1∙PrCN, and 2MalCN∙1MeOH in 1∙MalCN). Metric parameters and coordination geometries of {YbIIIFeII2}3+ entities are very similar in the whole series of 1∙MeCN, 1∙AcrCN, 1∙PrCN, and 1∙MalCN (Figure 1, Tables S3–S7). The structural differences are mainly related to the crystallization solvent content affecting features of supramolecular frameworks (Figure 2 and Figure S12). In all compounds, solvent molecules are located between the supramolecular cationic layers of cyanido-bridged entities aligned within the ac crystallographic plane (Figure 2a). Starting from the smallest used nitrile of MeCN in 1∙MeCN, through larger AcrCN in 1∙AcrCN to the largest PrCN in 1∙PrCN, the systematic increase in the a and b lattice constants and a slight decrease in the c lattice constant are observed (Figure 2b). Surprisingly, the application of the most sterically expanded MalCN, even accompanied by additional MeOH molecules in 1∙MalCN, drastically reduces the cell parameters of a and b while increasing the last one. This results in the pronounced differences in the closest distances between neighboring Yb3+ ions (Figure 2b and Figure S12, Table S8). As the nitrile size increases within the series of 1∙MeCN, 1∙AcrCN, and 1∙PrCN, there is an increase of the closest Yb Yb distances along all crystallographic directions, except the [001] one where this distance decreases similarly to the change of the c lattice constant. In 1∙MalCN, along [011] and [101] directions, there is compliance with the first trend; however, in the case of other directions, there are visible inconsistencies. The most important feature seems to be the reduction of the Yb Yb distances along the [110] and [10 1 ¯ ] directions, resulting in the closer alignment of Yb centers with the six of eight nearest lanthanide ions within the ac crystallographic plane. The above changes in the crystal structures related to the variation of the solvent are reflected in magnetic properties (see below). Changes in the position of the complexes within the ac plane should be particularly emphasized, as within this plane the rigid architecture of π-stacking interactions, possibly transmitting intermetallic dipolar interactions [66], is well-developed. The validity of the structural models for the bulk samples of all compounds was confirmed by the powder X-ray diffraction method (Figure S13), which also proves the phase purity of all reported materials.

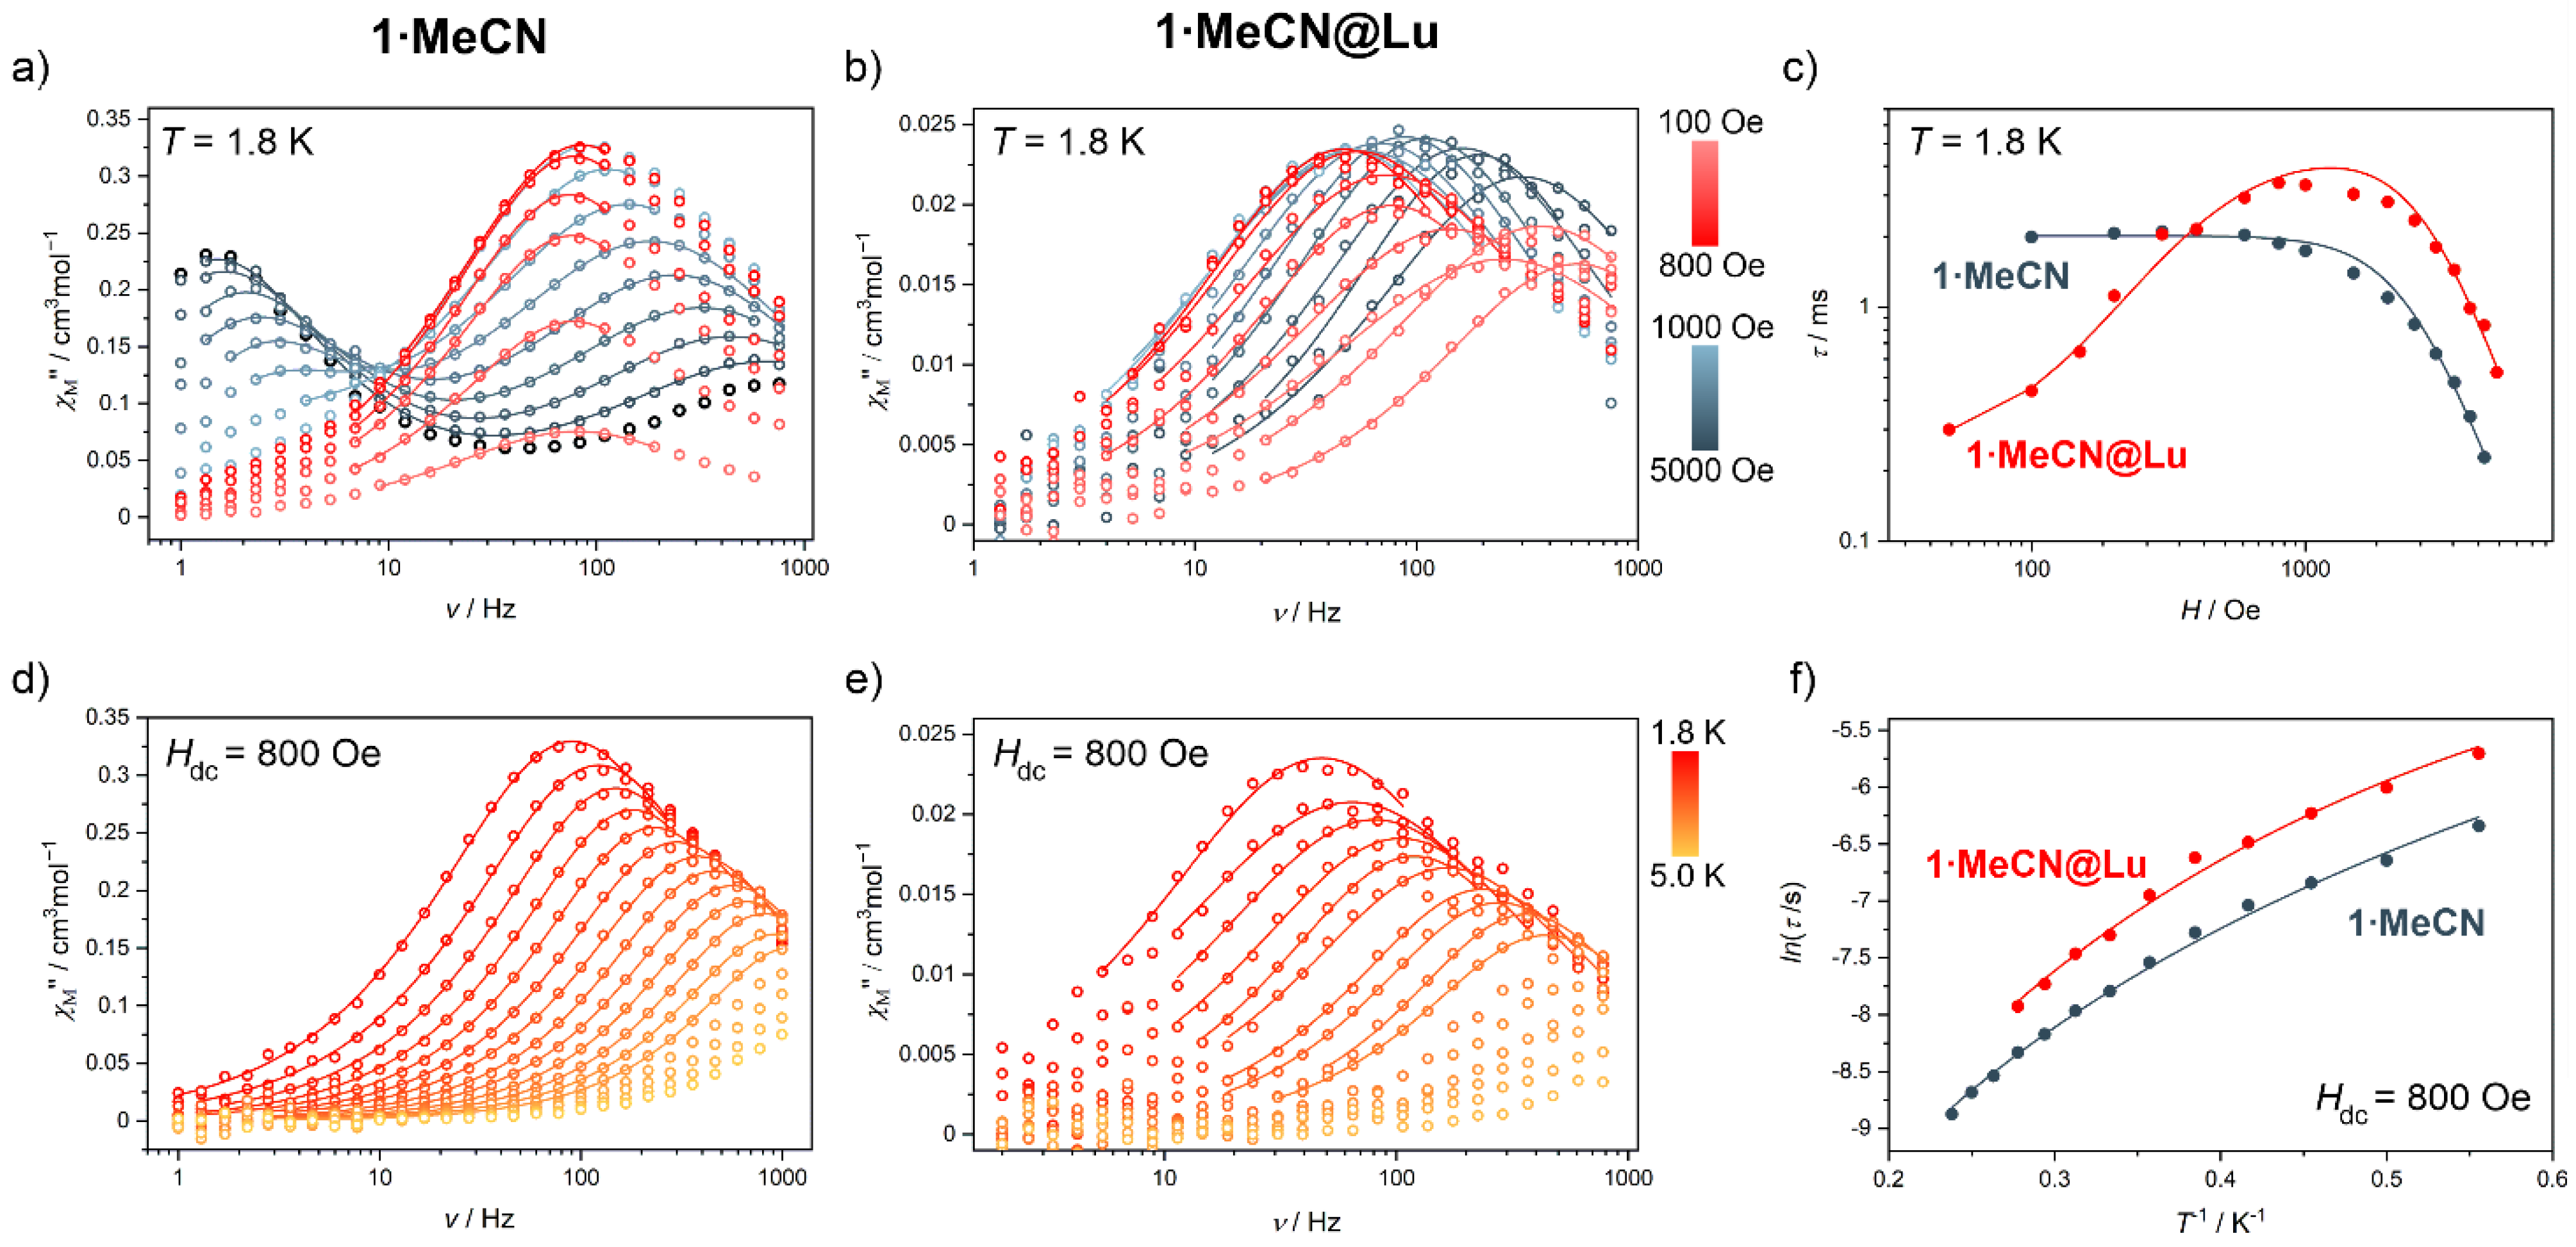
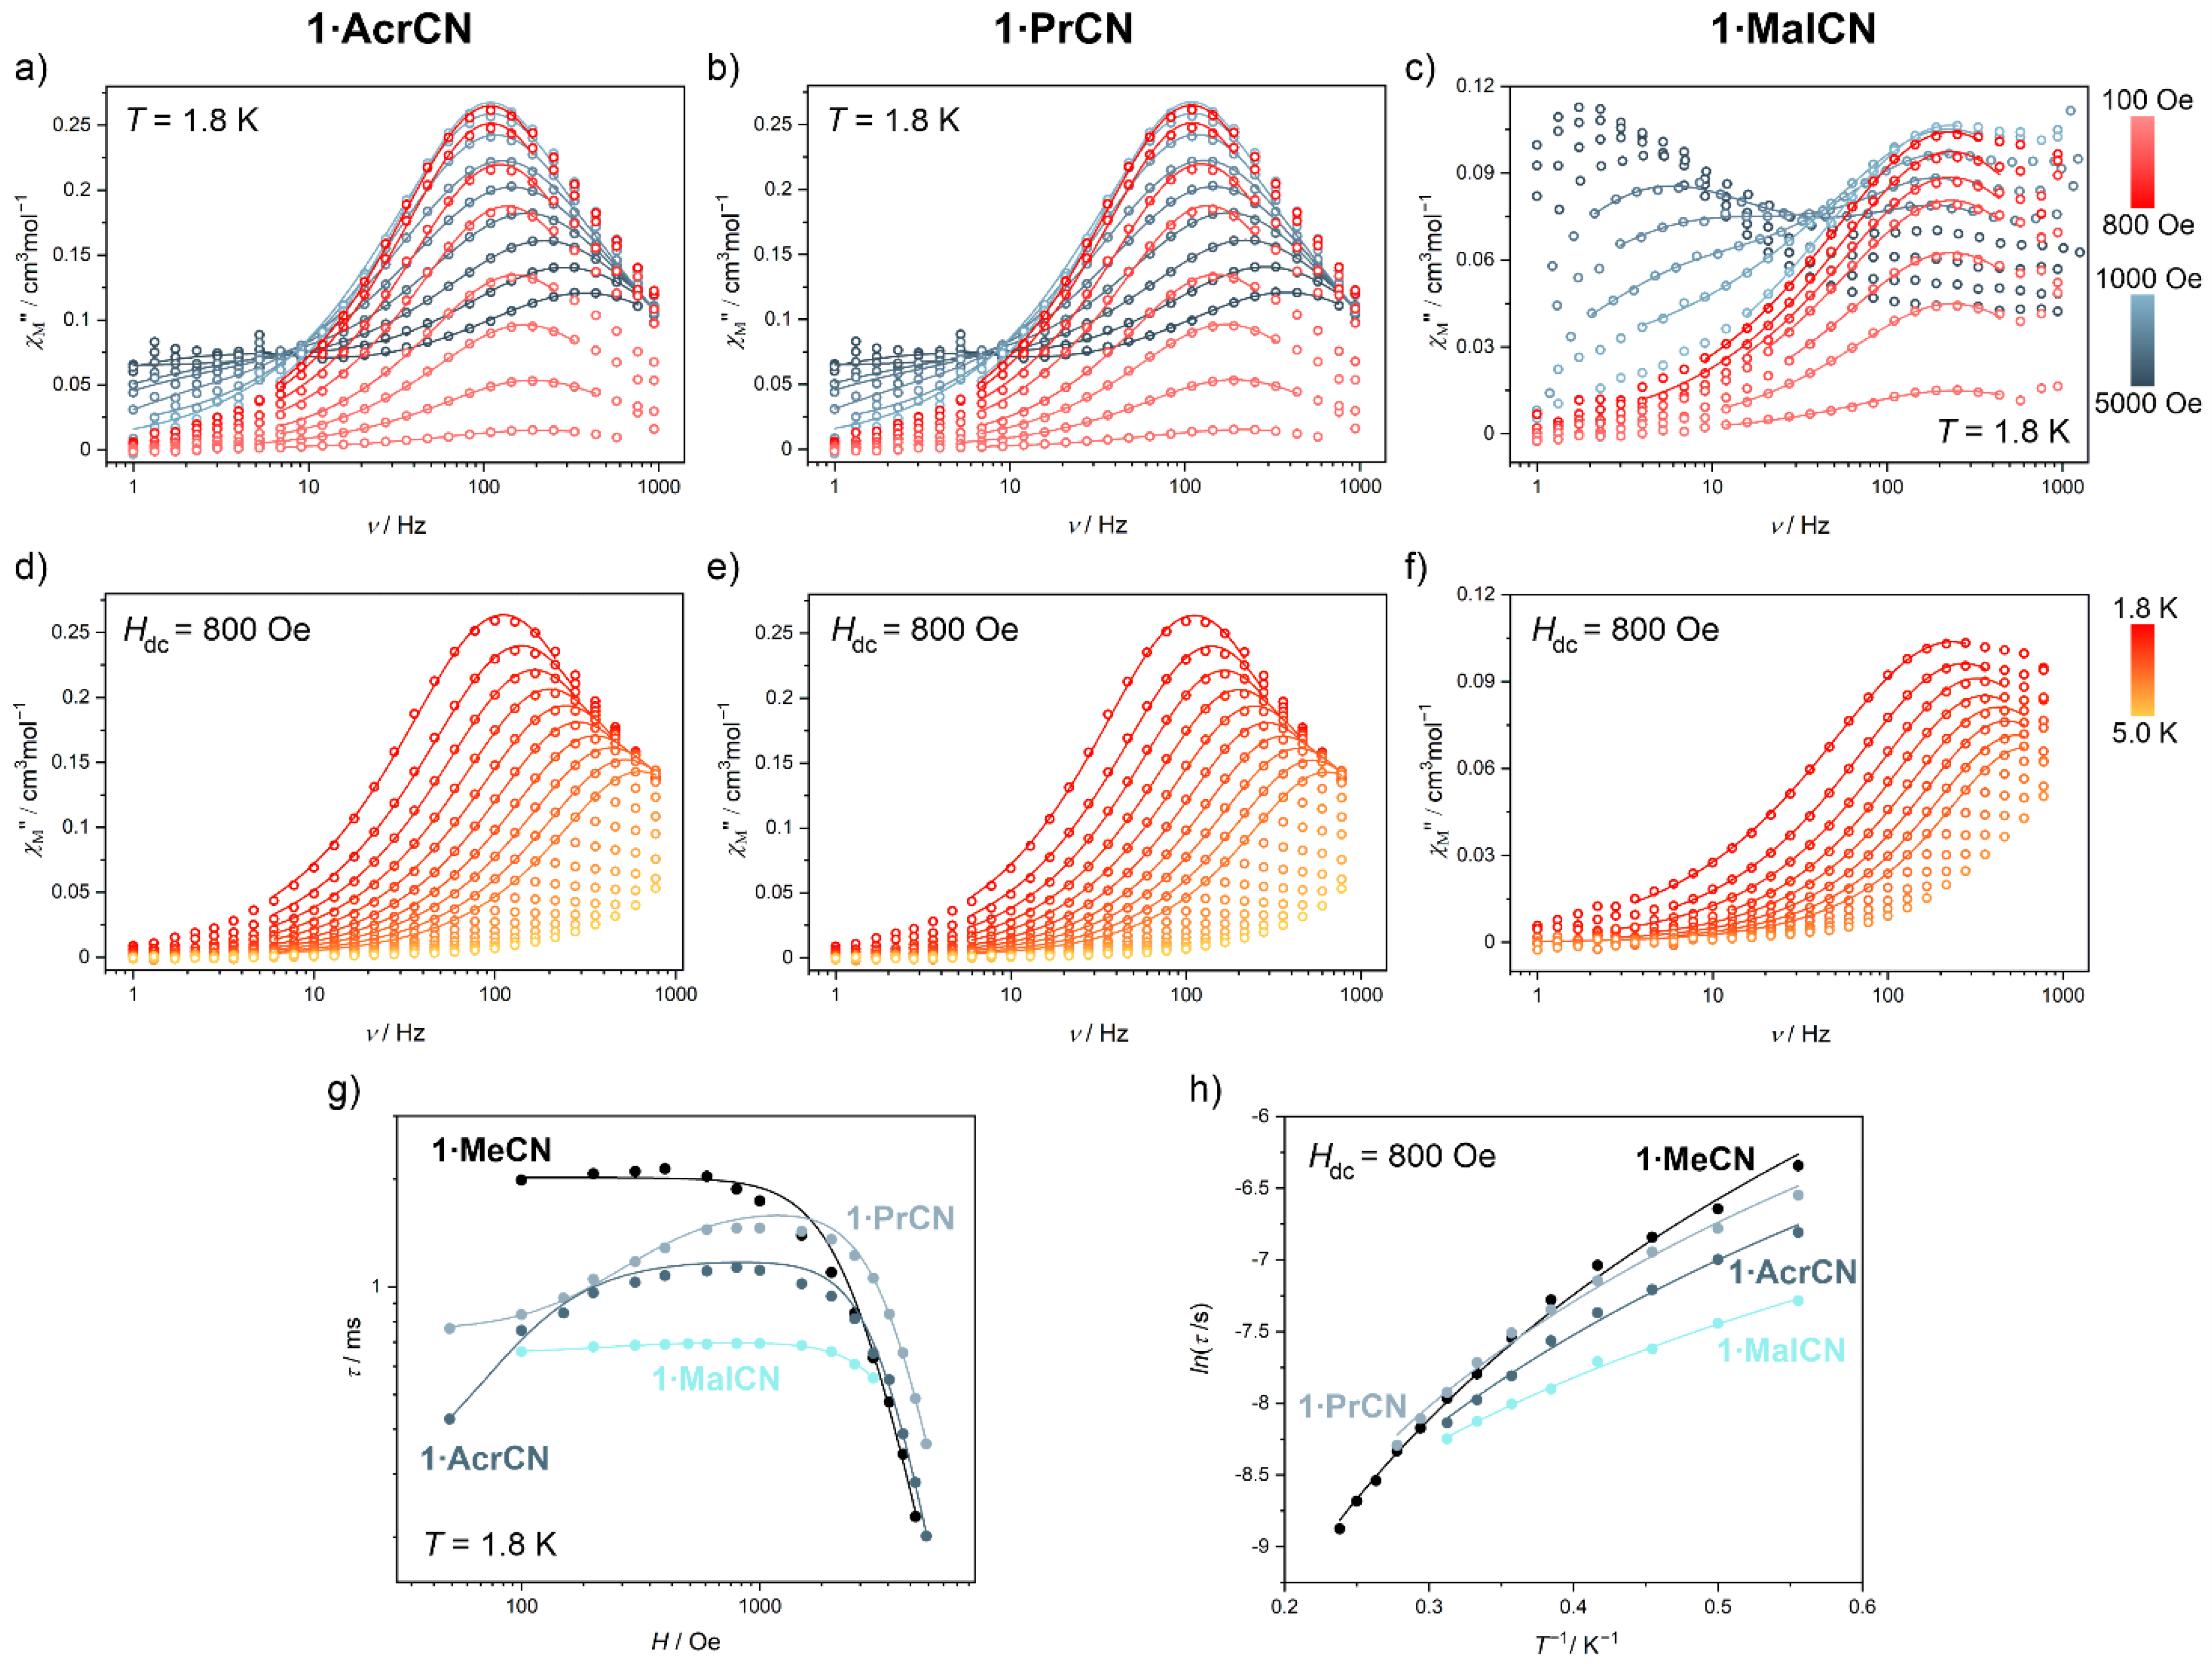
2.2. Magnetic Properties

Due to the presence of YbIII complexes in 1∙MeCN, we investigated its magnetic properties including direct-current (dc) and alternate-current (ac) magnetic studies (Figure 3 and Figures S14–S18). At 300 K, the magnetic susceptibility-temperature product, χMT, reaches 2.45 cm3mol–1, which is close to the theoretical value of 2.6 cm3mol–1 expected for a free Yb3+ ion with a 2F7/2 ground multiplet (Figure S14a,b) [33,38,48]. Upon cooling, the χMT value gradually decreases as a result of the thermal depopulation of mJ sublevels of the ground multiplet, finally reaching 1.2 cm3mol–1 at 1.8 K. The monotonous course of the χMT(T) curve suggests the lack of strong magnetic interactions down to 1.8 K due to the separation of paramagnetic Yb(III) centers by diamagnetic [FeII(phen)2(CN)2] complexes and 4-pyridone ligands. Field dependence of magnetization at 1.8 K shows a featureless increase of the signal upon increasing the field up to 1.6 μB at 70 kOe, which is in the range typically observed for isolated YbIII complexes [33,38,48], and supports the lack of magnetic correlation in the system (Figure S14c,d).
As a next step, the alternate–current (ac) magnetic characteristics were gathered for 1∙MeCN, clearly indicating the presence of slow magnetic relaxation effect of embedded YbIII complexes (Figure 3, Figures S15 and S16). Due to the strong quantum tunneling of magnetization (QTM) typically observed for most of YbIII–based SMMs, slow magnetic relaxation under a zero dc field was not observed [53,67]. However, the QTM was suppressed by an external dc magnetic field for even a small value of 100 Oe (Figure 3a). The dc-field variable frequency dependences of out–of–phase (χM″) magnetic susceptibility clearly showed two maxima detectable in the 1–1000 Hz range, the high frequency one appearing immediately from 100 Oe, and the second, low frequency appearing above 1000 Oe (Figure 3a and Figure S15). The maximum at high frequencies did not change significantly upon changes of dc field in the range of 100–1000 Oe, while for higher fields it underwent a shift towards higher frequencies. This indicates that the QTM is quickly quenched by the dc field, while high fields accelerate the relaxation by inducing a field-induced direct process. Thus, the faster relaxation reveals typical behavior for field-induced YbIII-based SMMs. In contrast, the second maximum of the slower relaxation process appeared only at higher dc fields and gradually changed the position by moving to lower frequencies upon increasing the external dc field. This suggests that its presence is related to the presence of some unquenched dipolar interactions between Yb centers, especially in the case of the compound 1∙MeCN consisting of only one crystallographically independent Yb complex. To support this interpretation, we also investigated magnetic properties of the magnetically diluted sample of 1∙MeCN built of YbIII complexes dispersed in the diamagnetic LuIII-based crystalline matrix. Such a diluted compound, 1∙MeCN@Lu was characterized analogously to 1∙MeCN, and its isostructurality was confirmed by the powder X–ray diffraction method (see the Experimental section and Figure S13). The concentration of Yb(III) in the diamagnetic matrix (Yb0.07Lu0.93) was determined by a SEM-EDX microanalysis (Table S1). The ac magnetic data for 1∙MeCN@Lu also show a field-induced magnetic relaxation represented by a single χM″(ν) maximum, which also shifted towards slightly lower frequencies when compared with 1∙MeCN (Figure 3b). This confirms that the slower relaxation in 1∙MeCN is due to the dipole-dipole interactions between insufficiently separated YbIII centers in the undiluted sample. Further proof of this interpretation is given by the temperature-dependence of dc χM″(ν) maxima related to the slower relaxation investigated for 1∙MeCN at a high dc field of 6 kOe (Figure S16e) which shows the gradual disappearance of this maximum on heating without the characteristic shift to higher frequencies [68]. To discuss the single-ion properties of YbIII centers, we focused on the faster relaxation process in 1∙MeCN and its temperature dependence through an investigation of the optimal dc field of 800 Oe related to the equilibrium between QTM and direct relaxation routes (Figure 3d and Figure S16). This condition allowed us to observe the displacement of the χM″ maxima towards higher frequencies in the 1.8−5.0 K range. Both H– and T–variable frequency dependences of χM″ were fitted using a generalized Debye model to extract the relaxation times (see comment to Figures S15–S24). The Equation (1) was used to parametrize the field- and T-dependences of relaxation time (Figure 3c,f, Figures S15 and S16):
τ 1 = B R a m a n T n + a ( 1 + b H 2 ) + A d i r e c t H m T
where the first term describes the Raman relaxation, the second represents the QTM, and the last reflects a field–induced direct process [33,38,48,61]. The Orbach relaxation pathway is usually inadequate for YbIII-based SMMs, thus it was removed from consideration. This assumption was supported by the results of ab initio calculations (see below). To fit the relaxation time using the Equation (1), the parameters of QTM and direct processes were firstly extracted from the H–dependence of relaxation time and used as a starting point for simultaneous fit of both H- and T-dependences. The resulting parameters for all processes lie within the limits expected for lanthanide molecular nanomagnets (Table 1) with the general case of the broadly variable n power of Raman relaxation due to the contributions of various phonon modes, and the variable m parameter of a direct process due to the hyperfine coupling [62,63,64,69,70]. The analogous procedure was performed for 1∙MeCN@Lu (Figure 3, Figures S17 and S18, Table 1). As we investigated the T-variable ac magnetism at the optimal dc field, the magnetic relaxation for both 1∙MeCN and 1∙MeCN@Lu was found to be dominated by the Raman relaxation. This process is depicted by the BRaman and n parameters of 81.68(5) s–1K–3.07 and 3.07(1), respectively, for 1∙MeCN which moderately change to 25.32(3) s–1K–3.61 and 3.61(1), respectively, upon magnetic dilution in 1∙MeCN@Lu. This can be partially explained by the non-negligible change in the phonon modes scheme occurring upon replacing YbIII with LuIII centers. However, this difference in the Raman parameters can be overestimated as the overall courses of ln(τ) versus T–1 plots for 1∙MeCN and 1∙MeCN@Lu mainly differ by the constant value, which can be assigned to the expected weakening of the QTM effect upon magnetic dilution (Figure 3f) [35].
Despite excluding the Orbach relaxation process, we adapted the classical Arrhenius law of the T-activated process for the high–temperature range of the lnτ(T–1) plots:
l n ( τ ) = U e f f . k B T + l n ( τ 0 )
where Ueff is the effective energy barrier and τ0 is the microscopic attempt time. This procedure is often used to compare the magnetic properties of lanthanide SMMs, even if very different relaxation processes operate in the system. The fitting of the linear parts of the lnτ(T–1) plots for 1∙MeCN and 1∙MeCN@Lu provided similar and relatively low values of Ueff = 12.5 K (8.69 cm–1) and 11.5 K (7.99 cm–1) for 1∙MeCN and 1∙MeCN@Lu, respectively, indicating moderate magnetic anisotropy of the generated YbIII complexes [67].
To further discuss magnetic relaxation in 1∙MeCN, we determined the crystal field effect on YbIII complexes using the ab initio calculations of a CASSCF/RASSI/SINGLE_ ANISO type performed within an OpenMolcas package (Tables S9–S12 with the comment in the Supporting Information). For these calculations, we used the trinuclear {YbFe2} unit without non-coordinated CF3SO3 anions and solvent molecules (Figure 1a). The resulting whole energy splitting of the 2F7/2 ground multiplet is close to 500 cm–1, that is 509.5 cm–1 or 551.2 cm–1 for the small 1S and large 1L basis sets, respectively (Tables S9–S11). These values lie in the range expected for six–coordinated octahedral Yb3+ complexes [53,61]. Using the 1L model, the ground sub-level was found to be composed of the mixture of |J, mJ〉 states of |7/2, ±7/2〉 (predominant contribution) and |7/2, ±1/2〉, and can be described by the dominant gz of 5.95 but with the non-negligible values of gx and gy factors of 0.56 and 1.34, respectively (Table S11). This shows a significant magnetic anisotropy of YbIII complexes in 1∙MeCN, revealing a desired magnetic easy axis type. It can be correlated with the arrangement of four 4-pyridone ligands, bearing a partial negative charge on donor O-atoms at the equatorial positions of the YbIII octahedral coordination sphere, as such an alignment is expected to stabilize the magnetic axiality in the YbIII complexes, revealing prolate electron density [71]. As the result, the magnetic easy axis is lying nearly perpendicular to the plane formed by four O-atoms of pyridine ligands, thus it is arranged close to the directions given by cyanido bridges (Figure 1a). However, this axiality is not perfect, as illustrated by the non-negligible values of gx and gy factors as well as by the significant admixture of |7/2, ±1/2〉 functions, which in particular facilitate the magnetic transition between two states of the ground Kramers doublet (due to the operating selection rule of ΔmJ = 1 within the first-order perturbation theory). This explains the occurrence of a strong QTM effect and the lack of slow magnetic relaxation at the zero dc field. The first excited Kramers doublet of the 2F7/2 ground multiplet is located more than 250 cm–1 above the ground state (Tables S10 and S11), which is much higher than the experimental energy barrier estimated using the Arrhenius law (Table 1). Moreover, its application for the fitting of the T-dependence of overall magnetic relaxation gives unrealistic values for other parameters. All these strongly indicate the lack of Orbach relaxation pathway in 1∙MeCN and the dominance of a Raman relaxation route. The validity of performed calculations is supported by the comparison with the experimental dc magnetic data, which are very well reproduced (Figure S14b,d). The ab initio calculations also give insight into the energy of the excited 2F5/2 multiplet (Table S12). The bottom of the excited state in the 1L model is situated at 0.5 cm–1, giving the estimation of emission wavelength (to the bottom of the ground multiplet) of circa 965 nm, which suits the experimental emission relatively well (see below).
The ac magnetic properties of 1∙AcrCN and 1∙PrCN are generally similar to those presented for 1∙MeCN (Figure 4 and Figures S19–S22). In the frequency dependences of the χM″ magnetic susceptibility, the relaxation in both analogs is observed in the range of the applied dc field of 100–5000 Oe at a higher frequencies regime. However, 1∙AcrCN and 1∙PrCN do not show the slower relaxation process which was observed in 1∙MeCN and assigned to the dipole-dipole interactions between YbIII complexes, with only a very weak tail on the χM″(ν) plots at lower frequencies. Such a feature can be explained by the better separation of YbIII complexes in the crystal structure due to the application of more expanded nitrile solvent molecules, AcrCN and PrCN (Figure 2). In contrast, in 1∙MalCN, two very distinct magnetic relaxation processes are observed in the ac magnetic characteristics under the applied dc field (Figure 4c, Figures S23 and S24). Moreover, the χM″(ν) maxima assignable to the slower relaxation of a dipolar origin are stronger than in 1∙MeCN. This suggests that the magnetic isolation of YbIII complexes in 1∙MalCN is the worst within the whole investigated family of compounds. This can be correlated with the detailed analysis of the respective supramolecular frameworks, indicating the shortest Yb–Yb distances along the [110] and [10 1 ¯ ] directions in 1∙MalCN that can lead to the strongest dipolar interactions (see Structural Studies and Figure 2 for details).
Apart from the slower relaxation appearing at high dc fields in 1∙MeCN and 1∙MalCN, all compounds exhibit the relaxation, which is strongly temperature-dependent. It was investigated at the optimal dc field of 800 Oe in the range of 1.8–5 K (Figure 3d and Figure 4d–f). All resulting H– and T–variable frequency dependences of ac susceptibility were fitted using the generalized Debye model to extract the relaxation times which were further analyzed by following the Equation (1) (Figure 4g,h). As the course of ac magnetic data was similar within the whole series, we excluded the Orbach relaxation from the consideration in all compounds, as it was completed and discussed with the support of ab initio calculations for 1∙MeCN (see above). The resulting best-fit parameters are presented in Table 1, while the differences between obtained compounds are visualized in Figure 4g,h. Similarly to 1∙MeCN, the magnetic relaxation of 1∙AcrCN, 1∙PrCN, and 1∙MalCN is dominated by the Raman relaxation, thus the varying parameters of BRaman and n represent the modulation of slow magnetic relaxation effect by the nitrile solvent change. The BRaman parameter is the smallest, 81.68(5) s–1K–3.07, for 1∙MeCN, then increases significantly for 1∙AcrCN (208.28(2) s–1K–2.37) and 1∙PrCN (128.09(1) s–1K–2.61), and reaches the highest value of 527.08(2) s–1K–1.68 for 1∙MalCN, which directly leads to the slowest relaxation time at 1.8 K for 1∙MeCN, faster for 1∙AcrCN and 1∙PrCN, and the fastest for 1∙MalCN (Figure 4h). However, the power n of Raman relaxation reveals the opposite trend; the highest value of 3.07(1) was observed for 1∙MeCN, lower for 1∙AcrCN (2.37(1)) and 1∙PrCN (2.61(1)), and the lowest value of 1.68(4) was found for 1∙MalCN. This means that the weakest T-dependence of Raman relaxation was observed in 1∙MalCN, thus this compound should show the slowest relaxation times at the temperatures higher than the investigated range of 1.8–5 K. Nevertheless, a significant influence of the nitrile solvent content was found on the Raman relaxation features, which could be assigned to the variable phonon modes schemes [62,63,64,72]. In this context, the increasing trend of the BRaman parameter may be correlated with the increasing amount of available phonon modes going from simple MeCN, to more expanded AcrCN and PrCN, up to the most complex MalCN molecules accompanied by MeOH solvent. On the other hand, the decreasing trend of the power n may be attributed to the rising of the energies of critical vibrational modes engaged in the magnetic relaxation going within the series of 1∙MeCN, 1∙AcrCN, 1∙PrCN, and 1∙MalCN. However, the detection of such critical phonon modes is a very difficult task and stays beyond the scope of this article [73]. The variation of the power n of the Raman relaxation results in the variation of effective energy barriers, Ueff, obtained from the Arrhenius-type plots (Equation (2), Table 1). The highest value of Ueff of 12.50(58) K was found for 1∙MeCN, lower for 1∙AcrCN (7.86(27) K) and 1∙PrCN (10.28(22) K), and the smallest value of 4.83(31) K was found for 1∙MalCN, indicating the overall weakening of T-dependent slows magnetic relaxation effects in the series of 1∙MeCN, 1∙PrCN, 1∙AcrCN, and 1∙MalCN.

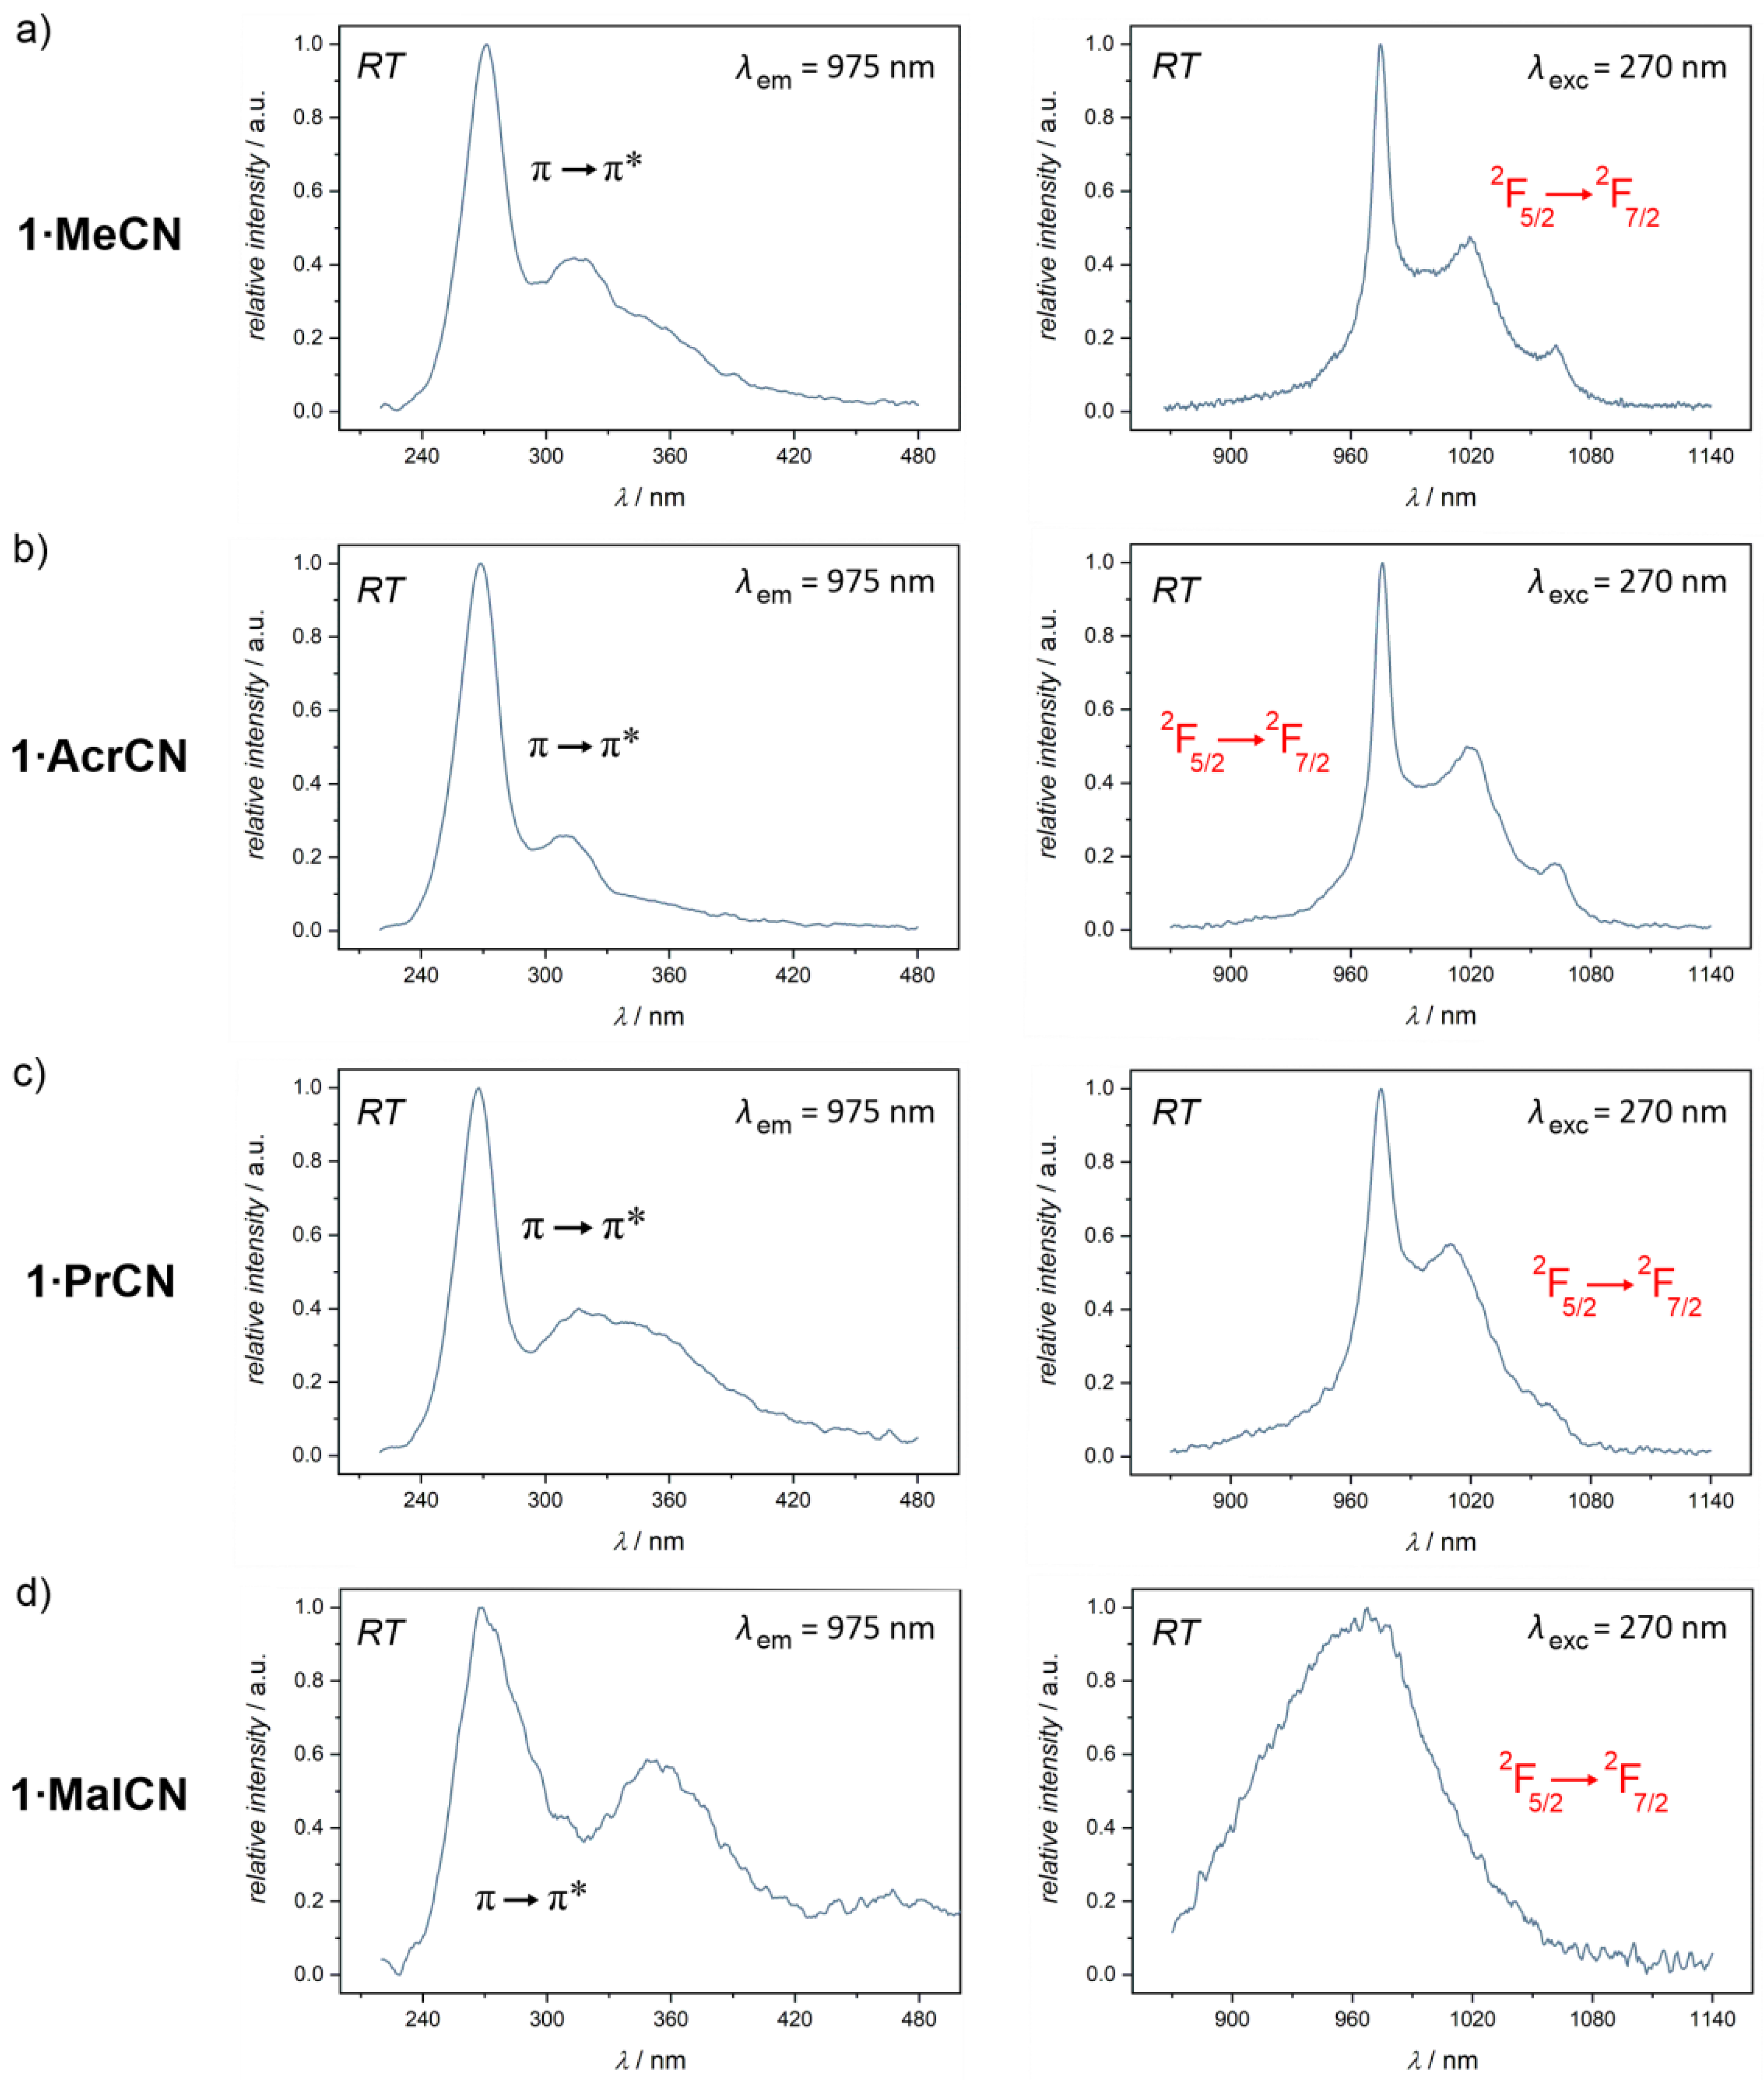
2.3. Optical Studies

Optical properties of 1∙MeCN, 1∙AcrCN, 1∙PrCN, and 1∙MalCN, including solid-state UV-vis-NIR absorption and photoluminescence characteristics, are presented in Figure 5 and Figures S25 and S26 (Supporting Information). All compounds exhibit strong absorption in the UV-vis range, which is responsible for their dark red color (Figure S25). The absorption spectrum consists of two main parts, including the strong band located at higher wavelengths (380–650 nm) corresponding to the metal-to-ligand charge transfer (MLCT) from Fe(II) centers to phen ligands within [Fe(phen)2(CN)2] units [55,56,57,58]. In comparison to the [Fe(phen)2(CN)2]∙2H2O precursor, the CT band is shifted to lower wavelengths. This is related to the coordination of the lone electron pair located on the N-atom of the CN ligand to Yb3+ ions, which strengthens the π–bonding interaction between Fe2+ and CN ions but weakens the interaction between the Fe2+ ion and the phen ligand. The second, higher energy band observed in the UV range of 220–280 nm is related to the sum of spin–allowed π–π* transitions of 1,10-phenanthroline and 4-pyridone ligands [35,74]. Following the absorption spectra, the powder samples of all compounds were irradiated by the UV light of 270 nm to investigate the photoluminescent properties (Figure 5). 1∙MeCN, 1∙AcrCN, and 1∙PrCN exhibited well-developed room-temperature NIR emission with the main maximum at circa 975 nm, originating from the 2F5/2 2F7/2 f-f electronic transition of Yb3+ ions (Figure 5a–c) [19,38,53]. The related excitation spectra consisted of two main components, the first ranging from 240 to 280 nm and the second ranging from 280 to 380 nm of the UV range. Both bands corresponded to the ligands spin–allowed π–π* transitions observed in the absorption spectrum. The absorption of 4-pyridone was represented by the main peak of the much narrower UV range (220–280) with a maximum at circa 255 nm, and the absorption spectrum of phen consisted of a few bands ranging from the deep UV to 380 nm with the maxima at 260 and 330 nm [35,74]. Therefore, it can be postulated that this NIR emission for the obtained compounds is realized by the energy transfer process from organic ligands to Yb3+ ions. On the other hand, there were no clear bands in the excitation spectra that could be assigned to the MLCT states of the [Fe(phen)2(CN)2] units (they should lie in the visible range), suggesting these states are not sensitizing the YbIII-based emission. However, they did not show a disturbing impact, as the effective sensitization of NIR YbIII emission in 1∙MeCN, 1∙AcrCN, and 1∙PrCN by organic ligands led to a pronounced signal that was easily detectable at room temperature. At low temperatures (77 K), four distinct bands located at circa 975 nm (~10260 cm–1), 1020 nm (~9815 cm–1), 1050 nm (~9530 cm–1), and circa 1060 nm (~9410 cm−1) were observed (Figure S26). They could be tentatively assigned to four expected transitions from the lowest mJ level of the excited 2F5/2 multiplet to four sublevels of the ground 2F7/2 multiplet. However, they suggested a much larger energy scale of the crystal field splitting of the ground multiplet (~850 cm–1) than found in the ab initio calculations (~550 cm–1, see above) which indicates that part of these bands, e.g., those at higher energies, can be at least partially related to the remaining hot-bands from the higher-lying sublevel of the emissive multiplet. Both high– and low–temperature emission spectra of 1∙MalCN differ significantly from the emission spectra of other compounds (Figure 5d and Figure S26d). They consist of a single broad band covering the 870–1050 nm range with the maximum at 967 nm, also revealing a noticeably lower intensity. The assignment of this emission was identical to other compounds, as proven by the analogous shape of excitation spectra. However, the weaker signal and its broadband character are special and could be assigned to the distinguishable structure of 1∙MalCN (Figure 1 and Figure 2). In all compounds, the nitrile solvent molecules interact by weak H–bonds with 1,10–phenanthroline ligands and/or trifluoromethanesulfonate anions. Unlike the rest, additional methanol molecules are also present in 1∙MalCN. They directly interact with 4-pyridone ligands that are coordinated to Yb3+ ions. Thus, the additional O–H oscillators appearing in the vicinity of the NIR-emissive ion may lead to the weakening and broadening of the observed luminescent signal.

3. Materials and Methods

3.1. Reagents and Materials

All commercially available reagents used for syntheses of precursors and presented compounds, including ammonium iron(II) sulfate ((NH4)FeII(SO4)2∙6H2O; 99%, CAS 7783-85-9, Sigma Aldrich), 1,10-phenanthroline (phen; 99%, CAS 66-71-7, Sigma Aldrich), potassium cyanide (KCN; 96%, CAS 151-50-8, Acros Organics), ytterbium(III) trifluoromethanesulfonate (Yb(CF3SO3)3, ytterbium(III) triflate; 99.99%, CAS -04-5, Sigma Alrich), 4-pyridone (alternatively named 4-hydroxypyridine or 4-pyridinol; 99%, CAS: 626-64-2, Sigma-Aldrich), malononitrile (MalCN; 99%, CAS 109-77-3, Sigma Aldrich), and all employed solvents, were used without further purification. The [FeII(phen)2(CN)2]∙2H2O precursor was prepared according to procedures from the literature [75,76]. In general, a dark red solution obtained by mixing (NH4)2FeII(SO4)2∙6H2O with phen ligand in distilled water was heated just below the boiling point, and then, it was treated with the KCN-containing water solution to generate the dark violet precipitate [75]. The crude product was purified by recrystallization using the H2SO4/H2O mixture to obtain brown microcrystals [76].

3.2. Synthetic Procedures and Basic Characterization

Synthesis of 1∙MeCN: The 15.5 mg (0.025 mmol) portion of Yb(CF3SO3)3 was dissolved together with the 23.3 mg (0.25 mmol) portion of the 4-pyridone ligand in 2 mL of the methanol/acetonitrile (MeOH/MeCN, 1:1, v/v) mixture to obtain solution A. Then, the 12.6 mg (0.025 mmol) portion of [FeII(phen)2(CN)2]∙2H2O was dissolved in 2 mL of the MeOH/MeCN (1:1 v/v) mixture, and the resulting solution B was added dropwise to the solution A. After mixing for 1 min, diethyl ether (Et2O) was carefully layered on the top of the resulting deep red solution. After three days, the large number of dark red needle crystals of 1∙MeCN appeared. The whole crystalline product was collected by filtration and washed with the small portions of Et2O to obtain 22 mg of the product (yield based on Fe: 87%). The composition of {YbIII(4-pyridone)4[FeII(phen)2(CN)2]2}(CF3SO3)3∙2MeCN was determined by a single-crystal X-ray diffraction (SC-XRD) experiment, while the phase purity was proven by a powder X-ray diffraction (P-XRD) method (Figure S13), all supported by the results of CHNS elemental analysis, IR spectroscopy, and thermo- gravimetric (TG) studies. IR spectrum (Figure S1, KBr, cm–1). C≡N stretching vibrations: 2293w, 2252w, 2092s, 2074s, 2062w, and 2029w, indicating the presence of acetonitrile solvent molecules as well as both bridging and terminal cyanide ligand modes. Broader analysis of other peaks in the IR spectrum can be found in the Supporting Information. CHNS elemental analysis. Anal. Calcd. for C79H58F9Fe2N18O13S3Yb (MW = 2019.3 g∙mol–1): C, 46.99%; H, 2.90%; N, 12.49%; S, 4.76%. Found: C, 47.11%; H, 2.86%; N, 12.25%; S, 4.54%. TG (Figure S2): loss of 2 MeCN molecules per {YbFe2} unit, calcd.: 4.1%; found: 4.0%.
Synthesis of 1∙AcrCN. The synthetic procedure for 1∙AcrCN was analogous to that described for 1∙MeCN, with the exception of using the methanol/acrylonitrile (MeOH/AcrCN, 1:1, v/v) mixture as a solvent instead of the MeOH/MeCN (1:1 v/v) mixture. Dark red needle crystals of 1∙AcrCN appeared after three days. The crystalline product was collected by filtration and washed with Et2O, to give 21 mg of the product (yield based on Fe: 82%). The composition of {YbIII(4-pyridone)4[FeII(phen)2(CN)2]2} (CF3SO3)3∙2AcrCN, was determined by the SC-XRD technique, while the phase purity was proven by the P-XRD method (Figure S13), all supported by the CHNS elemental analysis, IR spectroscopy, and TG studies. IR spectrum (Figure S1, KBr, cm–1). C≡N stretching vibrations: 2256w, 2227w, 2091s, 2067w and 2028w, indicating the presence of AcrCN solvent molecules as well as both bridging and terminal cyanide ligands. The analysis of other peaks of the IR spectrum can be found in the Supporting Information. CHNS elemental analysis. Anal. Calcd. for C81H62F9Fe2N18O13S3Yb (MW = 2043.4 g∙mol–1): C, 47.61%; H, 2.86%; N, 12.34%; S, 4.71%. Found: C, 47.38%; H, 2.93%; N, 12.17%; S, 4.57%. TG (Figure S2): loss of 2 AcrCN molecules per {YbFe2} unit, calcd.: 5.2%; found: 5.6%.
Synthesis of 1∙PrCN: The synthetic procedure for 1∙PrCN was analogous to that described for 1∙MeCN, with the exception of using the methanol/propionitrile (MeOH/PrCN, 1:1, v/v) mixture as a solvent instead of the MeOH/MeCN (1:1 v/v). Dark red needle crystals of 1∙PrCN appeared after 3 days. The crystalline product was collected by filtration and washed with Et2O, to give 22 mg of the product (yield based on Fe: 86%). The composition of {YbIII(4-pyridone)4][FeII(phen)2(CN)2]2}(CF3SO3)3∙2PrCN, was deduced from the SC-XRD experiment, while the phase purity was proven by the P-XRD method (Figure S13), all confirmed by the CHNS elemental analysis, IR spectra, and TG studies. IR spectrum (Figure S1, KBr, cm–1). C≡N stretching vibrations: 2245w, 2091s, 2066w, and 2023w, indicating the presence of PrCN solvent molecules as well as both bridging and terminal cyanide ligand modes. Other peaks of the IR spectrum are discussed found in the Supporting Information. CHNS elemental analysis. Anal. Calcd. for C81H58F9Fe2N18O13 S3Yb (MW = 2043.4 g∙mol–1): C, 47.61%; H, 2.86%; N, 12.34%; S, 4.71%. Found: C, 47.80%; H, 3.02%; N, 12.19%; S, 4.62%. TG (Figure S2): loss of 2 PrCN molecules per {YbFe2} unit, Calcd.: 5.4%; found: 5.7%.
Synthesis of 1∙MalCN: The synthetic procedure for 1∙MalCN was analogous to that described for 1∙MeCN, with the exception of using the mixture composed of 1.25 g (18.9 mmol) of malononitrile (MalCN) dissolved in 1 mL of MeOH as a solvent instead of the MeOH/MeCN (1:1, v/v) mixture. Dark red block crystals of 1∙MalCN appeared after 5 days. The crystalline product was collected by filtration and washed with the small portions of Et2O, to give 18 mg of the product (yield based on Fe: 69%). The composition of {YbIII(4-pyridone)4[FeII(phen)2(CN)2]2}(CF3SO3)3∙2MalCN∙MeOH, was determined by the SC-XRD method, while the phase purity was proven by the P-XRD technique (Figure S13), all supported by the CHNS elemental analysis, IR spectroscopy, and TG studies. IR spectrum (Figure S1, KBr, cm–1). C≡N stretching vibrations: 2269w, 2256w, 2194w, 2170w, 2086s, 2059s, and 2022w, indicating the presence of MalCN solvent molecules as well as both bridging and terminal cyanido ligands. The analysis of other peaks of the IR spectrum can be found in the Supporting Information. CHNS elemental analysis. Anal. Calcd. for C82H60F9Fe2N20O14S3Yb (MW = 2101.4 g∙mol–1): C, 46.87%; H, 2.88%; N, 13.33%; S, 4.58%. Found: C, 46.73%; H, 3.09%; N, 13.15%; S, 4.34%. TG (Figure S2): loss of 1 MeOH per {YbFe2} unit, Calcd.: 1.5%; found: 1.6%; loss of 2 MalCN molecules together with 1 MeOH molecule per {YbFe2} unit, Calcd.: 7.8%; found: 8.1%.
Synthesis of 1∙MeCN@Lu: The solid-state dilution of 1∙MeCN within diamagnetic Lu(III)-based molecular matrix was performed at the synthetic stage by mixing the 1.6 mg (0.0025 mmol) portion of Yb(CF3SO3)3 with the 14.0 mg (0.0225 mmol) portion of Lu(CF3SO3)3 in the 2 mL of MeOH/MeCN (1:1, v/v) solvent mixture to achieve the intended circa 10% molar fraction of Yb-containing molecules. Then, the lanthanides solution was used instead of the Yb(CF3SO3)3 in the same synthetic procedure to that described for 1∙MeCN. The isostructural character of obtained needle crystals with 1∙MeCN was confirmed by the powder X-ray diffraction (P-XRD) method (Figure S13). The exact molar fractions of Yb3+ and Lu3+ ions in 1∙MeCN@Lu, represented by the composition of {YbIII0.07LuIII0.93(4-pyridone)4[FeII(phen)2(CN)2]2}(CF3SO3)3∙2MeCN, were determined by the energy dispersive X-ray microanalysis (SEM-EDXMA, Table S1). These analyses were correlated with the results of CHNS elemental analysis and IR spectroscopy. IR spectrum (Figure S1, KBr, cm–1). C≡N stretching vibrations: 2293w, 2252w, 2092s, 2070w, and 2029w, indicating the presence of MeCN solvent molecules as well as both bridging and terminal cyanide ligand modes. Other peaks of the IR spectrum are discussed in the Supporting Information. CHNS elemental analysis. Anal. Calcd. for C79H58F9Fe2N18O13S3Yb0.07Lu0.93 (MW = 2021.1 g∙mol–1): C, 46.95%; H, 2.89%; N, 12.47%; S, 4.76%. Found: C, 47.16%; H, 3.15%; N, 12.31%; S, 4.63%.

3.3. X-Ray Diffraction Analysis

SC-XRD data for all samples, 1∙MeCN, 1∙AcrCN, 1∙PrCN, and 1∙MalCN, were collected using a Bruker D8 Quest diffractometer (Billerica, MA, USA) equipped with a Photon50 CMOS detector, Mo K α (0.71073 Å) irradiation source, a graphite monochromator, and an Oxford Cryostream cooling system. The SC-XRD measurements were performed at 100(2) K. The absorption correction was executed using the TWINABS program [77]. All crystal structures were solved by an intrinsic phasing method using SHELXT-2014/5 and refined by a full-matrix least squares technique on F2 using SHELXL-2018/3 within the WinGX system (Glasgow, UK) [78,79]. All non-hydrogen atoms were refined anisotropically. Hydrogen atoms for 4-pyridone and phen ligands, as well as of solvent molecules, were calculated in their idealized positions, and refined using a riding model. Because of the significant structural disorder on trifluoromethanesulfonate anions, the significant number of restraints of the DFIX and ISOR types, as well as some of the DELU and SIMU types were applied for the selected non-hydrogen atoms to ensure the propose geometry and the convergence of the refinement procedure. Moreover, some ISOR and DFIX restraints were used for part of the atoms in 4-pyridone, phen, and solvent molecules. Also, the FLAT restraint was applied for one of the 4-pyridone rings in 1∙MalCN to ensure its proper geometry. Using all these procedures, satisfactory refinement parameters were achieved. The reference CCDC numbers for 1∙MeCN, 1∙AcrCN, 1∙PrCN, and 1∙MalCN are 2082295, 2082298, 2082296, and 2082297, respectively. Details of crystal data and structure refinement are summarized in Table S2, while the representative structural parameters are gathered in Tables S3–S6. Structural figures were prepared using the Mercury 3.10.3 software (Cambridge, UK). The P-XRD data were collected using a Bruker D8 Advance Eco powder diffractometer equipped with a CuKα (1.5419 Å) radiation source (Billerica, MA, USA). The P-XRD measurements were conducted at room temperature for the polycrystalline samples inserted into a glass capillary (diameter of 0.5 mm).

3.4. Physical Techniques

The CHNS elemental analyses were performed on an Elemental Vario Micro Cube analyzer. IR absorption spectra were measured on selected single crystals using a Thermo Scientific Nicolet iN10 Fourier transform infrared (FTIR) spectrometer in the 4000−700 cm−1 range (Thermo Fisher Scientific, Waltham, MA, USA). The solid-state UV−vis−NIR absorption spectra in the 220−1270 nm range were collected for thin films of the powder samples dispersed in the NVH immersion oil using a Shimadzu UV–3600i Plus spectrophotometer equipped with three detectors (photomultiplier, InGaAs and PbS) and the LabSolutions™ UV software (Shimadzu, Tokyo, Japan). The TGA curves were collected under a nitrogen atmosphere using a TG209 F1 Libra thermogravimetric analyzer with Al pans as holders (Netzsch, Selb, Germany). The TGA data were gathered in the 20−400 °C temperature range with a heating rate of 1 °C·min−1. Solid-state photoluminescent spectra, including emission and excitation spectra, were measured on a Horiba Jobin-Yvon Fluorolog-3 (FL3-211) spectrofluorometer (model TKN-7, Kyoto, Japan), equipped with a Xe lamp (450 W) as an excitation source and an InGaAs photodiode detector DSS-IGA020L cooled by liquid nitrogen. The emission and excitation data were analyzed using the FluorEssence software. Part of the data were gathered at 77 K using the optical cryostat filled with liquid nitrogen. Investigation of magnetic properties was performed using a Quantum Design MPMS-3 Evercool magnetometer on the powder samples, protected by paraffin oil, and closed with cotton wool in a polycarbonate capsule (Quantum Design, San Diego, CA, USA).

3.5. Calculations

Continuous Shape Measure (CSM) analyses for determination of the coordination geometry of YbIII and FeII complexes in 1∙MeCN, 1∙AcrCN, 1∙PrCN, and 1∙MalCN were conducted using the SHAPE software, version 2.1 (Barcelona, Spain) [80,81]. The details of the ab initio calculations of a CASSCF/RASSI/SINGLE_ANISO type, performed for the molecular fragment of 1∙MeCN, are described in Supplementary Materials (Tables S9–S12, with the related comment).

4. Conclusions

We report a novel family of luminescent molecular nanomagnets generated in the supramolecular frameworks based on magneto-luminescent trinuclear cyanido-bridged {YbIIIFeII2}3+ cations, accompanied by trifluoromethanesulfonate counter-ions and nitrile solvent molecules of crystallization (MeCN, AcrCN, PrCN, and MalCN). We present the concept of using the neutral cyanido complexes of [Fe(phen)2(CN)2]·2H2O as the advanced metalloligands forming stable molecular systems with Yb(III) centers and non-innocent 4-pyridone ligands. Due to the presence of Yb3+ ions, surrounded by 4-pyridone and cyanido ligands within the deformed octahedral geometry, the obtained materials exhibit a field-induced SMM behavior which is modulated by the nitrile molecules. Firstly, the additionally appearing magnetic relaxation associated with the dipole-dipole interaction between Yb3+ ions can be suppressed due to the extension of the distances between the Yb(III) centers within the supramolecular frameworks by the proper choice of more expanded nitrile solvents, AcrCN and PrCN. Secondly, the variation of phonon modes schemes due to the nitrile solvent exchange strongly affects the Raman relaxation process which is dominant in the observed YbIII-centered slow magnetic relaxation effects. This nitrile solvent impact on the Raman contribution to the overall magnetic relaxation was found to be extensive. The increasing complexity of the nitrile in the series of MeCN, AcrCN, PrCN, and MalCN, increases the BRaman parameter, which was correlated with the increasing number of available vibrational modes. Simultaneously, it results in the decrease of the power n, which seems to be related with the increasing the energies of phonon modes critical for the occurrence of the relaxation process. This phenomenon is not fully clarified and will be the subject of future work. Nevertheless, we present an efficient pathway for modulation of slow magnetic relaxation of YbIII complexes by subtle structural changes involving only the variation of nitrile solvent of crystallization. Additionally, all obtained molecular systems exhibit pronounced YbIII–centered NIR photoluminescence under UV irradiation. Further development of such emissive molecular nanomagnets with magnetic and optical properties tunable by sensitivity to chemical and physical stimuli is planned in our laboratory.

Supplementary Materials

The following are available online: https://0-www-mdpi-com.brum.beds.ac.uk/article/10.3390/magnetochemistry7060079/s1, Table S1: results of SEM-EDXMA analysis, Figure S1: IR spectra, Figure S2: TG curves, Table S2: summary of crystal data and structure refinement, Tables S3–S6: detailed structural parameters, Figures S3–S11: additional structural views, Table S7: results of Continuous Shape Measure analysis, Figure S12, Table S8: visualization and analysis of closest Yb–Yb distances within the crystal structures, Figure S13: P-XRD patterns, Figure S14: direct-current magnetic properties, Figures S15–S24: set of detailed alternate-current magnetic characteristics for all obtained compounds under variable temperature and magnetic field, Table S9: description of the basis sets employed in the ab initio calculations, Tables S10–S12: results of the ab initio calculations with the comment on the details of these calculations, Figure S25: UV-vis-NIR absorption spectra, Figure S26: additional low- and high-temperature excitation and emission spectra.

Author Contributions

The manuscript was written through the contributions of all authors. They specifically contributed as follows. M.L. and S.C. designed the reported compounds. M.L. performed the syntheses, main physicochemical characterization, including single-crystal X-ray diffraction experiments and refinement of the crystal structure. K.B. contributed to the optimization of synthetic conditions and the basic characterization of obtained compounds. M.L. and S.C. planned and performed magnetic measurements. M.L. and J.J.Z. analyzed the results of magnetic studies for all compounds. J.W. performed the measurements of NIR emission properties. M.Z. performed the ab initio calculations. S.-i.O. and S.C. supervised the planning of the experiments, data collection, and all analyses. S.C. developed the general idea of research and coordinated the whole project including international cooperation. M.L. prepared the first version of the manuscript including the critical data interpretation. The final version of the manuscript was written by M.L. and S.C. with the thorough checking of the included data by J.J.Z. All authors have read and agreed to the published version of the manuscript.

Funding

This research was funded by the National Science Centre of Poland within the OPUS-15 project, grant no. 2018/29/B/ST5/00337. M.Z. acknowledges the research grant under the “Diamond Grant” program (DI2018 017948) of the Polish Ministry of Science and Higher Education.

Institutional Review Board Statement

Not applicable.

Informed Consent Statement

Not applicable.

Data Availability Statement

The data presented in this study are available on request from the corresponding author. The data are not publicly available, as all essential results related to this work are already included in the manuscript and Supplementary Materials.

Conflicts of Interest

The authors declare no conflict of interest.

Sample Availability

Samples of the compounds 1∙MeCN, 1∙MeCN@Lu, 1∙AcrCN, 1∙PrCN, and 1∙MalCN are available from the authors.

References

  1. Salonitis, K.; Pandremenos, J.; Paralikas, J.; Chryssolouris, G. Multifunctional materials: Engineering applications and processing challenges. Int. J. Adv. Manuf. Technol. 2010, 49, 803–826. [Google Scholar] [CrossRef]
  2. Pacchioni, G. Two–dimensional Oxides: Multifunctional Materials for Advanced Technologies. Chem. Eur. J. 2012, 18, 10144–10158. [Google Scholar] [CrossRef] [PubMed]
  3. Spaldin, N.A.; Ramesh, R. Advances in magnetoelectric multiferroics. Nat. Mater. 2019, 18, 203–212. [Google Scholar] [CrossRef] [PubMed]
  4. Lee, G.H.; Moon, H.; Kim, H.; Lee, G.H.; Kwon, W.; Yoo, S.; Myung, D.; Yun, S.H.; Bao, Z.; Hahn, S.K. Multifunctional materials for implantable and wearable photonic healthcare devices. Nat. Rev. Mater. 2020, 5, 149–165. [Google Scholar] [CrossRef]
  5. Allendorf, M.D.; Dong, R.; Feng, X.; Kaskel, S.; Matoga, D.; Stavila, V. Electronic Devices Using Open Framework Materials. Chem. Rev. 2020, 16, 8581–8640. [Google Scholar] [CrossRef]
  6. Liu, H.; Zhang, G.; Zheng, X.; Chen, F.; Duan, H. Emerging miniaturized energy storage devices for microsystem application: From design to integration. Int. J. Extrem. Manuf. 2020, 2, 042001. [Google Scholar] [CrossRef]
  7. Meng, J.; Liu, X.; Niu, C.; Pang, Q.; Li, J.; Liu, F.; Liu, Z.; Mai, L. Advances in metal–organic framework coating: Versatile synthesis and broad applications. Chem. Soc. Rev. 2020, 49, 3142–3186. [Google Scholar] [CrossRef]
  8. Zhang, Y.; Liao, W.-Q.; Fu, D.-W.; Ye, H.-Y.; Liu, C.-M.; Chen, Z.-N.; Xiong, R.-G. The First Organic-Inorganic Hybrid Luminescent Multiferroic: (Pyrrolidinium)MnBr3. Adv. Mater. 2015, 27, 3942–3946. [Google Scholar] [CrossRef]
  9. Benaicha, B.; van Do, K.; Yangui, A.; Pittala, N.; Lusson, A.; Sy, M.; Bouchez, G.; Fourati, H.; Gomez-Garcia, C.J.; Triki, S.; et al. Interplat between spin-crossover and luminescence in a multifunctional single crystal iron(II) complex: Towards a new generation of molecular sensors. Chem. Sci. 2019, 10, 6791–6798. [Google Scholar] [CrossRef] [Green Version]
  10. Chorazy, S.; Zakrzewski, J.J.; Magott, M.; Korzeniak, T.; Nowicka, B.; Pinkowicz, D.; Podgajny, R.; Sieklucka, B. Octacyanidometallates for multifunctional molecule–based materials. Chem. Soc. Rev. 2020, 49, 5545–6001. [Google Scholar] [CrossRef]
  11. Rocha, J.; Carlos, L.D.; Paz, F.A.A.; Ananias, D. Luminescent multifunctional lanthanides-based metal-organic frameworks. Chem. Soc. Rev. 2011, 40, 926–940. [Google Scholar] [CrossRef]
  12. Ishikawa, N.; Sugita, M.; Ishikawa, T.; Koshihara, S.; Kaizu, Y. Lanthanide Double–Decker Complexes Functioning as Magnets at the Single–Molecular Level. J. Am. Chem. Soc. 2003, 125, 8694–8695. [Google Scholar] [CrossRef]
  13. Woodruff, D.N.; Winpenny, R.E.P.; Layfield, R.A. Lanthanide Single-Molecule Magnets. Chem. Rev. 2013, 113, 5110–5148. [Google Scholar] [CrossRef]
  14. Harriman, K.L.M.; Brosmer, J.L.; Ungur, L.; Diaconescu, P.L.; Murugesu, M. Pursuit of Record Breaking Energy Barriers: A Study of Magnetic Axiality in Diamide Ligated DyIII Single-Molecule Magnets. J. Am. Chem. Soc. 2017, 139, 1420–1423. [Google Scholar] [CrossRef] [PubMed] [Green Version]
  15. Guo, F.-S.; Day, B.M.; Chen, Y.-C.; Tong, M.-L.; Mansikkamäki, A.; Layfield, R.A. Magnetic hysteresis up to 80 kelvin in a dysprosium metallocene single-molecule magnet. Science 2018, 362, 1400–1403. [Google Scholar] [CrossRef] [Green Version]
  16. Mannini, M.; Pineider, F.; Sainctavit, P.; Danieli, C.; Otero, E.; Sciancelepore, E.; Talarico, A.M.; Arrio, M.-A.; Cornia, A.; Gatteschi, D.; et al. Magnetic memory of a single–molecule quantum magnet wired to a gold surface. Nat. Mater. 2009, 8, 194–197. [Google Scholar] [CrossRef]
  17. Candini, A.; Klyatskaya, S.; Ruben, M.; Wernsdorfer, W.; Affronte, M. Graphene Spinctronics Devices with Molecular Nanomagnets. Nano Lett. 2011, 11, 2634–2639. [Google Scholar] [CrossRef] [Green Version]
  18. Thiele, S.; Balestro, F.; Ballou, R.; Klyatskaya, S.; Ruben, M.; Wernsdorfer, W. Electrically driven nuclear sing resonance in single–molecule magnets. Science 2014, 344, 1135–1138. [Google Scholar] [CrossRef]
  19. Bunzli, J.-C.G.; Piguet, C. Taking advantage of luminescent lanthanide ions. Chem. Soc. Rev. 2005, 34, 1048–1077. [Google Scholar] [CrossRef]
  20. Eliseeva, S.V.; Bünzli, J.-C.G. Lanthanide luminescence for functional materials and biosciences. Chem. Soc. Rev. 2010, 39, 189–227. [Google Scholar] [CrossRef] [PubMed]
  21. Huang, X.; Han, S.; Huang, W.; Liu, X. Enhancing solar cell efficiency: The search for luminescent materials as spectral converters. Chem. Soc. Rev. 2013, 42, 173–201. [Google Scholar] [CrossRef] [Green Version]
  22. Zinna, F.; Pasini, M.; Galeotti, F.; Botta, C.; Di Bari, L.; Giovanella, U. Design of Lanthanide-Based OLEDs with Remarkable Circularly Polarized Electroluminescence. Adv. Funct. Mater. 2017, 27, 1603719. [Google Scholar] [CrossRef]
  23. Zhang, K.Y.; Yu, Q.; Wei, H.; Liu, S.; Zhao, Q.; Huang, W. Long-Lived Emissive Probes for Time-Resolved Photoluminescence Bioimaging and Biosensing. Chem. Rev. 2018, 118, 1770–1839. [Google Scholar] [CrossRef]
  24. Mako, T.L.; Racicot, J.M.; Levine, M. Supramolecular Luminescent Sensors. Chem. Rev. 2019, 119, 322–477. [Google Scholar] [CrossRef]
  25. Monteiro, J.H.S.K. Recent Advances in Luminescence Imaging of Biological Systems Using Lanthanide(III) Luminescent Complexes. Molecules 2020, 25, 2089. [Google Scholar] [CrossRef] [PubMed]
  26. Rocha, J.; Brites, C.D.S.; Carlos, L.D. Lanthanide Organic Framework Luminescent Thermometers. Chem. Eur. J. 2016, 22, 14782–14795. [Google Scholar] [CrossRef] [PubMed]
  27. Kumar, K.; Chorazy, S.; Nakabayashi, K.; Sato, H.; Sieklucka, B.; Ohkoshi, S. TbCo and Tb0.5Dy0.5Co layered cyanido-bridged frameworks for construction of colorimetric and ratiometric luminescent thermometers. J. Mater. Chem. C 2018, 6, 8372–8384. [Google Scholar] [CrossRef]
  28. Hasegawa, Y.; Kitagawa, Y. Thermo-sensitive luminescence of lanthanide complexes, clusters, coordination polymers and metal-organic frameworks with organic photosensitizers. J. Mater. Chem. C 2019, 7, 7494–7511. [Google Scholar] [CrossRef]
  29. Pointillart, F.; Jung, J.; Berraud-Pache, R.; Le Guennic, B.; Dorcet, V.; Golhen, S.; Cador, O.; Maury, O.; Guyot, Y.; Decurtins, S.; et al. Luminescence and Single-Molecule Magnet Behavior in Lanthanide Complex Involving a Tetrathiafulvalene-Fused Dipyridophenazine Ligand. Inorg. Chem. 2015, 54, 5384–5397. [Google Scholar] [CrossRef]
  30. Chorazy, S.; Rams, M.; Nakabayashi, K.; Sieklucka, B.; Ohkoshi, S. White Light Emissive DyIII Single-Molecule Magnets Sensitized by Diamagnetic [CoIII(CN)6]3– Linkers. Chem. Eur. J. 2016, 22, 7371–7375. [Google Scholar] [CrossRef]
  31. Jia, J.-H.; Li, Q.-W.; Chen, Y.-C.; Liu, J.-L.; Tong, M.-L. Luminescent single—molecule magnets based on lanthanides: Design strategies, recent advances and magneto-luminescent studies. Coord. Chem. Rev. 2019, 378, 365–381. [Google Scholar]
  32. Xin, Y.; Wang, J.; Zychowicz, M.; Zakrzewski, J.J.; Nakabayashi, K.; Sieklucka, B.; Chorazy, S.; Ohkoshi, S. Dehydration–Hydration Switching of Single-Molecule Magnet Behavior and Visible Photoluminescence in a Cyanido-Bridged DyIIICoIII Framework. J. Am. Chem. Soc. 2019, 141, 18211–18220. [Google Scholar] [CrossRef] [PubMed]
  33. Gendron, F.; Di Pietro, S.; Galan, L.A.; Riobe, F.; Placide, V.; Guy, L.; Zinna, F.; Di Bari, L.; Bensalah-Ledoux, A.; Guyot, Y.; et al. Luminescence, chiroptical, magnetic and ab initio crystal-field characterizations of an enantiopure helicoidal Yb(III) complex. Inorg. Chem. Front. 2021, 8, 914–926. [Google Scholar] [CrossRef]
  34. Brunet, G.; Marin, R.; Monk, M.-J.; Resch-Genger, U.; Galico, D.A.; Sigoli, F.A.; Suturina, E.A.; Hemmer, E.; Murugesu, M. Exploring the dual functionality of an ytterbium complex for luminescence thermometry and slow magnetic relaxation. Chem. Sci. 2019, 10, 6799–6808. [Google Scholar] [CrossRef]
  35. Wang, J.; Zakrzewski, J.J.; Zychowicz, M.; Vieru, V.; Chibotaru, L.F.; Nakabyashi, K.; Chorazy, S.; Ohkoshi, S. Holmium(III) molecular nanomagnets for optical thermometry exploring the luminescence re-absorption effect. Chem. Sci. 2021, 12, 730–741. [Google Scholar] [CrossRef]
  36. Ren, M.; Bao, S.-S.; Ferreira, R.A.S.; Zheng, L.-M.; Carlos, L.D. A layered erbium phosphanate in pseudo-D5h symmetry exhibiting field-tunable magnetic relaxation and optical correlation. Chem. Commun. 2014, 50, 7621–7624. [Google Scholar] [CrossRef]
  37. Long, J.; Guari, Y.; Ferreira, R.A.S.; Carlos, L.D.; Larionova, J. Recent advances in luminescent lanthanide based Single-Molecule Magnets. Coord. Chem. Rev. 2019, 363, 57–70. [Google Scholar] [CrossRef]
  38. Jankowski, R.; Zakrzewski, J.J.; Surma, O.; Ohkoshi, S.; Chorazy, S.; Sieklucka, B. Near–infrared emissive Er(III) and Yb(III) molecular nanomagnets in metal–organic chains functionalized by octacyanidometallates(IV). Inorg. Chem. Front. 2019, 6, 2423–2434. [Google Scholar] [CrossRef]
  39. Weissleder, R.; Pittet, M.J. Imaging in the area of molecular oncology. Nature 2008, 452, 580–589. [Google Scholar] [CrossRef] [Green Version]
  40. Naczynski, D.J.; Tan, M.C.; Zevon, M.; Wall, B.; Kohl, J.; Kulesa, A.; Chen, S.; Roth, C.M.; Riman, R.E.; Moghe, P.V. Rare–earth–doped biological composites as in vivo shortwave infrared reports. Nat. Commun. 2013, 4, 2199. [Google Scholar] [CrossRef]
  41. Hildebrand, S.A.; Weissleder, R. Near–infrared fluorescence: Application to in vivo molecular imaging. Curr. Opin. Chem. Biol. 2010, 14, 71–79. [Google Scholar] [CrossRef]
  42. Pansare, V.J.; Hejazi, S.; Faenza, W.J.; Prud’homme, R.K. Review of Long-Wavelength Optical and NIR Imaging Materials Contrast Agents, Fluorophores, and Multifunctional Nano Carries. Chem. Mater. 2012, 24, 8812–8827. [Google Scholar] [CrossRef] [PubMed] [Green Version]
  43. Gai, S.; Li, C.; Yang, P.; Lin, J. Recent Progress in Rare Earth Micro/Nanocrystals: Soft Chemical Synthesis, Luminescence Properties, and Biomedical Applications. Chem. Rev. 2014, 4, 2343–2389. [Google Scholar] [CrossRef] [PubMed]
  44. Creutz, S.E.; Fainblat, R.; Kim, Y.; De Siena, M.C.; Gamelin, D.R. A Selective Cation Exchange Strategy for the Synthesis of Colloidal Yb3+-Doped Chalcogenide Nanocrystals with Strong Broadband Visible Absorption and Long-Lived Near-Infrared Emission. J. Am. Chem. Soc. 2017, 139, 11814–11824. [Google Scholar] [CrossRef] [PubMed]
  45. Bai, G.; Yang, Z.; Lin, H.; Jie, W.; Hao, J. Lanthanide Yb/Er co-doped semiconductor layered WSe2 nanosheets with near-infrared luminescence at telecommunication wavelengths. Nanoscale 2018, 10, 9261–9267. [Google Scholar] [CrossRef] [PubMed]
  46. Shuvaev, S.; Parker, D. A near-IR luminescent ratiometric ytterbium pH probe. Dalton Trans. 2019, 48, 4471–4473. [Google Scholar] [CrossRef] [Green Version]
  47. Nguyen, T.N.; Eliseeva, S.V.; Gladysiak, A.; Petoud, S.; Stylianou, K.C. Design of lanthanide-based metal-organic frameworks with enhanced near-infrared emission. J. Mater. Chem. A 2020, 8, 10188–10192. [Google Scholar] [CrossRef]
  48. Soussi, K.; Jung, J.; Pointillart, F.; Le Guennic, B.; Lefeuvre, B.; Golhen, S.; Cador, O.; Guyot, Y.; Maury, O.; Ouahab, L. Magnetic and photo-physical investigations into DyIII and YbIII complexes involving tetrathiafulvalene ligand. Inorg. Chem. Front. 2015, 2, 1105–1117. [Google Scholar] [CrossRef]
  49. Lazarides, T.; Davies, G.M.; Adams, H.; Sabatini, C.; Barigelletti, F.; Barbieri, A.; Pope, S.J.A.; Faulkner, S.; Ward, M.D. Ligand-field excited states of hexacyanochromate and hexacyanocobaltate as sensitisers for near-infrared luminescence from Nd(III) and Yb(III) in cyanide-bridged d–f assemblies. Photochem. Photobiol. Sci. 2007, 6, 1152–1157. [Google Scholar] [CrossRef]
  50. Chorazy, S.; Sieklucka, B.; Ohkoshi, S. Near-Infrared Photoluminescence in Hexacyanido-Bridged Nd-Cr Layered Ferromagnet. Cryst. Growth Des. 2016, 16, 4918–4925. [Google Scholar] [CrossRef]
  51. Chorazy, S.; Charytanowicz, T.; Wang, J.; Ohkoshi, S.; Sieklucka, B. Hybrid organic-inoganic connectivity of NdIII(pyrazine–N,N′–dioxide)[CoIII(CN)6]3− coordination chains for crating near–infrared emissive Nd(III) showing field-induced slow magnetic relaxation. Dalton Trans. 2018, 47, 7870–7874. [Google Scholar] [CrossRef] [PubMed]
  52. Chorazy, S.; Zychowicz, M.; Ohkoshi, S.; Sieklucka, B. Wide-Range UV-to-Visible Excitation of Near-Infrared Emission and Slow Magnetic Relaxation in LnIII(4,4′-Azopyridine-1,1′-dioxide)[CoIII(CN)6]3− Layered Frameworks. Inorg. Chem. 2019, 58, 165–179. [Google Scholar] [CrossRef]
  53. Wang, J.; Zakrzewski, J.J.; Heczko, M.; Zychowicz, M.; Nakagawa, K.; Nakabayashi, K.; Sieklucka, B.; Chorazy, S.; Ohkoshi, S. Proton Conductive Luminescent Thermometer Based on Near–Infrared Emissive {YbCo2} Molecular Nanomagnets. J. Am. Chem. Soc. 2020, 142, 3970–3979. [Google Scholar] [CrossRef] [PubMed]
  54. Zakrzewski, J.J.; Liberka, M.; Zychowicz, M.; Chorazy, S. Diverse physical functionalities of rare-earth hexacyanidometallate frameworks and their molecular analogues. Inorg. Chem. Front. 2021, 8, 452–483. [Google Scholar] [CrossRef]
  55. Burgess, J.; Radulovic, S. Solvatochromism and solvation of ternary iron-diimine-cyanide complexes. Transition Met. Chem. 1987, 12, 529–536. [Google Scholar] [CrossRef]
  56. Al-alousy, A.; Burgess, J. Bis(1,10-phenanthroline) dicyanoiron(II): An almost universal inorganic solvent polarity indicator. Inorg. Chim. Acta 1990, 169, 167–170. [Google Scholar] [CrossRef]
  57. Tłaczała, T.; Bartecki, A. Studies on the solvatochromism of Fe(CN)2(phen)2. Monatsch. Chem. 1997, 128, 225–234. [Google Scholar] [CrossRef]
  58. Georgieva, I.; Aquino, A.J.A.; Trendafilova, N.; Santos, P.S.; Lischka, H. Solvatochromic and Ionochromic Effects of Iron(II)bis(1,10-phenanhroline)dicyano: A Theoretical Study. Inorg. Chem. 2010, 49, 1634–1646. [Google Scholar] [CrossRef]
  59. Shavaleev, N.M.; Scopelliti, R.; Gumy, F.; Bünzli, J.-C.G. Surprisingly Bright Near-Infrared Luminescence and Short Radiative Lifetimes of Ytterbium in Hetero-Binuclear Yb–Na Chelates. Inorg. Chem. 2009, 48, 7937–7946. [Google Scholar] [CrossRef]
  60. Lu, H.; Peng, Y.; Ye, H.; Cui, X.; Hu, J.; Gu, H.; Khlobystov, A.N.; Green, M.A.; Blower, P.B.; Wyatt, P.B.; et al. S Sensitization, energy transfer and infra-red emission decay modulation in Yb3+-doped NaYF4 nanoparticles with visible light through a perfluoroanthraquinone chromophore. Sci. Rep. 2017, 7, 5066. [Google Scholar] [CrossRef] [PubMed] [Green Version]
  61. Pedersen, K.S.; Dreiser, J.; Weihe, H.; Sibille, R.; Johannesen, H.V.; Sørensen, M.A.; Nielsen, B.E.; Sigrist, M.; Mutka, H.; Rols, S.; et al. Design of single-molecule magnets: Insufficiency of the anisotropy barrier as the sole criterion. Inorg. Chem. 2015, 54, 7600–7606. [Google Scholar] [CrossRef]
  62. Lunghi, A.; Totti, F.; Sessoli, R.; Sanvito, S. The role of anharmonic phonons in under-barrier spin relaxation of single molecule magnets. Nat. Commun. 2017, 8, 14620. [Google Scholar] [CrossRef] [Green Version]
  63. Giansiracusa, M.J.; Kostopoulos, A.K.; Collison, D.; Winpenny, R.E.P.; Chilton, N.F. Correlating blocking temperatures with relaxation mechanism in monometallic single-molecule magnets with high energy barrier (Ueff > 600 K). Chem. Commun. 2019, 55, 7025–7028. [Google Scholar] [CrossRef]
  64. Castro-Alvarez, A.; Gil, Y.; Llanos, L.; Aravena, D. High performance single-molecule magnets, Orbach or Raman relaxation suppression? Inorg. Chem. Front. 2020, 7, 2478–2486. [Google Scholar] [CrossRef]
  65. Ohkoshi, S.; Imoto, K.; Tsunobuchi, Y.; Takano, S.; Tokoro, H. Light-induced spin-crossover magnet. Nat. Chem. 2011, 3, 564–569. [Google Scholar] [CrossRef]
  66. Kobylarczyk, J.; Liberka, M.; Konieczny, P.; Baran, S.; Kubicki, M.; Korzeniak, T.; Podgajny, R. Bulky ligad shape the separation between large spin carries to condition field–induced slow magnetic relaxation. Dalton Trans. 2020, 49, 300–311. [Google Scholar] [CrossRef]
  67. Pointillart, F.; Cador, O.; Le Guennic, B.; Ouahab, L. Uncommon lanthanide ions in purely 4f single molecule magnets. Coord. Chem. Rev. 2017, 346, 150–175. [Google Scholar] [CrossRef]
  68. Chorazy, S.; Zakrzewski, J.J.; Reczyński, M.; Nakabayashi, K.; Ohkoshi, S.; Sieklucka, B. Humidity driven molecular switch based on photoluminescent DyIIICoIII single-molecule magnets. J. Mater. Chem. C 2019, 7, 4164–4172. [Google Scholar] [CrossRef]
  69. Ding, Y.-S.; Yu, K.-X.; Reta, D.; Ortu, F.; Winpenny, R.E.P.; Zheng, Y.-Z.; Chilton, N.F. Field- and temperature-dependent quantum tunneling of the magnetization in a large barrier single-molecule magnet. Nat. Commun. 2018, 9, 3134. [Google Scholar] [CrossRef]
  70. Aravena, D.; Ruiz, E. Spin dynamics in single-molecule magnets and molecular qubits. Dalton Trans. 2020, 49, 9916–9928. [Google Scholar] [CrossRef]
  71. Rinehart, J.D.; Long, J.R. Exploiting single-ion anisotropy in the design of f-element single-molecule magnets. Chem. Sci. 2011, 2, 2078–2085. [Google Scholar] [CrossRef]
  72. Gu, L.; Wu, R. Origin of the anomalously low Raman exponents in single–molecule magnets. Phys. Rev. 2021, 103, 014401. [Google Scholar] [CrossRef]
  73. Reta, D.; Kragskow, J.G.C.; Chilton, N.F. Ab Initio Prediction of High-Temperature Magnetic Relaxation Rates in Single-Molecule Magnets. J. Am. Chem. Soc. 2021, 143, 5943–5950. [Google Scholar] [CrossRef] [PubMed]
  74. Armaroli, N.; De Cola, L.; Balzani, V.; Sauvage, J.-P.; Dietrich-Buchecker, C.O.; Kern, J.-M. Adsorption and luminescence properties of 1,10-phenantroline, 2,9-diphenyl-1,10-phenantroline, 2,9-dianisyl-1,10-phenantroline and their protonated forms in dichloromethane solution. J. Chem. Soc. Faraday Trans. 1992, 88, 553–556. [Google Scholar] [CrossRef]
  75. Schilt, A.A. Mixed Ligand Complexes of Iron(II) and (III) with Cyanide and Aromatic Di-imines. J. Am. Chem. Soc. 1960, 82, 3000–3005. [Google Scholar] [CrossRef]
  76. Maddock, A.G. The complex [Fe(phen)2(CN)2] (phen = 1,10–phenantroline) and its solutions. J. Chem. Soc. Dalton Trans. 1986, 5, 2349–2350. [Google Scholar] [CrossRef]
  77. Sheldrick, G.M. TWINABS; University of Göttingen: Göttingen, Germany, 2009. [Google Scholar]
  78. Sheldrick, G.M. SHELXT—Integrated space-group and crystalstructure determination. Acta Crystallogr. Sect. A Found. Adv. 2015, A71, 3–8. [Google Scholar] [CrossRef] [Green Version]
  79. Farrugia, L.J. WinGX and ORTEP for Windows: An update. J. Appl. Crystallogr. 2012, 45, 849–854. [Google Scholar] [CrossRef]
  80. Llunell, M.; Casanova, D.; Cirera, J.; Bofill, J.; Alemany, P.; Alvarez, S.; Pinsky, M.; Avnir, D. Program for the Calculation of Continuous Shape Measures of Polygonal and Polyhedral Molecular Fragments; SHAPE v. 2.1.; University of Barcelona: Barcelona, Spain, 2013. [Google Scholar]
  81. Casanova, D.; Cirera, J.; Llunell, M.; Alemany, P.; Avnir, D.; Alvarez, S. Minimal Distortion Pathways in Polyhedral Rearrangements. J. Am. Chem. Soc. 2004, 126, 1755–1763. [Google Scholar] [CrossRef]
Figure 1. Representative molecular building units of 1∙MeCN (a), 1∙AcrCN (b), 1∙PrCN (c), and 1∙MalCN (d) with atoms labeling schemes and indicated components: organic ligands, counter-ions, and solvent of crystallization (marked by green circles). In (a), the blue line shows the easy magnetic axis (direction of the gz component of the pseudo-g-tensor of the ground state) determined by the ab initio calculations (Table S11 and details in Supporting Information).
Magnetochemistry 07 00079 g001
Figure 2. Comparison of the supramolecular frameworks of 1∙MeCN, 1∙AcrCN, 1∙PrCN, and 1∙MalCN: (a) structural views of cyanido-bridged molecules and nitrile solvent molecules within the bc crystallographic plane with the indicated representative closest distances between Yb centers, and (b) the related variation of the unit cell parameters and the closest Yb–Yb distances along selected crystallographic directions.
Magnetochemistry 07 00079 g002
Figure 3. Field– and temperature–variable alternate–current (ac) magnetic susceptibility characteristics for 1∙MeCN and 1∙MeCN@Lu: (a,b) the respective frequency dependences of χM″ under various dc fields, (c) the field–dependences of relaxation time, τ, (d,e) the respective frequency dependences of χM″ under various temperatures, (f) the temperature–dependences of relaxation time, τ. Solid lines in the χM″(ν) plots present the best-fits using a generalized Debye model. Solid lines in the τ–1(H) and ln(τ)(T1) plots show the best-fits taking into account a QTM, a Raman process, and a field-induced direct process (Equation (1)). For details see Figures S15–S18 (Supporting Information).
Magnetochemistry 07 00079 g003
Figure 4. Alternate–current (ac) magnetic properties of 1∙AcrCN, 1∙PrCN, and 1∙MalCN: (ac) the frequency dependences of χM″ under various dc fields at T = 1.8 K, (df) the frequency dependences of χM″ under various temperatures for the optimal Hdc, (g) the field– and (h) the temperature–dependences of relaxation time, τ. For comparison, in (g,h), the experimental data for 1∙MeCN were shown (taken from Figure 3). Solid lines in the χM″(ν) plots present the best-fits using a generalized Debye model. Solid lines in the τ–1(H) and ln(τ)(T1) plots show the best-fits taking into account QTM, Raman, and direct processes (Equation (1)). Solid lines in the τ–1(H) and ln(τ)(T–1) plots present the best-fits using a generalized Debye model. For details, see Figures S15–S24 (Supporting Information).
Magnetochemistry 07 00079 g004
Figure 5. Solid-state photoluminescence properties of 1∙MeCN, 1∙AcrCN, 1∙PrCN, and 1∙MalCN, including the excitation spectra for the indicated monitored emission (left panel) and the emission spectra for the indicated excitation wavelengths (right panel) gathered for (a) 1∙MeCN, (b) 1∙AcrCN, (c) 1∙PrCN, and (d) 1∙MalCN.
Magnetochemistry 07 00079 g005
Table 1. Best-fit parameters for slow magnetic relaxation characteristics in 1∙MeCN, 1∙MeCN@Lu, 1∙AcrCN, 1∙PrCN, and 1∙MalCN.
Compound1∙MeCN1∙MeCN@Lu1∙AcrCN1∙PrCN1∙MalCN
field–dependence of relaxation time (Figure 3 and Figure 4, Figures S15, S17, S19, S21 and S23)
T/K1.81.81.81.81.8
Adirect/s–1K–1Oem1.14(1)∙10–81.38(3)∙10–95.25(5)∙10–91.65(2)∙10–103.12(3)∙10–9
m3.15(1)3.26(3)3.75(1)3.54(1)3.19(2)
a/s–14∙103 (fixed)3.91(2)∙1033.28(7)∙1037.32(3)∙1021.13(1)∙102
b/Oe–22∙10–1 (fixed)9.48(9)∙10–54.81(2)∙10–52.14(3)∙10–52.21(6)∙10–5
temperature–dependence of relaxation time (Figure 3 and Figure 4, Figures S16, S18, S20, S22 and S24)
Hdc/Oe800800800800800
BRaman/s–1K–n81.68(5)25.32(3)208.28(2)128.09(1)527.08(2)
n3.07(1)3.61(1)2.37(1)2.61(1)1.68(4)
temperature–dependence of relaxation time—Arrhenius law (Figures S16, S18, S20, S22 and S24)
τ0/s7.28(3)∙10–61.48(1)∙10–52.51(7)∙10–51.46(7)∙10–55.82(9)∙10–5
Ueff/K12.50(58)11.53(1)7.86(27)10.28(22)4.83(31)
Publisher’s Note: MDPI stays neutral with regard to jurisdictional claims in published maps and institutional affiliations.

