
Development of Magnetic Particle Distribution Imaging Using Magnetic Field Reconstruction for Biopsy of the Sentinel Lymph Node

Abstract
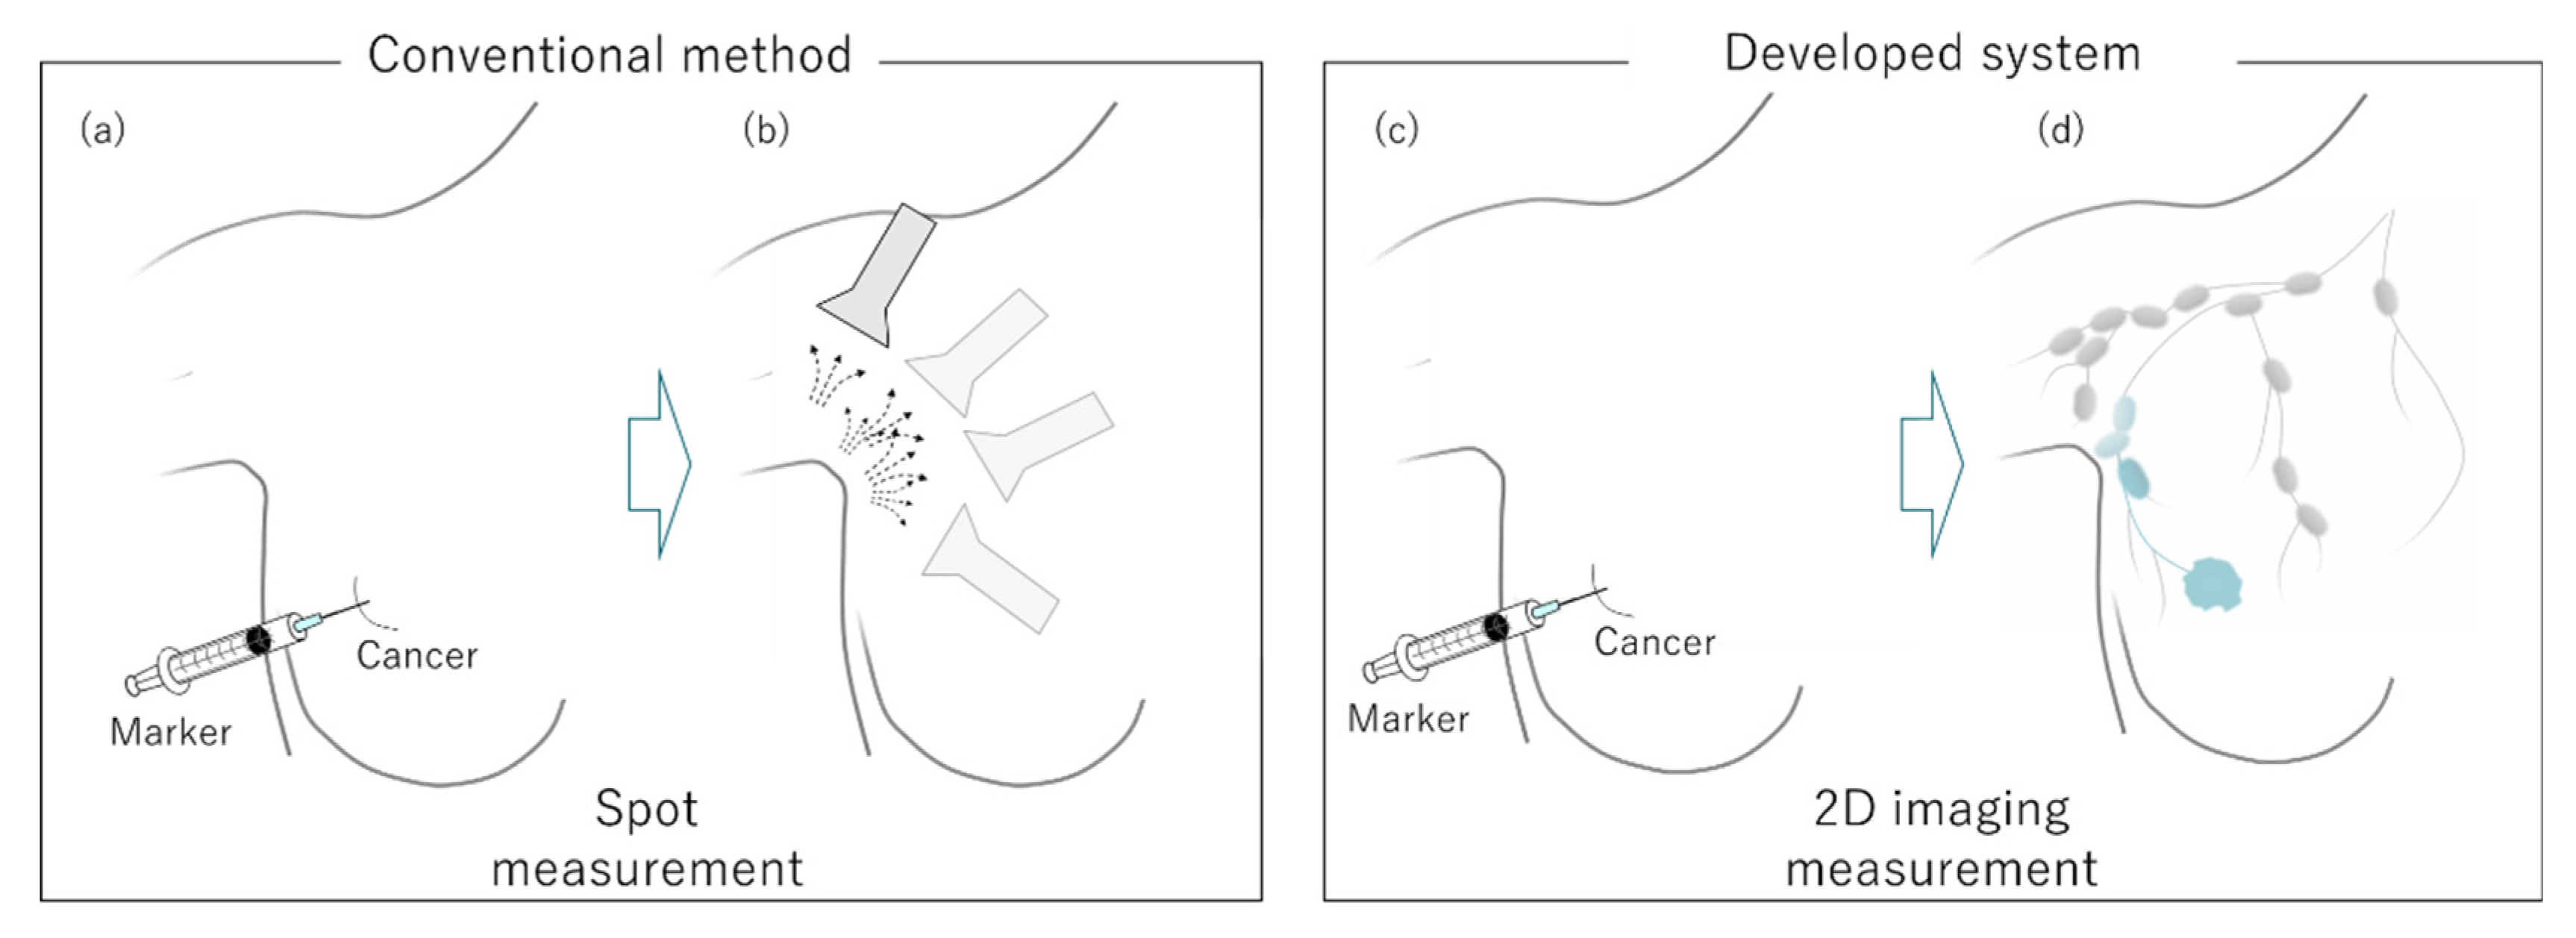
:1. Introduction
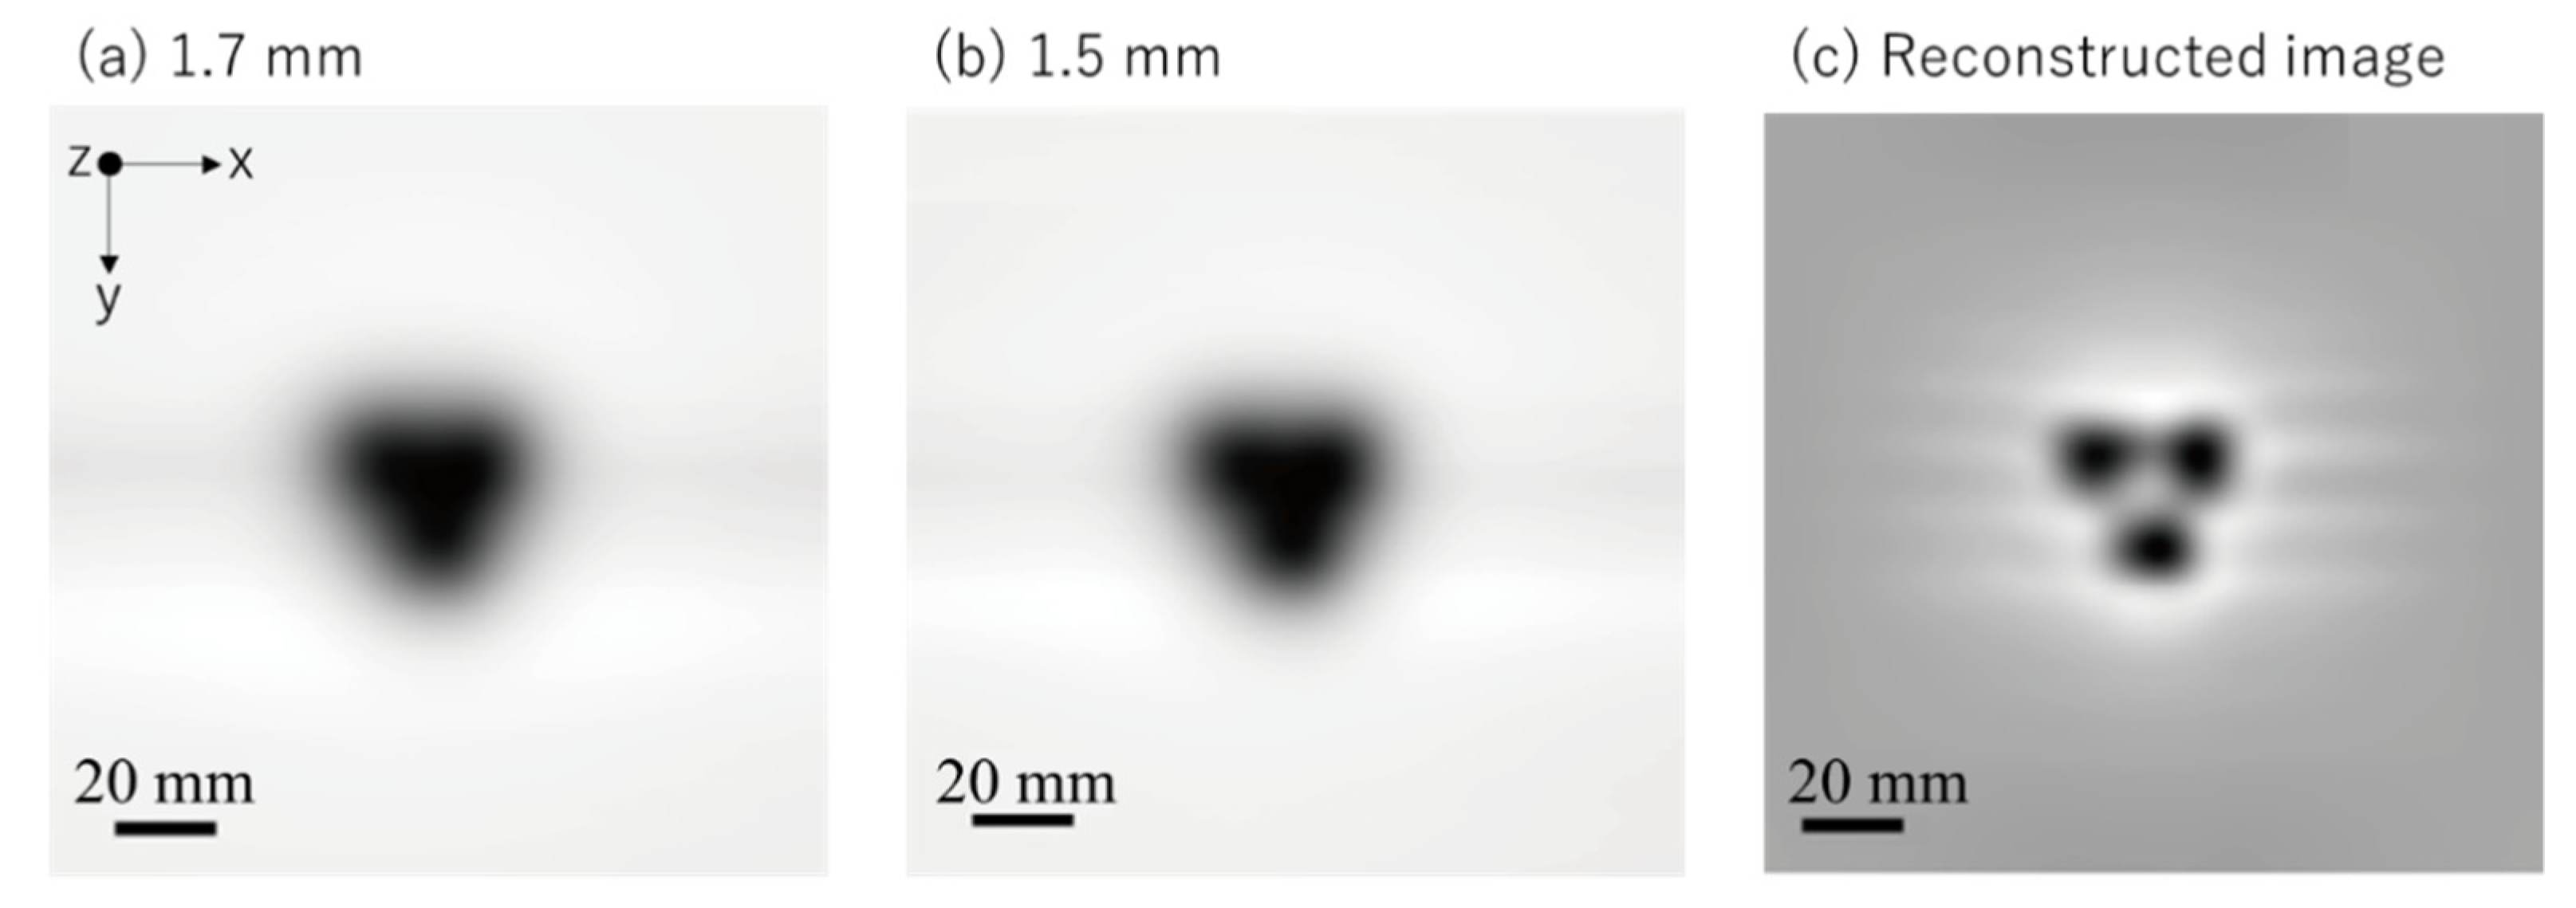
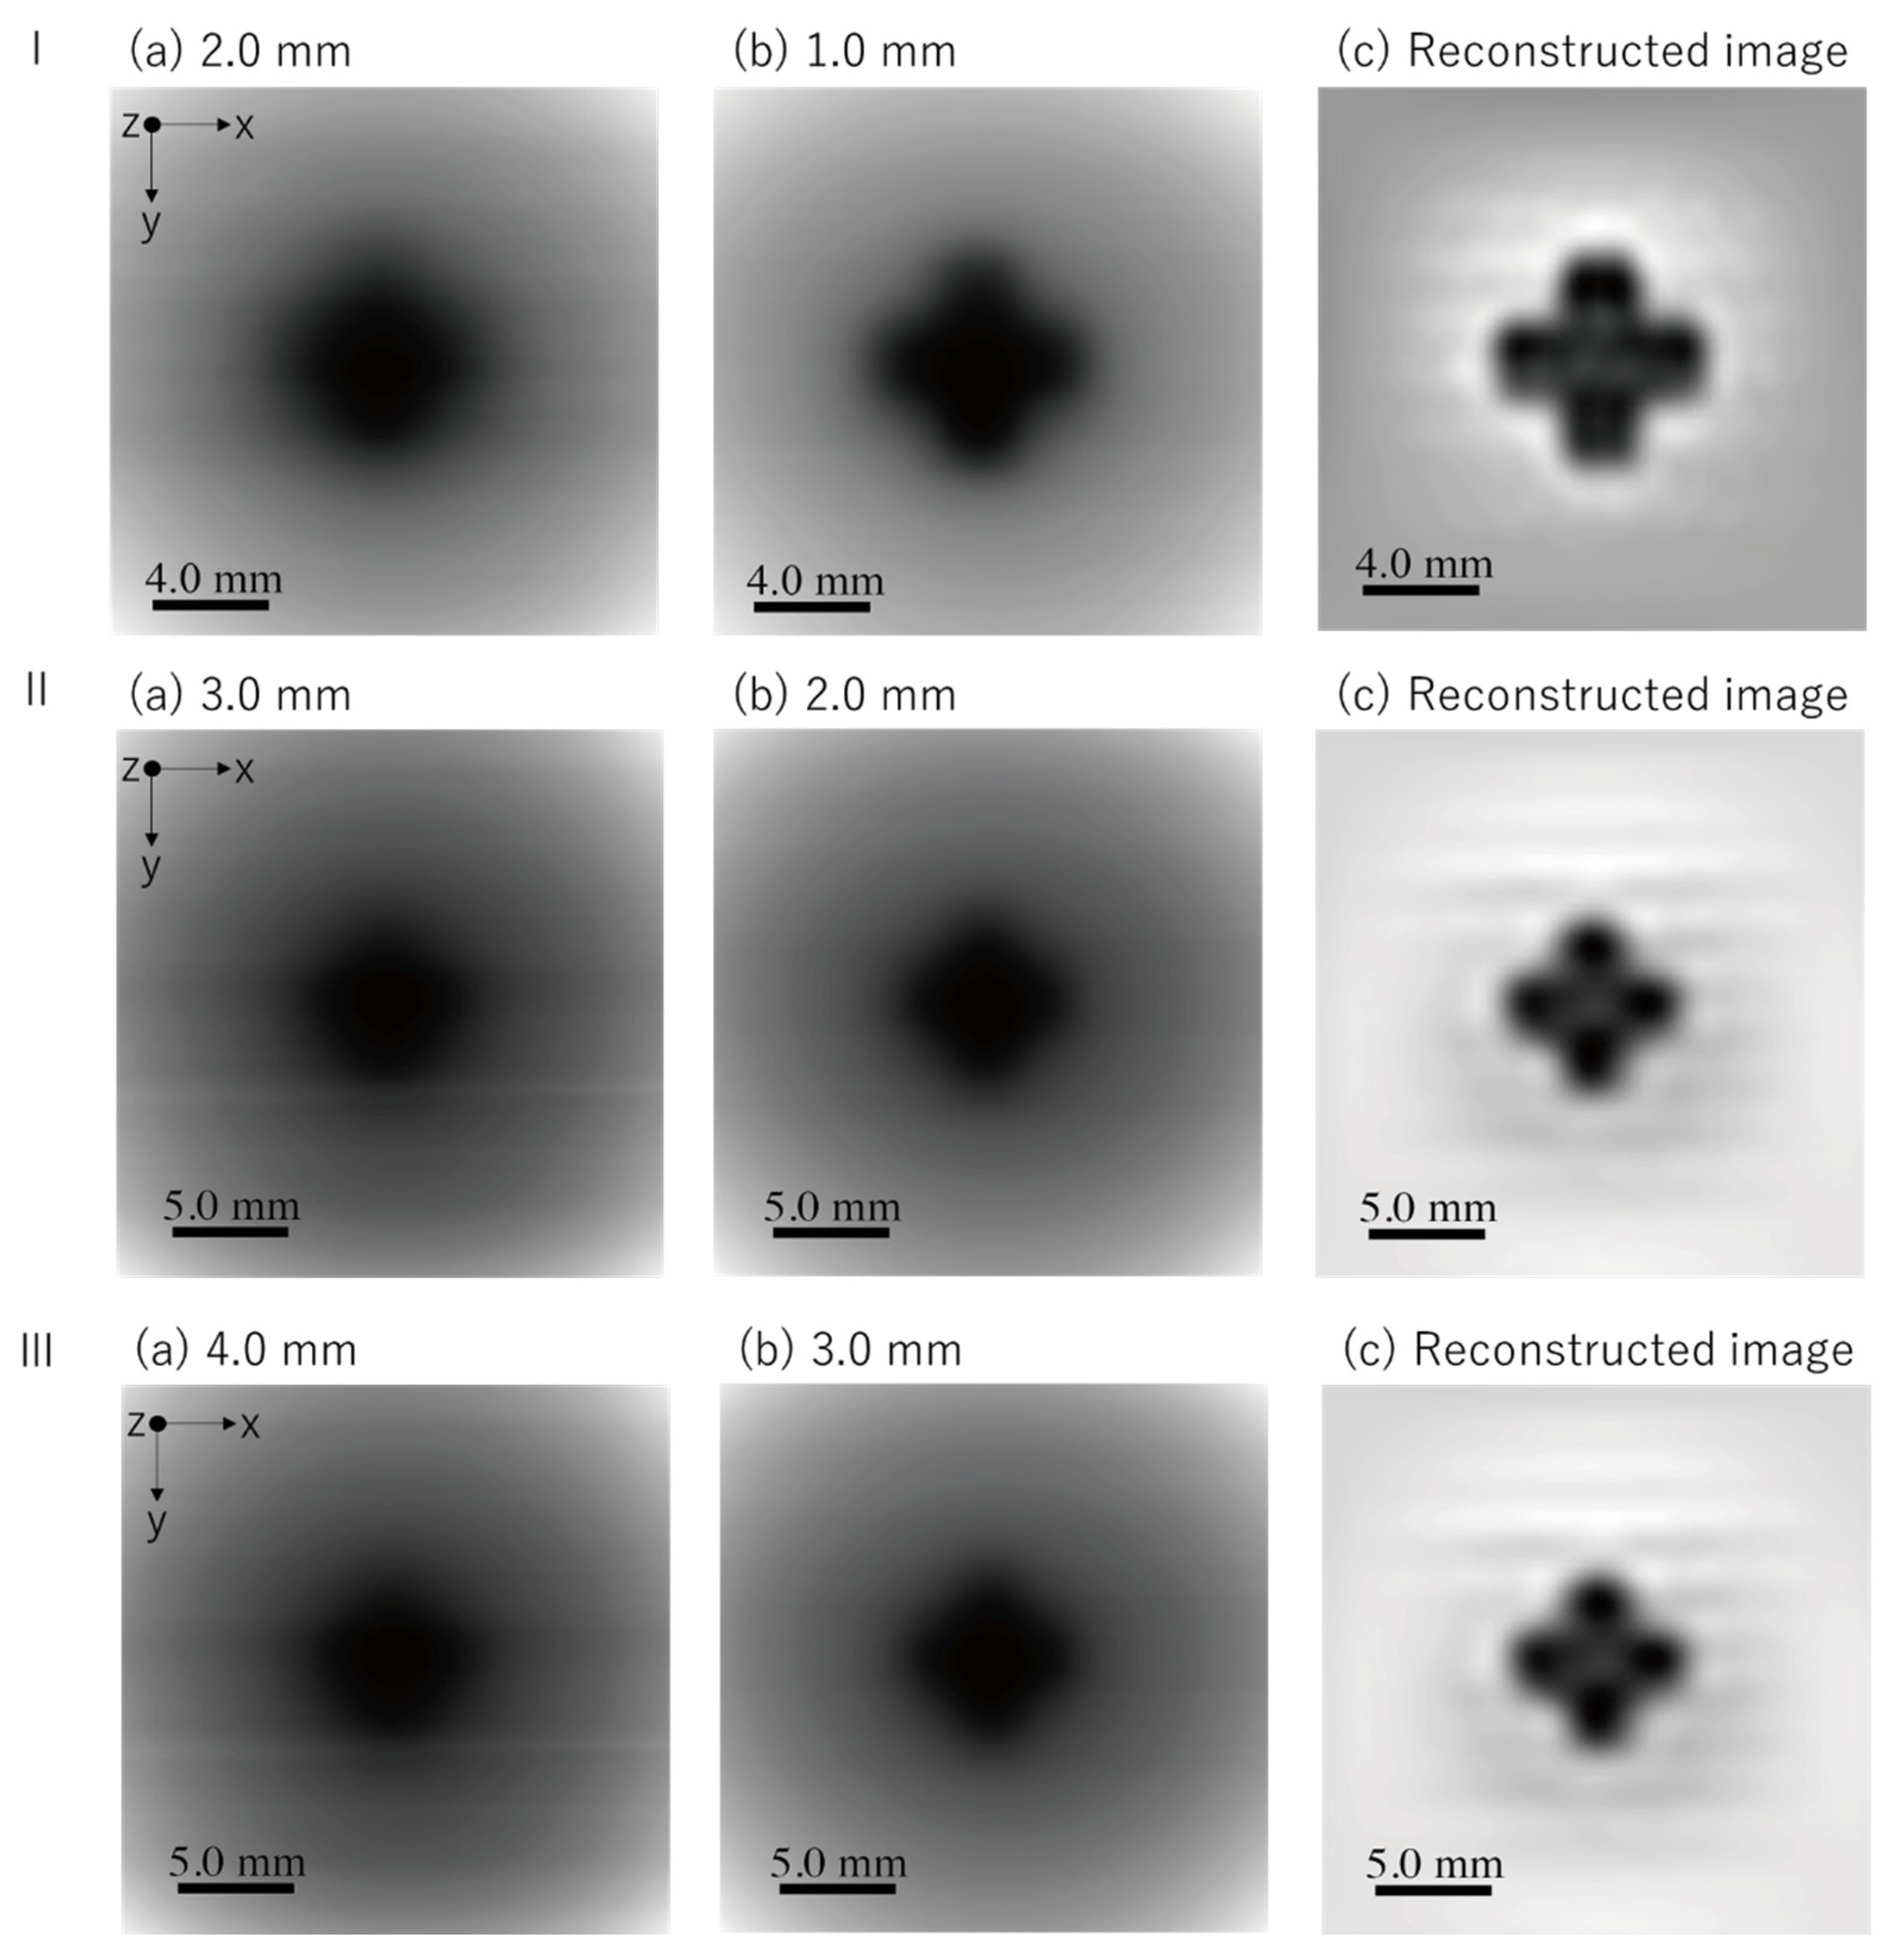
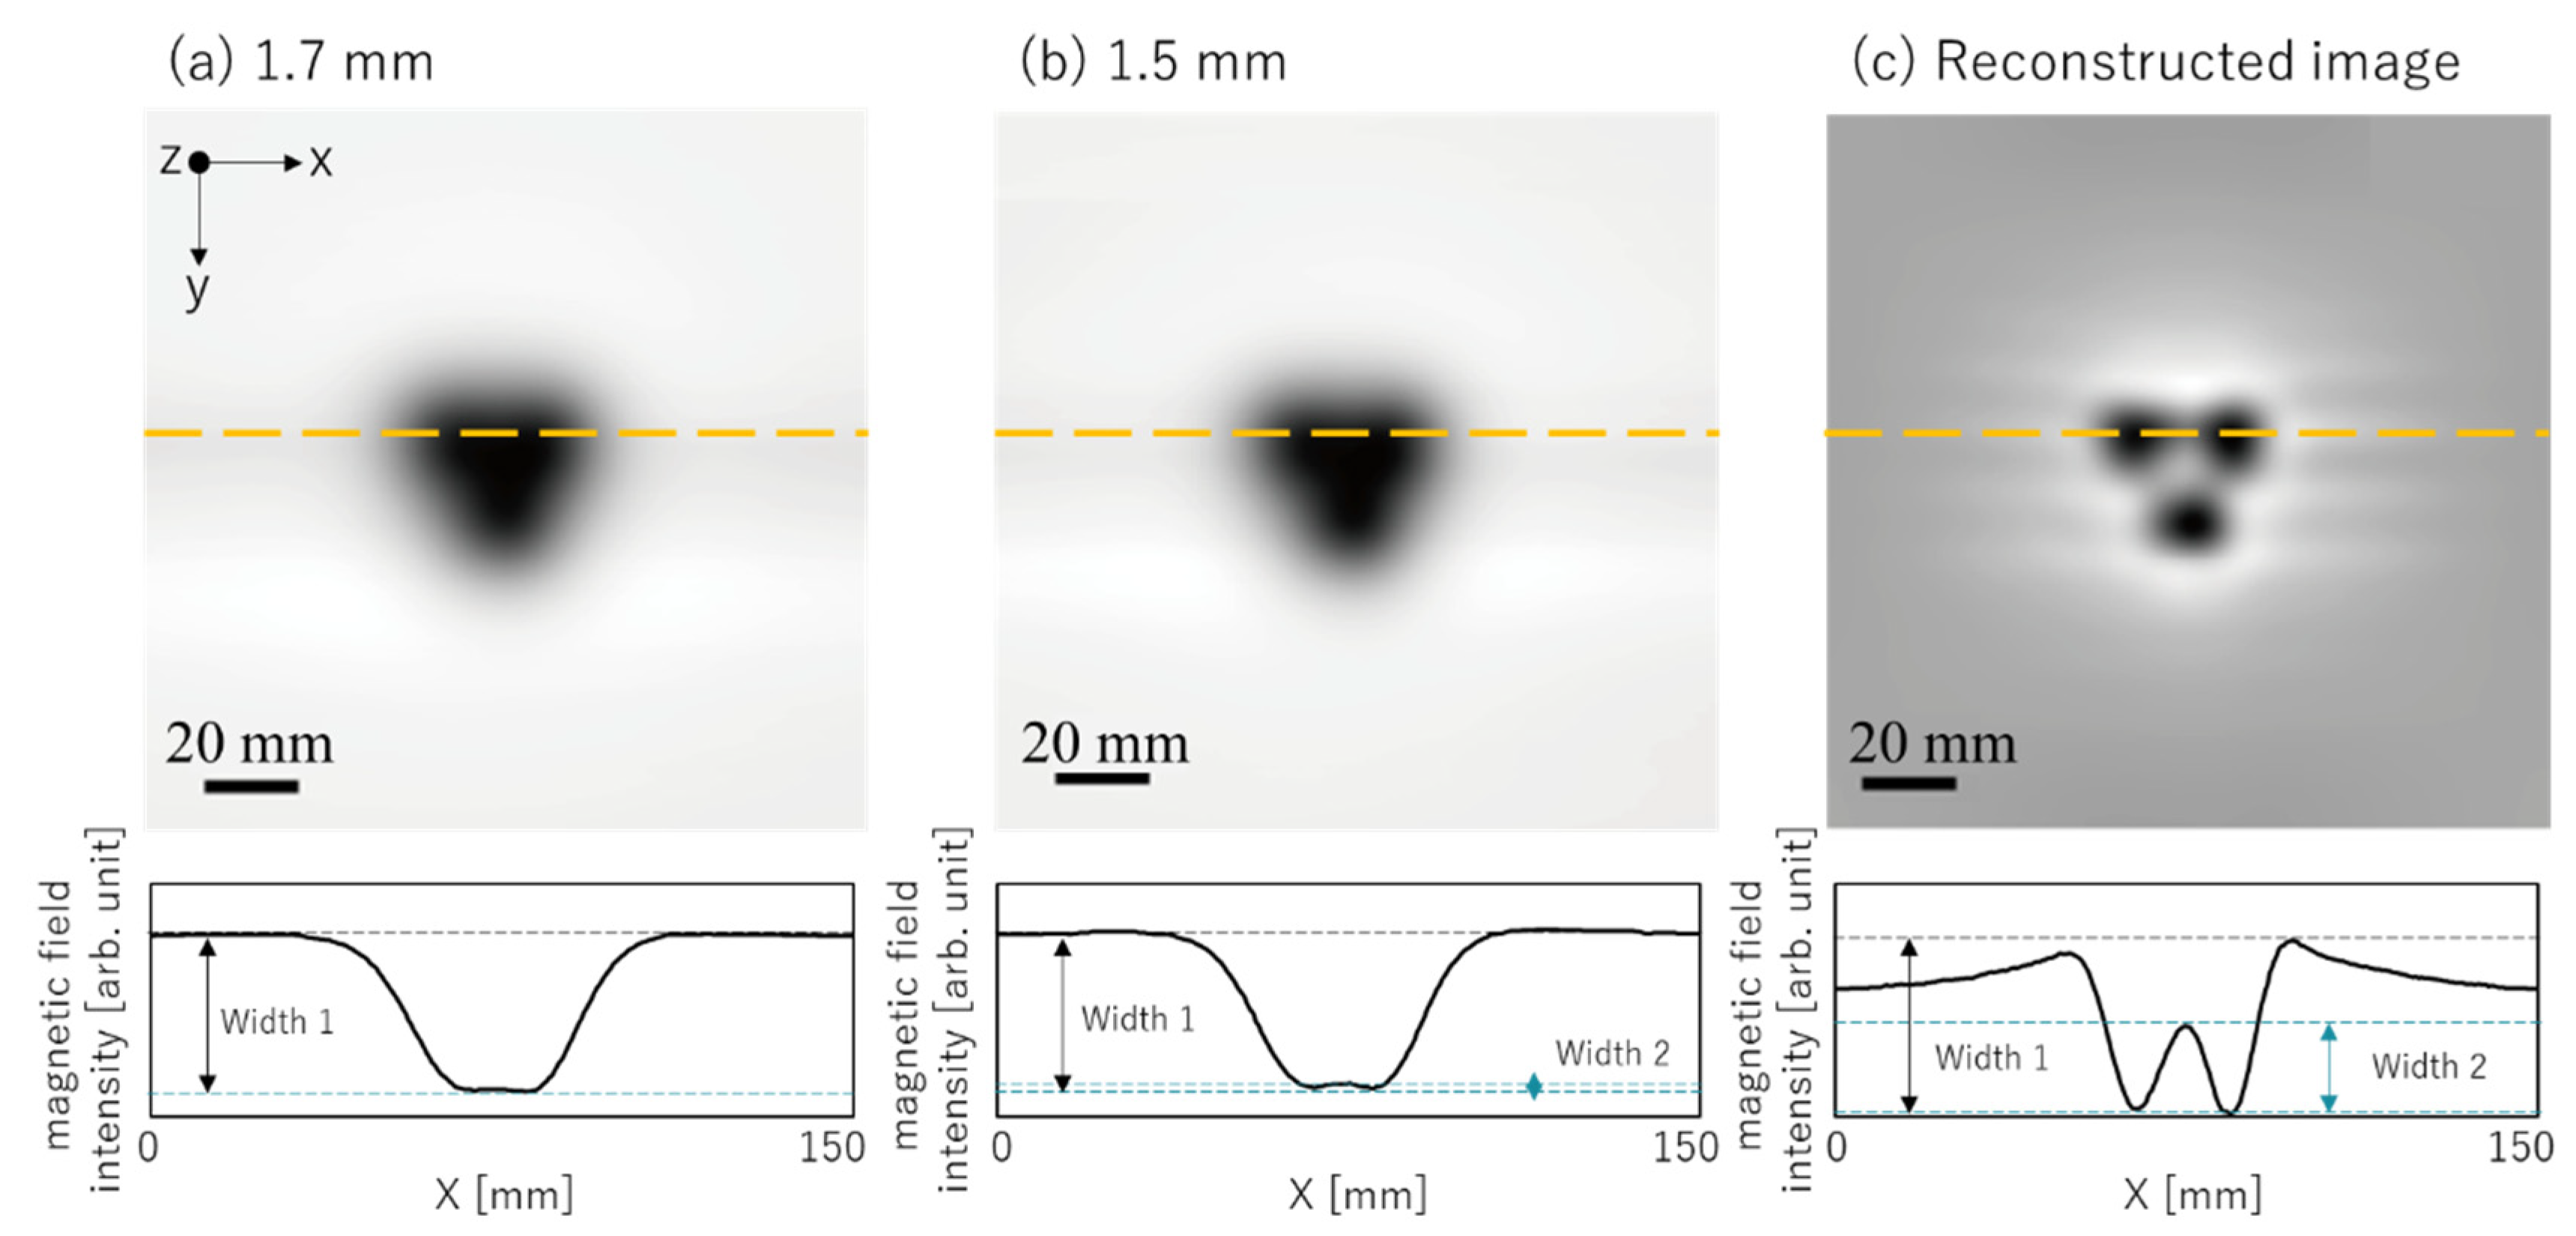
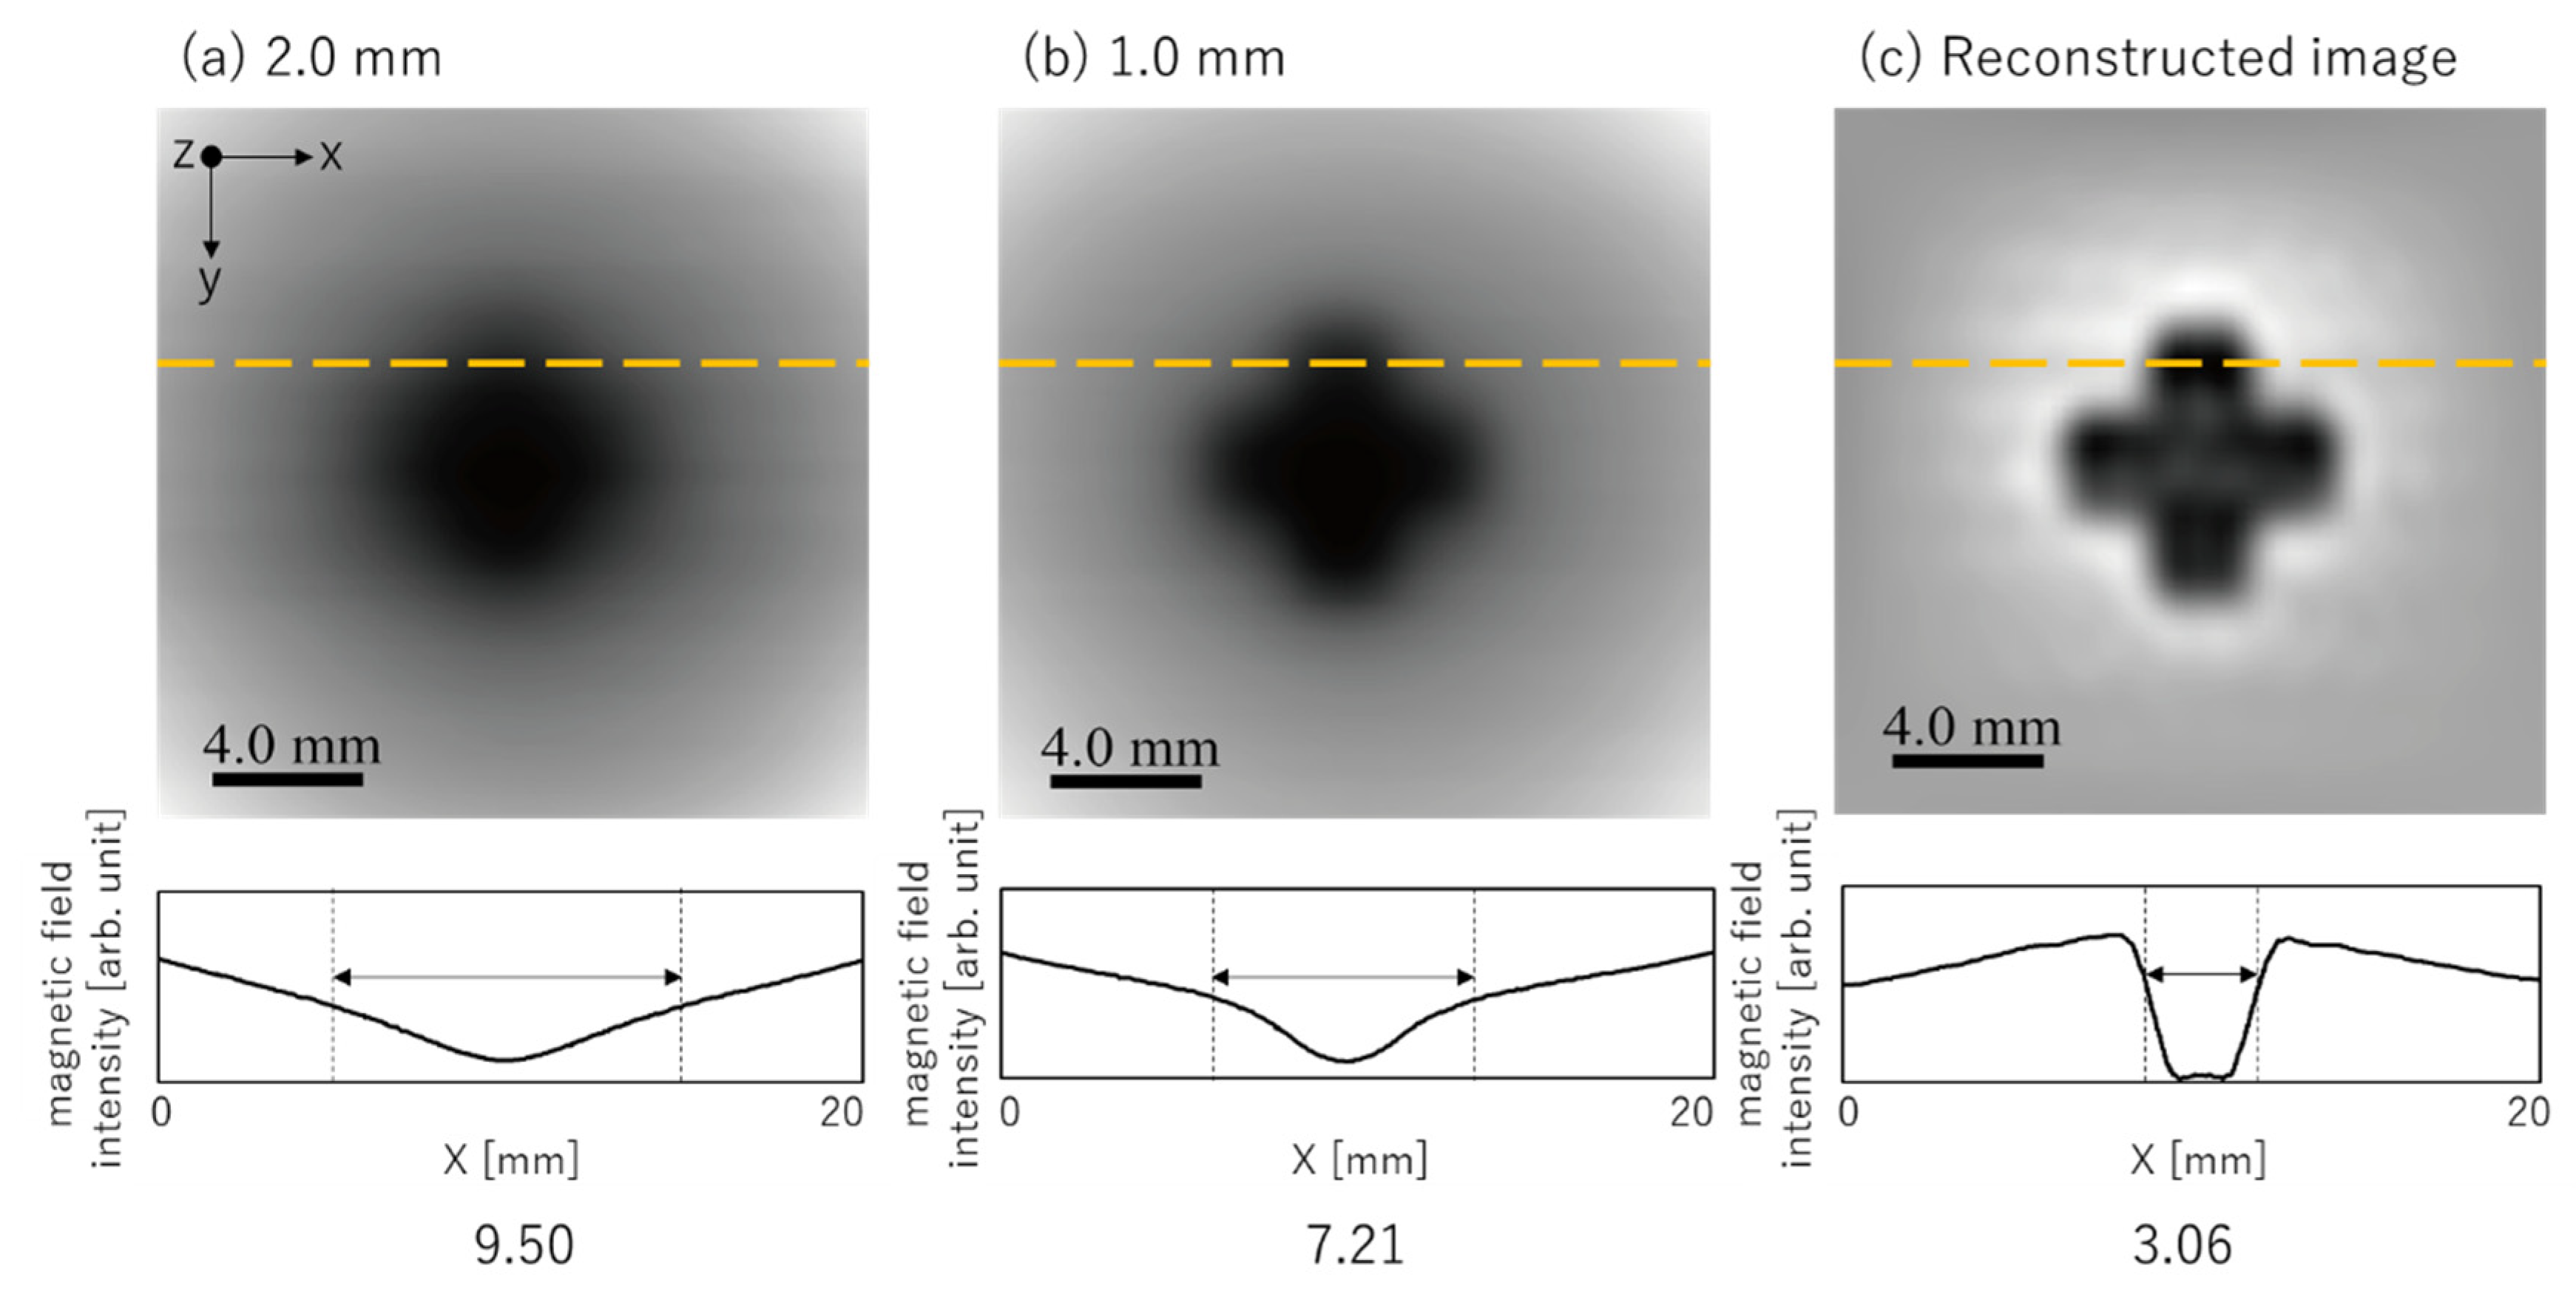
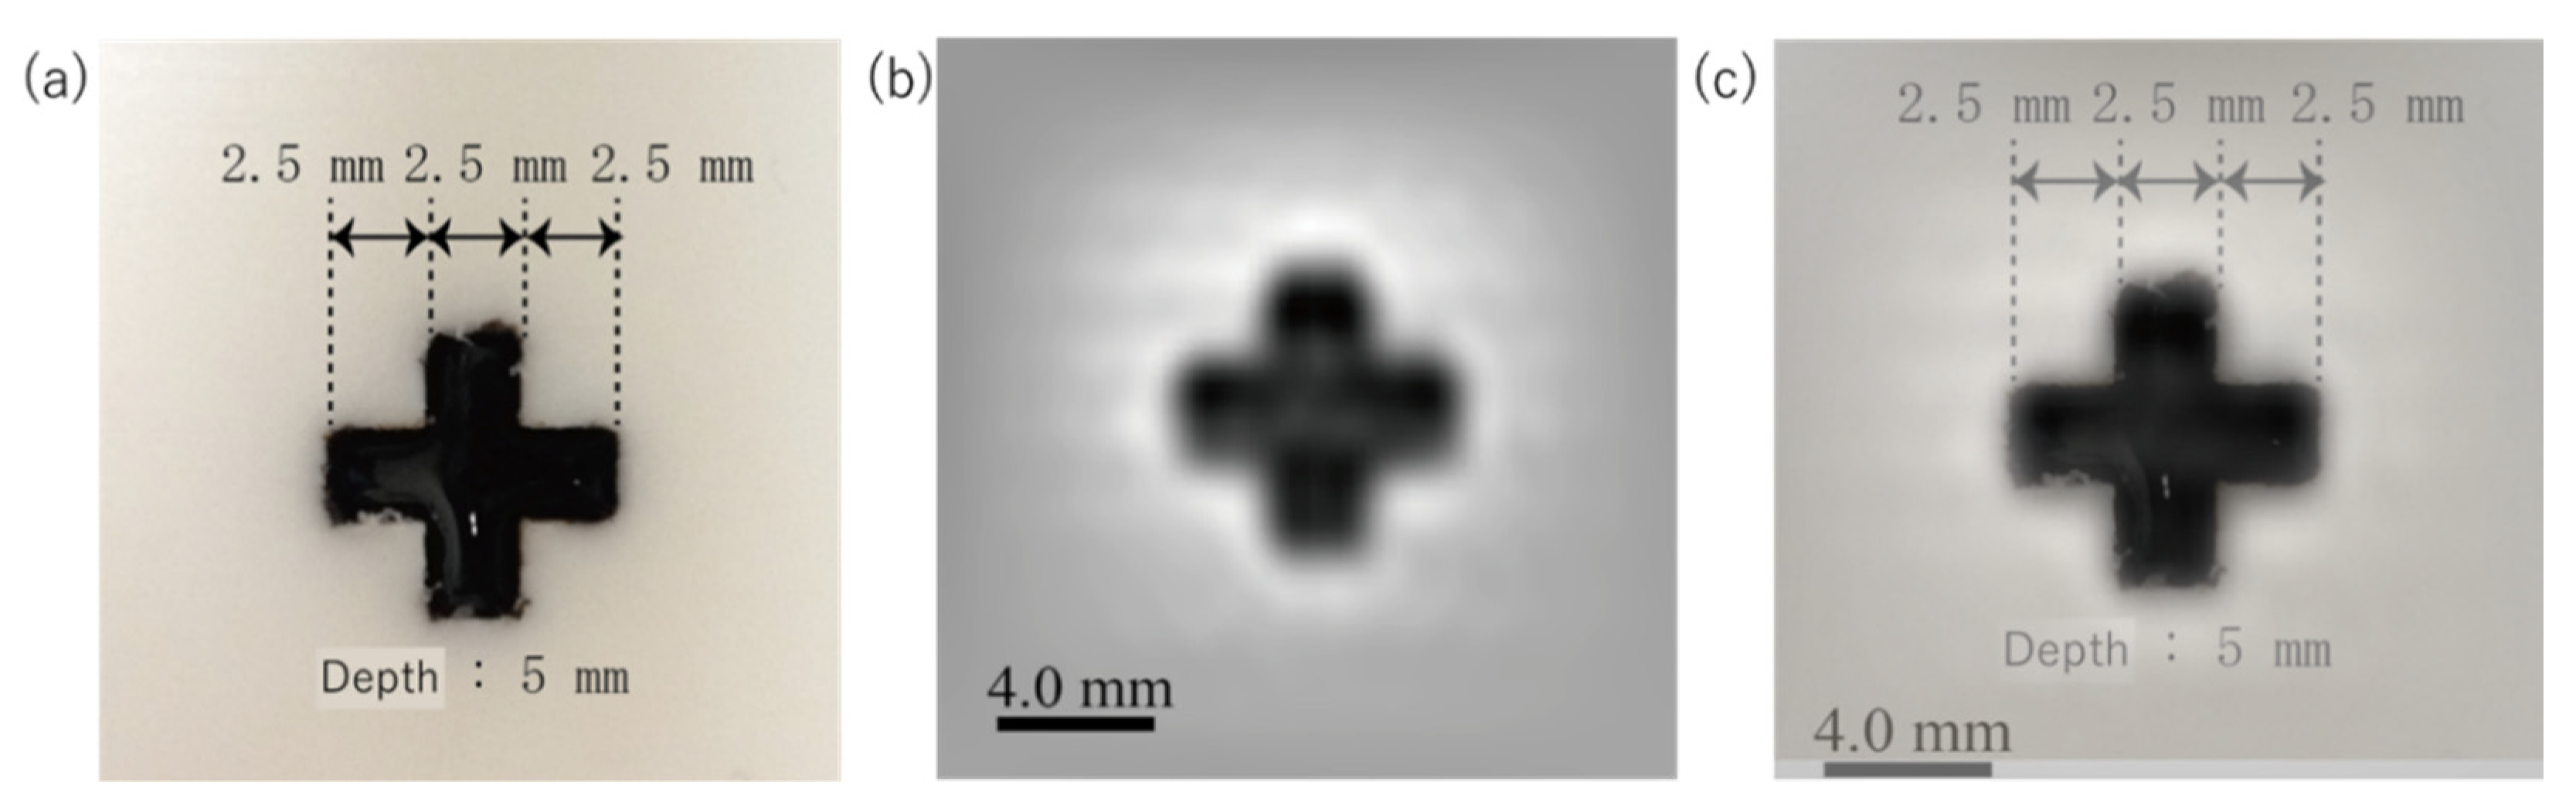
2. Results
3. Discussion
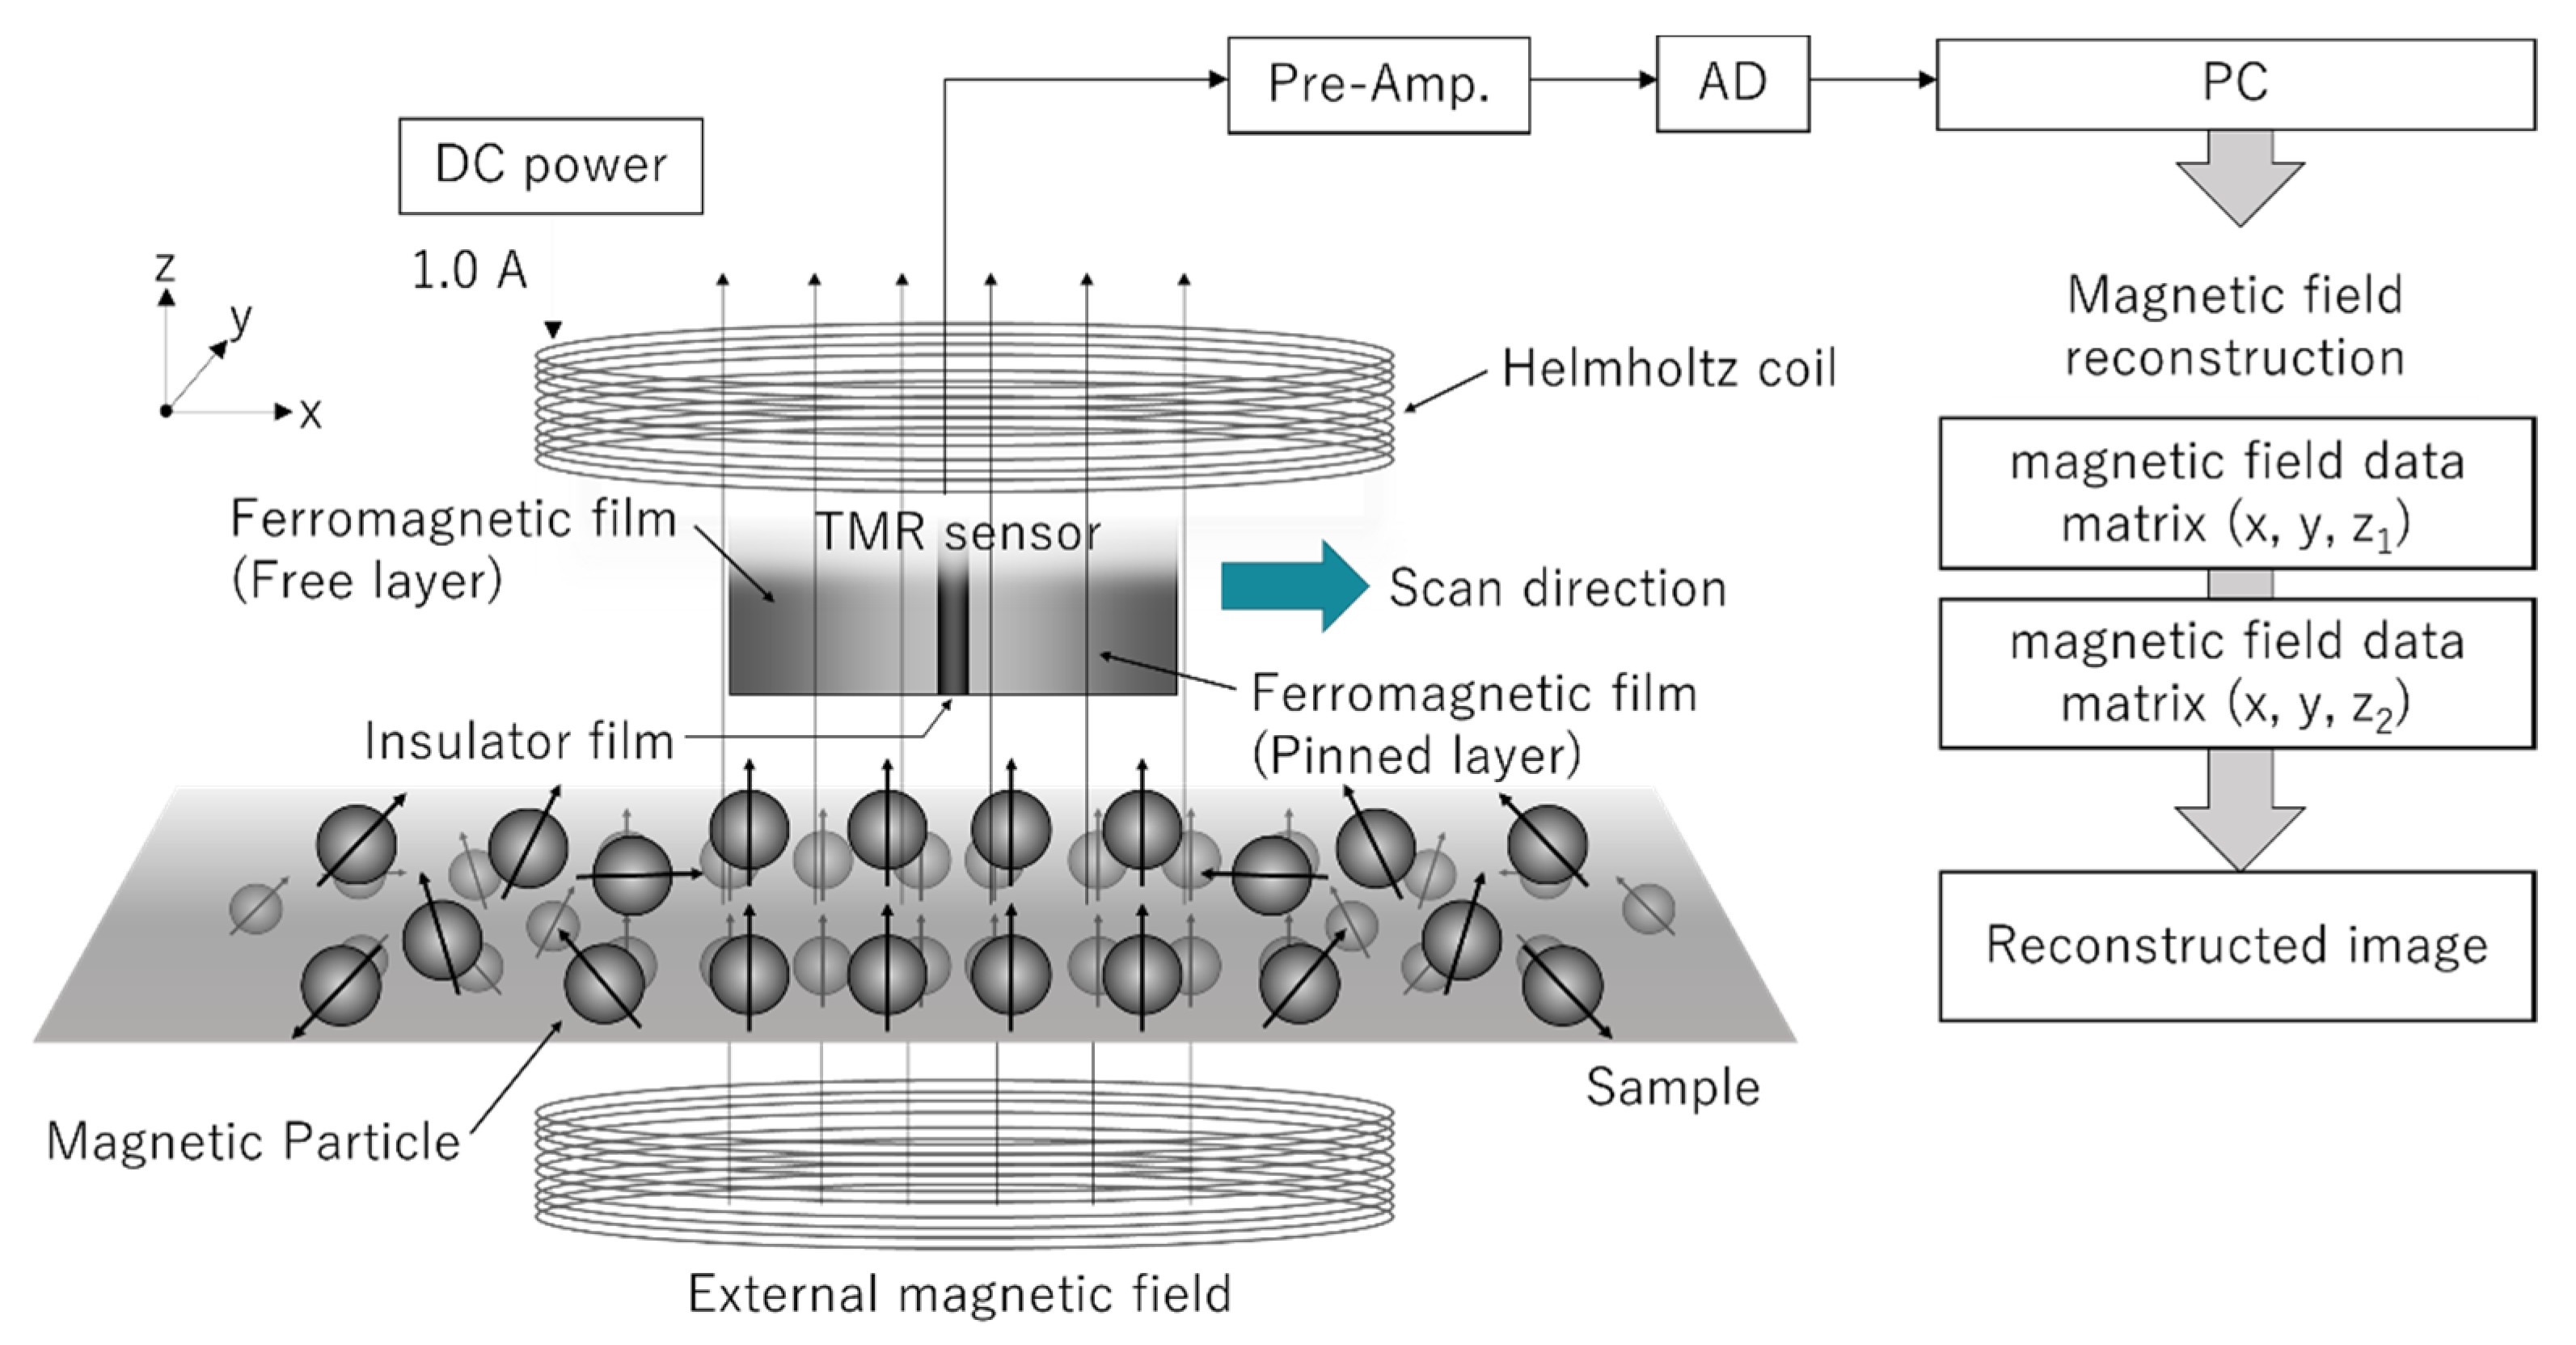
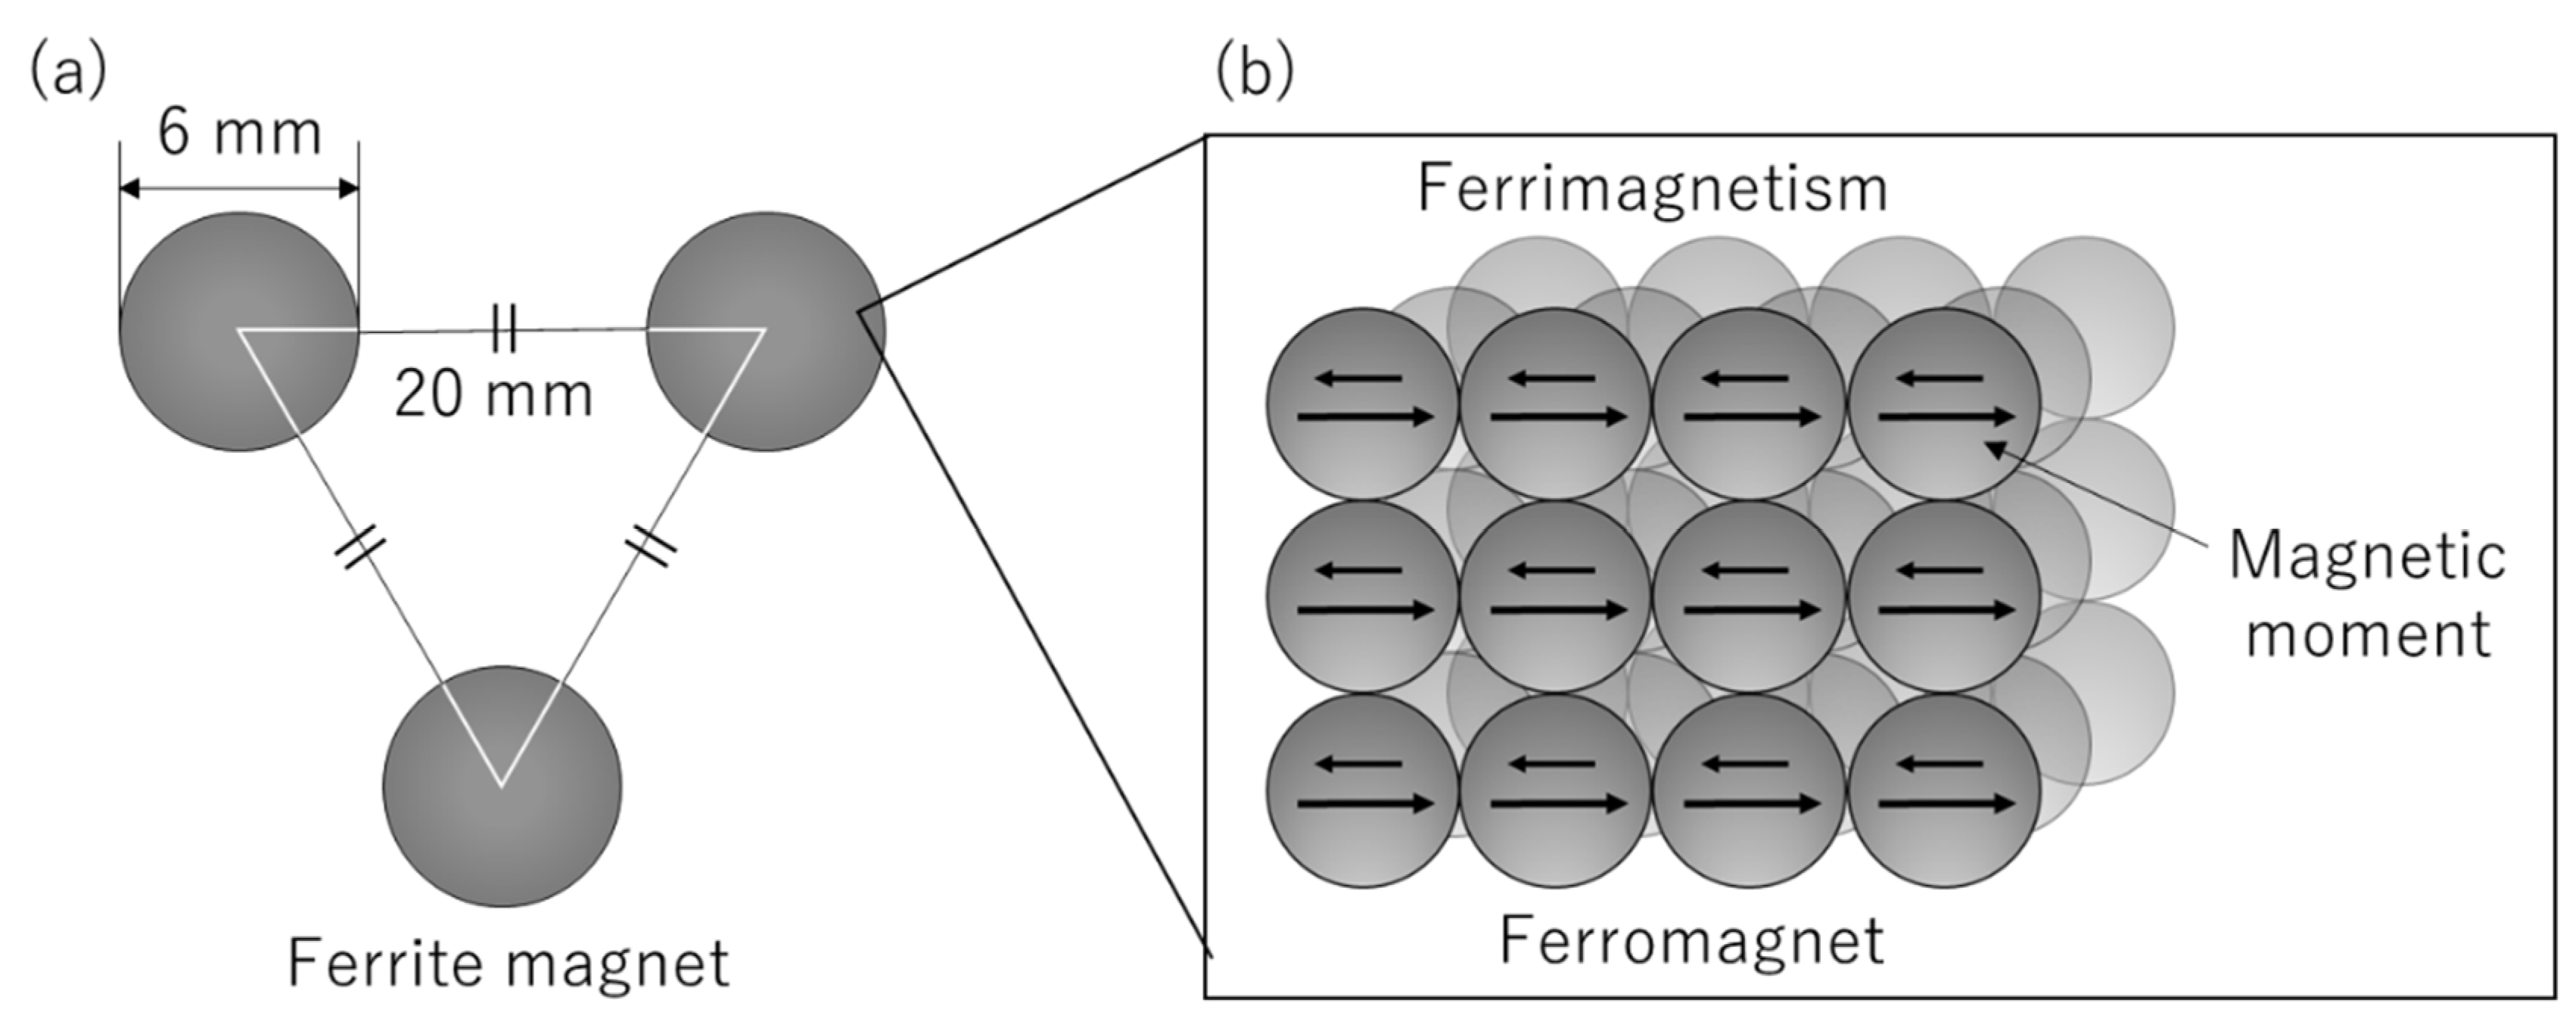
4. Materials and Methods
5. Conclusions
Author Contributions
Funding
Institutional Review Board Statement
Informed Consent Statement
Data Availability Statement
Acknowledgments
Conflicts of Interest
References
- D’Angelo-Donovan, D.D.; Dickson-Witmer, D.; Petrelli, N.J. Sentinel lymph node biopsy in breast cancer: A history and current clinical recommendations. J. Surg. Oncol. 2012, 21, 196–200. [Google Scholar] [CrossRef] [PubMed]
- Ahmed, M.; Purushotham, A.D.; Douek, M. Novel techniques for sentinel lymph node biopsy in breast cancer: A systematic review. Lancet Oncol. 2014, 15, e351–e362. [Google Scholar] [CrossRef]
- Giuliano, A.E.; Kirgan, D.M.; Guenther, J.M.; Morton, D.L. Lymphatic mapping and sentinel lymphadenectomy for breast cancer. Ann. Surg. 1994, 220, 391–401. [Google Scholar] [CrossRef] [PubMed]
- Lymphoid tissues. In Gray’s Anatomy: The Anatomical Basis of Clinical Practice, 41st ed.; Standring, S. (Ed.) Elsevier: Philadelphia, PA, USA, 2016; Volume 4, pp. 73–74. [Google Scholar]
- Morton, D.L.; Wen, D.; Wong, J.H.; Economou, J.S.; Cagle, L.A.; Storm, F.K.; Foshag, L.J.; Cochran, A.J. Technical details of intraoperative lymphatic mapping for early stage melanoma. Arch. Surg. 1992, 127, 392–399. [Google Scholar] [CrossRef] [PubMed]
- Krag, D.N.; Weaver, D.L.; Alex, J.C.; Fairbank, J.T. Surgical resection and radiolocalization of the sentinel lymph node in breast cancer using a gamma probe. Surg. Oncol. 1993, 2, 335–340. [Google Scholar] [CrossRef]
- Linehan, D.C.; Hill, A.D.K.; Akhurst, T.; Yeung, H.; Yeh, S.D.; Tran, K.N.; Borgen, P.I.; Cody, H.S., III. Intradermal radiocolloid and intraparenchymal blue dye injection optimize sentinel node identification in breast cancer patients. Ann. Surg. Oncol. 1999, 6, 450–454. [Google Scholar] [CrossRef] [PubMed]
- Shiozawa, M.; Lefor, A.T.; Hozumi, Y.; Kurihara, K.; Sata, N.; Yasuda, Y.; Kusakabe, M. Sentinel lymph node biopsy in patients with breast cancer using superparamagnetic iron oxide and a magnetometer. Breast Cancer 2013, 20, 223–229. [Google Scholar] [CrossRef] [PubMed]
- Sekino, M.; Kuwahata, A.; Ookubo, T.; Shiozawa, M.; Ohashi, K.; Kaneko, M.; Saito, I.; Inoue, Y.; Ohsaki, H.; Takei, H.; et al. Handheld magnetic probe with permanent magnet and Hall sensor for identifying sentinel lymph nodes in breast cancer patients. Sci. Rep. 2018, 8, 1195. [Google Scholar] [CrossRef] [PubMed] [Green Version]
- Lu, A.-H.; Salabas, E.; Schüth, F. Magnetic nanoparticles: Synthesis, protection, functionalization, and application. Angew. Chem. Int. Ed. 2007, 46, 1222–1244. [Google Scholar] [CrossRef] [PubMed]
- Salata, O. Applications of nanoparticles in biology and medicine. J. Nanobiotechnology 2004, 2, 3. [Google Scholar] [CrossRef] [PubMed] [Green Version]
- Mornet, S.; Vasseur, S.; Grasset, F.; Veverka, P.; Goglio, G.; Demourgues, A.; Portier, J.; Pollert, E.; Duguet, E. Magnetic nanoparticle design for medical applications. Prog. Solid State Chem. 2006, 32, 237–247. [Google Scholar] [CrossRef]
- Roth, B.J.; Sepulveda, N.G.; Wikswo, J.P. Using a magnetometer to image a two-dimensional current distribution. J. Appl. Phys. 1989, 65, 361–372. [Google Scholar] [CrossRef]
- Shi, R.; Jung, J.-H.; Schweser, F. Twodimensional local Fourier image reconstruction via domain decomposition Fourier continuation method. PLoS ONE 2019, 14, e0197963. [Google Scholar] [CrossRef] [PubMed]
- Liyakathunisa; Ravi Kumar, C.N. A novel super resolution reconstruction of low reoslution images progressively using dct and zonal filter based denoising. Int. J. Comput. Sci. Inf. Technol. 2011, 3, 1. [Google Scholar] [CrossRef]
- Mima, Y.; Kimura, K.; Inao, T.; Oyabu, N.; Kimura, N. Failure analysis of electric circuit board by high resolution magnetic field microscopy. In Proceedings of the 2013 3rd IEEE CPMT Symposium Japan, Kyoto, Japan, 11–13 November 2013; pp. 1–4. [Google Scholar]
- Kimura, K.; Mima, Y.; Inao, T.; Oyabu, N.; Inao, T.; Kimura, N. Development of High-resolution Magnetic Imaging Method with Tunneling Magnetoresistance Device to Inspect Reinforcing Steels Inside a Concrete Building. J. Jpn. Soc. Non-Destr. Insp. 2013, 62, 527–528. (In Japanese) [Google Scholar]


Publisher’s Note: MDPI stays neutral with regard to jurisdictional claims in published maps and institutional affiliations. |
© 2021 by the authors. Licensee MDPI, Basel, Switzerland. This article is an open access article distributed under the terms and conditions of the Creative Commons Attribution (CC BY) license (https://creativecommons.org/licenses/by/4.0/).
Share and Cite
Inagaki, A.; Suzuki, T.; Mima, Y.; Kimura, K. Development of Magnetic Particle Distribution Imaging Using Magnetic Field Reconstruction for Biopsy of the Sentinel Lymph Node. Magnetochemistry 2021, 7, 85. https://0-doi-org.brum.beds.ac.uk/10.3390/magnetochemistry7060085
Inagaki A, Suzuki T, Mima Y, Kimura K. Development of Magnetic Particle Distribution Imaging Using Magnetic Field Reconstruction for Biopsy of the Sentinel Lymph Node. Magnetochemistry. 2021; 7(6):85. https://0-doi-org.brum.beds.ac.uk/10.3390/magnetochemistry7060085
Chicago/Turabian StyleInagaki, Akari, Tomoko Suzuki, Yuki Mima, and Kenjiro Kimura. 2021. "Development of Magnetic Particle Distribution Imaging Using Magnetic Field Reconstruction for Biopsy of the Sentinel Lymph Node" Magnetochemistry 7, no. 6: 85. https://0-doi-org.brum.beds.ac.uk/10.3390/magnetochemistry7060085