Article

Phase Formation, Microstructure and Permeability of Fe-Deficient Ni-Cu-Zn Ferrites, (I): Effect of Sintering Temperature

Dept. SciTec., Ernst-Abbe-Hochschule Jena, 07745 Jena, Germany
*
Author to whom correspondence should be addressed.
Submission received: 5 July 2021 / Revised: 27 July 2021 / Accepted: 9 August 2021 / Published: 14 August 2021
(This article belongs to the Special Issue Development and Applications of Advanced Magnetic Ceramic Materials)

Abstract

:
We have studied the densification, phase formation, microstructure, and permeability of stoichiometric and Fe-deficient Ni-Cu-Zn ferrites of composition Ni0.30Cu0.20Zn0.50+zFe2-zO4-(z/2) with 0 ≤ z ≤ 0.06 sintered at temperatures from 900 °C to 1150 °C. The shrinkage is shifted from 1000 °C for z = 0 towards lower temperatures and reaches its maximum rate at 900 °C for z = 0.02. Stoichiometric ferrites show regular growth of single-phase ferrite grains if sintered at Ts ≤ 1100 °C. Sintering at 1150 °C leads to the formation of a small amount of Cu2O, triggering exaggerated grain growth. Fe-deficient compositions (z > 0) form Cu-poor stoichiometric ferrites coexisting with a minority CuO phase after sintering at 900–1000 °C. At Ts ≥ 1050 °C, CuO transforms into Cu2O, and exaggerated grain growth is observed. The formation of Cu oxide second phases is investigated using XRD, SEM, and EDX. The permeability of the ferrites increases with sintering temperature up to a maximum permeability of µ = 230 for z = 0 or µ = 580 for z = 0.02, respectively, at Ts = 1000 °C. At higher sintering temperatures, the permeability decreases, which is due to the formation of a microstructure with intra-crystalline porosity in large grains, and a non-magnetic Cu oxide grain boundary phase.

1. Introduction

Ni-Cu-Zn ferrites are an important group of soft magnetic materials for many applications including power ferrites, EMI devices, and multilayer inductors. The main advantages of Ni-Cu-Zn ferrites are their low sintering temperature Ts, high resistivity, medium permeability, low loss, and good performance up to MHz frequencies [1,2,3,4]. Magnetic properties critically depend, among other factors, on ferrite composition and microstructure. Owing to the lower sintering temperatures of Ni-Cu-Zn ferrites as compared with Ni-Zn or Mn-Zn ferrites, it is necessary to investigate in detail the effect of sintering conditions on the microstructure and magnetic properties of the ferrites, and to design specific sintering protocols to achieve optimum performance. Many studies were performed to investigate the low-temperature sintering behavior of Ni-Cu-Zn ferrites. For applications in multilayer inductors, ferrites are cofired with silver metallization as low as Ts ≤ 900 °C. Most studies report on a specific ferrite composition, which is fired at 900 °C using a sintering additive, as well as its microstructure formation, permeability, and DC bias superposition behavior [5,6,7,8]. Papers reporting correlations between Ni-Cu-Zn ferrite composition, sintering behavior, and magnetic properties, on the other hand, are scarce [9,10]. A common feature of low-firing ferrite compositions is a small deficiency of iron oxide in the starting oxide mixture (<50 mol% Fe2O3). Such Fe-deficient compositions typically translate into a spinel formula with less than two Fe per formula unit, for example, Me1.02Fe1.98O3.99, as compared with stoichiometric ferrites with 50 mol% Fe2O3 and the formula unit MeFe2O4. It has been reported that Fe-deficiency enhances densification [11,12,13,14]. Moreover, it has was found that secondary phases might precipitate at grain boundaries and affect the magnetic properties. In Fe-deficient ferrites, tenorite CuO was found to form at triple points or grain boundaries after sintering at 900 °C [14] and at 1100 °C [15]. The formation of microstructural defects including precipitates of copper at grain boundaries was also observed in Fe-deficient Ni-Cu-Zn ferrites using TEM [16]. On the other hand, Sun et al. reported the formation of ZnO as secondary phase in Fe-deficient samples [17]. For a stoichiometric Ni-Cu-Zn ferrite, a detailed study of phase composition and microstructure revealed precipitation of CuO and ZnO after sintering at 1200 °C, with their concentrations depending on green density, sintering temperature, and cooling rate [18,19]. Nazrin et al. [20] did not detect any secondary phases in Fe-deficient ferrites.
In this contribution, we report a systematic study on phase formation, microstructure, and permeability of Fe-deficient Ni0.30Cu0.20Zn0.50+zFe2-zO4-(z/2) ferrites with 0 ≤ z ≤ 0.06. In part I of this study, we focus on the effect of sintering temperature in air atmosphere. In part II, we will describe in detail the effect of oxygen partial pressure. It is found that the grain size increases with sintering temperature Ts until a critical temperature, where intra-crystalline pores and abnormally grown large grains start to appear. For z ≥ 0, CuO precipitates at grain boundaries, which is transformed into Cu2O at high temperature. The amount of CuO increases with Fe-deficiency z. The permeability increases with Ts and grain size in the range of predominance of regular grain growth. At higher Ts, the formation of Cu2O at grain boundaries initiates abnormal grain growth and intra-crystalline porosity and, consequently, a decrease in permeability is observed.

2. Results

2.1. Powder Properties

Single-phase ferrite powders were obtained after calcination at 900 °C (XRD results not shown here). After milling, a mean particle size of the powder of d50 = 0.7 µm was measured using laser diffraction, which represents the size of aggregates. The specific surface of the ferrite powder of S = 5 m²/g corresponds to a mean particle diameter of primary particles of dBET = 220 nm.

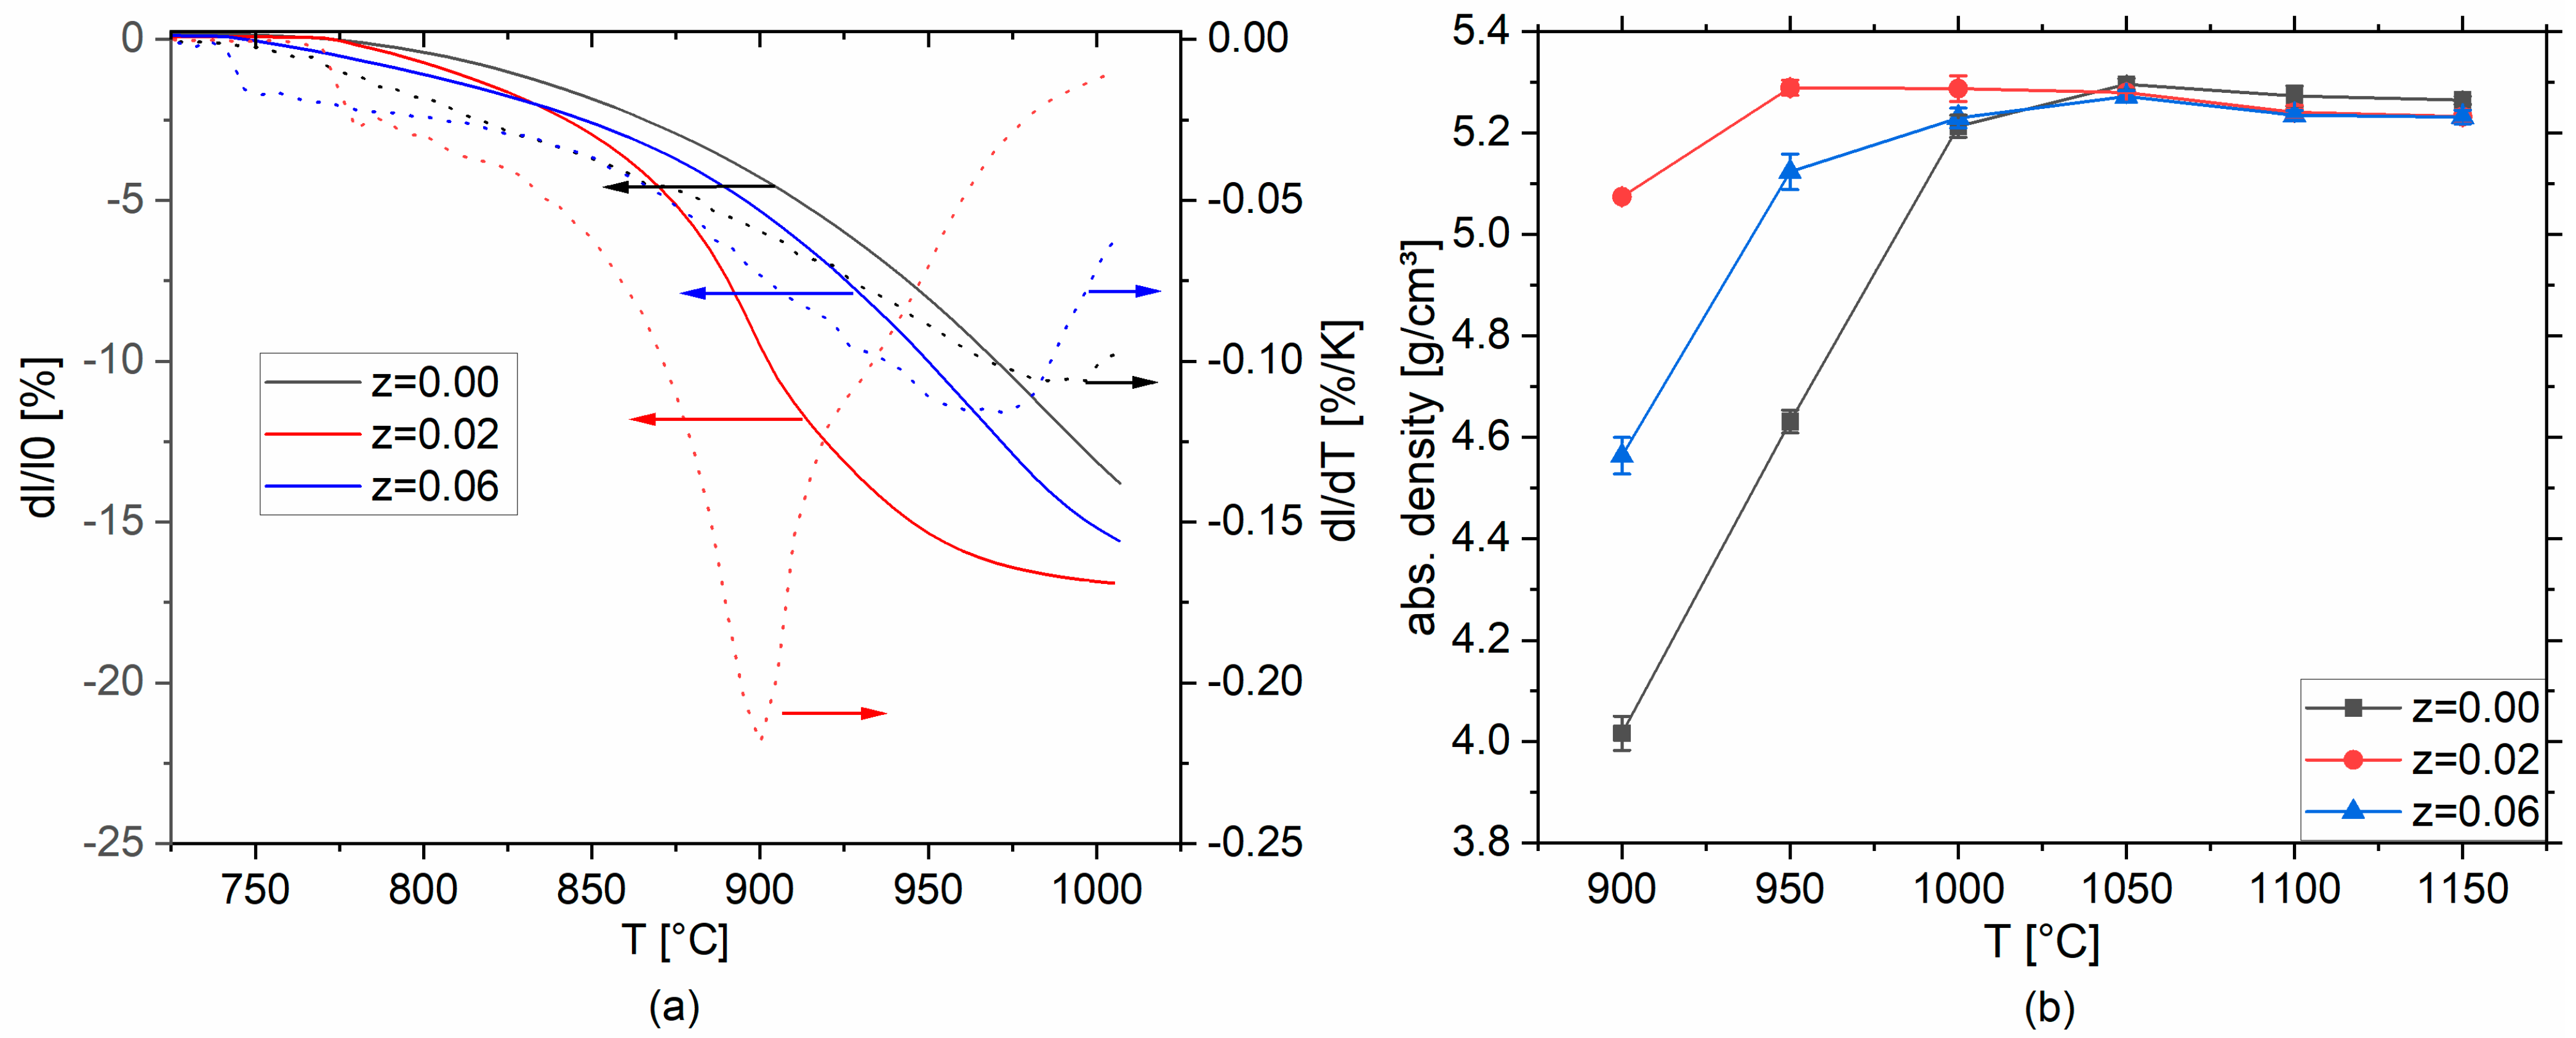
2.2. Shrinkage and Densification Behavior

Dilatometric shrinkage measurements of pellets made from milled powders demonstrate that the Fe-deficiency z significantly affects the shrinkage and shrinkage rate in Ni0.30Cu0.20Zn0.50+zFe2-zO4-(z/2) (Figure 1a).
Stoichiometric Ni0.3Cu0.2Zn0.5Fe2O4 (z = 0) has its maximum shrinkage rate at about 970 °C. Shrinkage is shifted towards lower temperatures with increasing Fe-deficiency; for z = 0.02, the maximum shrinkage is at 900 °C. For z > 0.02, the temperature of the maximum shrinkage rate is increased (Figure 1a). The observed differences in the shrinkage of stoichiometric and Fe-deficient Ni-Cu-Zn ferrites are also reflected in the densification behavior. Stoichiometric Ni-Cu-Zn ferrite (z = 0) experiences limited densification at 900 °C (75%) and sintering at Ts ≥ 1000 °C is required for densification (Figure 1b). Ferrites with z = 0.02 exhibit excellent densification behavior and sintering at 900 °C already leads to good density of 5.07(1) g/cm³ (95%); sintering at T ≥ 950 °C results in almost complete densification of 5.28(1) g/cm³ (99%). For larger Fe-deficiency (z = 0.06), a somewhat reduced densification is observed and a sintering temperature of Ts = 1000 °C is necessary to achieve good densities.

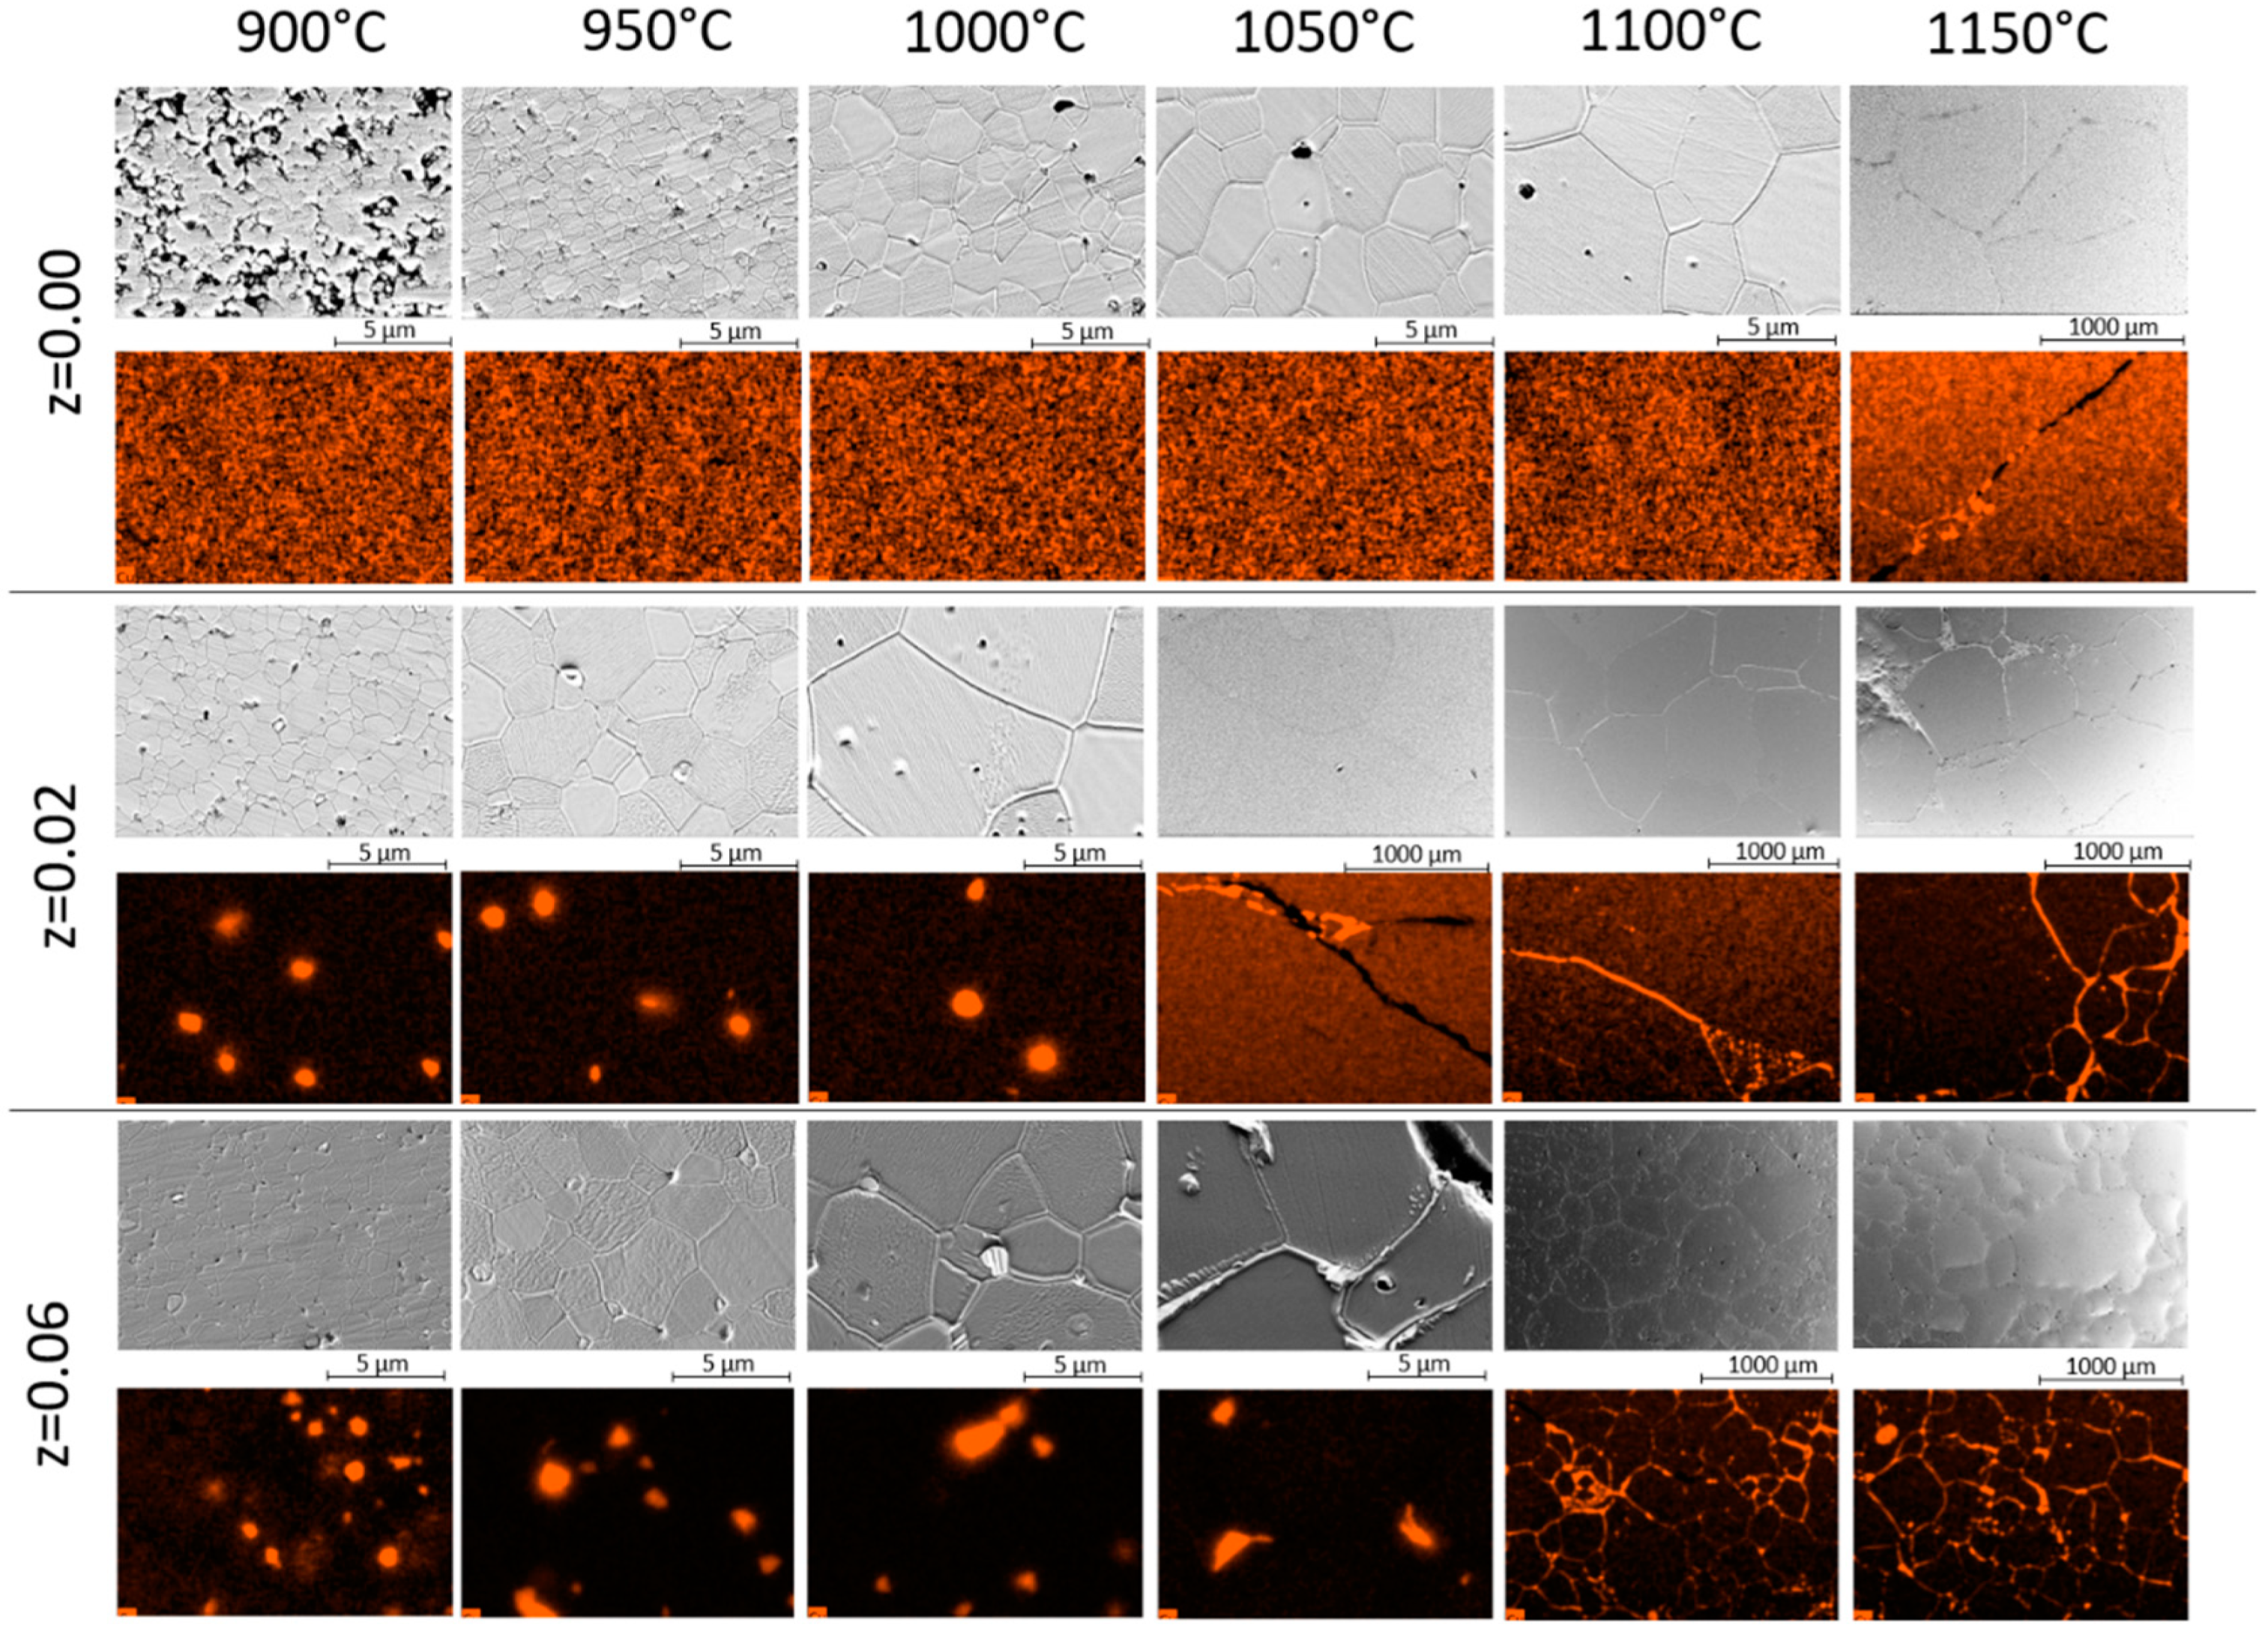
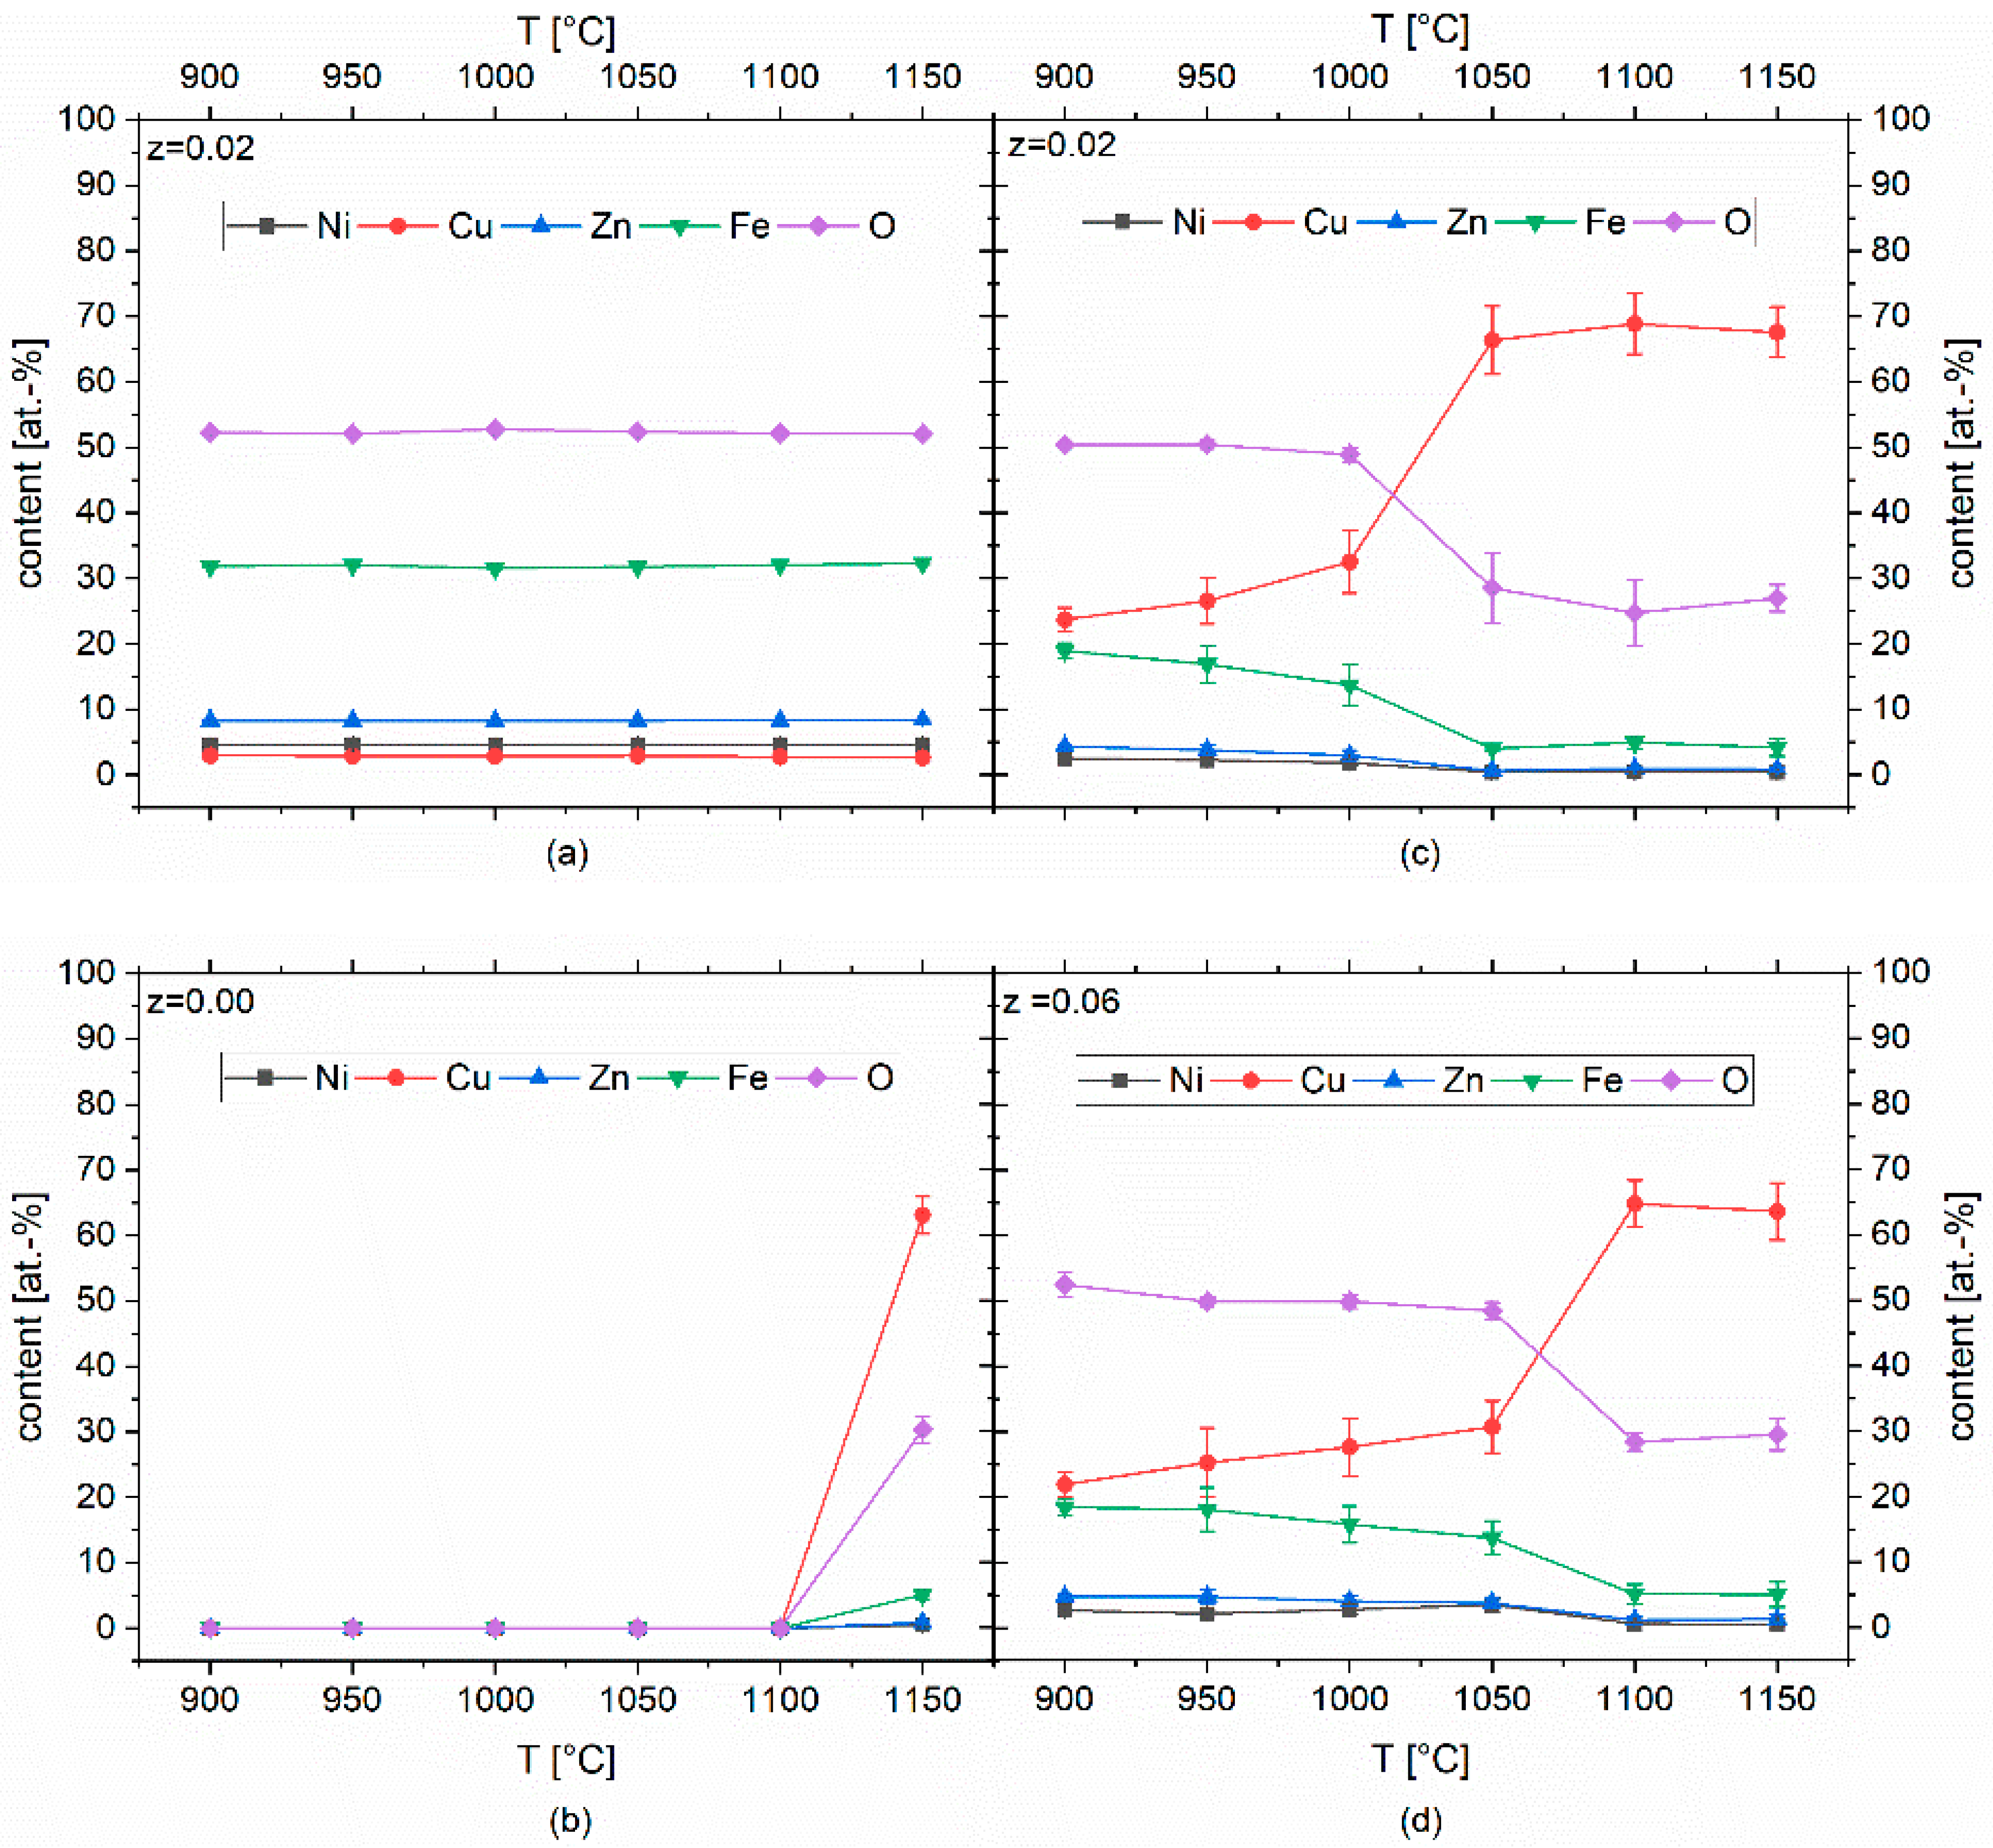
2.3. Microstructure and Element Distribution

SEM micrographs of samples with different values of Fe-deficiency z sintered at temperatures between 900 °C and 1150 °C are presented in Figure 2. The stoichiometric ferrite (z = 0.00) exhibits regular grain growth up to Ts ≤ 1100 °C, whereas a sample sintered at 1150 °C consists of very large grains of about 1 mm in size as a result of exaggerated grain growth. For samples sintered at Ts ≥ 1050 °C, intra-crystalline porosity is observed.
The evolution of grain size versus temperature (Figure 3) confirms regular grain growth behavior for Ts < 1150 °C.
For Fe-deficient ferrites (z > 0), exaggerated grain growth already starts to appear at lower temperatures, at Ts > 1000 °C for z = 0.02 and at Ts > 1050 °C for z = 0.06 (Figure 2 and Figure 3). Pores within the ferrite grains were found at Ts = 1000 °C for z = 0.02 and at Ts = 1050 °C for z = 0.06, i.e., at temperatures about 50 °C below the beginning of exaggerated grain growth.
The composition of the matrix grains and grain boundary regions was studied using energy dispersive X-ray analysis (EDX). The composition of the ferrite matrix grains remains unchanged (within the given resolution) for different sintering temperatures, as demonstrated for z = 0.02 in Figure 4a.
The distribution of the copper oxide phase in the microstructure was studied in some detail. In addition to SEM micrographs, Figure 2 shows EDX mappings of the Cu distribution for all samples and sintering temperatures Ts. In the case of stochiometric ferrites (z = 0), a homogeneous distribution of Cu is found, except for the sample sintered at 1150 °C, where enrichment of Cu is detected at grain boundaries between very large grains.
For Fe-deficient ferrites (z = 0.02 and 0.06), Cu-rich regions in the triple points between regularly grown ferrite grains are found. A different situation is observed in microstructures dominated by accelerated grain growth. At Ts ≥ 1050 °C for z = 0.02 and at Ts ≥ 1100 °C for z = 0.06, the Cu oxide phase is found to form a network along the grain boundaries of the very large ferrite grains (Figure 2). The variation of the elemental concentrations of copper and oxygen from EDX measurements is depicted versus sintering temperature in Figure 4b–d. For z = 0, a separate copper oxide phase with 63.1 at% Cu and 30.3 at% oxygen is detected at 1150 °C (Figure 4b). For Fe-deficient spinel ferrites, Cu-, Fe-, and O-contents of about 30 at%, 15 at%, and 50 at%, respectively, were found at low Ts. At higher sintering temperatures of Ts ≥ 1050 °C for z = 0.02 and at Ts ≥ 1100 °C for z = 0.06, different elemental concentrations of about 66 at% Cu, minor quantities of iron, and 30 at% O are observed (Figure 4c,d). This indicates a phase transition from tenorite CuO (theor. 50 at% Cu and O) to cuprite Cu2O (theor. 66 at% Cu and 33 at% O) to take place at around 1050 °C in the Cu-oxide grain boundary phase.

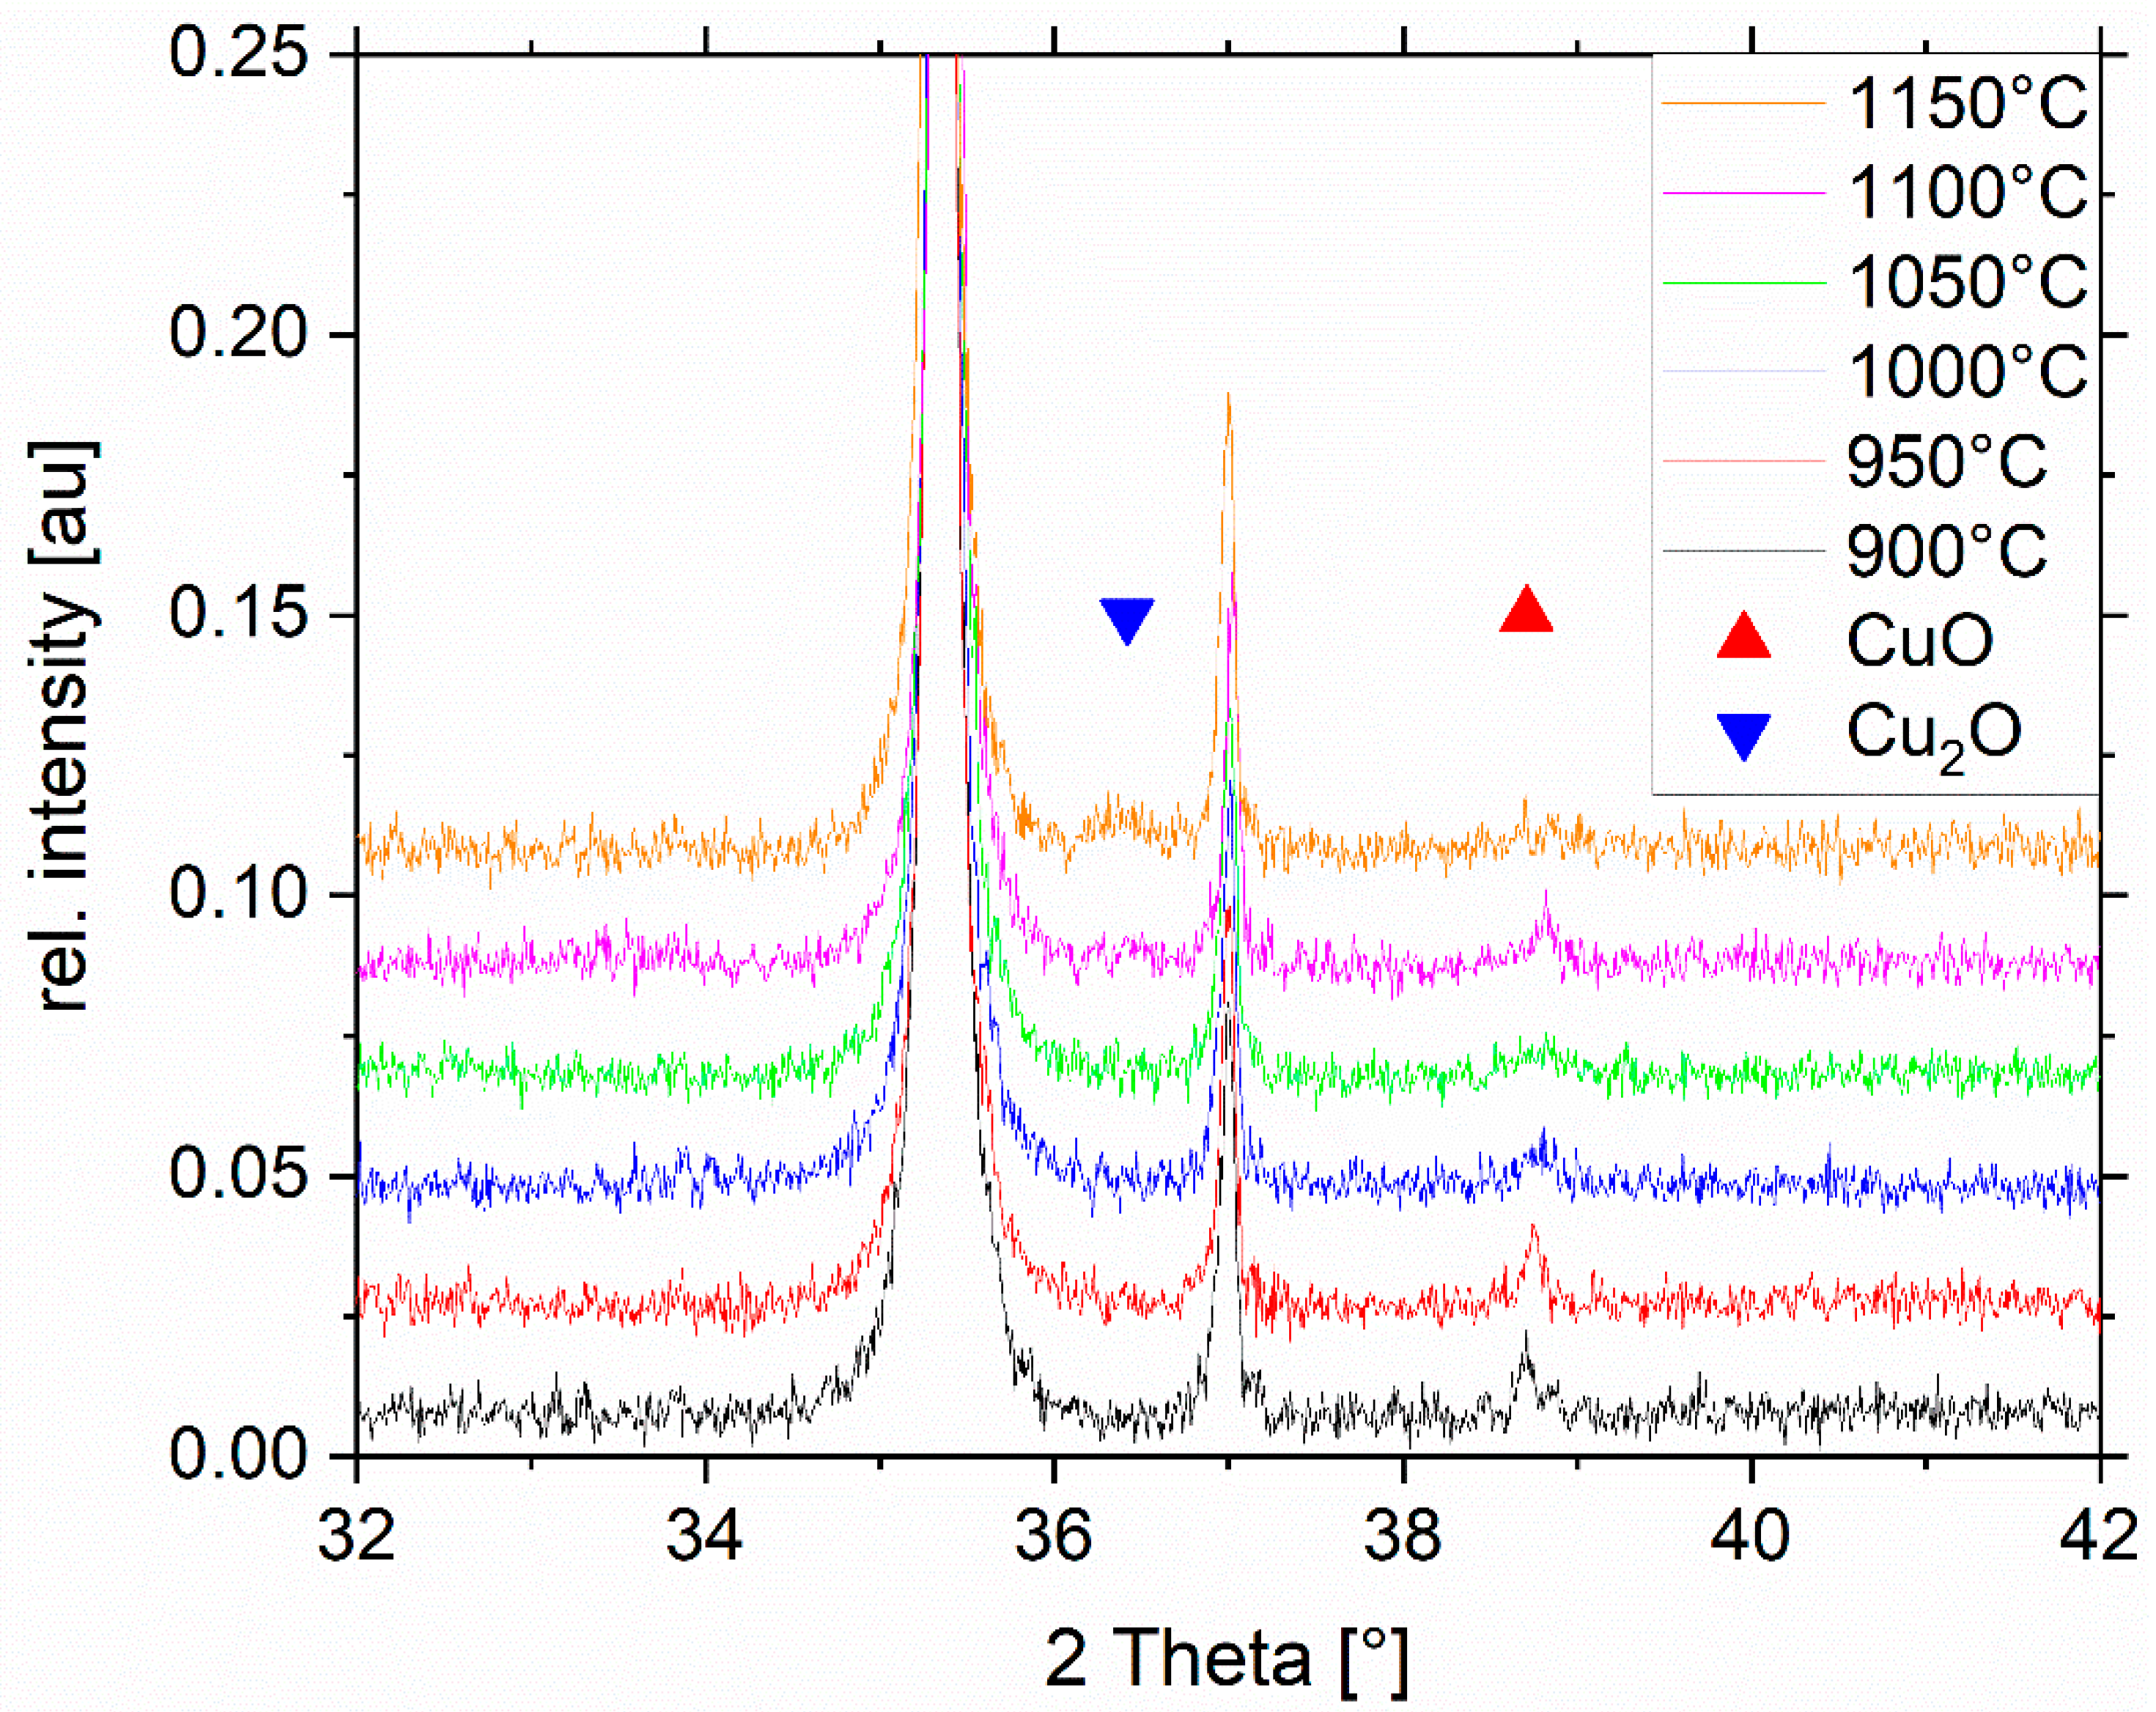
2.4. Phase Formation

The phase composition of the ferrites was also investigated using X-ray diffraction (XRD). A single-phase ferrite with spinel-type structure was found at z = 0 (not shown here). In the XRD pattern of the sample with z = 0.06 (Figure 5), an additional peak at 2θ = 38.7°, which is identified as (110) reflection of tenorite CuO, appears for samples sintered between 900 °C and 1100 °C.
This peak was hardly detectable in the ferrite with z = 0.02, because, in that case, the CuO concentration seems to be below the XRD detection limit. For a sample with z = 0.06 sintered at 1150 °C, this CuO peak disappears and another one at about 2θ = 36.4° is found, which confirms a phase transition into cuprite Cu2O (Figure 5). The cubic lattice parameters a0 of the spinel ferrites with z = 0, 0.02, and 0.06 are plotted versus sintering temperature in Figure 6a. An increase of a0 with z reflects a change in the ferrite matrix grain compositions. Moreover, a0 also increases somewhat with Ts (for each Fe-deficiency z), indicating a very small change in ferrite composition.
The phase compositions of the samples were obtained from Rietveld refinements of XRD powder data. The concentrations of ferrite, tenorite CuO, and cuprite Cu2O are shown as a function of sintering temperature Ts in Figure 6b–d. For z = 0, the ferrite concentration is >99 wt%, except for the sample sintered at 1150 °C, with slightly reduced ferrite content of about 98.5 wt%. Correspondingly, the CuO content (<0.25 wt%) and the Cu2O contents are negligibly small (<0.5 wt%) for Ts = 900 °C to 1100 °C, but the concentration of Cu2O increases to 1.25 wt% at 1150 °C (Figure 6d). For z = 0.02, the ferrite content is also >99 wt%, except for Ts = 1150 °C, where the ferrite content is 98.7 wt%. The CuO content is about 0.5 wt% (Figure 6c). The Cu2O content is negligibly small at Ts ≤ 1100 °C, but increases to 0.8 wt.-% at Ts = 1150 °C (Figure 6d). For larger Fe-deficiency of z = 0.06, a clearer situation is observed: the ferrite content (Figure 6b) slightly decreases from 98.5 wt% at Ts = 900 °C to 97.7 wt.-% at Ts = 1150 °C. The CuO concentration (Figure 6c) slightly decreases as well from about 0.9 wt% at Ts = 900 °C to 0.7 wt% at Ts = 1100 °C, and then steeply declines to 0.35 wt% at Ts = 1150 °C. Simultaneously, the cuprite Cu2O concentration (Figure 6d) increases with Ts, reaching a maximum of almost 2 wt% at Ts = 1150 °C.

2.5. Thermal Analysis

Thermoanalytical investigations were carried out to characterize the phase transformation behavior (Figure 7). Thermogravimetry (TG) curves of Fe-deficient ferrites with z = 0.02 and 0.06 exhibit a slight mass loss at about 1040 °C, indicating a reduction of the CuO secondary phase and formation of Cu2O. The stoichiometric ferrite (z = 0) does not show such mass loss in that temperature range, but a small mass loss at 1135 °C, which might signal ferrite decomposition and Cu2O formation. For comparison, pure CuO powder shows a mass loss starting at 1030 °C, indicating reduction and release of oxygen.

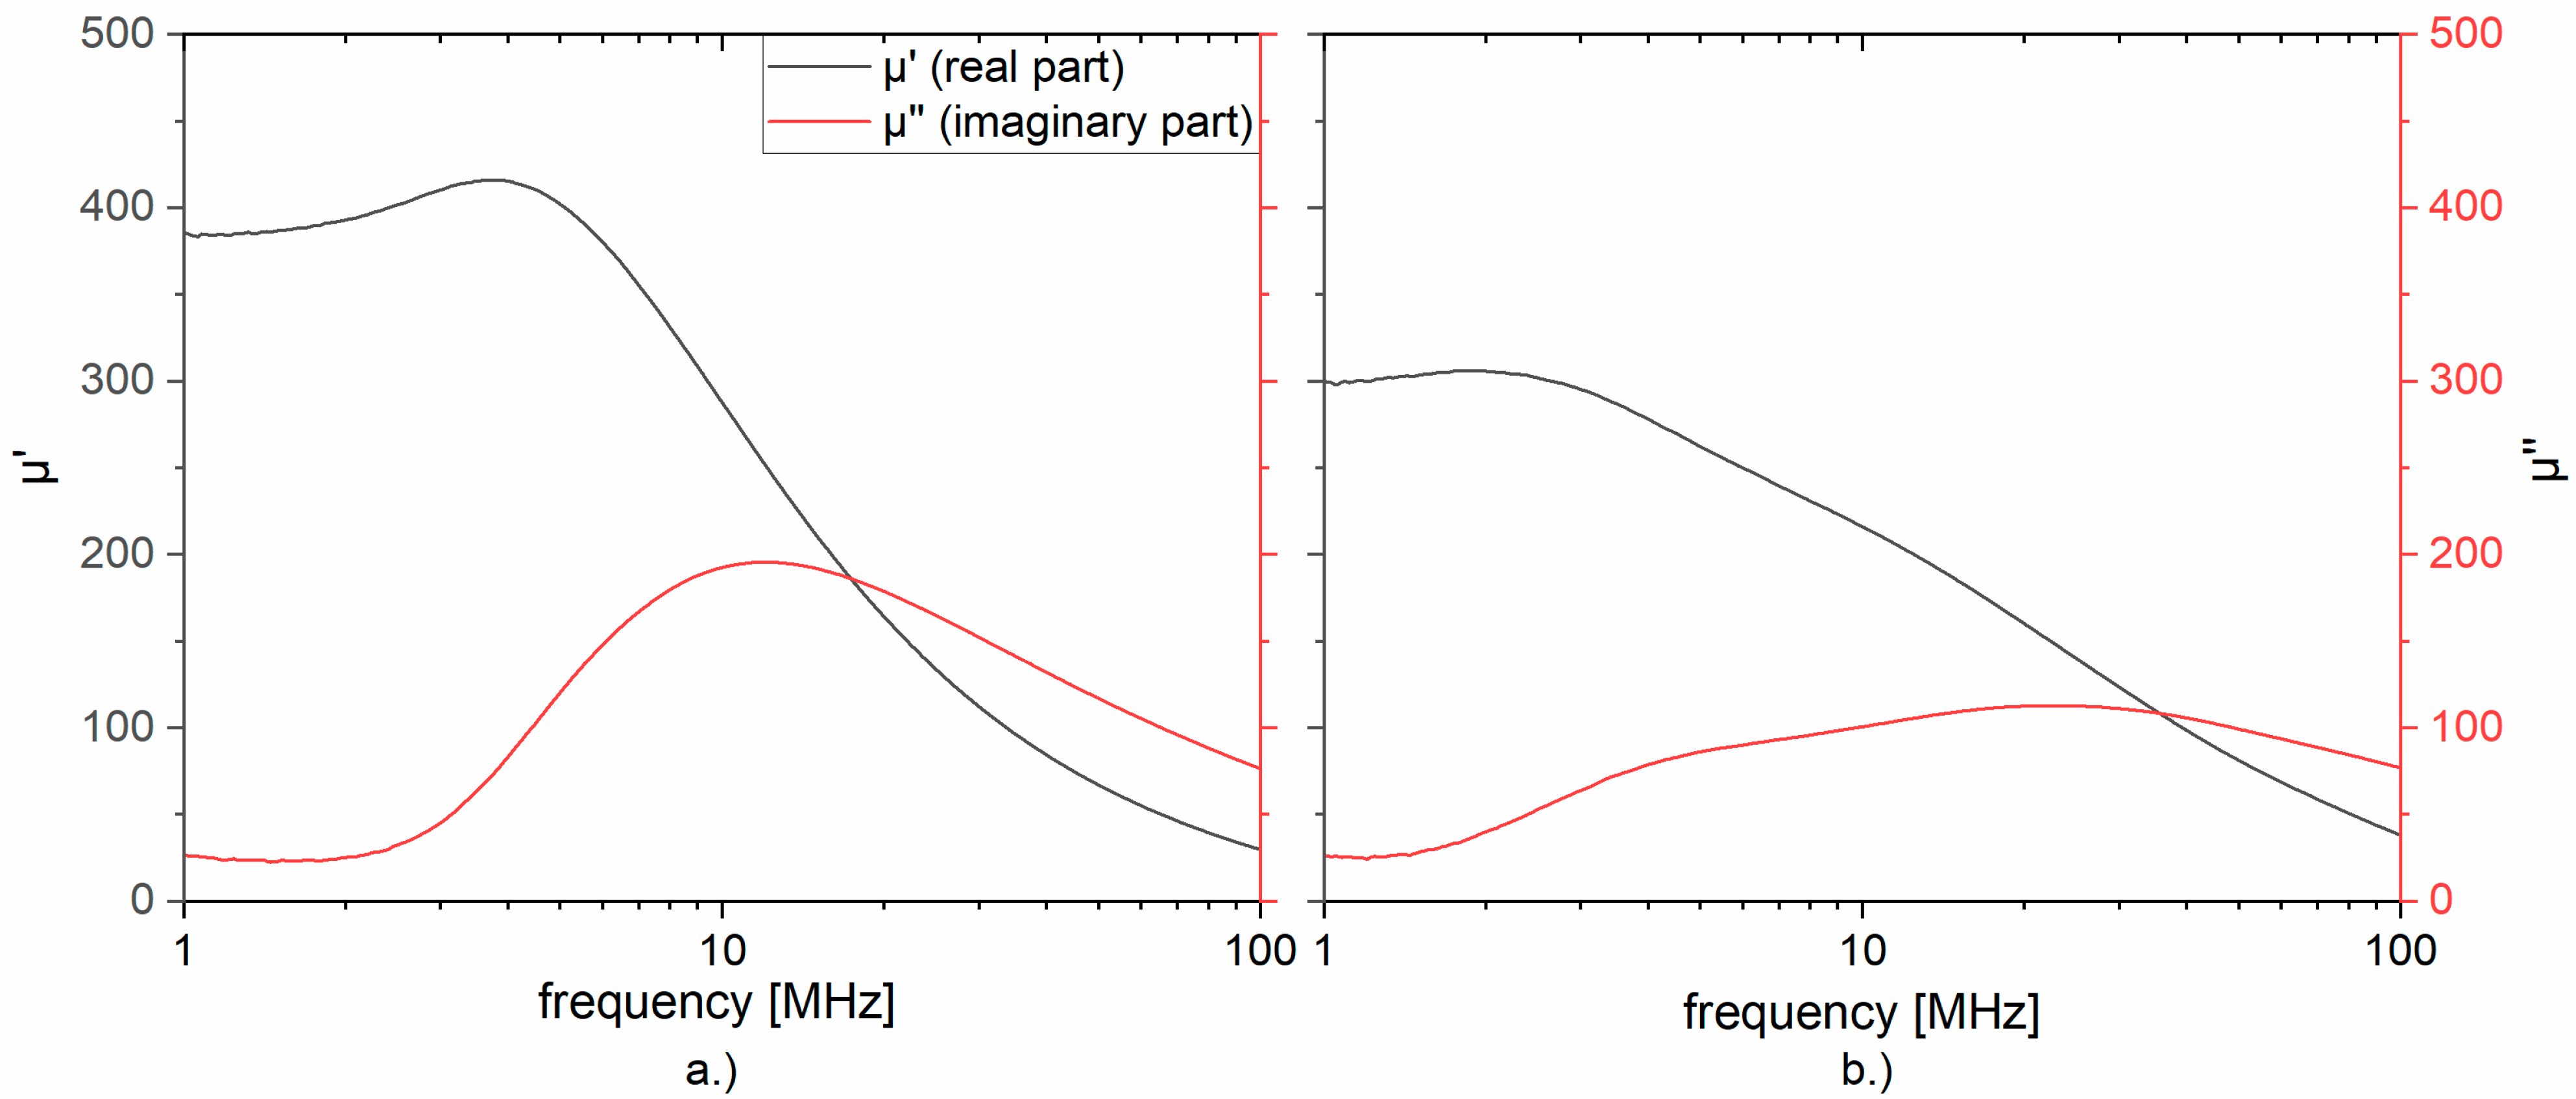
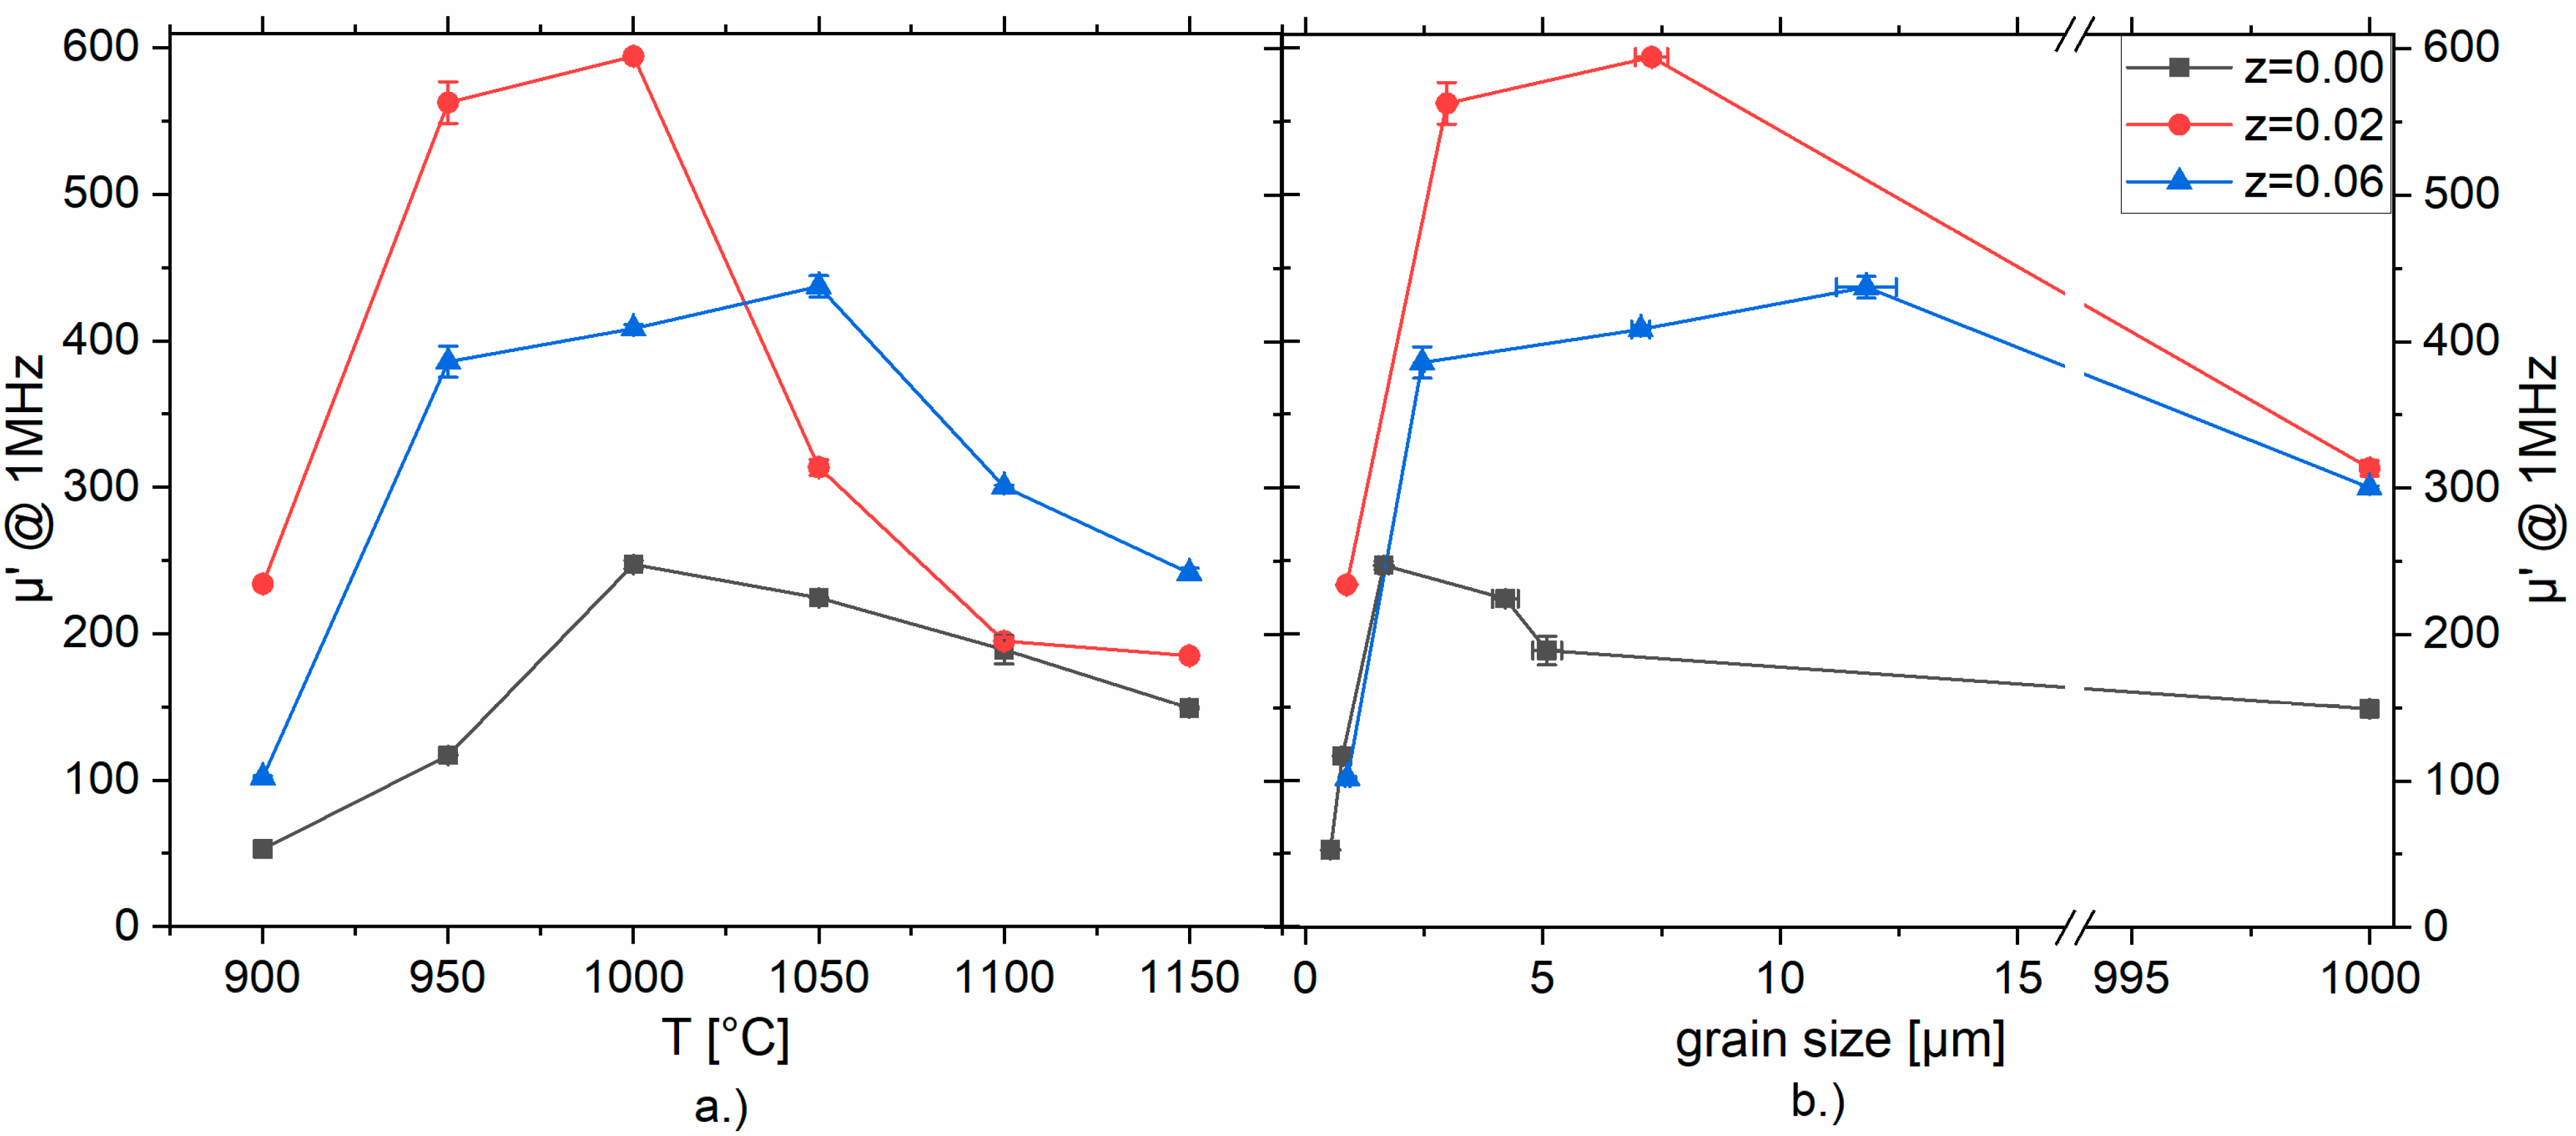
2.6. Magnetic Permeability

The complex permeability spectra of two representative samples are shown in Figure 8. A ferrite with z = 0.06 sintered at 950 °C (Figure 8a) with a homogeneous fine-grained microstructure and grain size of g = 2.5(1) µm shows a permeability of µ′ = 386 at 1 MHz. The imaginary part of permeability µ″ has a broad peak centered at 10 MHz. A sample of the same composition sintered at 1100 °C with very large grains has a µ′ = 300 at 1 MHz, in combination with a flat and very broad µ″ signal (Figure 8b).
The variation of permeability versus sintering temperature is shown in Figure 9 for all samples. Stoichiometric ferrites (z = 0) have the lowest permeability values and the Fe-deficient samples with z = 0.02 show large permeability up to Ts = 1000 °C. All three samples series, however, exhibit the same general behavior with a maximum permeability at an intermediate sintering temperature and the permeability decreasing at higher sintering temperatures. This maximum permeability appears at Ts = 1000 °C for z = 0 (µ = 247) and z = 0.02 (µ = 594), whereas at z = 0.06, a maximum µ = 437 is found at Ts = 1050 °C. The variation of permeability versus grain size shows a similar picture (Figure 9b). The permeability increases with grain size and decreasing inter-crystalline porosity (increasing density) for homogeneous fine-grained microstructures, levels out, and goes through a maximum value of permeability, and finally decreases for samples with microstructures with intra-crystalline porosity and large grains formed by discontinuous grain growth.

3. Discussion

The densification, microstructure, phase composition, and magnetic properties of stoichiometric and Fe-deficient Ni-Cu-Zn ferrites exhibit significant differences. This is documented here for the ferrite series Ni0.30Cu0.20Zn0.50+zFe2-zO4-(z/2) with Fe-deficiency 0 ≤ z ≤ 0.06. An important advantage of a small Fe-deficiency (z = 0.02) is an enhanced sinter-ability, enabling co-firing with silver metallization at 900 °C (Figure 1). In a previous study, we have reported similar Fe-deficient Ni-Cu-Zn ferrites sintered at 900 °C [14]. We observed CuO as a second phase after sintering at 900 °C and concluded that the nominally Fe-deficient (sub-stoichiometric) compositions consist of mixture of a Cu-poor stoichiometric ferrite main phase and CuO as the secondary phase [14]:
Cu y Ni 1 x y Zn x + z Fe 2 z O 4 z / 2 2 z 2 Cu 2 y 3 z 2 z Ni 2 2 x 2 y 2 z Zn 2 x + 2 z 2 z Fe 2 O 4 + 3 z 2 CuO
For ferrite compositions reported here (y = 0.20 and x = 0.50), Equation (1) results in the formation of a spinel Cu0.17Ni0.30Zn0.53Fe2O4 and 0.03 CuO for an Fe-deficiency of z = 0.02, whereas for z = 0.06, the ferrite Cu0.11Ni0.31Zn0.58Fe2O4 coexists with 0.09 CuO. The existence of tenorite CuO is likely to be the reason for the observed shift of shrinkage towards lower temperature (Figure 1a) and the increased density of Fe-deficient ferrites at sintering temperatures between 900 and 1000 °C (Figure 1b).
In this study, we have extended the range of sintering temperatures. For Fe-deficient ferrites, we observed the coexistence of copper oxide phases for all sintering temperatures. This finding is in contrast to the results of other studies: Ni-Cu-Zn ferrites with iron-deficiency between 47 and 50 mol% Fe2O3 (sintered between 1040 and 1200 °C) were reported to contain a ZnO secondary phase [17]. Barba et al. reported a very detailed study on the microstructure and formation of ZnO and CuO secondary phases in stoichiometric samples of Cu0.12Ni0.23Zn0.65Fe2O4 sintered at 1200 °C and rapidly cooled (quenched or 20 K/min cooling rate) [18] or sintered at temperatures between 1000 °C and 1200 °C [19] (cooling rate 20 K/min). With a cooling rate of 5 K/min used in this study, we did not observe any ZnO formation in our samples.
Stoichiometric Ni-Cu-Zn ferrite (z = 0) exhibits a homogeneous microstructure, as demonstrated by SEM and EDX (Figure 2), with regular grain growth up to Ts = 1100 °C (Figure 3), and a single ferrite phase as confirmed by XRD (Figure 6). However, the sample z = 0 sintered at 1150 °C shows the formation of large grains of about 1000 µm in size with the precipitation of some Cu oxide at the grain boundaries (Figure 2), which was identified as Cu2O using EDX (Figure 4b). Rietveld refinement of XRD data confirmed the formation of a small, but significant concentration of cuprite Cu2O (Figure 6d). Another important feature is the appearance of intra-crystalline porosity in stoichiometric samples sintered at Ts = 1050 °C and 1100 °C (Figure 2). For Fe-deficient ferrites with z = 0.02 and z = 0.06 homogeneous microstructures with regular grain growth are found up to sintering temperatures of 1000 °C and 1050 °C, respectively (Figure 2). Simultaneously, EDX Cu distribution mappings reflect the formation of Cu-enriched regions at triple points between the ferrite grains. Quantitative EDX analysis revealed the Cu-oxide at the triple points to be tenorite CuO (Figure 4c,d) with about 24–33 at% Cu, 18–13 at% Fe, and about 50 at% oxygen for z = 0.02 sintered from 900 °C to 1000 °C (Figure 4c) and, similarly, with about 24–30 at% Cu, 18–13 at% Fe, and about 50 at% oxygen for z = 0.06 sintered from Ts = 900 °C to 1050 °C (Figure 4d). The measured Fe content in the triple point regions might be an artefact of EDX analysis, as part of the measured Fe X-ray intensity might be emitted from surrounding ferrite grains (although the triple point areas are larger than 1–2 µm in diameter). Another interpretation of the simultaneous presence of Fe besides Cu in triple points is a possible dissolution of iron in the tenorite lattice; the synthesis and properties of FexCu1-xO nanoparticles with x ≤ 0.3 [21] or x ≤ 0.125 [22] were reported recently.
The coexistence of Cu oxides and ferrites grains was confirmed using XRD (Figure 5). For Fe-deficient samples with z = 0.06 a temperature-dependent phase transition of the Cu oxide secondary phase from tenorite CuO to cuprite Cu2O was confirmed. No indication of zincite ZnO segregation was found, as discussed above. The slight increase of the cubic ferrite spinel lattice parameter a0 versus z (Figure 6a) points to a small change in the ferrite composition with z (see Equation (1) as discussed above). As increasing z implies an increase of Zn content in the ferrite main phase, the observed variation of a0 with z is consistent with the similar trend reported for Ni-Zn ferrites [23]. The results of quantitative Rietveld refinements of the phase compositions shed more light on the variation of the chemistry of the Cu oxide secondary phase with temperature and z. Whereas the stoichiometric ferrites (z = 0) have no tenorite secondary phase, the CuO-concentration increases from about 0.5 wt% for z = 0.02 to 0.9 wt% for z = 0.06 in the Fe-deficient ferrites (Figure 6c). At higher sintering temperatures, cuprite Cu2O is present, with a maximum content of 1.9 wt% at Ts = 1150 °C for z = 0.06 (Figure 6d). The Cu oxide phase present at triple points and grain boundaries undergoes a phase transformation:
2 CuO ( s ) Cu 2 O ( s ) + 1 2 O 2 ( g )
at Ts > 1050 °C. This is confirmed by thermal analysis (Figure 7). Thermal decomposition of tenorite CuO starts at 1030 °C in air. Small mass losses were observed at 1040 °C and 1050 °C in the Fe-deficient ferrites with z = 0.02 and 0.06, respectively, (Figure 7), indicating a reduction of the tenorite second phase. With increasing temperature, the remaining CuO coexists with Cu2O and forms a eutectic at 1080 °C [24], triggering changes in grain growth behavior owing to the presence of a liquid phase.
The variation of the phase and microstructure formation in Fe-deficient Ni-Cu-Zn ferrites as a function of sintering temperature may be summarized in three consecutive regions:
(I)
The ferrites exhibit normal grain growth. Some remaining inter-crystalline porosity is reduced with increasing Ts. The stoichiometric ferrite (z = 0) is single-phase spinel, and the Fe-deficient samples (z > 0) contain a small amount of tenorite CuO evenly distributed at the triple points between ferrite grains.
(II)
At a critical temperature, for example, at Ts = 1050 °C for z = 0, Ts = 1000 °C for z = 0.02, and Ts = 1050 °C for z = 0.06, intra-crystalline porosity starts to appear within the ferrite grains. Regular grain growth still dominates.
(III)
At a higher sintering temperature, i.e., at Ts = 1150 °C for z = 0, Ts = 1050 °C for z = 0.02, and Ts = 1100 °C for z = 0.06, a CuO/Cu2O liquid phase appears, forming a network along the grain boundaries and triggering exaggerated growth of the ferrite grains.
The permeability spectra of the ferrites Ni0.30Cu0.20Zn0.50+zFe2-zO4-(z/2) (0 ≤ z ≤ 0.06) reflect the different microstructures of the samples. As an example, a ferrite with z = 0.06 sintered at 950 °C and 1100 °C shows fine-grained homogeneous or large-grained microstructures, respectively (Figure 2). The permeability of the sample sintered at 950 °C (Figure 8a) is µ′ = 390 (1 MHz) and starts to decay at 4 MHz with a maximum of µ″ at 10 MHz. The ferrite sintered at 1100 °C (Figure 8b) with large grains and porosity within the grains exhibits a reduced permeability of µ′ = 300 (1 MHz) with a gradual decay over the whole frequency spectrum and a corresponding broad µ″ peak with its maximum at 30 MHz. This is expected because, according to Snoek’s law, the shift of the resonance frequency toward higher frequencies is accompanied by a decrease of the absolute values of the permeability.
The intra-crystalline pores in the sample sintered at 1100 °C act as pinning centers for domains and impede domain wall displacement, and thus reduce the permeability. A similar comparison of two Ni-Cu-Zn ferrites with the same chemistry, but different microstructure was reported by Su et al. [25].
The variation of permeability (at 1 MHz) for stochiometric (z = 0) and Fe-deficient (z > 0) ferrites versus sintering temperature displays a characteristic behavior: the permeability increases at lower sintering temperatures, goes through a maximum, and decreases at high sintering temperatures (Figure 9a). A similar variation of microstructures and permeability with sintering temperature was described for Ni0.32Cu0.10Zn0.58Fe2O4 by Su et al. [26], and the observed permeability curve of this stoichiometric ferrite was interpreted based on different contributions from domain wall motion and spin rotation magnetization processes. However, as demonstrated in this study, in the case of Fe-deficient Ni-Cu-Zn ferrites, the secondary phase formation and the corresponding microstructures are considered as major factors controlling the permeability of the samples. In region (I) in Fe-deficient ferrites with homogeneous microstructures and small CuO concentrations, the sample density and grain size increase with Ts. Consequently, an increase of permeability is observed as well (Figure 9a). In region (II), intra-crystalline pores tend to hinder domain wall motion and initiate a decrease in permeability. In region (III), however, exaggerate growth of grains with intra-crystalline pores due to the appearance of a liquid phase at high Ts as well as the appearance of a solidified non-magnetic Cu-oxide layer at the grain boundaries during cooling are major factors leading to a continuous reduction of permeability. The increase of permeability of Fe-deficient ferrites as compared with the stoichiometric ferrite at Ts ≤ 1000 °C is due to higher density; the reduced porosity for z = 0.02 enhances domain wall mobility and permeability. For z > 0.02, on the other hand, the higher amount of segregated, non-magnetic Cu oxide at triple points and grain boundaries tends to reduce the permeability.
Finally, we discuss the variation of permeability with grain size. The following characteristic features are observed (Figure 9b): the permeability increases with grain size up to a maximum permeability followed by a significant decrease of permeability, which is coupled to the appearance of large grains of about 1 mm in size separated by grain boundaries formed by a solidified Cu oxide phase. The increase of permeability with grain size in the range of regular grain growth (region I) and levelling of permeability in region (II) is consistent with the non-magnetic grain boundary model [27] assuming the ferrite grains to be surrounded by a non-magnetic grain boundary layer of thickness δ. The effective permeability µe scales with the grain size G as follows:
μ e μ i · G μ i · δ + G
with µi as permeability of the grain interior. For Fe-deficient Ni-Cu-Zn ferrites (z = 0.02 and 0.06), the formation of non-magnetic tenorite CuO between ferrite grains promotes densification and grain growth and boosts the permeability in region (I). In region (II), intra-crystalline pores act as domain pinning centers and start to reduce the permeability. Finally, liquid-phase sintered samples with pores in large grains and Cu-oxide layers as grain boundary networks exhibit smaller permeabilities (region III).

4. Materials and Methods

Ferrite powders of composition Ni0.30Cu0.20Zn0.50+zFe2-zO4-(z/2) with 0 ≤ z ≤ 0.06 were prepared by the standard ceramic route. α-Fe2O3 (Voest Alpine, Linz, Austria, HPG80); NiO (Inco, Black Nickel Oxide, Grade F), CuO (Alpha Aesar, Karlsruhe, Germany), and ZnO (Harzsiegel, Heubach, Germany, standard grade) were used as starting materials. The oxides were wet mixed for 12 h in a polyethylene container. After drying, the powder was calcined at 900 °C for 2 h, and subsequently milled in a planetary ball mill (Fritsch Pulverisette 7; Idar-Oberstein, Germany) in POM grinding beakers for 4 h (170 rpm) using zirconia grinding media (diameter 1 mm). The powders were compacted using polyvinyl alcohol as a binder to produce pellets for sintering studies or toroids for permeability measurements. The samples were sintered for 4 h at temperatures between 900 °C and 1150 °C in air (heating/cooling rate of 5 K/min). The phase formation of the materials was evaluated using X-ray diffraction (XRD) with Cu-Kα radiation (Bruker AXS, Karlsruhe, Germany, Advance D8). Rietveld refinements were performed using the software Topas version 6 (Bruker AXS). The particle size of the powders was measured using laser diffraction (Malvern Mastersizer 2000, Malvern, UK). The specific surface S of the powders was determined from nitrogen adsorption isotherms (BET, Nova 2000, Quantachrome Instruments, Boynton Beach, FL, USA); a mean particle size dBET was estimated using the relation dBET = 6/ρ·S (with density ρ; assuming spherical particles). Shrinkage measurements were made with a Netzsch DIL402 (Netzsch, Selb, Germany) dilatometer on cylindrical compacts during heating to 1000 °C with a 5 K/min heating rate. The bulk density of sintered samples was determined using Archimedes’ method with heptane as liquid. The microstructure of the samples was studied on polished and thermally etched samples with a scanning electron microscope (SEM, Ultra 55, Zeiss Microscopy GmbH, Jena, Germany). The mean grain size g50 was determined using the line intercept method in combination with a factor of 1.57 as proposed by Mendelson [28]. Samples exhibiting exaggerated grain growth were not analyzed using this method and their grain size was generally noted with 1000 µm. Elemental analysis was performed using a Bruker EDX system on polished and non-etched samples. The permeability of sintered toroids was measured using an Agilent E4991A (St. Clara, CA, USA) impedance/materials analyzer.

5. Conclusions

The phase formation, microstructure, und permeability of Fe-deficient Ni-Cu-Zn ferrites Ni0.30Cu0.20Zn0.50+zFe2-zO4-(z/2) (0 ≤ z ≤ 0.06) were investigated as a function of sintering temperature Ts. It is shown that, compared with stoichiometric ferrites (z = 0), Fe-deficient ferrites exhibit specific shrinkage behavior, microstructure, and permeability:
  • With increasing Fe-deficiency z, the temperature of the maximum shrinkage rate is shifted from T = 1000 °C for z = 0 towards T < 900 °C for z = 0.02. Firing at 900 °C gives dense samples for Fe-deficient ferrites (z > 0) only.
  • Stoichiometric ferrites exhibit regular grain growth until, at 1150 °C, exaggerated grain growth sets in owing to the formation of a Cu-oxide liquid phase.
  • Fe-deficient ferrites consist of ferrite grains and a CuO second phase distributed at the triple points. At sintering temperatures of about Ts > 1050 °C, CuO is reduced to Cu2O and the formation of a eutectic triggers exaggerated ferrite grain growth. These ferrites with large grains exhibit reduced permeability because (i) non-magnetic pores and Cu oxide grain boundary phases reduce the saturation magnetization and permeability and (ii) pores within ferrite grains and the grain boundary phase act as pinning centers for domain walls, and thus also reduce the permeability.
  • The formation of intra-crystalline porosity sets in already at intermediate sintering temperatures in regularly grown ferrite grains, leading to a reduction in permeability.
  • Sintering protocols of Fe-deficient Ni-Cu-Zn ferrites require optimization of a delicate balance of inter- and intra-crystalline porosity on one hand, and concentration and chemistry of Cu oxide second phases at triple points and grain boundaries on the other hand, to tailor a maximum permeability performance.

Author Contributions

Conceptualization, C.P. and J.T.; methodology, C.P.; investigation, C.P.; writing—original draft preparation, C.P.; writing—review and editing, J.T.; supervision, J.T.; project administration, J.T.; funding acquisition, J.T. All authors have read and agreed to the published version of the manuscript.

Funding

This work was funded by the Deutsche Forschungsgemeinschaft DFG (Germany) with grant To 165/9-1.

Institutional Review Board Statement

Not applicable.

Informed Consent Statement

Not applicable.

Data Availability Statement

Not applicable.

Conflicts of Interest

The authors declare no conflict of interest.

References

  1. Goldman, A. Handbook of Modern Ferromagnetic Materials, 1st ed.; Kluwer Academic Publishers: Boston, MA, USA; Dordrecht, The Netherlands; London, UK, 1999. [Google Scholar]
  2. Nomura, T.; Nakano, A. New evolution of ferrite for multilayer chip components. In Proceedings of the Sixth International Conference on Ferrites, Tokyo, Japan, 29 September–2 October 1992; pp. 1198–1201. [Google Scholar]
  3. Nakano, A.; Nomura, T. Multilayer Chip Inductors. Ceram. Trans. A Cer. 1999, 97, 285–304. [Google Scholar]
  4. Hsiang, H.I. Progress in materials and processes of multilayer power inductors. J. Mater. Sci. Mater. Electron. 2020, 31, 16089–16110. [Google Scholar] [CrossRef]
  5. Mürbe, J.; Töpfer, J. Ni-Cu-Zn Ferrites for low temperature firing: II. Effects of powder morphology and Bi2O3 addition on microstructure and permeability. J. Electroceramics 2006, 16, 199–205. [Google Scholar] [CrossRef]
  6. Hsiang, H.I.; Chueh, J.F. Bi2O3 addition effects on the sintering mechanisms, magnetic properties and DC superposition behavior of NiCuZn ferrites. Int. J. Appl. Ceram. Technol. 2015, 12, 1008–1015. [Google Scholar] [CrossRef]
  7. Su, H.; Zhao, C. Correlation between microstructure and permeability stability of ferrite materials. Ceram. Int. 2018, 44, 2304–2310. [Google Scholar] [CrossRef]
  8. Wang, Y.; Jing, Y. Comparison of magnetic properties of low-temperature fired NiCuZn ferrites under low- and high-Bi2O3 doping modes. J. Electron. Mater. 2020, 49, 3325–3331. [Google Scholar] [CrossRef]
  9. Low, K.O.; Sale, F.R. The development and analysis of property-composition diagrams on gel-derived stoichiometric NiCuZn ferrite. J. Magn. Magn. Mater. 2003, 256, 221–226. [Google Scholar] [CrossRef]
  10. Mürbe, J.; Töpfer, J. Ni-Cu-Zn Ferrites for low temperature firing: I. Ferrite compositions and its effects on sintering behavior and permeability. J. Electroceramics 2005, 15, 215–221. [Google Scholar] [CrossRef]
  11. Zhiyuan, L.; Maoren, X. Effects on iron deficiency on magnetic properties of (Ni0.76Zn0.24)O(Fe2O3)0.575 ferrite. J. Magn. Magn. Mater. 2000, 219, 9–14. [Google Scholar] [CrossRef]
  12. Su, H.; Zhang, H. Effects of composition and sintering temperature on properties of NiZn and NiCuZn ferrites. J. Magn. Magn. Mater. 2007, 310, 17–21. [Google Scholar] [CrossRef]
  13. Su, H.; Tang, X. Influence of Fe-deficiency on electromagnetic properties of low-temperature fired NiCuZn ferrites. J. Magn. Magn. Mater. 2010, 322, 1779–1783. [Google Scholar] [CrossRef]
  14. Mürbe, J.; Töpfer, J. Low temperature sintering of sub-stoichiometric Ni-Cu-Zn ferrites: Shrinkage, microstructure and permeability. J. Magn. Magn. Mater. 2012, 324, 578–583. [Google Scholar] [CrossRef]
  15. Hsiang, H.I.; Wu, J.L. Copper-rich phase segregation effects on the magnetic properties and DC-bias-superpositions characteristics of NiCuZn ferrites. J. Magn. Magn. Mater. 2015, 374, 367–371. [Google Scholar] [CrossRef]
  16. Sakellari, D.; Tsakaloudi, V. Microstructural phenomena controlling losses in NiCuZn ferrites as studied by transmission electron microscopy. J. Am. Soc. 2008, 91, 366–371. [Google Scholar] [CrossRef]
  17. Sun, K.; Lan, Z. Phase formation, grain growth and magnetic properties of NiCuZn ferrites. J. Magn. Magn. Mater. 2011, 323, 927–932. [Google Scholar] [CrossRef]
  18. Barba, A.; Clausell, C. ZnO and CuO crystal precipitation in sintering Cu-doped Ni-Zn ferrites. I. Influence of dry relative density and cooling rate. Eur. Ceram. Soc. 2011, 31, 2119–2128. [Google Scholar] [CrossRef]
  19. Barba, A.; Clausell, C. ZnO and CuO crystal precipitation in sintering Cu-doped Ni-Zn ferrites. II. Influence of sintering temperature and sintering time. Eur. Ceram. Soc. 2017, 37, 169–177. [Google Scholar] [CrossRef] [Green Version]
  20. Nazrin, S.; Sharmin, M. Fabrication and unravelling the impact of iron-deficiency amount on crystal structure, micromorphology, elastic and electromagnetic properties of Ni0.25Cu0.13Zn0.62Fe2-xO4-3x/2 ferrites under different sintering conditions. J. Mater. Sci. Mater. Electron. 2021, 32, 4592–4628. [Google Scholar] [CrossRef]
  21. Li, Y.; Xu, M. Structural and room-temperature ferromagnetic properties of Fe-doped CuO nanocrystals. J. Appl. Phys. 2010, 107, 113908. [Google Scholar] [CrossRef]
  22. Nasir, M.; Patra, N. X-ray structural studies on solubility of Fe substituted CuO. RSC Adv. 2016, 6, 103571. [Google Scholar] [CrossRef]
  23. Smit, J.; Wijn, J. Ferrite; Philips Technische Bibliothek: Eindhoven, The Netherlands, 1962. [Google Scholar]
  24. Roberts, H.S.; Hastings Smith, F. The System Copper: Cupric Oxide: Oxygen. J. Am. Chem. Soc. 1921, 43, 1061–1079. [Google Scholar] [CrossRef]
  25. Su, H.; Zhang, H. Effects of microstructure on permeability and power loss characteristics of the NiZn ferrites. J. Magn. Magn. Mater. 2008, 320, 483–485. [Google Scholar] [CrossRef]
  26. Su, H.; Zhang, H. Influence of microstructure on permeability dispersion and power loss of NiZn ferrite. J. Appl. Phys. 2008, 103, 483–485. [Google Scholar] [CrossRef]
  27. Johnson, M.T.; Visser, E.G. A coherent model for the complex permeability in polycrystalline ferrites. IEEE Trans. Magn. 1990, 26, 1987–1989. [Google Scholar] [CrossRef]
  28. Mendelson, M.L. Average grain size in polycrystalline ceramics. J. Am. Ceram. Soc. 1969, 52, 443–446. [Google Scholar] [CrossRef]
Figure 1. (a) Relative shrinkage and shrinkage rate vs. temperature and (b) absolute density vs. sintering temperature for 0 ≤ z ≤ 0.06.
Magnetochemistry 07 00118 g001
Figure 2. Microstructure images (SEM, SE mode) and EDX mapping of Cu-distribution in dependence of sintering temperature for z = 0.00, 0.02, and 0.06 (representative examples; SEM and EDX not from the same sample area).
Magnetochemistry 07 00118 g002
Figure 3. Ferrite grain size vs. sintering temperature for 0 ≤ z ≤ 0.06.
Magnetochemistry 07 00118 g003
Figure 4. Chemical composition determined using EDX point scans vs. sintering temperature of (a) ferrite matrix grains (z = 0.02) and triple points or grain boundary regions for (b) z = 0.00, (c) z = 0.02, and (d) z = 0.06.
Magnetochemistry 07 00118 g004
Figure 5. XRD patterns of z = 0.06 sintered at temperatures of 900–1150 °C.
Magnetochemistry 07 00118 g005
Figure 6. (a) Lattice parameters a0, (b) ferrite content, (c) CuO content, and (d) Cu2O content from Rietveld refinements for 0 ≤ z ≤ 0.06 vs. sintering temperature.
Magnetochemistry 07 00118 g006
Figure 7. Relative mass losses (TG) for z = 0.00, z = 0.02, z = 0.06, and CuO vs. temperature.
Magnetochemistry 07 00118 g007
Figure 8. Permeability spectra vs. frequency for (a) z = 0.06 sintered at 950 °C with fine-grained microstructure and (b) z = 0.06 sintered at 1100 °C with large grains.
Magnetochemistry 07 00118 g008
Figure 9. Permeability @ 1MHz (a) vs. sintering temperature and (b) vs. grain size of ferrites with 0 ≤ z ≤ 0.06.
Magnetochemistry 07 00118 g009
Publisher’s Note: MDPI stays neutral with regard to jurisdictional claims in published maps and institutional affiliations.

