Article

Automated Immunomagnetic Enrichment and Optomicrofluidic Detection to Isolate Breast Cancer Cells: A Proof-of-Concept towards PoC Therapeutic Decision-Making

Diagnostics, Fraunhofer Institute for Microengineering and Microsystems IMM, Carl-Zeiss-Straße 18–20, 55129 Mainz, Germany
*
Author to whom correspondence should be addressed.
Submission received: 29 July 2022 / Revised: 1 September 2022 / Accepted: 3 September 2022 / Published: 6 September 2022
(This article belongs to the Special Issue Magnetic Cell Separation)

Abstract

:
In breast cancer research, immunomagnetic enrichment of circulating tumor cells (CTCs) from body fluids has impressively evolved over the last decades. However, there is growing interest in further singularizing these pre-enriched rare cells to decrease signal-to-noise ratio for downstream molecular analysis, e.g., to distinguish between hormone receptor-associated tumor subtypes. This can be done by a combinatory principle to link magnetic cell separation with flow cytometry and single cell dispensing. We have recently introduced an automated benchtop platform with a microfluidic disposable cartridge to immunomagnetically enrich, fluorescence-based detect and dispense single cells from biological samples. Herein, we showcase the fine-tuning of microfluidic cell isolation in dependency of bead-binding on the cell surface. We implemented a gating function for the cytometer subunit of the benchtop platform to selectively dispense cells instead of autofluorescent objects. Finally, we developed a simplified qPCR protocol without RNA purification targeting breast cancer-relevant progesterone and estrogen receptor, Muc-1, Her-2, EpCAM and CXCR4 transcripts. In conclusion, the presented results markedly demonstrate a future diagnostic and therapy-accompanying semi-automated workflow using immunomagnetic enrichment, fluorescence-based isolation and dispensing of circulating tumor cells to achieve tumor subtyping by means of rapid, simple and immediate molecular biological examination of single cells.

1. Introduction

The characterization of rare cells has become a major topic in applied research since addressing personalized medicinal approaches is seen as the future to oppose complex pathologies. For example, the enrichment, detection and isolation of circulating tumor cells (CTCs) reveals crucial information on prognostic [1], diagnostic [2] and even therapeutic aspects [3] that can support treatment decision-making in oncology. It is known that CTCs detach from the primary epithelial tumor tissue and intravasate into the cardiovascular system to foster secondary tumor formation as disease-driving precursor at another site [4].
For malignant neoplasia of the breast tissue in particular, liquid biopsy of biomarkers such as cell-free circulating tumor DNA (ctDNA), exosomes and CTCs has attracted immense interest in the scientific community. Based on the current incidence, one out of eight women will be diagnosed with breast cancer throughout her life. Moreover, one in six of these women will be younger than 50 years at the time of the diagnosis. Although breast cancer is by far the most common solid tumor type in females, it has a relatively high 10-year survival rate of 83% when diagnosed at early stage, ideally prior to metastasis, and treated appropriately [5]. Comparable to most cancers, the systemic spread of secondary tumors (metastasis) is the major cause of death due to multi-organ failure or opportunistic infections in metastatic breast cancer.
Since the hormone receptor status and surface antigen distribution among different subtypes of breast cancer occupy a critical role for disease invasiveness, tumor burden and therapy decision, the characterization of CTC biomarker features at the point-of-care (PoC) has become a subject of intense research. An association of CTCs with poor prognosis due to metastasis could already be shown in breast cancer as well as in various other cancers. More detailed, the 3-year survival of patients with triple negative breast cancer (TNBC) is significantly higher at prior-surgery CTC counts below 5 cells in 7.5 mL whole blood [6]. TNBC is highly invasive due to cancer cells that lost expression of estrogen, progesterone and human epidermal growth factor receptors ESR, PGR and HER-2 [7] and is hence especially difficult to tackle without hormone therapy with a strong tendency to therapy-resistant metastization [8].
Besides size exclusion, magnetic cell separation has become a key technique for the isolation of CTC subpopulations from biological suspensions like blood and leucapheresis products. However, improvement in selectivity, yield, and sensitivity of the separation protocols with cost reduction and standardization is still needed to fully implement magnetic cell separation in breast cancer diagnostics or therapeutic decision-making. Magnetic cell separation of CTCs from complex body fluids like whole blood often results in high background signal of white blood cell contamination (1:1000) hampering downstream molecular analysis. Interdisciplinary research to combine immunomagnetic separation, microfluidic cell sorting and system engineering in biological validation can tackle the challenge to lower the signal-to-noise ratio. We developed an automated benchtop platform (CTCelect) for the single cell isolation of CTCs using immunomagnetic enrichment, chip-based microfluidic cell sorting and single cell dispensing in droplets on a 96-well plate to overcome these current limitations. The device was characterized in-depth and optimized in our previous works [9,10]. The platform consists of an immunomagnetic enrichment module and a microfluidic fluorescence-activated cell sorting subunit with a disposable cartridge (see Supplementary Figure S1). Fluid control and sample transfer is managed by a pipetting robot and syringe pumps. Epithelial cell adhesion molecule (EpCAM)-positive selection of tumor cells from a 7.5 mL sample with subsequent depletion of leukocytes takes place in the enrichment module of the device. The enriched and stained sample is then transferred to the cell sorting subunit into the microfluidic chip for detection and single cell dispensing in microliter droplets.
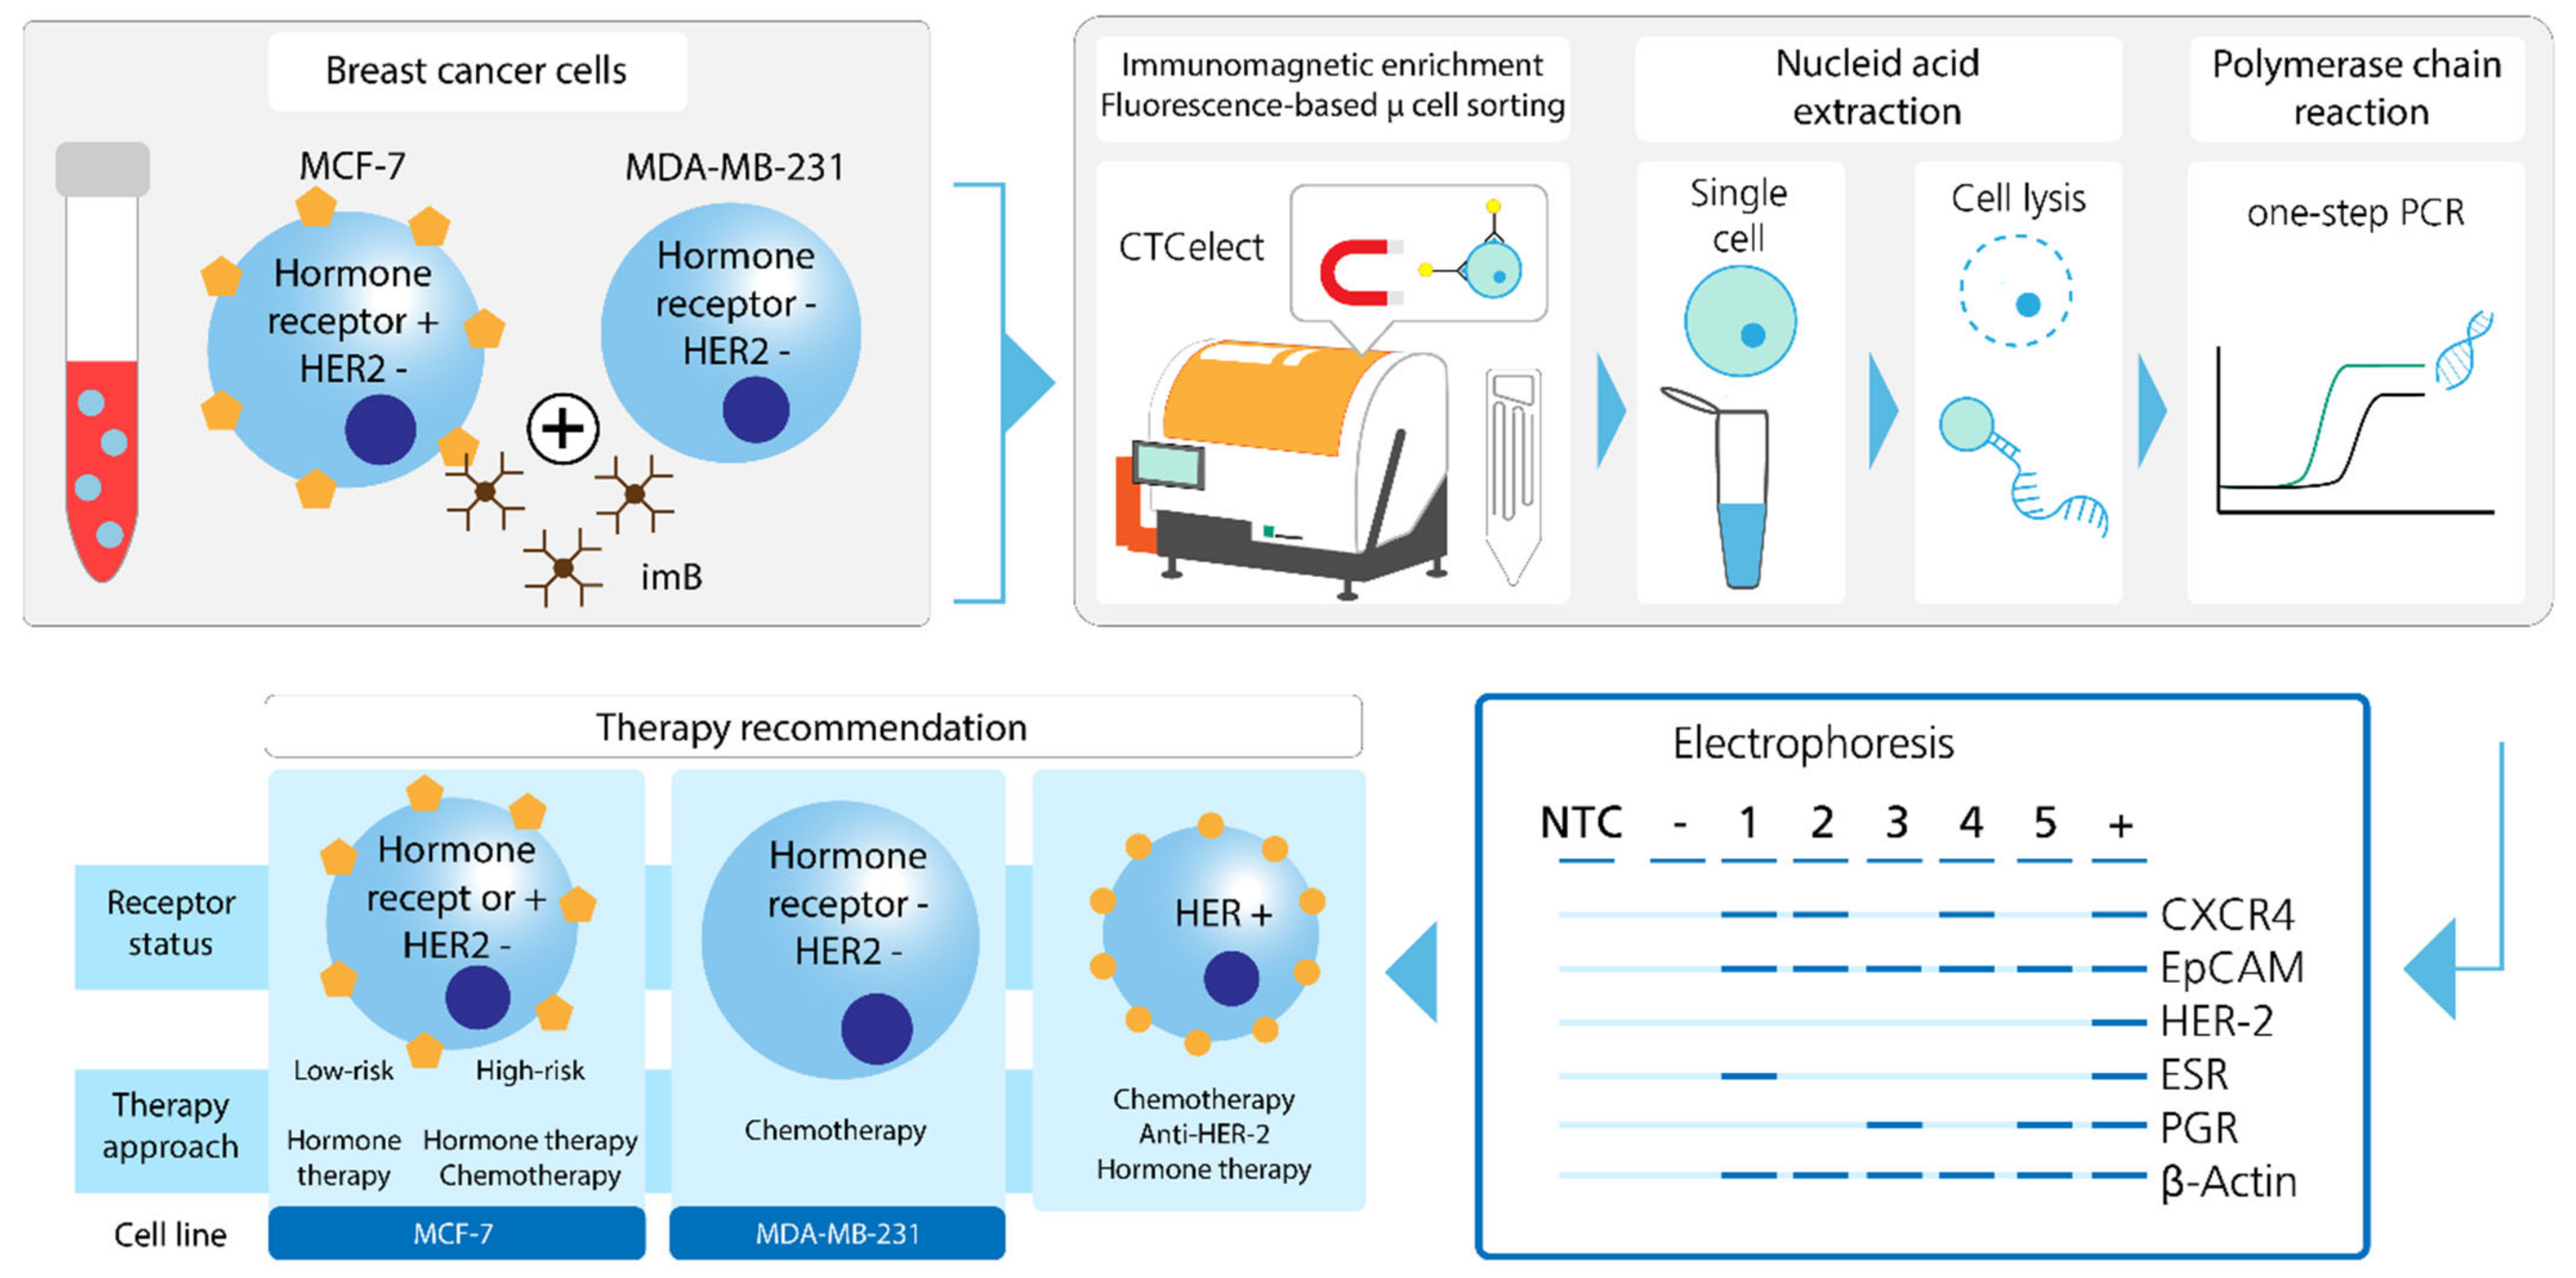
In this study, we investigated the flow properties of magnetic bead-bound cells in the microfluidic demonstrator and highlight the bottlenecks of immunomagnetic microfluidic cell separation respectively. Additionally, we showcase a proof-of-concept for a simplified detection and distinction of hormone-related tumor markers in single hormone receptor-positive and triple-negative breast cancer cells developing a protocol for combining automated cell enrichment, detection and dispensing with one-step PCR analyses (Figure 1). These results contribute to sharpen the overall picture of an individual cancer pathology and to pave the way towards additional therapy suggestions from liquid biopsy.

2. Results

2.1. Impacts of Immunomagnetic Bead-Binding on Flow Properties and Fluorescence Signal of Single Cells in a Microfluidic Cartridge

To minimize bead sedimentation in the microfluidic chip during the time course of microfluidic isolation, different sample buffers were tested. For the following experiments, uniform 1.0 μm diameter superparamagnetic beads were functionalized with EpCAM antibodies.
The sedimentation of beads in phosphate buffered saline (PBS) and in viscous sugar (alcohol)-based buffers in different concentrations was visually documented over 30 min (Figure 2A). Finally, we chose a polysaccharide solution at the lowest possible concentration (0.125%) without visible sedimentation for the subsequent experiments, herein after referred as “transfer buffer (TB)”. Previously, increased bead sedimentation in the chip funnel and in the curves of the meander structures of the cartridge was observed using PBS as sample flow. By switching to TB, beads stayed in suspension and did not sink onto the lower meander walls (Figure 2B).
The location of EpCAM bead-bound, CFSE stained cells was identified with fluorescence microscopy after complete CTCelect isolation to investigate cell loss in the chip or recovery on the well plate depending on different sample buffers (Figure 2C). Due to the process of automated immunomagnetic enrichment of cells using a pipetting module [10], it was first investigated whether cells remain in the 10 mL pipet tip. On average, almost no cells were lost in the pipet tip in both settings (PBS: 0; TB: <1). Cell loss in the chip channels could be reduced by 78% using TB (9 vs. 2 cells), while fluorescence detection and visibility of dispensed cells on the well plate was increased 4.6-fold and 3.2-fold, respectively. While improving the flow characteristics of cells in the microfluidic cartridge, TB was not affecting the dispensing of droplets. The cartridge nozzle was designed to enable droplet generation without satellite droplets allowing precise cell dispensing with TB (Figure 2D).
The fluorescence signals and flow characteristics of bead-bound and bead-free breast cancer cells (MCF-7) in the microfluidic cartridge of the CTCelect platform were investigated. To guarantee an efficient CTC isolation, the influence of bead-binding to cells and their impact on fluorescent detection was determined. New parameters of detection were defined accordingly. The fluorescence signal of labeled cells is obtained in the platform by Silicon photomultipliers (SiPM) detectors in relative fluorescence units (RFU; arbitrary units [a.u.]). CFSE stained cells were incubated with beads and then loaded in the chip reservoir with different concentrations of free beads. We observed a decrease in fluorescence intensity of CFSE stained bead-bound cells depending on the presence of excess free beads (0 or 1×) in the detection channel (Figure 3B).
In addition, we observed a decrease in the fluorescence intensity when cells were previously enriched in the CTCelect platform. Previous automated enrichment lowered the fluorescence intensity drastically but still surpassed the 200–350 a.u. fluorescence threshold for dispensing. Interestingly, the fluorescence signal was not severely differentiating between 0.125×, 0.25×, 0.5× and 1× free beads concentrations (Figure 3A). The velocity of bead-bound cells could be calculated based on our detection method. Contrastingly to the fluorescence signals, the velocity profiles of the different samples after the complete isolation process (437 mm/s) compared to detection only (436 mm/s) did not differ significantly (Figure 3C) The speed window range to trigger dispensing was consequently narrowed down to objects with a velocity of 300–500 mm/s. Real-time fluorescence peak detection and algorithm-based analysis to measure the velocity of the bead-bound target cells allows to determine the delay-time for dispensing. The software demands an absolute path length value in meters to correct the distance between measurement point and dispensing nozzle. We empirically evaluated a path length = −0.011 m to obtain the highest recovery rates of visible cells in the dispensed droplets (Figure 3D).

2.2. Optimization of Optomicrofluidic Cell Detection with Immunomagnetic Bead-Dependent Signal-to-Noise Ratio

The effects of PE-conjugated antibody staining in combination with bead enrichment was characterized in the microfluidic chip. To verify staining intensity, MCF-7 cells were spiked-in whole blood and immunomagnetically enriched using a manual magnetic separator. We used EpCAM-PE as a classical marker for epithelial tumor cells in liquid biopsy and Hoechst33342 to label DNA in all cells. The final sample was visually assessed by fluorescence microscopy and flow cytometry. EpCAM+ MCF-7 cells were distinguishable from blood cells due to a visible red staining (Figure 4A). Interestingly, we observed a strong autofluorescence signal of free beads and/or blood components in the background (red smear). This contaminating population was also easily detectable in the flow cytometer as numerous counts with intensities below RFFL2 < 104 a.u. (Figure 4B) compared to the flow cytometry results of EpCAM-PE stained MCF-7 cells without beads and blood contamination (see Supplementary Figure S2).
The antibody staining was then characterized in the microfluidic platform. Fluorescence signals in green- and red-sensitive channels of unbound and bead-bound MCF-7 cells after EpCAM-, CD144-, CD84-, CD63-PE versus EpCAM-PE staining only was then measured in the CTCelect detection unit. We recorded a slightly higher red fluorescence signal using the antibody mix on unbound cells in the benchtop platform (Figure 4C) and comparable fluorescence (7.4 × 10⁵ vs. 7 × 10⁵ a.u.) in a conventional flow cytometry system (see Supplementary Figure S2). When combining with previous immunomagnetic enrichment, this effect however vanished and an advantage of mixing different PE-conjugated antibodies could not be confirmed with our detection unit at low cell numbers (Figure 4D).
Taking these results into consideration, the autofluorescence spectrum of unstained (brown dots) and EpCAM-PE-stained free beads (black dots) was measured as shown in Figure 4E and an increased fluorescence signal balanced in both the red and green detector channels (y = x) was detected. Bead-bound, EpCAM-PE stained MCF-7 cells could be distinguished from free beads by higher red fluorescence (yellow squares). Consequently, we developed a gating function following a linear equation y = mx + b to differentiate the cell population from the beads population. The function was used to identify bead-bound EpCAM-stained from free beads in different sample (pink triangles). This feature was subsequently implemented in the software to dispense only cells at a higher likelihood rather than contaminating autofluorescent objects (mostly beads). The term y = 3.7x + 130 for example was well-suited for our optomicrofluidic setting.

2.3. Establishment of a Rapid Protocol to Assay Cancer-Related mRNAs in Beads-Enriched Single Cells

For the swift classification of isolated single cancer cells, a protocol for a simplified RNA isolation using chemical lysis and one-step qPCR was optimized and established as a downstream process in combination with the CTCelect platform. First, our two-step qPCR protocol was characterized using a commercial column-based RNA isolation kit to confirm fluorescence signals at low cell number. Therefore, we picked single cells from a cell suspension in a petri dish and directly lysed one, 20 and 40 cells per spin column. We observed an increase in relative fluorescence intensity in clear correlation with the cell number for both EpCAM and β-actin expression as expected (Figure 5A). To investigate the influence of the cell detachment process in single cells on RNA yield compared to adherent cells under culture conditions, we seeded single cells in a 96-well plate as a control (“cultured”) and isolated the total RNA from one well according to Yaron et al. [11]. The amplification curves for EpCAM indicated a decreased RNA yield in replicates of picked single cells (CT = 37.5 ± 1.6) in comparison to cultured single cells (CT = 34.3 ± 1.5). Melt curve analysis was done to confirm the specificity of amplificates (see Supplementary Figure S3).
To now simplify and shorten the protocol, a guanidine salt-free lysis buffer (LB) to chemically lyse the single cells without RNA purification and a one-step qPCR kit was introduced and compared to conventional RNA isolation and two-step qPCR results (Figure 5B). Though a slight significance in amplification decrease (* p = 0.02) between using two- or one-step qPCR occurred (green vs. dark blue), the advantages and easiness of the one-step analysis was prioritized. Previously, the one-step protocol was modified by prolonging reverse transcription to 20 min and the extension time to 10 s to improve the reaction. Single cell qPCR after CTCelect dispensing led to lower CT values compared to directly lysing a single cell from a petri dish (picked; grey).
For a higher clinical relevance at low CTC frequencies, PCR-based confirmation of hormone-related tumor markers was established after CTCelect isolation. For that, 20 CFSE stained MCF-7 cells were immunomagnetically enriched and dispensed automatically in the same well. After cell lysis, RNA isolates were split 1:4 to test for the expression of (1) progesterone (PGR), and (2) estrogen (ESR) and (3) CD45 as a negative control. Additionally, (4) the multiplex BreastCancer Detect Adnatest (QIAGEN) for GA733-2, Muc-1 and Her-2 as well as ß-actin housekeeping expression was performed according to the manual, modified by column-free chemical lysis using LB. PCR products were detected using gel electrophoresis and automated electrophoresis with the Agilent Bioanalyzer (Figure 5C,E). PGR and ESR expression could be confirmed, while the Adnatest was only positive for the actin housekeeping RNA in our experimental setting.
For the future distinction between high-risk triple negative and hormone receptor positive breast cancer cells, we established the same PGR and ESR mRNA PCR test extended by EpCAM, ß-actin and CXCR4 mRNA detection in MDA-MB-231 cells (Figure 5D). As expected, both MCF-7 and MDA-MB-231 cells were positive for epithelial EpCAM, CXCR4 and ß-actin expression, whereas MCF-7 cells were hormone receptor positive (ESR+/PGR+/HER-2) and MDA-MB-231 cells were triple negative (ESR/PGR/HER-2).
Beyond that, a second set of experiments using undiluted RNA isolates and two-step PCR for the multiplex BreastCancer Detect Adnatest was performed to potentially gain better signals (Figure 5F). With this setting, not only ß-actin but also epithelial cancer-related GA733-2 and Muc-1 expression could be confirmed in single cells after CTCelect isolation or being picked from a petri dish with or without RNA purification (LB). Low levels of Her-2 mRNA were found in three single cells. Contrastingly, there was no amplification from single cells after CTCelect isolation using the AllPrep DNA/mRNA Nano kit (APN; QIAGEN) in our case.

3. Discussion

CTCs are systemic tumor components and hence are of high clinical value, not only to access minimal-invasive tumor components but also to correlate the cell count with disease staging and monitor treatment efficacy as personalized measure. An additional benefit of isolating CTCs from liquid samples is that the molecular profile is obtained from relevant single tumor cells that include all information on RNA and DNA level and is not highly diluted in the blood-like cell-free tumor DNA. Thus, the isolation of single tumor cells can be of great advantage for personalized therapies. However, current isolation methods are error-prone, laborious and cost intensive precluding CTC analysis for larger patient cohorts. Immunomagnetic separation is widely used to pre-enrich target CTCs from body fluids. We can use this pre-enrichment step in combination with an automated microfluidic detection and dispensing process to further purify the cells of interest from contaminating blood cells. Thus, the immunomagnetic enrichment step requires accuracy, specificity and adaptability to the needs of the microfluidic detection and dispensing step. By doing that, we are able to combine both processes in one automated benchtop device. In previous publications, the advantages and disadvantages of our process were qualitatively compared to existing methods [9,10].
We knew that certain obstacles arise by introducing relatively dense magnetic particles in microfluidic systems. The aim of this study was to adapt the immunomagnetic enrichment and handling of the pre-enriched cell-bead suspension. Even though 1 µm magnetic beads have a relatively low sedimentation rate which makes them useable for automated isolations, they still gravitate after a certain period of time, especially in low-density aqueous solutions. This is this reason why we formulated a polysaccharide buffer that prevented visible bead sedimentation for at least 30 min (Figure 2A) enabling improved sample flow and consequently the overall recovery rate of the isolated cells. Effects of fluid inertia and viscosity on the settling of particles in a viscous buffer are described in detail in the literature [12,13]. Glycerol as an agent to prevent the sinking of beads was only successful using a 100% concentrated solution in our investigations. Studies report an already significant cytotoxic influence on mammalian cell volume due to osmotic pressure and decreased viability in 3.5% concentrated glycerol [14], excluding this solution as potential transfer buffer for microfluidic CTC isolation.
In addition, when working with high proportions of excess magnetic beads, a few effects hamper fluorescence-based cell detection. For example, Andree et al. showed that in flow cytometry an unstained population overlaps with the fluorescence signal of a target cell population due to uneven probability distributions. A ratio of 1:1000 between a wanted (stained) and an unwanted (unstained) population already led to an overlap of 48.9% in fluorescence intensity [15]. On one hand, they block epitopes for antibody staining and quench the fluorescence on the cell surface (see Supplementary Figure S2). On the other hand, beads exhibit a certain autofluorescence at 488 nm excitation as shown on the microscopic image in Figure 4A and described, i.e., by Roth et al. [16]. If not mixed properly or due to suboptimal buffers, beads may form agglomerates and falsify the detection process. We observed these influences in our experiments and adjusted the parameters accordingly to provide fluorescence-based single cell dispensing. These effects are more severe using antibody staining which generally emits lower fluorescence than synthetic dyes and relies on EpCAM expression only. In the literature, it was stated that a cocktail of fluorescent-labelled antibodies could improve the detection of cells [17]. With our detection set-up, we could not confirm a clear advantage of using a mixture of PE-conjugated antibodies to enhance fluorescence intensity of bead bound cells. For this purpose we developed a gating function that was implemented in the CTCelect software. We managed a distinction between the autofluorescent beads population and the fluorescent cell population to selectively trigger cell dispensing (Figure 4E).
Finally, molecular analysis of isolated tumor cells was optimized and accelerated by means of one-step qPCR to detect hormone-related breast cancer-associated targets. We found that under the same conditions, the efficacy of the one-step PCR method is not as high as that of the two-step method. Nevertheless, it was possible to successfully display the hormone receptor status of hormone receptor positive, Her-2 MCF-7 cells (as defined by [18,19]) on a single cell level with one-step PCR after complete CTCelect enrichment, detection and dispensing (Figure 5C,E). Additionally, a comparable concept was developed for triple negative MDA-MB-231 cells which will be further investigated in the future (Figure 5D). Eventually, it should be the user’s choice to perform one- or two-step PCR depending on time constraints, transcriptomic frequency and target number. Multiplexing in single cell PCR is undoubtedly limited by low sample input, lysis buffer dilution and RNA degradation. The 4-fold multiplexing Adnatest was not applicable using 1:4 diluted unpurified RNA from <20 cells (Figure 5C,E). In comparison with column-based nucleic acid extraction, chemical lysis also risks potential sample loss by inefficient pipetting. However, by keeping lysis buffer volumes low and therefore RNA concentrations high, an assay of up to 3 cancer- or hormone-associated targets from one cell was realized (Figure 5E).
From a clinical point of view, the hormone receptor status is a key checkpoint in breast cancer diagnostics as hospital guidelines suggest hormone and/or antibody therapy depending on a positive receptor status, replacing or accompanied by radio-chemotherapy. Without axillary lymph node infiltration, stage I breast cancer has high curative chances by mastectomic resection and prophylactic hormone therapy only. In the opposite viewpoint, metastatic breast cancer is characterized by lymph node, bone, lung, brain or liver invasion and the respective therapy contains harsh radiation and cytotoxic chemical agents with severe side-effects for the patient. Not least because of that, personalized and, above all, correct therapy administration has become a major topic in basic and clinical research. Alix-Panabières and Pantel have impressively reviewed that CTC characterization can provide answers to these in-depth questions [20]. The isolation of ctDNA for Next Generation Sequencing is exploited and extensively evolved to monitor cancer dynamics [21]. Improved single tumor cell isolation as shown in the present study might be useful to overcome limitations in the clinical use of these methodologies due to standardization in automation and lowered costs. In theory, it is also possible to use the residual blood sample for ctDNA analysis after the pre-enrichment of CTCs with the workflow of the CTCelect benchtop system or separate the plasma from the cell phase beforehand. This would enable a parallel isolation of ctDNA and CTCs to provide encompassing diagnostics from the same sample in a clinical setting or for central laboratories. Although magnetic cell separation is a straight-forward, combinable and automatable technique, commercial bead systems mostly use batch analysis (PCR) for tumor markers. The herein presented combination-of-combinations principle could reduce background signal for detailed examination of molecular tumor features.
To conclude, our improved protocol to directly isolate and amplify single cell RNA allows for a swift single CTC analysis resulting from immunomagnetic enrichment in combination with microfluidic dispensing, highlighting the potential for future therapeutic decision-making.

4. Materials and Methods

If not otherwise specified, reagents and supplements were purchased at Thermo Fisher Scientific, Darmstadt, DE.

4.1. Cell Lines and Blood Samples

The MCF-7 cell line was purchased from AdnaGen (Langenhagen, Germany) and cultured in RPMI1640 medium with L-Glutamine (Capricorn Scientific, Ebsdorfergrund, Germany) supplemented with 10% fetal calf serum (FCS; Merck, Darmstadt, Germany). MDA-MB-231 cells were kindly provided by Dr. Pierpaolo Moscariello (Max-Planck-Institute for Polymer Research, Mainz, Germany) and cultured in Gibco™ DMEM (low glucose, pyruvate) medium supplemented with 10% FCS. Cell lines were split at subconfluence and incubated at 37 °C in a humidified atmosphere in the presence of 5% CO2.
Whole blood bags from healthy donors were purchased from the local Blood Transfusion Center (University Medical Center Mainz, Germany) in 500 mL CompoFlex® blood bags (Fresenius Kabi, Bad Homburg, Germany) with CPD-1 anticoagulant and stored at room temperature for a maximum of three days. Informed consent was obtained from the donors as usual in clinical blood donation guidelines.

4.2. Immobilization of Biotinylated Antibodies on Streptavidin Coupled Magnetic Microbeads

Dynabeads™ MyOne™ Streptavidin T1 superparamagnetic beads were tumor-specifically coated with biotinylated monoclonal mouse anti-human EpCAM (CD326; 20 µg/mL) antibody 1B7. EpCAM antibody was immobilized on the bead surface with an extended incubation time of 1 h. After immobilization, a saturated biotin/PBS solution was added for 30 min with gentle rotation of the tube to block free streptavidin binding sites and prevent clumping. After an additional washing step, anti-EpCAM magnetic beads (herein abbreviated as “beads”) were stored in PBS/0.1% BSA at 4 °C for several weeks.

4.3. Bead Sedimentation Test

Different solutions of PBS, 0.125, 0.05 and 0.01% polysaccharide transfer buffer (TB, subject to confidentiality), 23, 50 and 100% glycerol and 23% glycerol/5% mannitol were produced. An amount of 5 × 10⁹/mL 1 µm beads were added to 1 mL test solution in a reaction tube, respectively. The visual sedimentation was observed over the course of 30 min.

4.4. Spike-in Experiments and Automated CTCelect Single Cell Isolation of Tumor Cells

Spike-in experiments and automated CTCelect assays were performed as described in [9]. Cell recovery rates were determined using fluorescence microscopy. CFSE staining was conducted as directed in the CellTraceTM CFSE Cell Proliferation kit manual.

4.5. Immunostaining of Pre-Enriched Samples

Immunomagnetically enriched samples were stained with monoclonal antibody EpCAM (1B7)-, CD144-, CD84-, CD63-PE eBioscience™ antibody (1:30) to label epithelial cells and with nuclear dye Hoechst33342 (1:1000) for 10 min at room temperature. Washing steps were performed in a magnetic separator. Stained samples were processed in the microfluidic chip of the CTCelect device or measured using the Accuri C6 flow cytometer (BD Biosciences, Franklin Lakes, NJ, USA).

4.6. Nucleic Acid Extraction and Single Cell RT-qPCR of Isolated Tumor Cells

To confirm cancer-relevant mRNAs in cell bulks and in single cell isolates, two-step and one-step real time quantitative PCR (RT-qPCR) was performed. β-actin (RPLP0) served as housekeeping RNA control. RNA was extracted from dispensed droplets immediately after CTCelect isolation using 2× or 10× guanidine salt-free lysis buffer (LB; 1:1 to the droplet volume/1:9 in pooled samples) or transferred in purification columns using either the RNeasy Micro kit or AllPrep DNA/mRNA Nano kit (both QIAGEN, Hilden, DE) by following the manuals of the manufacturer. Elution was performed at the lowest volume possible to maintain highest RNA concentrations. For two-step protocols, total RNA was reverse transcribed into cDNA with the SensiFAST™ cDNA Synthesis kit (Meridian Bioscience, Luckenwalde, Germany) and qPCR was conducted using 5 µL cDNA and QuantiFast SYBR Green RT-PCR kit (QIAGEN, Hilden, DEGermanyin a 96 well cycler (BioRad CFX96 Touch Real-Time PCR Detection System, Feldkirchen, Germany). One-step qPCR was performed by means of the SensiFAST™ Probe No-ROX One-Step kit (Meridian Bioscience, Luckenwalde, Germany) whereas reverse transcription was extended to 20 min and extension time was set to 10 s. BreastCancer Detect Adnatest (QIAGEN, Hilden, Germany) primers were added as described in the manual. Threshold cycle values (CT) were obtained. Primers are available in the Supplementary Materials (see Table S1) and were designed with Primer-BLAST (National Institutes of Health, Bethesda, MD, USA; https://0-www-ncbi-nlm-nih-gov.brum.beds.ac.uk/tools/primer-blast/ accessed on 29 July 2022). Primer sequences of the Adnatest are non-disclosed by QIAGEN.

4.7. Gel Electrophoresis and Bioanalyzer

To analyze PCR product sizes, gel electrophoresis and automated electrophoresis using the Bioanalyzer (Agilent Technologies) was performed. For gel electrophoresis, we used a 2% agarose gel in tris-acetate-EDTA buffer. DNA was diluted 1:1 in DEPC H2O, added 1:5 6× Orange G loading dye per sample and run for 45 min at 100 V. Ladders were used at 5 µL (100 bp DNA Ladder, puC19 Ladder, both Carl Roth, Karlsruhe, Germany). Gels were displayed in the Fujifilm LAS-3000 Luminescent Image Analyzer. Automated electrophoresis in the Bioanalyzer was performed using the Agilent DNA 1000 kit as indicated in the manual.

4.8. Statistical Analyses

Each experiment was repeated as indicated in the text, figures or legends. CTCelect data were collected from the output files of the software and further analyzed using Microsoft Excel 2016. Data are depicted as means with SD, and statistical analysis was done using GraphPad PRISM 8.2.0 for Windows (GraphPad Software, San Diego, CA, USA, www.graphpad.com). The p values of the statistical tests given in the respective figures were reported as not significant (ns) when Pns > 0.05 and as significant when * p ≤ 0.05.

Supplementary Materials

The following supporting information can be downloaded at: https://0-www-mdpi-com.brum.beds.ac.uk/article/10.3390/magnetochemistry8090099/s1, Figure S1: CTCelect system, microfluidic chip and process conception; Figure S2: Flow cytometry of PE-antibody (AB) stained MCF-7 cells with or without beads enrichment; Figure S3: qPCR and melt curve analysis from RNA of one, 20 and 40 MCF-7 single cells targeting EpCAM and β-actin. Table S1: Primer Sequences.

Author Contributions

Conceptualization, J.S., M.B. and C.F.; Methodology, J.S., M.B. and C.F.; Software, J.W. and J.S.; Validation, J.S.; Formal Analysis, J.S. and J.W.; Investigation, J.S.; Resources, J.S. and C.F.; Data Curation, J.S.; Writing—Original Draft Preparation, J.S.; Writing—Review and Editing, J.S. and C.F.; Visualization, J.S.; Supervision, C.F.; Project Administration, J.S., M.B. and C.F.; Funding Acquisition, J.S., M.B. and C.F. All authors have read and agreed to the published version of the manuscript.

Funding

Studies were partially funded by the Claudia von Schilling Foundation for Breast Cancer Research, Germany. Open access funding was enabled and organized by the Fraunhofer Society for the Advancement of Applied Research.

Institutional Review Board Statement

Not applicable.

Informed Consent Statement

Not applicable.

Data Availability Statement

The data presented in this study are available on request from the corresponding author. The data are not publicly available due to pending patenting.

Acknowledgments

We would like to thank the “CTCelect” project team at the Fraunhofer IMM and Lisa Pokropp for illustrations. We would like to extend our thanks to Pierpaolo Moscariello for providing the MDA-MB-231 cell line.

Conflicts of Interest

The authors declare no conflict of interest.

References

  1. Strati, A.; Nikolaou, M.; Georgoulias, V.; Lianidou, E.S. RNA-Based CTC Analysis Provides Prognostic Information in Metastatic Breast Cancer. Diagnostics 2021, 11, 513. [Google Scholar] [CrossRef] [PubMed]
  2. Jin, L.; Zhao, W.; Zhang, J.; Chen, W.; Xie, T.; Wang, L.; Fan, W.; Xie, S.; Shen, J.; Zheng, H.; et al. Evaluation of the diagnostic value of circulating tumor cells with CytoSorter® CTC capture system in patients with breast cancer. Cancer Med. 2020, 9, 1638–1647. [Google Scholar] [CrossRef] [PubMed]
  3. Hofman, P. Detecting Resistance to Therapeutic ALK Inhibitors in Tumor Tissue and Liquid Biopsy Markers: An Update to a Clinical Routine Practice. Cells 2021, 10, 168. [Google Scholar] [CrossRef] [PubMed]
  4. Alix-Panabières, C.; Schwarzenbach, H.; Pantel, K. Circulating tumor cells and circulating tumor DNA. Annu. Rev. Med. 2012, 63, 199–215. [Google Scholar] [CrossRef] [PubMed]
  5. Robert Koch Institute; The Association of Population-Based Cancer Registries in Germany. Cancer in Germany 2017/2018; Robert Koch Institute: Berlin, Germany, 2022; pp. 86–89. Available online: https://www.krebsdaten.de/Krebs/EN/Content/Publications/Cancer_in_Germany/cancer_chapters_2017_2018/cancer_c50.pdf?__blob=publicationFile (accessed on 28 July 2022).
  6. Zhang, Y.; Lv, Y.; Niu, Y.; Su, H.; Feng, A. Role of Circulating Tumor Cell (CTC) Monitoring in Evaluating Prognosis of Triple-Negative Breast Cancer Patients in China. Med. Sci. Monit. 2017, 23, 3071–3079. [Google Scholar] [CrossRef] [PubMed]
  7. Yadav, B.S.; Chanana, P.; Jhamb, S. Biomarkers in triple negative breast cancer: A review. World J. Clin. Oncol. 2015, 6, 252–263. [Google Scholar] [CrossRef] [PubMed]
  8. Gelmon, K.; Dent, R.; Mackey, J.R.; Laing, K.; McLeod, D.; Verma, S. Targeting triple-negative breast cancer: Optimising therapeutic outcomes. Ann. Oncol. 2012, 23, 2223–2234. [Google Scholar] [CrossRef] [PubMed]
  9. Stiefel, J.; Freese, C.; Sriram, A.; Alebrand, S.; Srinivas, N.; Sproll, C.; Wandrey, M.; Gül, D.; Hagemann, J.; Becker, J.C.; et al. Characterization of a novel microfluidic platform for the isolation of rare single cells to enable CTC analysis from head and neck squamous cell carcinoma patients. Eng. Life Sci. 2022, 22, 391–406. [Google Scholar] [CrossRef] [PubMed]
  10. Gribko, A.; Stiefel, J.; Liebetanz, L.; Nagel, S.M.; Künzel, J.; Wandrey, M.; Hagemann, J.; Stauber, R.H.; Freese, C.; Gül, D. IsoMAG-An Automated System for the Immunomagnetic Isolation of Squamous Cell Carcinoma-Derived Circulating Tumor Cells. Diagnostics 2021, 11, 2040. [Google Scholar] [CrossRef] [PubMed]
  11. Yaron, J.R.; Ziegler, C.P.; Tran, T.H.; Glenn, H.L.; Meldrum, D.R. A convenient, optimized pipeline for isolation, fluorescence microscopy and molecular analysis of live single cells. Biol. Proced. Online 2014, 16, 9. [Google Scholar] [CrossRef] [PubMed] [Green Version]
  12. Hespeler, D.; Knoth, D.; Keck, C.M.; Müller, R.H.; Pyo, S.M. smartPearls® for dermal bioavailability enhancement—Long-term stabilization of suspensions by viscoelasticity. Int. J. Pharm. 2019, 562, 293–302. [Google Scholar] [CrossRef] [PubMed]
  13. Felderhof, B.U. Sedimentation of spheres at small Reynolds number. J. Chem. Phys. 2005, 122, 214905. [Google Scholar] [CrossRef] [PubMed]
  14. Macías García, B.; Ortega Ferrusola, C.; Aparicio, I.M.; Miró-Morán, A.; Morillo Rodriguez, A.; Gallardo Bolaños, J.M.; González Fernández, L.; Balao da Silva, C.M.; Rodríguez Martínez, H.; Tapia, J.A.; et al. Toxicity of glycerol for the stallion spermatozoa: Effects on membrane integrity and cytoskeleton, lipid peroxidation and mitochondrial membrane potential. Theriogenology 2012, 77, 1280–1289. [Google Scholar] [CrossRef] [PubMed]
  15. Andree, K.C.; van Dalum, G.; Terstappen, L.W.M.M. Challenges in circulating tumor cell detection by the CellSearch system. Mol. Oncol. 2016, 10, 395–407. [Google Scholar] [CrossRef] [PubMed]
  16. Roth, S.; Hadass, O.; Cohen, M.; Verbarg, J.; Wilsey, J.; Danielli, A. Improving the Sensitivity of Fluorescence-Based Immunoassays by Photobleaching the Autofluorescence of Magnetic Beads. Small 2019, 15, e1803751. [Google Scholar] [CrossRef] [PubMed]
  17. Ruiz-Rodríguez, A.J.; Molina-Vallejo, M.P.; Aznar-Peralta, I.; González Puga, C.; Cañas García, I.; González, E.; Lorente, J.A.; Serrano, M.J.; Garrido-Navas, M.C. Deep Phenotypic Characterisation of CTCs by Combination of Microfluidic Isolation (IsoFlux) and Imaging Flow Cytometry (ImageStream). Cancers 2021, 13, 6386. [Google Scholar] [CrossRef] [PubMed]
  18. Horwitz, K.B.; Costlow, M.E.; McGuire, W.L. MCF-7: A human breast cancer cell line with estrogen, androgen, progesterone, and glucocorticoid receptors. Steroids 1975, 26, 785–795. [Google Scholar] [CrossRef]
  19. Bacus, S.S.; Kiguchi, K.; Chin, D.; King, C.R.; Huberman, E. Differentiation of cultured human breast cancer cells (AU-565 and MCF-7) associated with loss of cell surface HER-2/neu antigen. Mol. Carcinog. 1990, 3, 350–362. [Google Scholar] [CrossRef] [PubMed]
  20. Alix-Panabières, C.; Pantel, K. Liquid Biopsy: From Discovery to Clinical Application. Cancer Discov. 2021, 11, 858–873. [Google Scholar] [CrossRef] [PubMed]
  21. Papadopoulou, E.; Tsoulos, N.; Tsantikidi, K.; Metaxa-Mariatou, V.; Stamou, P.E.; Kladi-Skandali, A.; Kapeni, E.; Tsaousis, G.; Pentheroudakis, G.; Petrakis, D.; et al. Clinical feasibility of NGS liquid biopsy analysis in NSCLC patients. PLoS ONE 2019, 14, e0226853. [Google Scholar] [CrossRef] [PubMed] [Green Version]
Figure 1. Automated isolation workflow of single tumor cells for the molecular analysis of different cancer-associated markers and their diagnostic and therapeutic potential. After enrichment with immunomagnetic beads (imB) and fluorescence-based microfluidic cell sorting of cancer cells from a 7.5 mL sample, single cell RNA is analyzed using RT-PCR and electrophoresis. In dependency of different markers, tumor subtypes and respective therapy approaches can be potentially derived.
Magnetochemistry 08 00099 g001
Figure 2. Influence of flow buffer composition on magnetic microbeads in microfluidic systems. (A) Bead sedimentation test was performed with 5 × 10⁹/mL 1 µm beads in different solutions of phosphate buffered saline (PBS), polysaccharide transfer buffer (TB), glycerol and mannitol. The visual sedimentation was documented after 30 min. (B) The use of 0.125% TB strongly reduced bead sedimentation in the chip funnel and the meander structures of the microfluidic cartridge compared to PBS which also significantly increased cell recovery (C) after automated isolation of MCF-7 cells (5 ± 2.8 vs 16.2 ± 3.4). (D) Precise dispensing of a droplet out of the chip nozzle.
Magnetochemistry 08 00099 g002
Figure 3. Characterization of fluorescence and flow properties of bead-bound single cells. (A) The relative fluorescence intensity of CFSE stained bead-bound MCF-7 cells (in RFU) was recorded with our microfluidic flow cytometry subunit in dependency of free beads in the channel (x-axis) and previous automated enrichment. Relative fluorescence is presented as violin plot with median and first and third quantile (one-way anova, with Tukey’s multiple comparisons test, **** p < 0.0001). (B) Explanatory illustration of single cell detection in the microfluidic cartridge with or without free beads. (C) The velocity of bead-bound single cells was measured in the detection channel of the chip and compared between manual bead incubation (436 mm/s) and previous automated immunomagnetic enrichment (437 mm/s). Velocity is given as violin plot with median and first and third quantile (paired t-test, pns = 0.88). (D) Empirical determination of ideal path length correction to time the dispensing trigger. The set path length correction is displayed against the ratio between software detected and visible cells after dispensing.
Magnetochemistry 08 00099 g003
Figure 4. Selective optomicrofluidic detection of antibody-stained bead-bound MCF-7 cells. (A) Immunofluorescence staining of beads-enriched MCF-7 cells spiked in whole blood. Epithelial marker EpCAM-PE (red) was used and DNA was stained with Hoechst33342 (blue). Therefore MCF-7 cells are identified as EpCAM+/Hoechst+ while leukocytes are EpCAM/Hoechst+. Elevated red background signal indicates autofluorescence of excess free beads. (B) Relative fluorescence intensity (FL2) of sample A in flow cytometry. Objects with higher RFFL2 > 104 a.u. (red line) are counted as cells. The remaining counts at RFFL2 < 104 a.u. are defined as contaminating background signal from autofluorescent free beads or blood components. Fluorescence intensities in green- and red-sensitive channels of unbound (C) and bead-bound (D) MCF-7 cells after EpCAM-, CD144-, CD84-, CD63-PE versus EpCAM-PE staining only was then measured in the CTCelect detection unit. (E) Various fluorescence measurements of unstained and EpCAM-PE stained beads and MCF-7 cells in the CTCelect demonstrator. A chromatic criterion for gating following y = mx + b was introduced to distinguish between beads and cell population.
Magnetochemistry 08 00099 g004
Figure 5. Establishment of simplified tumor marker-relevant PCRs from bead-bound single cells. (A) qPCR results after a two-step protocol using mRNA from 1, 20 and 40 MCF-7 cells with column-based RNA purification. (B) Comparison of CT values between one- and two-step protocols for RT-qPCR targeting ß-actin from one single cell each after CTCelect isolation. CT values of “one-step modified; CTCelect” and “two-step qPCR; CTCelect” were significantly different (unpaired t-test, * p ≤ 0.05). An optimized one-step qPCR protocol was established and used for the following tests. Namely, electrophoresis of PCR products targeting Adnatest, and CD45 (159 bp) as negative control from RNA of <20 MCF-7 cells after CTCelect isolation was performed in agarose gel (C) and with the Agilent Bioanalyzer (E) using the new established modified one-step qPCR protocol. (D) Gel electrophoresis to establish a test to distinguish hormone receptor positive/Her-2 MCF-7 and hormone receptor negative/Her-2 MDA-MB-231 cells in one-step PCR without RNA purification; HER-2 108 bp, ESR 129 bp, PGR 194 bp, CXCR4 60 bp, EpCAM 136 bp, ß-actin 176 bp. (F) Bioanalyzer electrophoresis of Adnatest PCRs from MCF-7 single cell RNA after complete CTCelect isolation process. The different RNA extraction methods (guanidine salt-free lysis buffer (LB), RNeasy column, APN kit) are indicated above the lanes, respectively; actin 120 bp, HER-2 265 bp, Muc-1 299 bp, GA733-2 395 bp).
Magnetochemistry 08 00099 g005
Publisher’s Note: MDPI stays neutral with regard to jurisdictional claims in published maps and institutional affiliations.

