Article

Phase Separation in the Double Perovskite Sr2FeNbO6-δ

1
Zavoisky Physical-Technical Institute, Federal Research Center “Kazan Scientific Center of RAS”, 420029 Kazan, Russia
2
Institute of Physics, Kazan (Volga Region) Federal University, 420008 Kazan, Russia
3
Institute of Solid State Chemistry of the Russian Academy of Sciences (UB), 620990 Yekaterinburg, Russia
4
Department of Materials Science and Engineering, Indian Institute of Technology, Kanpur 208016, India
*
Author to whom correspondence should be addressed.
Submission received: 30 July 2023 / Revised: 15 August 2023 / Accepted: 6 October 2023 / Published: 8 October 2023
(This article belongs to the Section Magnetic Materials)

Abstract

:
The ceramic perovskite Sr2FeNbO6-δ was synthesized via the solution combustion precursor method. X-ray phase analysis showed that the sample is single-phase and does not contain impurities. The specific heat capacity and the Mössbauer spectra were measured for the Sr2FeNbO6-δ ceramic in the temperature range of 4–300 K. The observation of an asymmetric doublet in the Mössbauer spectra and the literature data on the magnetic susceptibility indicated the presence of two magnetic subsystems in Sr2FeNbO6-δ with antiferromagnetic exchange interactions. Based on the analysis of the temperature dependence of the specific heat capacity, we determined the Debye and Einstein temperatures.

1. Introduction

RE2Me1Me2O6 double-perovskite oxides, where Me1 and Me2 are different 3D transition metals, are finding more and more applications. Over the past year, several excellent reviews on the study of various properties of double perovskites have been published. Recent advances in the characterization of the crystal structure, magnetic properties, and cryogenic magnetocaloric effect are summarized in [1]. The halide double perovskite with structural flexibility, as well as lower toxicity and higher stability, attracted the attention of the scientific community and stimulated the research on halide double perovskites with a lead-free A2B(I)B(III)X6 composition [2]. The problems arising in the design and synthesis of double perovskites and possible ways to overcome them are discussed in [3]. Promising applications of double perovskites for the development of high-performance photodetectors are considered in [4].
The double perovskite Sr2FeNbO6 compound is being actively studied in connection with its possible application for boosting the charge separation for efficient photocatalytic CO2 reduction in the heterostructure of Cs2AgBiBr6/Sr2FeNbO6 [5]. Electrochemical impedance spectroscopy measurements indicated that ZrO2-stabilized Sr2FeNbO6-Y2O3 can be used as a hydrogen electrode in high-temperature steam electrolysis [6]. Fe3+ atoms in the cubic lattice of Sr2FeNbO6 play a crucial role in yielding high visible-light photocatalytic activity [7]. For photocatalytic applications such as pure hydrogen production and solar-to-electrical energy conversion, compounds with an energy band gap (Eg) between 1.4 and 2 eV are needed. The Sr2FeNbO6 ceramic with an Eg of 1.9 eV has great potential in these applications [8]. The possibility of its use in industrial applications was considered in [9] as an alternative fuel electrode in solid oxide electrolysis cells due to their high chemical stability. The review [10] summarizes recent studies on Sr2Me1Me2O6-based double perovskites for high-temperature thermoelectric power generation. It was shown that the decoupling of phonon-glass and electron-crystal behaviors in oxides is possible by reducing thermal conductivity due to the induced dipolar glassy state as a result of relaxor ferroelectricity [10]. It should be noted that the ionic radii of iron and niobium in a sixfold environment almost coincide (0.67 Å and 0.66 Å, respectively), which is also realized for compounds with Mo and Fe [11]. Therefore, the authors of [11] suggest using thin films to obtain an ordered distribution of elements. The B-site ordering double perovskites has also been widely reported in room-temperature electrolysis, such as water splitting [12]. Doping phosphorus into perovskites is an effective way to develop high-performance electrocatalysts for the oxygen reduction reaction [13].
Double perovskites of Sr2FeNbO6 were studied in multiple works [14,15,16]. However, these papers show different results of structural and magnetic studies. According to [17], Sr2FeNbO6-δ prepared using a conventional solid-state method features the orthorhombic structure Pnma (a = 5.62 Å, b = 7.96 Å, and c = 5.61 Å). The tetragonal structure with space group I4/m (a = 5.61 Å and c = 7.97 Å) was obtained via the conventional ceramic method [18]. The orthorhombic structure with space group Pnma and lattice parameters a = 5.6082(9) Å, b = 7.9642(1) Å, and c = 5.6084(9) Å was reported in [14]. The cubic structure with a = 3.99 Å was found in [19]. Sr2FeNbO6 has an orthorhombic unit cell with a Pbnm space group, and their lattice constants are a = 0.56077(9) nm, b= 0.56038(9) nm, and c = 0.78991(8) nm from neutron diffraction data [16]. The crystal structure is presented in the paper [8]. Different transition temperatures have been reported: in [15], Sr2FeNbO6-δ was shown to experience a spin glass transition at TG = 32.5 K; in [16], a spin glass transition was observed at TG = 20 K. The established phase transition temperatures for a double perovskite Sr2FeNbO6 differ strongly from the ordering temperatures of its constituent single perovskite. SrFeO3 has a cubic structure with a = 3.85 Å and an antiferromagnetic transition at TN = 134 K [20]. Bulk SrNbO3 is not stable under ambient conditions [21].
Mössbauer spectra of Sr2FeNbO6 were measured at 298 K and 6 K in [14]. The authors concluded that the symmetry at the Fe site in the lattice is no longer cubic. The experimental spectra were reproduced via the single-doublet fitting at room temperature with δ = 0.390(1) mm/s, ε = 0.250(1) mm/s, Γ = 0.462(4) mm/s and δ = 0.481(10) mm/s, ε = 0.001(9) mm/s, Γ = 0.894(37) mm/s, and Bhf (T) = 48.71(7) at 6 K. However, the temperature dynamics and fluctuations of the spin moment have not been studied. The purpose of the present research is to study magnetic and transport properties of the Sr2FeNbO6-δ ceramics in the temperature range of 4–300 K via the Mössbauer method and the specific heat data analysis.

2. Materials and Methods

Double perovskite Sr2FeNbO6 was obtained via pyrolysis of nitrate-organic mixtures of the following components: Sr(NO3)2 (strontium nitrate, chemically pure grade), Fe (carbonyl, ultra-pure grade), Nb2O5 (niobium oxide, chemically pure grade), NH4OH (chemically pure grade), HNO3 (chemically pure grade), and C5H7(OH)5 (chemically pure grade). The compound C5H7(OH)5 (pentanpentaol, xylitol) as an organic component promotes the dissolution of niobium oxide in an alkaline medium and simultaneously ensures the pyrolysis process in the self-ignition mode of the solution.
Iron nitrate (II) is obtained by dissolving a stoichiometric amount of carbonyl iron in dilute (1:1) nitric acid with low heating. Sr(NO3)2 was dissolved in distilled water. The resulting solutions were mixed. Next, a stoichiometric amount of niobium oxide was added to the reaction mixture. With constant stirring, the solution was neutralized to pH = 7 with ammonia, then the pH of the solution was slowly adjusted to 12.5. After that, with constant stirring, the compound C5H7(OH)5 was added to the mixture in the ratio Nb2O5:C5H7(OH)5 = 1:5 mol. The reaction mass was kept for 9–10 h until maturation. The next day, another 4–5 g of C5H7(OH)5 was added as an organic fuel, and the solution was evaporated before the combustion process started. The pyrolysis product is a black ultrafine powder, which was calcined at 950 °C for 1.5–2 h to remove carbon impurities. The resulting sample was pelletized and calcined at 1100–1150 °C for 8 hours. The total synthesis time was two days.
X-ray examination (Figure 1) was performed using a Shimadzu XRD-7000 S automatic diffractometer with an exposure time of 3–5 s per point. X-ray pattern processing was performed with the FULLPROF-2018 software. According to X-ray diffraction data, the resulting product is the double perovskite Sr2FeNbO6-δ. We have not detected any foreign impurities and impurities of unreachable substances. The Sr2FeNbO6-δ phase diffraction pattern can be described based on two space groups. The first of which is the Pm3m space group with a = 3.96748(8)Å, which is consistent with [19]. X-ray diffraction pattern is presented for the cubic group in Figure 1a. The Rietveld refined crystal structural parameters are summarized in Table 1. The second possible description of the X-ray diffraction pattern is given within the Pbnm space group and lattice parameters a = b = 5.605(7); c = 7.929(4) V and Ǻ3 = 250.28(2). An X-ray diffraction pattern is presented for the Pbnm group in Figure 1b. The Rietveld refined crystal structural parameters are summarized in Table 2.
XFA measurements performed via the Bruker S2 Ranger X-ray fluorescence spectrometer allowed us to determine the elements ratio as Fe/Sr/Nb = 0.17:0.55:0.28. Based on the electrical neutrality of the sample, we calculated the oxygen content as 5.4 for the Fe3+, Sr2+, and Nb5+ valences. The real formula of the sample is Sr2NbFe0.6O5.4. Oxygen deficiency is observed in the sample according to XFA measurements, so the Pbnm space group is more suitable for describing the structure Sr2NbFe0.6O5.4.
Mössbauer studies of the Sr2FeNbO6-δ sample were performed on a WissEl spectrometer (Germany) operating in the constant acceleration regime. As a source of resonant gamma radiation, we used 57Co in a rhodium matrix with an activity of ~ 50 mCi (Ritverc, St. Petersburg, Russia). For low-temperature Mössbauer measurements, a CFICEV flow cryostat (ICE Oxford, UK) with a CryoCon 32B temperature controller was used, which makes it possible to maintain the sample temperature with an accuracy of ±0.2 K. The absorber was made from a finely ground powder of the investigated compound mixed with boron nitride to obtain a sample uniform in thickness and to disorder the orientation of microcrystallites. For measurements, we used a sample with a surface density of 27 mg/cm2. The velocity scale of the spectrometer was calibrated using the spectrum of a thin metallic iron foil. The values of isomer shifts are given relative to the gravity center of the metallic iron spectrum at room temperature. The spectra were processed using the SpectrRelax 2.1 software [22].
Specific heat capacity measurements were performed using the PPMS-9 device in the 5–300 K temperature range at 0 and 9 T.

3. Results

3.1. Mössbauer Measurements

Mössbauer measurements were performed in a wide temperature range spanning from room temperature to the temperature of liquid nitrogen and liquid helium. The profile of the Sr2FeNbO6-δ spectrum at room temperature is an asymmetric doublet (Figure 2) with slightly higher line amplitude in the region of low velocities compared to the other doublet line.
It should be noted that the lines of the paramagnetic doublet are noticeably broadened. This broadening is most probably driven by the random distribution of Fe3+ and Nb5+ ions at the sites of the crystal lattice, which leads to the appearance of a significant electric field gradient (EFG) on the nuclei of Fe ions and their distribution in accordance with a combination of possible local environments of the resonant atom with niobium and iron ions. Therefore, to fit the experimental spectra, we used the assumption that there is a distribution of quadrupole splitting and isomeric shifts on the nuclei of resonant atoms. Figure 2a shows the Mössbauer spectrum of the Sr2FeNbO6-δ sample at room temperature along with its best fit, which takes into accounts the distribution of hyperfine parameters.
Figure 3 shows the Mössbauer spectra of Sr2FeNbO6-δ in the temperature range from 296 K to 80 K. The red lines show the best fits of the spectra based on the two-doublet model with a distribution of quadrupole shifts. In Figure 3, the blue and magenta solid lines show the partial components corresponding to the Fe13+ and Fe23+ centers. Lowering the temperature to 50 K preserves the doublet structure of the spectra. At the same time, there is a weak temperature dependence of the average value of the quadrupole shift <ε> and the content of Fe13+ and Fe23+ doublets (Figure 4).
Figure 5 shows the temperature dependencies of the isomer shift for the Fe13+ and Fe23+ centers and their common linewidth (in the two-doublet model, it was assumed that the widths of the doublet lines are equal). The positions of the gravity center of the absorption lines for both centers shift toward positive values with decreasing temperature in accordance with the second-order Doppler effect. We also observed a noticeable broadening of the doublet lines at 50 K.
Figure 6 shows the Mössbauer spectra of Sr2FeNbO6-δ in the temperature range from 50 K to 7 K. At 50 K, the spectra still retain the asymmetric doublet structure. These spectra are well fitted using the two-doublet model with a distribution of quadrupole shifts (χ2 ≤ 1). We believe that the observed broadening of the Mössbauer line at 50 K is associated with magnetic correlation for some iron atoms. A solid green line in Figure 6 shows the spectrum corresponding to the ions covered by the magnetic ordering at 50 K. Below 50 K, the Mössbauer spectra fitting was made, taking into account the fact that some of the iron atoms are paramagnetic and some of the atoms are already involved in magnetic ordering. For magnetically ordered ions, the distribution of ultrathin fields was used, and the shape of the lines for the paramagnetic part was a doublet. In order to see how the proportion of these ions varies with temperature, we show a doublet corresponding to paramagnetic ions in the range of 50–7 K on each spectrum.
However, it should be noted that even for a temperature of 40 K, in order to obtain a fit with a satisfactory value of the χ2, it was necessary to introduce partial components that contribute to the absorption spectrum in its central part. For low-temperature spectra, such a component is the Zeeman sextet with a distribution of hyperfine parameters.

3.2. Specific Heat

The temperature dependence of the specific heat was measured in the external magnetic fields of 0 and 9 T. The experimental data are shown in Figure 7a. The temperature dependence of the specific heat capacity consists of magnetic and lattice contributions. To identify the magnetic contribution to the specific heat, it is necessary to subtract the lattice contribution from the experimental data. For this purpose, we decompose the lattice contribution to the specific heat as [23].
C L = α D   C D + i α E i C E i ,
where CD is the Debye-specific heat term, and CE is the Einstein-specific heat term. The Debye term in specific heat data can be defined as
C D = 9 R T θ D 3   0 θ D T x 4 e x d x e x 1 2 .
The Einstein term in specific heat data can be defined as
C E = 3 R θ E T 2 e x p θ E T e x p θ E T 1 2
The lattice contribution CL can be approximated with a minimum set of fit parameters (four in our case): an isotropic Debye term (CD) that considers three acoustic phonon branches and three isotropic Einstein terms, which average 3s − 3 = 27 optical phonon branches. These parameters, extracted from the best fits of the experimental data, are shown in Table 3. The difference between the experimental data and the calculated lattice contribution is the magnetic contribution to the specific heat (Figure 7b). As can be seen from Figure 7b, there are two maxima in the magnetic contribution, at T = 36 K and around 4 K. The number of atoms per formula unit in Sr2FeNbO6 is s = 10, so the classical Dulong–Petit saturation value C = 3 Rs, where R = 8.31 J/mol K is the gas constant, is expected to be equal to C = 249.3 J/(mol K).

4. Discussion

The asymmetry of the quadrupole lines of Mössbauer spectra can be driven by several reasons, one of which can be related to the texture of the sample at room temperature. To test this assumption, we recorded the spectrum at two orientations of the sample, (i) when the wavevector of the resonant quanta is normal to the sample plane and (ii) when it makes a “magic” angle φ = 54.7o with the normal to the sample plane, i.e., at an orientation that equalizes the amplitudes of the doublet lines, if the asymmetry of the lines is due to the texture of the sample. As can be seen from Figure 8, a change in the orientation did not lead to a change in the amplitudes of doublet lines. Therefore, the observed asymmetry can be associated with the presence of centers of iron atoms with different local environments. This assumption is also consistent with the fact that the width of the more intense left doublet line (ΓL = 0.47 mm/s) is greater than the width of the right line (ΓR = 0.43 mm/s).
To determine the number of iron centers and calculate their relative content, the Mössbauer spectrum was fitted under the assumption that there are two doublets with a distribution of quadrupole shifts. The inset in Figure 2a shows the distribution function reconstructed from the experimental spectrum using the SpectrRelax 2.1 software. As can be seen, the distribution function consists of two peaks corresponding to two centers of iron ions in the sample. The isomer shifts of these centers are quite close and correspond to Fe3+ ions in an octahedral environment. The distribution peaks for the Fe13+ at IS ~ 0.356 mm/s, while for the Fe23+ center, it peaks at IS ~ 0.374 mm/s. Although the isomer shifts of these centers are almost equal, the quadrupole shifts are noticeably different (ε ~ 0.2 mm/s for Fe23+ and ε ~ 0.3 mm/s for Fe13+) and have a wide distribution.
Oxygen octahedral around iron is somewhat deformed from the ideal, according to the space group Pbnm. This leads to the appearance of groups of iron atoms with different local environments. This difference is small, however, in the Mössbauer spectra; it leads to an asymmetry of the experimental doublet spectrum and to the appearance of two Fe3+ centers. Of course, the peaks of these centers in the distribution function are blurred due to the influence of Nb5+ and non-stoichiometry of the studied sample with oxygen.
Figure 2b,c show the distribution functions of quadrupole shifts for the Fe13+ and Fe23+ centers obtained via fitting the experimental spectra using the two-doublet (i.e., two-center) model.
The fitting procedure yielded the values of the isomer shift and the average value of the quadrupole shift at room temperature for Fe13+ IS = 0.35(6) mm/s and <ε> = 0.19(8) mm/s, respectively. The hyperfine parameters for the Fe23+ center are IS = 0.37(4) mm/s and <ε> = 0.32(0) mm/s, respectively. The Fe13+ and Fe23+ centers account for 61% and 39% of the total area of the spectrum, respectively.
The change in the position of the center of gravity of the absorption lines with temperature is determined in the Debye approximation using the function.
I S ( T ) = I S s ( T ) 3 k T 2 m c [ 3 θ D 8 T + 3 ( T θ D ) 3 0 θ D T x 3 e x 1 d x ] ,
where the first term ISs(T) depends on the density of s-electrons in the 57Fe ion, the second term is due to the second-order Doppler effect, m is the mass of the 57Fe nuclide, k is the Boltzmann constant, and c is the speed of light in a vacuum. The first term, which is determined only with the composition and almost independent on temperature, can be considered constant and denoted as ISs (0). Therefore, the temperature dependence of the absorption-line position, i.e., the isomer shift, is completely determined with the second-order Doppler shift. In Figure 5a, the solid line represents the result of fitting the experimental data using Formula (4). For the identified Fe3+ centers, the best fit is achieved with θD = 445 ± 6 K and ISs(0) = 0.59 ± 0.01 mm/s. The θD = 445 ± 6 K value is close to the Einstein temperature ~490 K obtained via fitting the temperature dependence of the specific heat capacity.
As can be seen from Figure 6, a decrease in the sample temperature leads to the fact that for some paramagnetic ions the magnetic correlation energy becomes greater than thermal energy. Also, regions of magnetic ordering appear, leading to a decrease in both the intensity and area of doublets and forming a sextet structure of absorption lines for magnetically ordered ions. 
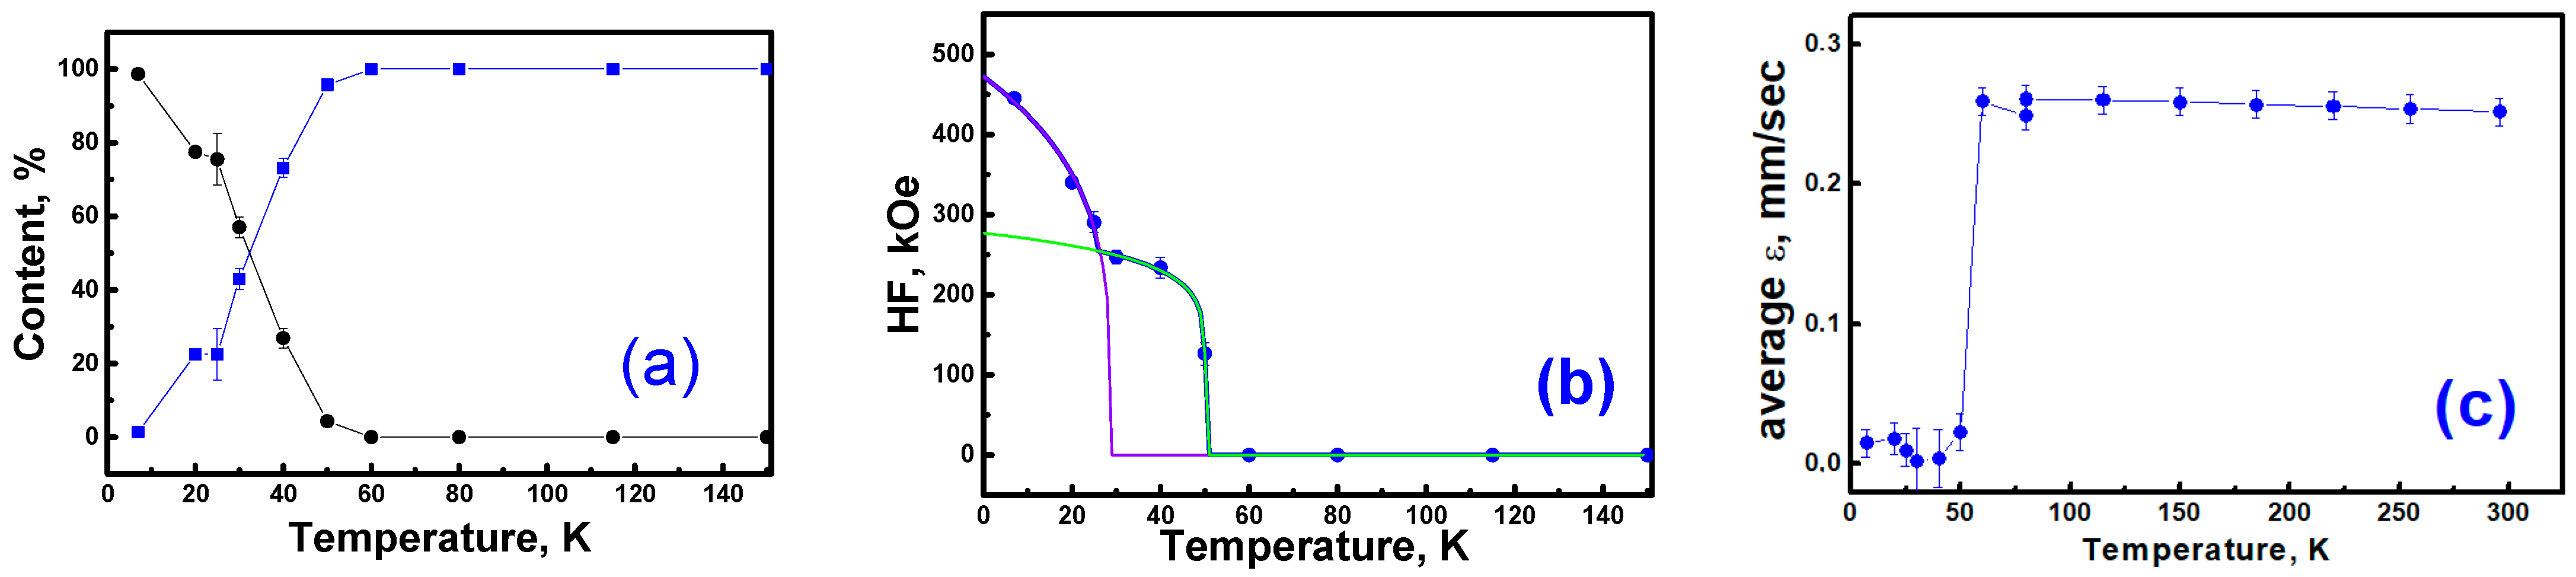
Figure 9a shows the temperature dependence of the percentage of paramagnetic and magnetically ordered ions in the sample at various temperatures. As can be seen, this process occurs in a temperature range below 40 K due to the existence of magnetic clusters with varied sizes of magnetic correlations.
At 40 K, this component is shown by the blue line (Figure 6). As the temperature decreases, the area of this partial component increases, and already at 25 K and below, it acquires a clear sextet structure whose lines narrow with decreasing temperature (Figure 6). The insets in Figure 6 show the distributions of hyperfine fields, which provide the best fits of the experimental spectra. Along with this magnetic component, even at a temperature of 7 K (Figure 6), the spectra of the Sr2FeNbO6-δ sample retain the doublet structure due to paramagnetic Fe3+ ions, which are observed at higher temperatures.
Due to this feature, the Mössbauer spectra in the temperature range under consideration demonstrate a complex profile, which is the sum of the contributions from already magnetically ordered ions with a sextet structure and the contributions from ions characterized by a relaxation line shape. In such cases, the method of restoring the distribution of hyperfine parameters is often used to determine the averaged hyperfine parameters from the experimental spectra. The insets in Figure 6 show the distribution functions of hyperfine fields on 57Fe nuclei, which provide the best values of χ2 for spectra taken at 7, 20, 25, 30, and 40 K.
The uncertainty of the distribution function values is denoted by error bars in Figure 6. As can be seen, the hyperfine magnetic field distribution function is determined with the highest accuracy at 7 K. It features a Gaussian-like shape with asymmetric wings towards low and high magnetic-field values. Figure 9b shows the temperature dependence of the average hyperfine magnetic field on 57Fe nuclei. Unfortunately, the insufficient number of experimental points in the temperature dependence of the average hyperfine magnetic field does not allow us to unambiguously determine the details of the mechanism of antiferromagnetic ordering of iron atoms in this sample. Nevertheless, it follows from Mössbauer measurements at T = 7 K that the sample contains two types of magnetic particles that differ in length and strength of magnetic correlations.
In addition, the magnetic moment of magnetically ordered atoms will depend on the number of nearest Fe neighbors involved in the indirect exchange interaction. As this number decreases, the hyperfine magnetic field on the nucleus decreases, leading to the appearance of contributions to the resonant absorption in the inner part of the spectrum. This feature is characterized in the distribution function of hyperfine fields by the extension of the wing of the Gaussian-like distribution toward weaker magnetic fields. The shape of the temperature dependence of the observed average hyperfine field on Fe3+ nuclei suggests the presence of two types of magnetic clusters with different critical ordering temperatures. Figure 9b shows the result of the approximation of the experimental data using the following power function:
H H F = H 1 , 2 ( 1 T T 1 , 2 ) b 1 , 2 ,
where H1 and H2 are the values of hyperfine fields at saturation, T1 and T2 are the critical temperatures for a given type of magnetic clusters, and b1 and b2 are the exponents. The best fits of the experimental data yielded the following values: H1 = 472 kOe, H2 = 277 kOe, T1 = 29 K, T2 = 50 K, b1 = 0.25, and b2 = 0.12. In Figure 9b, these components are shown as solid violet and green lines.
Another feature in low-temperature Mössbauer spectra is the symmetrical shape of the experimental spectra without a clear manifestation of quadrupole splitting. At higher temperatures (T > 50 K), the observed average quadrupole shift is ~0.25 mm/s (Figure 9c). However, with the onset of the magnetic ordering process, i.e., at temperatures below 40 K, the average value of the quadrupole splitting of magnetically ordered ions becomes negligibly small (Figure 9c). As is known, in the presence of a hyperfine magnetic field, the changes caused by the quadrupole splitting strongly depend on both the magnitude and the mutual orientation of the axis of the electric field gradient tensor (EFG) on the nucleus with respect to the direction of the hyperfine magnetic field. When the quadrupole interaction is much weaker than the magnetic hyperfine interaction, the quadrupole splitting can be expressed using the following formula:
Q S = 2 ε = 1 8 e 2 q Q [ 3 cos 2 θ 1 + η sin 2 θ cos 2 φ ]
where θ and φ are the angles between the direction of the magnetic hyperfine field and the main axis of the EFG tensor. In the case of the random orientation of these vectors, the line shifts caused by the QS quadrupole interaction will be zero on average. Consequently, in our sample, upon the onset of magnetic ordering, the directions of the magnetic moments of the iron ions, and hence the directions of hyperfine magnetic fields on the Fe nuclei, are randomly distributed with respect to the directions determined with the principal axes of the EFG tensor. Mössbauer spectroscopy showed three different environments around iron [24] for Sr2FeMo1−xNbxO6 compounds at room temperature.
The blurring of the phase transition temperature is confirmed by the specific heat measured in the whole temperature range, which shows no λ-type anomaly that can indicate a transition to a magnetically ordered state.
Figure 7a shows the Cp(T)/T dependence at B = 0 and 9 T in temperature range of 4–300 K, where the red line corresponds to the lattice contribution to the specific heat Cph. The blue and green lines show the difference between the experimental values of the specific heat capacity and the lattice contribution. This difference corresponds to the magnetic contribution at magnetic fields 0 and 9 T. For clarity, the magnetic contribution to the specific heat Cm is shown in Figure 7b. The magnetic contribution to the heat capacity demonstrates two maxima, at 4 K and 36 K. The positions of the maxima of the magnetic contribution do not change in the external magnetic field of 9 T. The observation of a peak at 36 K in the magnetic specific heat capacity is consistent with the temperature dependence of average hyperfine magnetic field for one of the magnetic subsystems. This temperature almost coincides with the phase transition temperature TG = 32.5 K obtained from the discrepancy of the temperature dependence of the magnetic susceptibility measured in ZFC and FC regimes in [13]. The authors of [13] found that below 700 K an extrapolated Curie temperature is negative and is equal to 28 K. The negative value of the Curie temperature indicates the antiferromagnetic nature of the exchange interactions between the spins.

5. Conclusions

Polycrystalline powders of Sr2FeNbO6-δ perovskite were synthesized via the solution combustion precursor method. Temperature dependencies of specific heat were measured for the Sr2FeNbO6-δ ceramic in the temperature range of 4–300 K at 0 and 9 T. The Mössbauer spectra of Sr2FeNbO6-δ were measured in the temperature range from 7 K to room temperature. Low-temperature Mössbauer measurement (at T = 7 K) reveals that the sample contains two types of magnetic structures that differ in the length and strength of magnetic antiferromagnetic correlations. The observed asymmetry of the Mössbauer spectra at room temperature can be associated with the presence in the sample of centers of iron atoms Fe13+ and Fe23+ with different local environments. The isomer shift and the average value of the quadrupole shift at room temperature for Fe13+ are IS = 0.35(6) mm/s and <ε> = 0.19(8) mm/s, respectively. The Fe13+ contributes to 61% of the total spectrum area. It was found that the hyperfine parameters for the Fe23+ center are IS = 0.37(4) mm/s and <ε> = 0.32(0) mm/s. The two-peak structure of the magnetic contribution to the specific heat and an asymmetric doublet in the Mössbauer spectra indicate the phase separation of the spin system into two subsystems.

Author Contributions

Conceptualization, T.M.; methodology, F.V.; formal analysis, A.Z.; investigation, R.B.; resources, T.C.; data curation, Y.D.; writing—original draft preparation, D.P.; visualization, M.C.; supervision, R.E.; funding acquisition, R.E. and T.M. All authors have read and agreed to the published version of the manuscript.

Funding

This research was supported by the Russian Science Foundation (Project No. 22-42-02014) and DST Project number DST/INT/RUS/RSF/P-55/2021.

Institutional Review Board Statement

Not applicable.

Informed Consent Statement

Not applicable.

Data Availability Statement

All the data obtained in the studies are available on demand.

Conflicts of Interest

The authors declare no conflict of interest. The funders had no role in the design of the study; in the collection, analyses, or interpretation of data; in the writing of the manuscript; or in the decision to publish the results.

References

  1. Li, L.; Yan, M. Recent progress in the development of RE2TMTM’O6 double perovskite oxides for cryogenic magnetic refrigeration. J. Mater. Sci. Technol. 2023, 136, 1–12. [Google Scholar] [CrossRef]
  2. Tailor, N.K.; Listorti, A.; Colella, S.; Satapathi, S. Lead-Free Halide Double Perovskites: Fundamentals, Challenges, and Photovoltaics Applications. Adv. Mater. Technol. 2023, 8, 2200442. [Google Scholar] [CrossRef]
  3. Liu, X.; Tu, J.; Li, H.; Tian, J.; Zhang, L. Research progress of double perovskite ferroelectric thin films. Appl. Phys. Rev. 2023, 10, 021315. [Google Scholar] [CrossRef]
  4. Li, X.; Shi, J.; Chen, J.; Tan, Z.; Lei, H. Lead-Free Halide Double Perovskite for High-Performance Photodetectors: Progress and Perspective. Materials 2023, 16, 4490. [Google Scholar] [CrossRef]
  5. Idris, A.M.; Zheng, S.; Wu, L.; Zhou, S.; Lin, H.; Chen, Z.; Xu, L.; Wang, J.; Li, Z. A heterostructure of halide and oxide double perovskites Cs2AgBiBr6/Sr2FeNbO6 for boosting the charge separation toward high efficient photocatalytic CO2 reduction under visible-light irradiation. Chem. Eng. J. 2022, 446, 137197. [Google Scholar] [CrossRef]
  6. Ge, B.; Ma, J.T.; Ai, D.; Deng, C.; Lin, X.; Xu, J. Sr2FeNbO6 applied in solid oxide electrolysis cell as the hydrogen electrode: Kinetic studies by comparison with Ni-YSZ. Electrochim. Acta 2015, 151, 437–446. [Google Scholar] [CrossRef]
  7. Jeong, E.D.; Yu, S.M.; Yoon, J.Y.; Bae, J.S.; Cho, C.R.; Lim, K.T.; Domd, R.; Borsed, H.P.; Kim, H.G. Efficient visible light photocatalysis in cubic Sr2FeNbO6. J. Ceram. Process. Res. 2012, 13, 305–309. [Google Scholar]
  8. Rosas-Huerta, J.L.; Antonio, J.E.; Arévalo-López, E.P.; Muñoz, H.; Marquina, M.L.; Escamilla, R.; Romero, M. Theoretical study of Sr2Fe1–xNb1+ xO6 system: Electronic and magnetic properties and crystal structure. J. Phys. Chem. Solids 2022, 162, 110499. [Google Scholar] [CrossRef]
  9. Winterhalder, F.E.; Farzin, Y.A.; Guillon, O.; Weber, A.; Menzler, N.H. Perovskite-Based Materials As Alternative Fuel Electrodes for Solid Oxide Electrolysis Cells (SOECs). ECS Trans. 2023, 111, 1115. [Google Scholar] [CrossRef]
  10. Maiti, T.; Saxena, M.; Roy, P. Double perovskite (Sr2B′B″O6) oxides for high-temperature thermoelectric power generation—A review. J. Mater. Res. 2019, 34, 107–125. [Google Scholar] [CrossRef]
  11. Yadav, E.; Navale, K.S.; Prajapati, G.L.; Mavani, K.R. Process-Gas-Influenced Anti-Site Disorder and Its Effects on Magnetic and Electronic Properties of Half-Metallic Sr2FeMoO6 Thin Films. Magnetochemistry 2023, 9, 167. [Google Scholar] [CrossRef]
  12. Ciotonea, C.; Hammi, N.; Dhainaut, J.; Marinova, M.; Ungureanu, A.; El Kadib, A.; Michon, C.; Royer, S. Phyllosilicate-derived Nickel-cobalt Bimetallic Nanoparticles for the Catalytic Hydrogenation of Imines, Oximes and N-heteroarenes. ChemCatChem 2020, 12, 4652–4663. [Google Scholar] [CrossRef]
  13. Shen, Y.; Zhu, Y.; Sunarso, J.; Guan, D.; Liu, B.; Liu, H.; Zhou, W.; Shao, Z. New Phosphorus-Doped Perovskite Oxide as an Oxygen Reduction Reaction Electrocatalyst in an Alkaline Solution. Chem. A Eur. J. 2018, 24, 6950–6957. [Google Scholar] [CrossRef]
  14. Tezuka, K.; Henmi, K.; Hinatsu, Y.; Masaki, N.M. Magnetic susceptibilities and Mössbauer spectra of perovskites A2FeNbO6 (A = Sr, Ba). J. Solid State Chem. 2000, 154, 591–597. [Google Scholar] [CrossRef]
  15. Rodriguez, R.; Fernandez, A.; Isalgue, A.; Rodriguez, J.; Labrata, A.; Tejada, J.; Obradors, X. Spin glass behaviour in an antiferromagnetic non-frustrated lattice: Sr2FeNbO6 perovskite. J. Phys. C Solid State Phys. 1985, 18, L401. [Google Scholar] [CrossRef]
  16. Kashima, N.; Inoue, K.; Wada, T.; Yamaguchi, Y. Low temperature neutron diffraction studies of Sr2FeMO6 (M = Nb, Sb). Appl. Phys. A 2002, 74, s805–s807. [Google Scholar] [CrossRef]
  17. Rama, N.; Philipp, J.B.; Opel, M.; Chandrasekaran, K.; Sankaranarayanan, V.; Gross, R.; Rao, M.R. Study of magnetic properties of A2B′NbO6 (A = Ba, Sr, BaSr; and B′ = Fe and Mn) double perovskites. J. Appl. Phys. 2004, 95, 7528–7530. [Google Scholar] [CrossRef]
  18. Tao; Canales-Vázquez, J.; Irvine, J.T. Structural and electrical properties of the perovskite oxide Sr2FeNbO6. Chem. Mater. 2004, 16, 2309–2316. [Google Scholar] [CrossRef]
  19. Kupriyanov, M.F.; Fesenko, E.G. An X-ray study of the phase transition in Sr2FeNbO6. Kristallografiya 1961, 6, 794. [Google Scholar]
  20. Takeda, T.; Yamaguchi, Y.; Watanabe, H. Magnetic structure of SrFeO3. J. Phys. Soc. Jpn. 1972, 33, 967–969. [Google Scholar] [CrossRef]
  21. Okuma, H.; Katayama, Y.; Ueno, K. Large Rashba parameter for 4d strongly correlated perovskite oxide SrNbO3 ultrathin film. arXiv 2022, arXiv:2209.09730. [Google Scholar]
  22. Matsnev, M.E.; Rusakov, V.S. SpectrRelax: An application for Mössbauer spectra modeling and fitting. AIP Conf. Proc. 2012, 1489, 178–185. [Google Scholar] [CrossRef]
  23. Kurbakov, A.I.; Susloparova, A.E.; Pomjakushin, V.Y.; Skourski, Y.; Vavilova, E.L.; Vasilchikova, T.M.; Raganyan, G.V.; Vasiliev, A.N. Commensurate helicoidal order in the triangular layered magnet Na2MnTeO6. Phys. Rev. B 2022, 105, 064416. [Google Scholar] [CrossRef]
  24. Rosas-Huerta, J.L.; Romero, M.; Arévalo-López, E.P.; Antonio, J.E.; Huerta, L.; Pérez-Mazariego, J.L.; Marquina, M.L.; Escamilla, R. Crystal structure, Mössbauer and X-ray photoelectron spectroscopies, and magnetic properties of Sr2FeMo1−xNbxO6 compounds. J. Solid State Chem. 2022, 316, 123621. [Google Scholar] [CrossRef]
Figure 1. X−ray diffraction pattern of Sr2FeNbO6-δ in (a) Pm3m space group and (b) Pbnm space group. The blue line is a plot of the difference between calculated and observed X−ray pattern.
Magnetochemistry 09 00219 g001
Figure 2. (a) 57Fe Mössbauer spectrum of Sr2FeNbO6-δ measured at room temperature: experiment (blue dots) and its best fit (red line). The inset shows the reconstructed distribution functions of hyperfine parameters IS and ε = QS/2. The blue and magenta lines show the best fits of the partial components corresponding to the Fe13+ and Fe23 centers. Also shown is the difference between the experimental spectrum and its best fit normalized to the statistical uncertainty in the range of ±3σ. (b,c) Reconstructed distribution functions of the quadrupole shift ε of Fe13+ (b) and Fe23 (c) doublets.
Magnetochemistry 09 00219 g002
Figure 3. 57Fe Mössbauer spectra of Sr2FeNbO6-δ measured at different temperatures: experiments (blue dots) and their best fits (red lines). The blue and magenta lines show the best fits of the partial components corresponding to the Fe13+ and Fe23 centers. Also shown are the differences between the experimental spectra and their best fits normalized to the statistical uncertainty in the range of ±3σ.
Magnetochemistry 09 00219 g003
Figure 4. Temperature dependencies of the average quadrupole shift <ε> (left panel) and the content of Fe13+ and Fe23+ doublets (right panel). Data related to the Fe13+ and Fe23+ centers are shown in blue and black colors, respectively. Solid lines are drawn on the eye for ease of perception.
Magnetochemistry 09 00219 g004
Figure 5. (a) Temperature dependencies of the isomer shift (IS) of Fe13+ and Fe23+ doublets. Data related to the Fe13+ and Fe23+ centers are shown in blue and black colors, respectively. Solid lines are drawn according to Formula (4). (b) Temperature dependence of the common line width Γ. Solid magenta line is drawn on the eye for ease of perception.
Magnetochemistry 09 00219 g005
Figure 6. 57Fe Mössbauer spectra of Sr2FeNbO6-δ measured at low temperatures: experiments (blue dots) and their best fits (red lines). A solid green line shows the Mössbauer spectrum corresponding to the ions covered by the magnetic ordering at 50 K. The insets show the reconstructed distribution functions of hyperfine parameters IS and HF. Also shown are the differences between the experimental spectra and their best fits normalized to the statistical uncertainty in the range of ±3σ.
Magnetochemistry 09 00219 g006
Figure 7. (a) Temperature dependencies of the specific heat of Sr2FeNbO6-δ experiment (dots), the lattice contribution (red line), and (b) the magnetic contribution (blue and green lines) at 0 T (gray dots and green lines) and 9 T (black dots and blue lines).
Magnetochemistry 09 00219 g007
Figure 8. 57Fe Mössbauer spectra of Sr2FeNbO6-δ sample measured at room temperature when the wavevector of radiation is normal to the sample plane (a) and when it makes a “magic” angle with the normal to the sample plane (b): experiments (blue circles) and their best fits (red lines) at room temperature. Also shown are the differences between the experimental spectra and their best fits normalized to the statistical uncertainty in the range of ±3σ.
Magnetochemistry 09 00219 g008
Figure 9. (a) Temperature dependencies of the paramagnetic (blue squares) and magnetic contents (black circles), and solid lines are drawn on the eye for ease of perception. (b) Temperature dependencies of the average hyperfine magnetic field. Solid violet and green lines are drawn according to Formula (5). (c) Temperature dependencies of the average quadrupole shift on 57Fe nuclei.
Magnetochemistry 09 00219 g009
Table 1. The Rietveld refinement for Sr2FeNbO6-δ in Pm3m space group.
AtomSite xyzBiso2)Occupancy
Sr1b0.50.50.51.29(9)1
Fe1a0000.44(3)0.5
Nb1a0000.44(3)0.5
O13d0.5002.35(8)3.01(4)
Selected bond lengths (Å)
Nb/Fe-O        1.983(1) × 6
Sr-O          2.805(1) × 12
R-factors: Rwp =  7.85%, Rexp = 8.74%, RB = 2.58, Rf = 2.99, and χ2 = 1.85.
Table 2. The Rietveld refinement for Sr2FeNbO6-δ in Pbnm space group.
AtomSite xyzOccupancy
Sr4c−0.003(5)−0.502(1)0.251
Fe4a0.5000.5
Nb4a0.5000.5
O14c0.005(1)0.564(4)0.250.6795(4)
O28d0.254(1)0.247(2)0.496(4)1.007(3)
Selected bond lengths (Å)
Fe/Nb-O1      1.992(3)
Fe/Nb-O2a    1.975(1)
Fe/Nb-O2b    1.998(6)
Sr-O1        2.631(1)
Sr-O2a      2.779(3)
Sr-O2b      2.846(5)
Sr-O2c      2.807(3)
R-factors:  Rwp = 15.3%, Rexp = 8.54%, RB = 5.63, Rf = 5.10, and χ2 = 2.56.
Table 3. The Debye and Einstein temperatures of Sr2FeNbO6-δ.
θ (K)α
Debye1501
Einstein2454
4902
7403
Disclaimer/Publisher’s Note: The statements, opinions and data contained in all publications are solely those of the individual author(s) and contributor(s) and not of MDPI and/or the editor(s). MDPI and/or the editor(s) disclaim responsibility for any injury to people or property resulting from any ideas, methods, instructions or products referred to in the content.

