
Power and Energy Rating Considerations in Integration of Flow Battery with Solar PV and Residential Load


DST-Solar Energy Harnessing Center, Department of Chemical Engineering, IIT Madras, Chennai 60036, India
*
Author to whom correspondence should be addressed.
Batteries 2021, 7(3), 62; https://0-doi-org.brum.beds.ac.uk/10.3390/batteries7030062
Submission received: 30 July 2021
/
Revised: 23 August 2021
/
Accepted: 2 September 2021
/
Published: 8 September 2021
(This article belongs to the Special Issue Battery Systems and Energy Storage beyond 2020)
Abstract
:Integration of renewable energy sources such as solar photovoltaic (PV) generation with variable power demand systems like residential electricity consumption requires the use of a high efficiency electrical energy system such as a battery. In the present study, such integration has been studied using vanadium redox flow battery (VRFB) as the energy storage system with specific focus on the sizing of the power and energy storage capacities of the system components. Experiments have been carried out with a seven-day simulated solar insolation and residential load characteristics using a 1 kW VRFB stack and variable amounts of electrolyte volume. Several scenarios have been simulated using power and energy scale factors. Battery response, in terms of its power, state of charge and efficiency, has been monitored in each run. Results show that the stack power rating should be based on peak charging characteristics while the volume of electrolyte should be based on the expected daily energy discharge through the battery. The PV source itself should be sized at about 25% more energy rating than the average daily load. The ability to design a VRFB with a high power-to-energy ratio makes it particularly attractive for PV-load integration.
1. Introduction
Use of renewable energy sources is one of the best solutions to reduce society’s dependence on fossil fuels so as to reduce emission of both conventional pollutants and greenhouse gases. Amongst various renewable energy sources, solar photovoltaic (PV) panels are the most commercially viable due to the ease in installation, cost and scalability, especially in countries close to the equator [1]. Wide adoption of renewable energy as a power generation source is only possible if the power can be delivered on and as per the demand of the consumer. In case of solar or wind energy, there is uncertainty with the amount of energy available at any given time as the exploitable energy depends on a number of factors that include location of the PV panel or wind turbine, time of the day, and seasonal and weather conditions [1,2]. Energy storage systems coupled with these energy sources can reduce the impact of their natural fluctuations and can provide power needed by the consumer. An energy storage system used for solar PV applications requires specific properties to aid this integration while maintaining the good performance and long life of the system. High cycle life, high capacity appreciation at slow rate of discharge, good reliability under cyclic discharge conditions, low equalizing and boost charging requirements, high watt-hour (round-trip energy) efficiency and ampere-hour (coulombic) efficiency at different states of charge (SOC) levels, low self-discharge, wide operating temperature range, robust design and low maintenance and cost effectiveness are some of the necessary characteristics anticipated from a battery for storing solar energy [3,4]. Energy storage integrated with a renewable energy source can serve as a stand-alone power generation system for a variety of applications [5,6].
Lead acid or lithium ion type batteries have been conventionally used as battery storage devices in integration studies. These batteries are best operated in their safe operating range; in the context of solar PV applications, the life of these batteries degrades considerably due to varying input from solar energy and due to their limited range of operating depth of discharge (DOD) and operational conditions. Lead acid battery is economical, sustainable and has good operational safety and quick response time, but it suffers from low efficiency, low energy density (30–50 Wh/kg) and has limitations on low power rating and DOD for assured life. Lithium ion battery has higher energy density and higher efficiency than lead acid battery but is expensive and prone to thermal runaway and can thus be a fire hazard [7]. In addition, solid state batteries have a fixed power to energy (P/E) ratio due to fixed volume of electrolyte.
A number of studies have been reported recently on improving the characteristics and performance of integrated renewable energy source-energy storage systems. Angenendt et al. [8] studied stringent control strategies based on forecast for a PV-battery system to improve the system performance and battery life. PV self-consumption improvement using frequency restoration reserves was analyzed by Litjens et al. [9] for both residential and commercial applications. Hybridization is another way of improving the system robustness and enhancing its performance with improved life. Single energy source with multiple storage systems (for example, PV with lead acid battery and supercapacitor for improved battery life) has been studied by Jing et al. [10]. Multiple energy sources, for example, solar PV, wind turbine, diesel generator coupled with single or multiple storage systems such as lead acid batteries, lithium ion batteries, flow batteries, reversible fuel cells, etc. have been investigated extensively and various algorithms and optimization models have been employed for better energy management and reduced system cost [11,12,13,14,15,16,17,18].
The present work focuses on redox flow batteries as energy storage system. A redox flow battery (RFB) is an electrochemical energy storage device that has several attractive features especially for large-scale stationary storage, such as independent scalability in energy and power levels, large number of life cycles and absence of fire hazard [19,20,21,22,23]. The energy storage capacity of a typical redox flow battery is determined by the volume of the electrolyte taken, while the power at which the energy can be delivered or absorbed is controlled by combination of active area and number of cells in a stack [20,21,22]. The positive (catholyte) and negative (anolyte) electrolyte species are stored in separate reservoirs. Each electrolyte is circulated through the respective electrodes of a stack for either charging or discharging of the battery. There is broad consensus that RFBs can be highly cost-competitive when used in large scale power applications such as microgrids, power islands, peak shaving and renewable energy applications [24]. The integration of solar cell and redox flow battery offers a unique advantage, namely, the liquid electrolytes of redox flow battery system can also be used as a coolant for the photovoltaic panels and the battery stacks so as to have integrated thermal management capabilities. Vanadium based redox flow batteries have gained significance and market penetration compared to other flow battery systems in view of its same chemical species on positive and negative redox couples and ease of recyclability [3,20]. Although the VRFB has considerable capacity fade induced by cross-over of vanadium species through membrane, either the cross-over can be reduced using operating protocols or the active state can be reversed back by remixing schedules [25,26,27]. Compared to a lithium-ion battery, it suffers from relatively low efficiency, low energy density and high electrolyte cost. It is considered is to be cost-competitive for GWh-scale energy storage applications [24] and several studies have recently reported on its integration with renewable energy sources. Garcia-Quismondo et al. [23] reported on a nine-month performance analysis of a 5 kW/ 5kWh VRFB system coupled to a PV system. Bhattacharjee and Saha [28] designed an electrical equivalent model of 1 kW/6 kWh VRFB system, validated it in MATLAB/SIMULINK and later integrated with solar PV for residential application. Zhang et al. [29] studied an integrated solar PV- VRFB system for residential applications using MATLAB and brought out the importance of battery sizing considering cost and battery efficiency. Sarkar et al. [30] designed an integrated solar PV, wind turbine, biomass and VRFB system and studied its performance using Homer software. A virtual power plant was designed by Behi et al. [31] using solar PV (810 kW) with VRFB (700 kWh, 350 kW) to cater to 67 dwelling power requirements.
Several design/ simulation studies [12,13,14,15,16,17,29] have highlighted the importance of optimal sizing of battery energy storage system to ensure uninterrupted energy availability, improved life span of battery, less maintenance and cost, etc. The present work on simulation of the integrated system is primarily experimental and is focused on dealing with natural fluctuations that arise both from supply side (solar PV) and demand side (residential load) in a solar PV-VRFB integrated system. By running different scenarios with a VRFB stack over a seven-day solar PV-load profile, the study brings out how the power and energy characteristics influence the sizing of VRFB and the PV systems in terms of power and energy ratings.
2. System Lay-Out and Experimental Details
2.1. Conceptual System and Experimental Set-Up
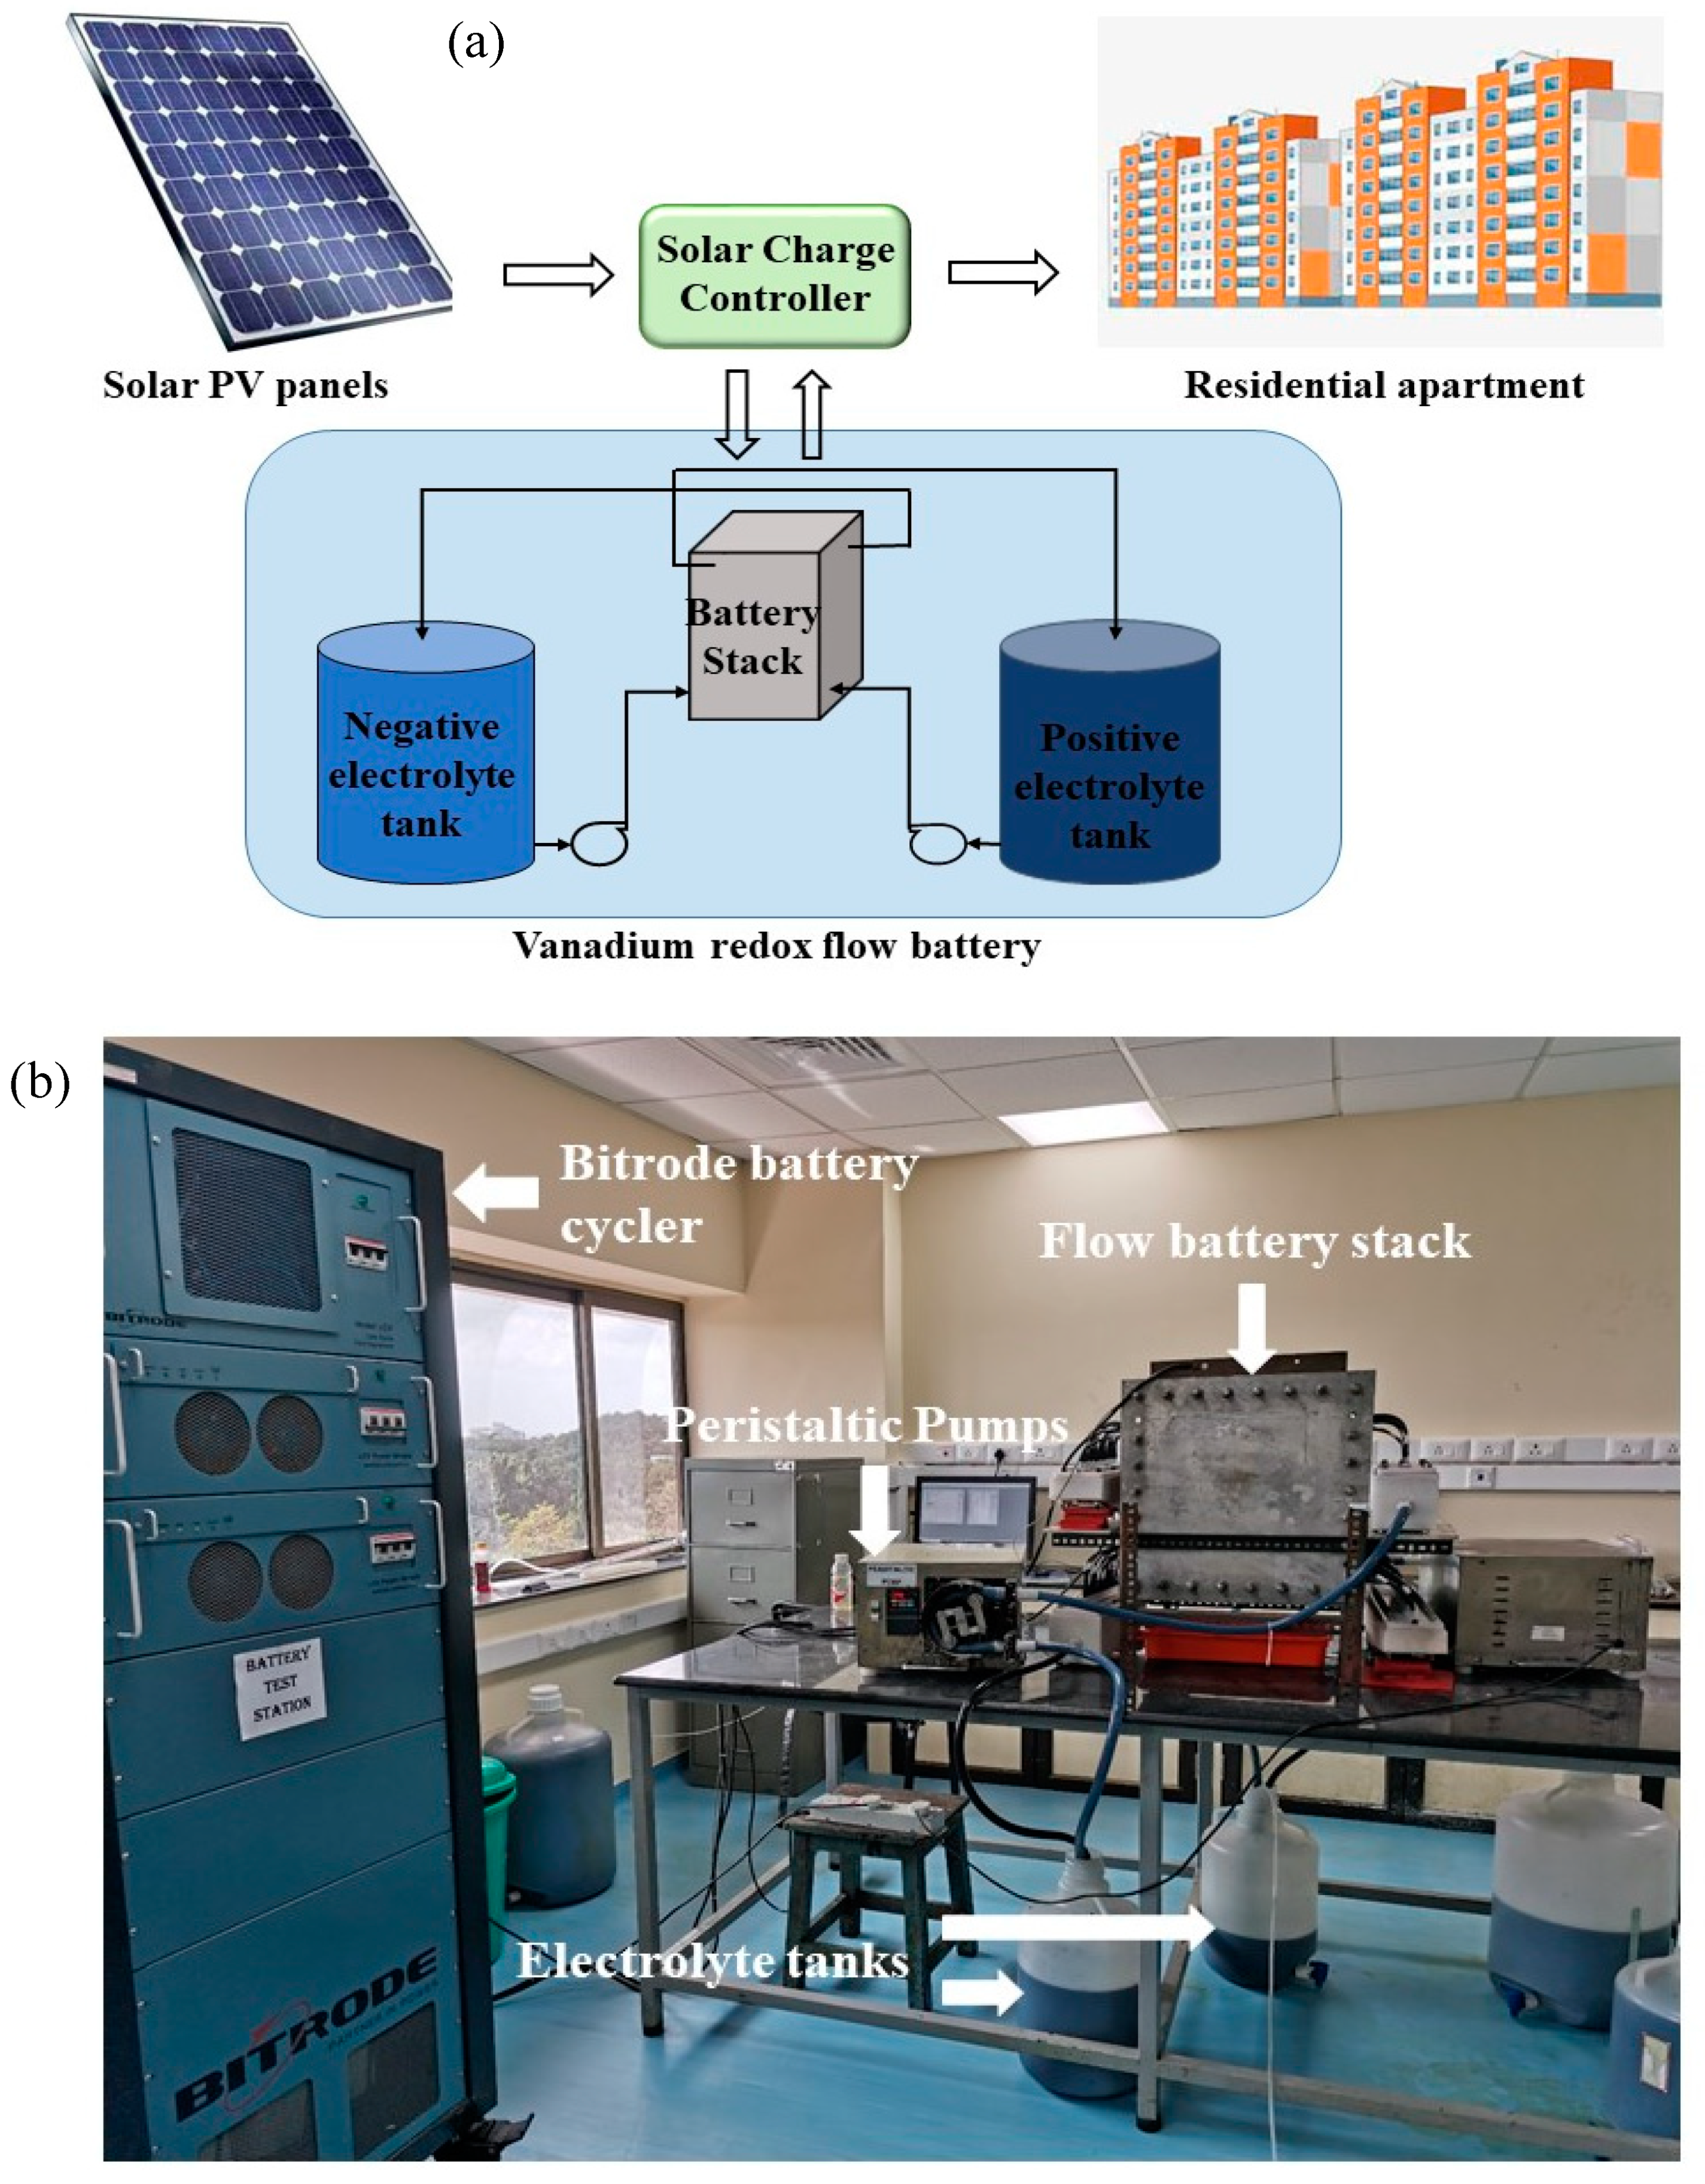
The system being studied consists of a set of PV panels, residential electrical load, a vanadium flow battery system and a charge controller power electronics module to link the three. The conceptual model is shown in Figure 1a. At every instant of time, the charge controller determines the residential load, assesses the available power output from the PV panels and the state of charge of the battery and aims to serve the load demand from PV to the extent possible. When this is not feasible, it attempts to source power from the battery to meet the demand may be partly or fully. Any excess power from the PV will be sent to the battery to the extent possible. The charge controller will, in practice, regulate the power drawn from the PV panels to meet the combined demand from residential load and battery charging. It will also regulate the power going to (and coming from) the battery by operating the latter within its safe operating voltage window. The present study deals with the VRFB system only, and the roles of load, PV panels and power electronics module are taken over by a battery charger (Bitrode Model), as shown in Figure 1b. The time-wise continuous load and PV output profiles are replaced by discrete time steps (of 11 min) during which the power going to or coming from the battery is held constant, subject to the battery lying within its pre-set voltage limits. The battery power is the difference between the PV output and the load, both averaged over the 11-min interval. The battery power may be positive (when the PV output is higher than the load) or negative (when the load is higher than the PV). At the end of the time step (of 11 min), the power is held at zero for one minute so as to measure the open circuit voltage (OCV) of the battery which is used to monitor its state of charge (SoC).Each experiment simulated the continuous running of the VRFB system over a seven-day period with natural variations of solar irradiations and residential power demand incorporated into the profiles. Setting up of these profiles is discussed below.
2.2. Construction of PV Output Profile
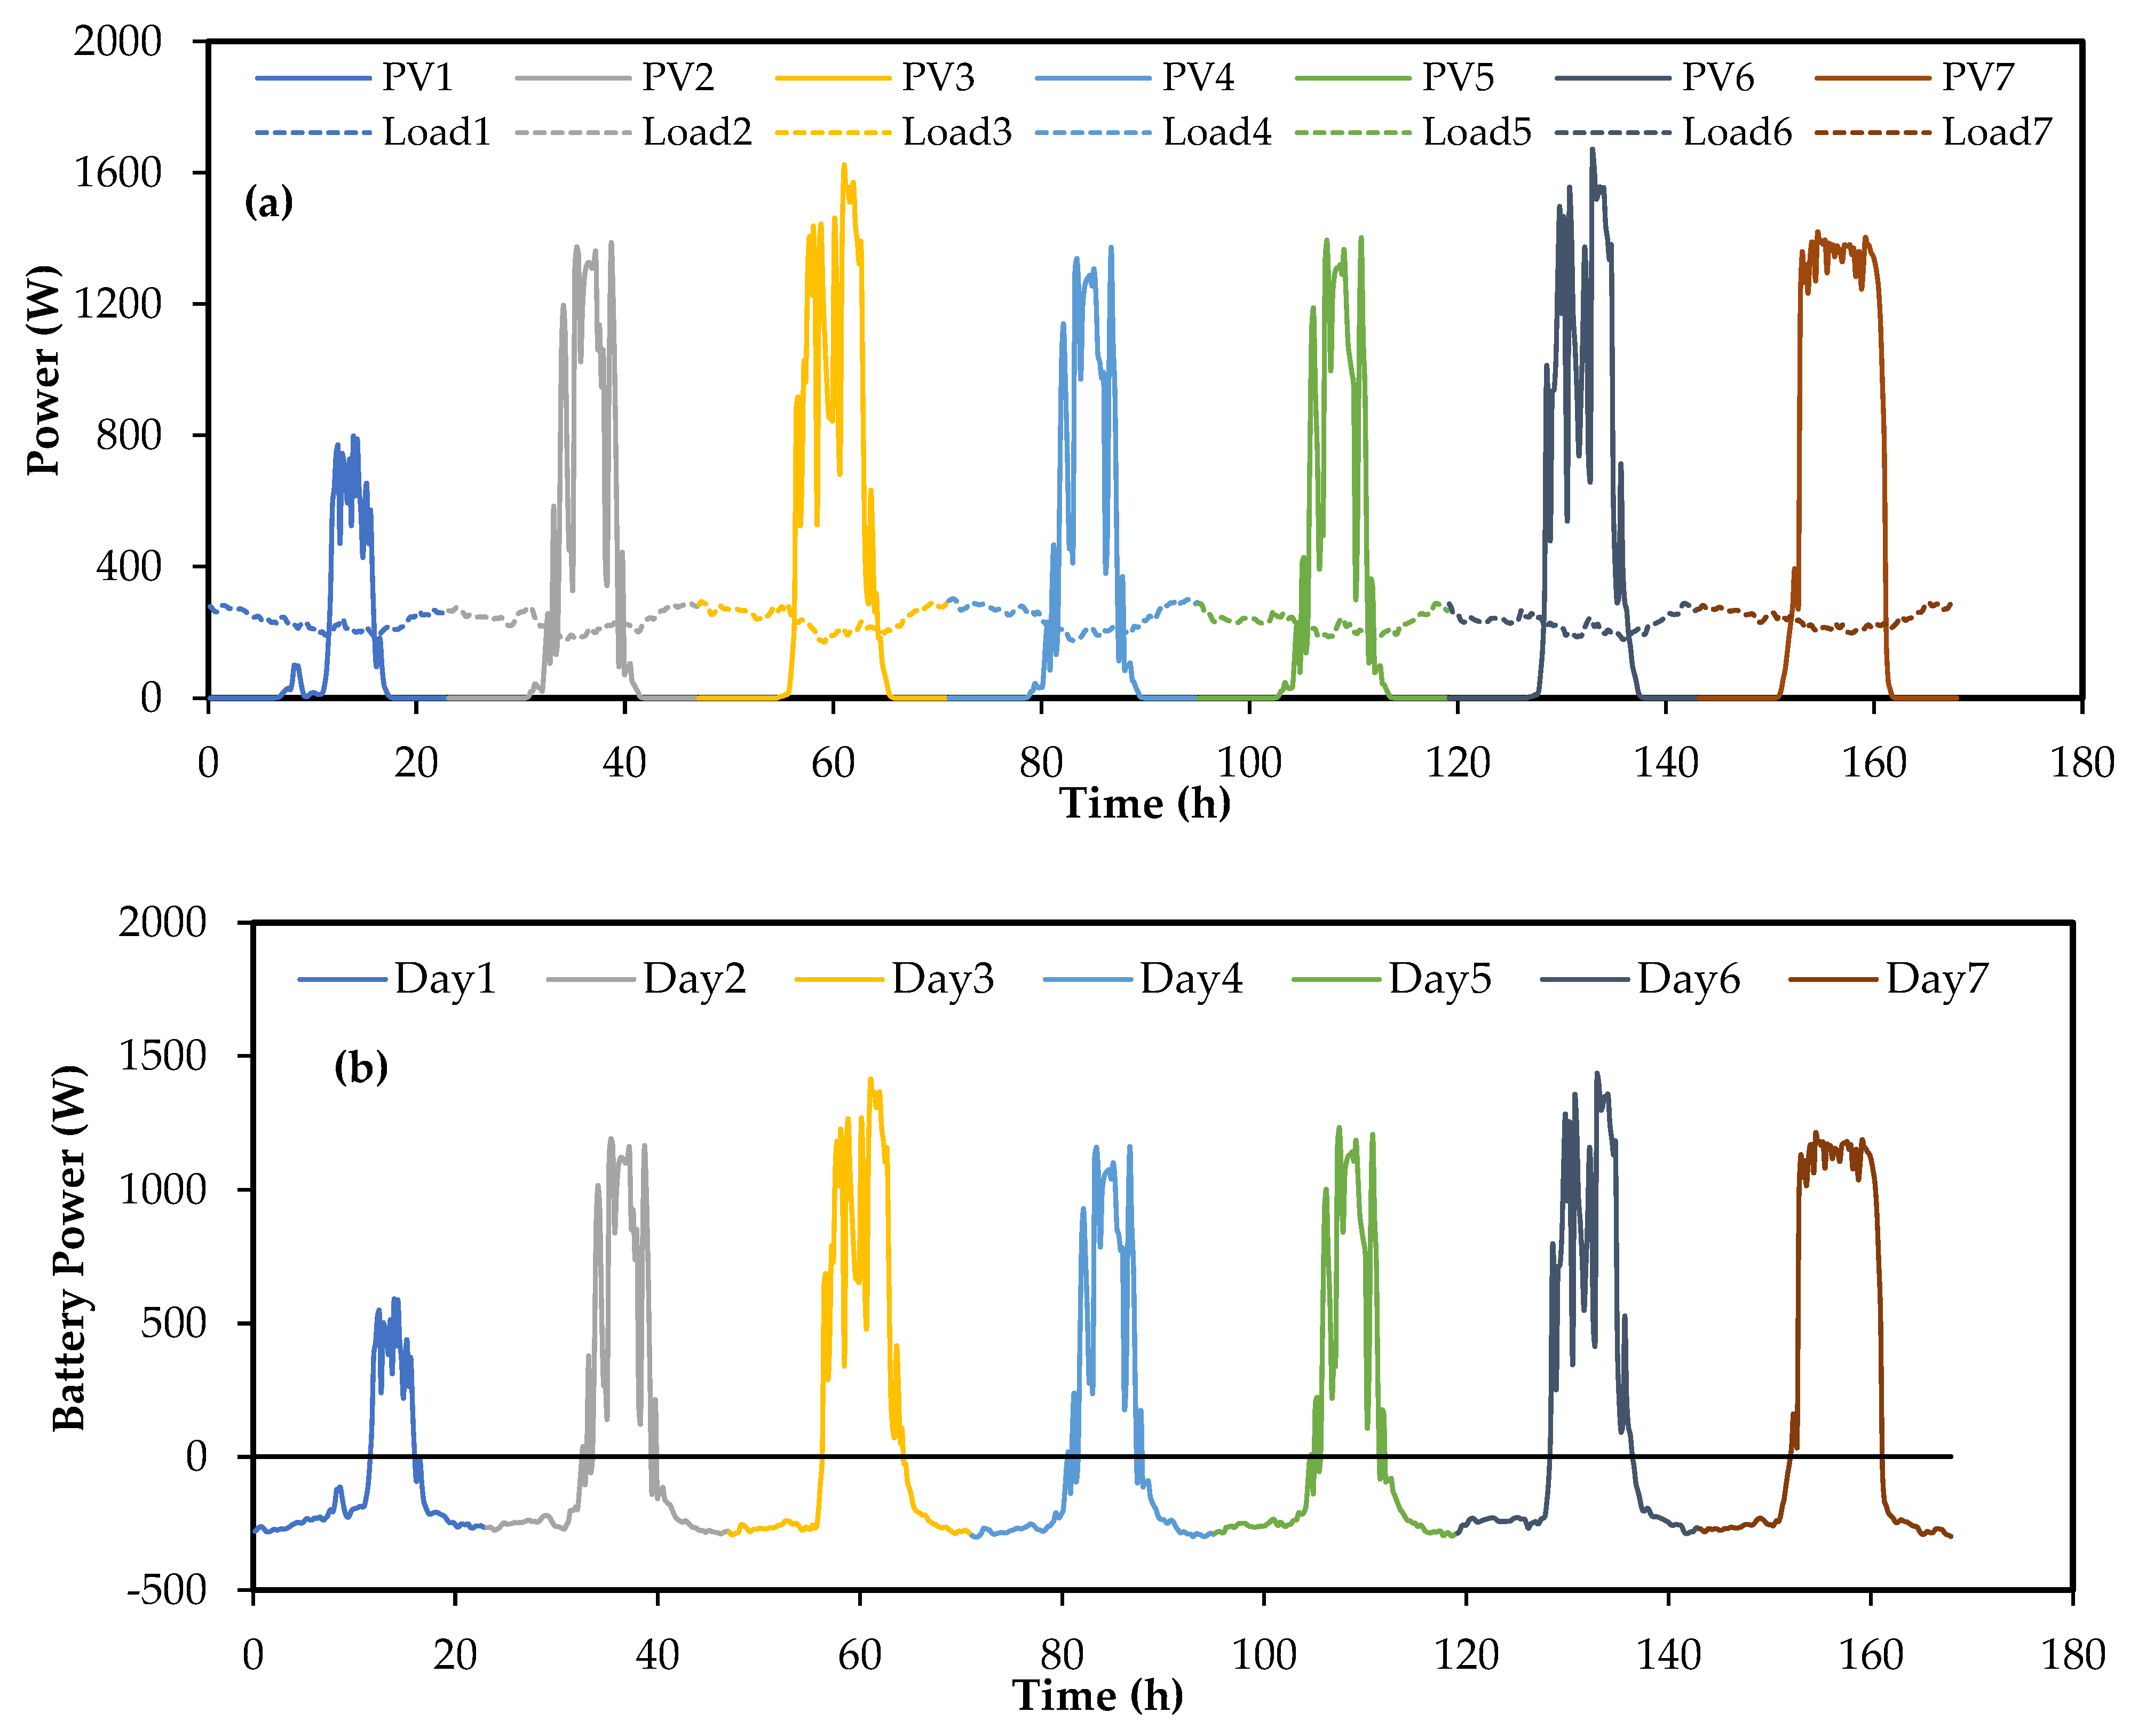
A number of factors such as time of the day, location of PV, season of the year, atmospheric conditions, cell temperature, etc. influence solar insolation at a particular point of time and location. In order to get a realistic simulation of these natural factors in the PV output, solar insolation was simulated using the NREL software SAM for the year 2019 and was compared with global horizontal irradiation (GHI) data for a solar park site in Tumkur, Karnataka, India obtained from Meteonorm 7.0 database [32]. Weekly variation from the first method was found to be between 6.7 and 3.3 kWh/m2 while that from the latter was between 7.7 and 1.98 kWh/m2 over a week in the month of June. In view of the fairly good agreement between the two, seven successive days of insolation data from Meteonorm 7.0 database was chosen to construct the PV output profile for the present study. These give only the total PV output over the day. In order to get a minute-by-minute variation, measurements were carried out over several days using a set of WAAREE WS-325 solar PV panels. These profiles were then normalized by dividing the instantaneous output power by the maximum daily output over all these days. These normalized profiles would then show how insolation might vary over the day so as to give a total daily output which would be less than the expected (clear day) value. These normalized profiles were then used to create a minute-by-minute profile of PV output over seven consecutive days such that their daily output agreed with that obtained from the Meteonorm database [32]. Figure 2a shows the modeled instantaneous PV output over seven consecutive days in the month of June. Salient numerical values of this output profile are listed in Table 1. It can be seen that the peak to average ratio of solar power is rather high at about 3.
2.3. Construction of Residential Load Profile
Typical residential load demand variation in India has two noticeable time periods where the load requirement is high. The morning time of 6 a.m. to 10 a.m. where the residents are getting ready for school and office is a period of relatively high power consumption as is the time period from around 6 p.m. to 11 p.m. wherein the family comes back home to regroup. The power requirement during weekends is also more than that during weekdays. According to the weather conditions prevailing in India, the average household electricity consumption increases further during summer seasons as air conditioning is required. There will be a noticeable dip in the power consumption in the night during the winter months [33,34].
In the present work, realistic variation of electricity consumption has been incorporated by sourcing data from real-time measurements (https://.prayaspune.org/ accessed on 15 January 2020 of the load requirement of a residential apartment complex of 120–145 dwellings in Pune, India [34,35]. Prayas energy group is a non-governmental and not-for-profit Indian organization. As part of one of its projects, the organization recorded real time power demand of residential apartment based in Pune for various appliances, weekends and weekdays over an extended period. The data collected at fifteen-minute intervals over a full week in June 2019 was used to construct the power demand profile. The data were numerically interpolated to generate minute-by-minute variation which is shown in Figure 2a in the form of average value per household. Because of aggregation over a large number of dwellings, the average consumption of power per dwelling does not show sudden spikes associated with the switching on or off of large power consuming devices such as the air conditioner or the washing machine [36].
Salient features of the load variation over the week are listed in Table 1. It can be seen that the maximum load per household over the seven-day duration is 303 W while the minimum is 156 W, that is, a ratio of about 2. This is in contrast to the PV output which has a maximum power of 1670 W, i.e., more than five times the maximum load. This wide disparity between source output and load is characteristic of solar PV-residential load applications. The battery needs to be capable of tackling these wide variations.
2.4. Salient Features of the Redox Flow Battery
An in-house vanadium redox flow battery stack has been used as the battery in the present study. The stack is rated at 1 kW power and has 8 cells of 900 cm2 active area in each cell and features a specially designed flip-flop serpentine flow field [37] on the graphite plates. Nafion 117 membrane is used between the porous electrodes (SGL GFD4.6 4.6 mm thickness) with 35% compression as separator between anode and cathode. Full details of the stack construction can be found in [38,39,40]. Furthermore, 1.6 M vanadium electrolyte, procured from Oxkem, UK in an oxidation state of 3.5 is used as the electrical energy storage medium. In all the experiments, a constant flow rate of electrolyte, which corresponds to a stoichiometric factor of 9 at a current density of 60 mA/cm2, was maintained on each side [22,39]. Comprehensive testing over a range of flow conditions and state of charge (SoC) shows that, over a wide range of SoC, the stack can deliver 1200 W in charging and 750 W in discharging when operated at a current density of 100 mA/cm2. The maximum amount of energy stored in the battery depends on the electrolyte volume. Experiments have been conducted with electrolyte volumes of 30, 35 and 40 liters on each side. At a rated discharge energy of 25 Wh/litre, these electrolyte volumes amount to energy rating of 750 to 1000 Wh and about 50% more in charging.
A couple of runs have also been done with a commercially available lead-acid battery having a rating of 150 Ah, 12 V with a recommended C-rating of 10. Two of these batteries were connected in series thus giving a nominal power and energy rating of 360 W and 3.6 kWh, respectively for the lead-acid battery system. Compared to the VRFB, the lead-acid battery has one-third power and about four times energy storage capacity. Thus, the P/E ratio of the two storage systems varies by more than an order of magnitude.
2.5. Estimation of State of Charge (SoC) of the Battery
State of charge (SoC) of the battery, which represents the fractional energy remaining in the battery for discharge, is an important parameter in assessing battery integration with upstream and downstream equipment. In the present study, SoC has been estimated from measurements of the open circuit voltage (OCV) of the stack at frequent intervals during each run. A single cell using the same materials and methods used to construct the stack was assembled and charge-discharge cycling was done at constant current densities for a single VRFB cell with 1 liter of vanadium electrolyte each as positive and negative electrolyte. OCV of the cell was measured with specified amount of change in SoC intermittently during charge and discharge. At moderate current densities, the overpotential during charge and discharge at a particular SoC value was found to be nearly the same in the SoC range of 20 to 80%. An average of the two curves is taken to be OCV and these data have been used to obtain a correlation between SoC and OCV which then has been used to estimate the SoC dynamically using measured value of the OCV.
2.6. Set-Up of the Experimental Study
A comparison of the load and supply profiles over a seven-day period is shown in Figure 2a. Figure 2b shows the difference between the two; this is the power that would be drawn from or sent to the battery. As remarked earlier, the residential load is fairly constant compared to the large spikes in solar output. There is also considerable variation in the day-to-day energy output from the PV. The integrated PV-battery-load system should be able to work with these typical variations and still deliver as much power as demanded by the consumer at every moment. For the integrated system to perform effectively, the individual systems should be properly scaled so that the systems are not too oversized nor too undersized. The performance of the integrated system—in terms of being able to meet the load demand at any instant, being able to use PV output for either meeting the load or charging the battery and for the battery to operate at high charging /discharging efficiencies—and its relation to the sizing of the components is of interest to the present study.
Examination of the load and supply profiles shows that on the whole, there is considerable overlap between the two. In energy terms, this PV self-consumption (PVSC) amounts to about 23.4% of PV output that can go directly to the load during the sunshine hours; the rest of the 76.6% of load needs to be met through battery which is charged by the PV, assuming the system to be working independently of the grid. Keeping these numbers in view, the sizing of the PV and the battery is done as follows. Over the seven-day period in consideration, the residential load amounts to 39.9 kWh. Assuming the PV to be oversized by a factor of 25% (given the rather wide variations in the day-to-day energy output from the PV), the PV system is nominally rated at 50 kWh. The energy output per day is scaled as per Figure 2a which reflects measured day-to-day variation over a week in June 2019. The battery power profile is simulated as the difference between the power from PV and load demand and is shown in Figure 2b. This data (see also Table 2), with a scale factor, constitutes the input to Bitrode battery cycler to simulate the dynamic changes in PV-battery-load integrated system.
The experiments were designed to operate the battery with scaled down factors and varying electrolyte volumes to understand the stack performance for varying energy and power demand. Keeping in mind different power and energy characteristics of the two battery systems used in the present study, a power scale factor, SP, an energy scale factor, SE, and a time scale factor, ST, have been varied independently while maintaining the relation that SE = SP × ST. Thus, having SP = ½, SE = ½ and ST = 1 will simulate an integrated system with a total weekly solar energy input of 50/2 = 25 kWh. If ST is changed to ½ while keeping SP to be ½, the energy input to the system will be reduced to 12.5 kWh over the week. Given that the VRFB system has a high power to energy ratio, for VRFB studies, experiments were conducted with SP of 1 (full scale) or ½, ST of ½ or ⅓ or ⅕ resulting in SE of ¼ or ⅕ or ⅙. The lead-acid battery has a rated P/E of ⅒. Therefore, it has been operated at SP of ⅙ and ⅛ with ST of 1 giving an SE of ⅙ or ⅛. It may be noted that these scale factors refer only to traded energy; the inherent maximum energy storage capacity or power delivery capacity depend on the state of the battery and the operating conditions, including the volume of electrolyte and stack size and cell characteristics in the case of VRFB and nominal factory rating in case of the lead-acid battery.
In the experiments, the actual power vs. time profiles of the battery (shown typically as in Figure 2b) are imposed on the battery through a battery cycler such that the pre-determined power is held constant for 11 min in case of ST = 1 (and 5.5 min in case of ST = ½). The experiment is designed such that when the battery is not able to deliver the intended power, it goes to rest for a time period of 1 min. Open circuit voltage (OCV) of battery was also monitored over a one-minute rest period after every power step, whether or not the power step was a failure. The OCV data was later used to evaluate the battery efficiency characteristics. Such experiments have been conducted for different scale factors and electrolyte volumes. Results from these simulation runs, together with initial redox flow battery characterization study, are discussed in the next Section 3.
3. Results and Discussion
3.1. Battery Performance for the Baseline Case
As a baseline case, the VRFB stack was operated at power scale factor (SP) of ½ and time scale factor (ST) of ½ with electrolyte volume of 30 L in each tank. The 7-day battery profile shown in Figure 2b was discretized into constant power time steps of 5.5 min and was imposed on the stack using the battery cycler. OCV was measured after every time step over a period of 1 min during which the battery power was set to zero. The battery cycler was programmed in such a way that if the intended power during a particular time step could not be delivered to or drawn from the battery, then that power step would be aborted, and the testing would continue to the next step which would be the OCV measuring step. At the end of the OCV step, the next power step would be imposed. Thus, battery failure would be indicated by a power step that did not last the full duration of 5.5 min. During the whole experiment, the voltage and current across the battery were measured at 5 s intervals. Prior to each run, the battery was charged until the stack voltage reached the pre-set value of 1.7 V per cell.
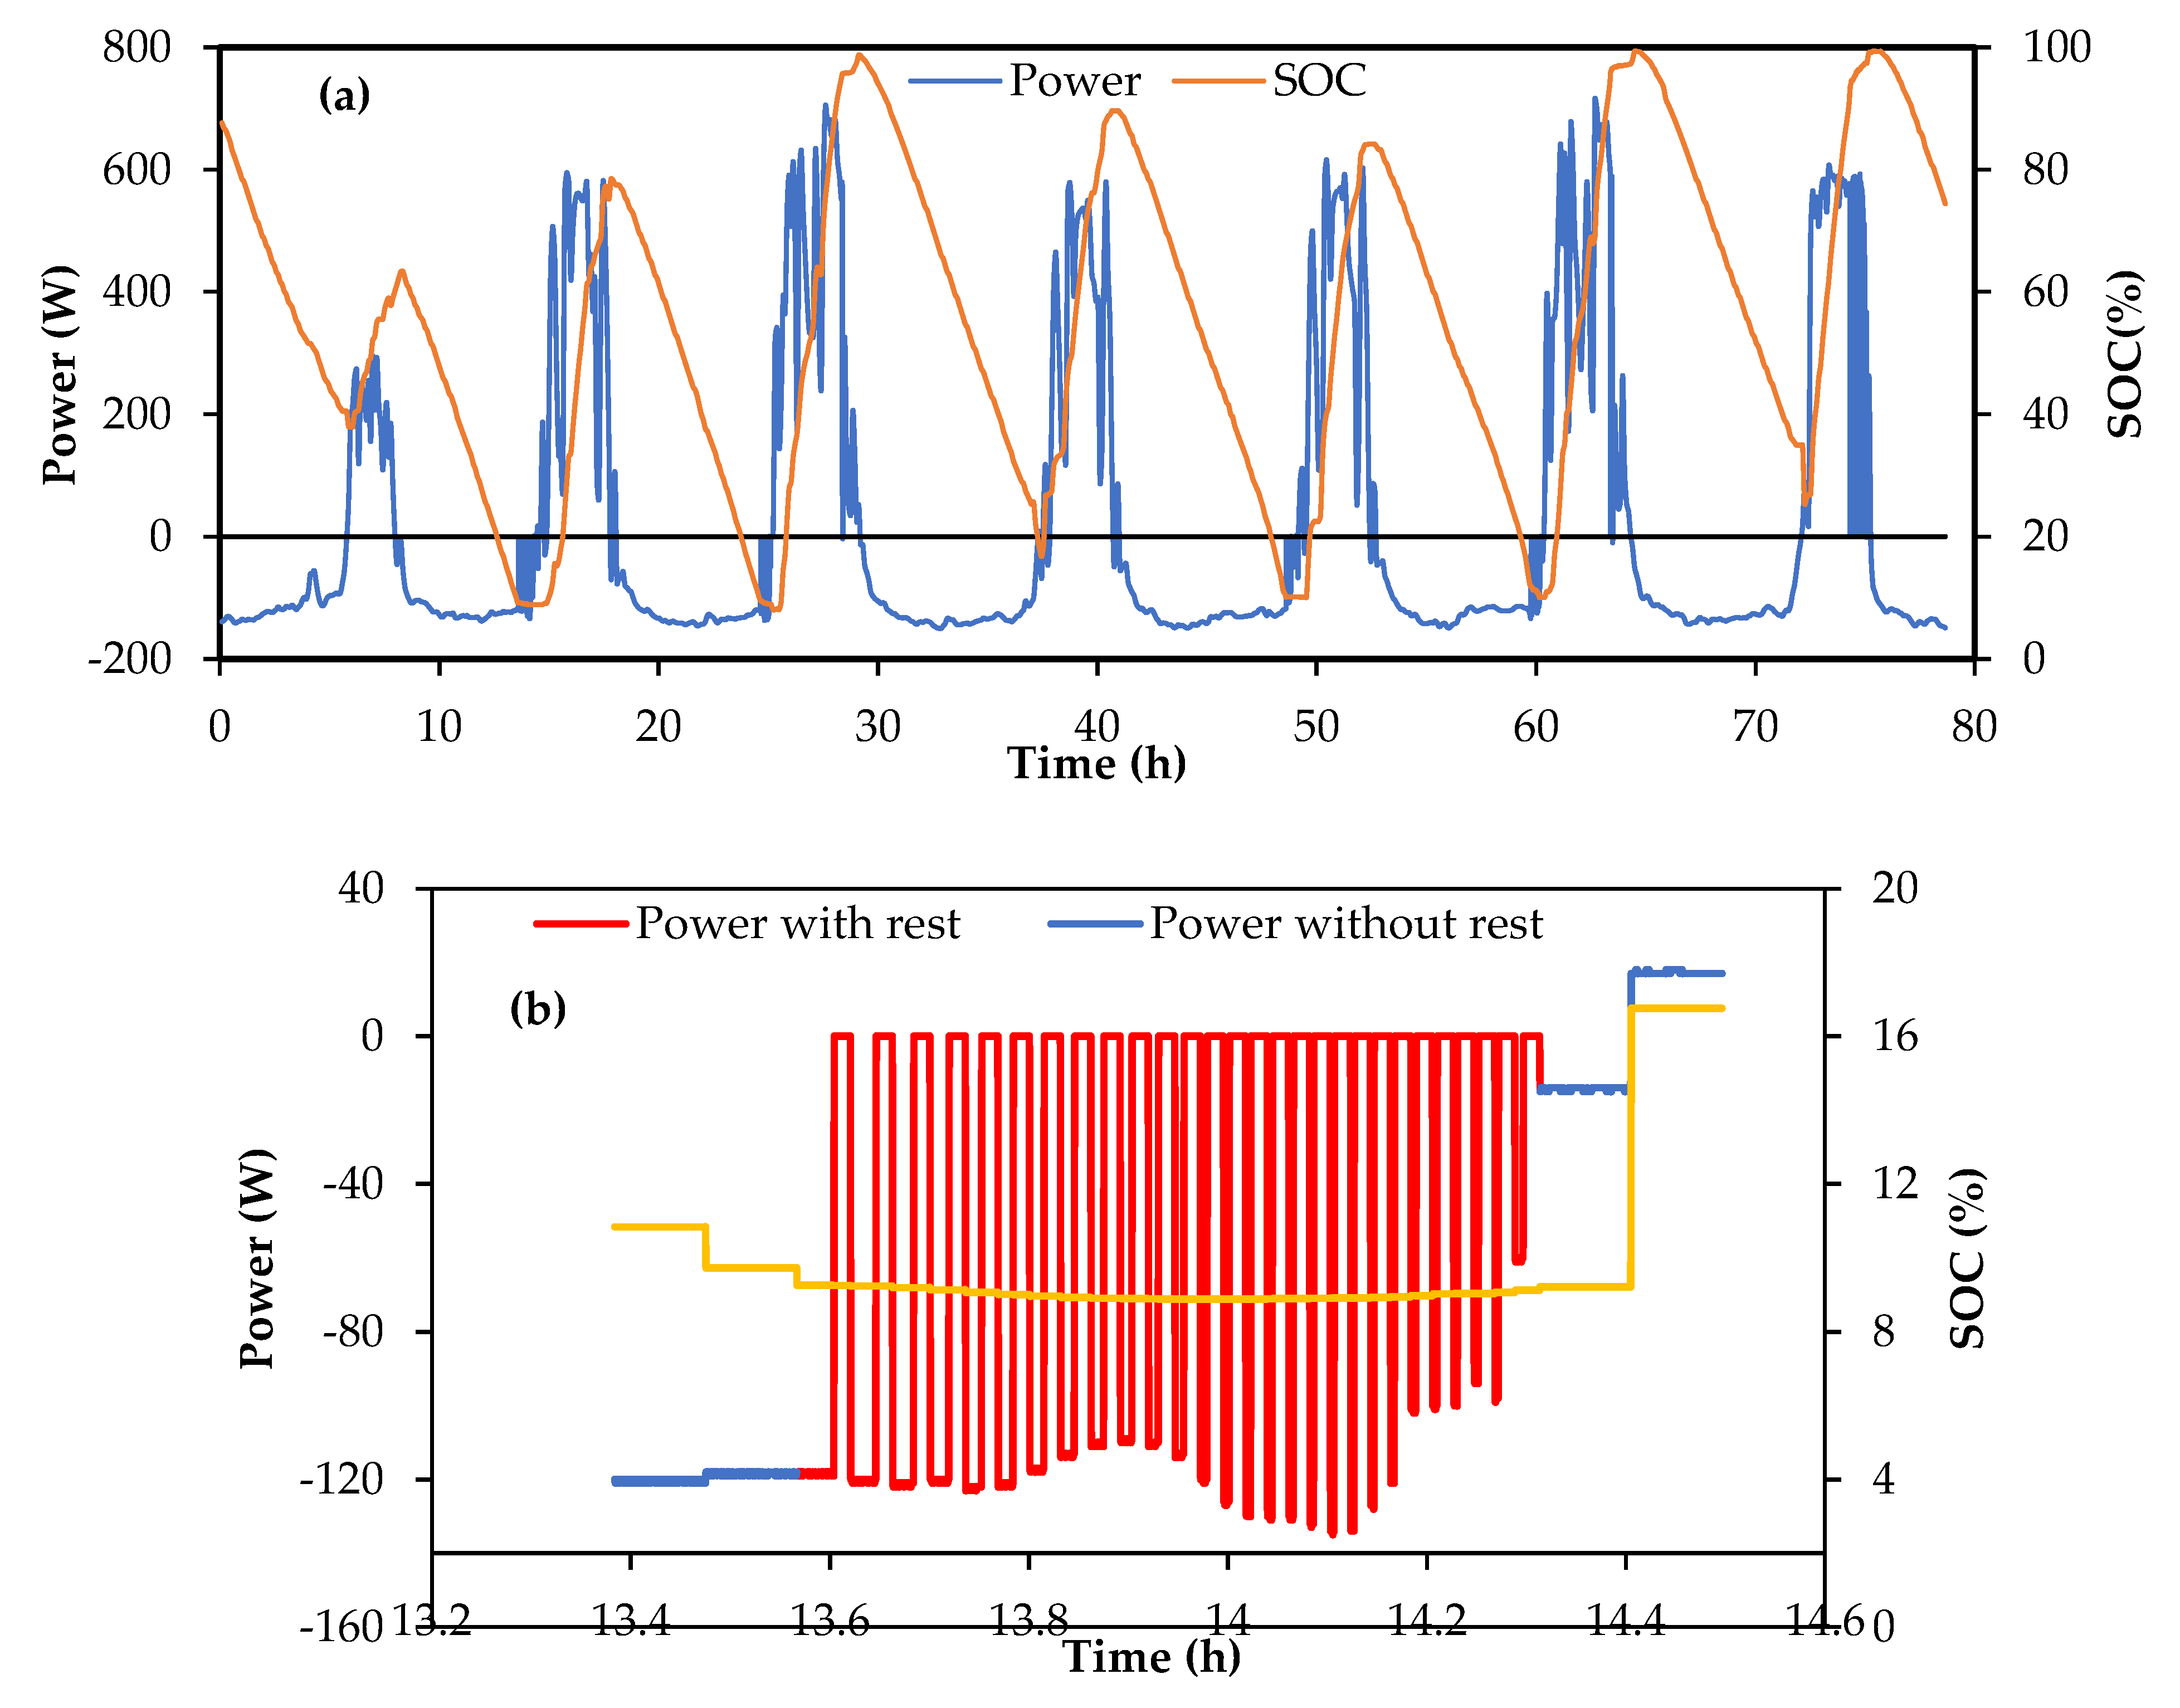
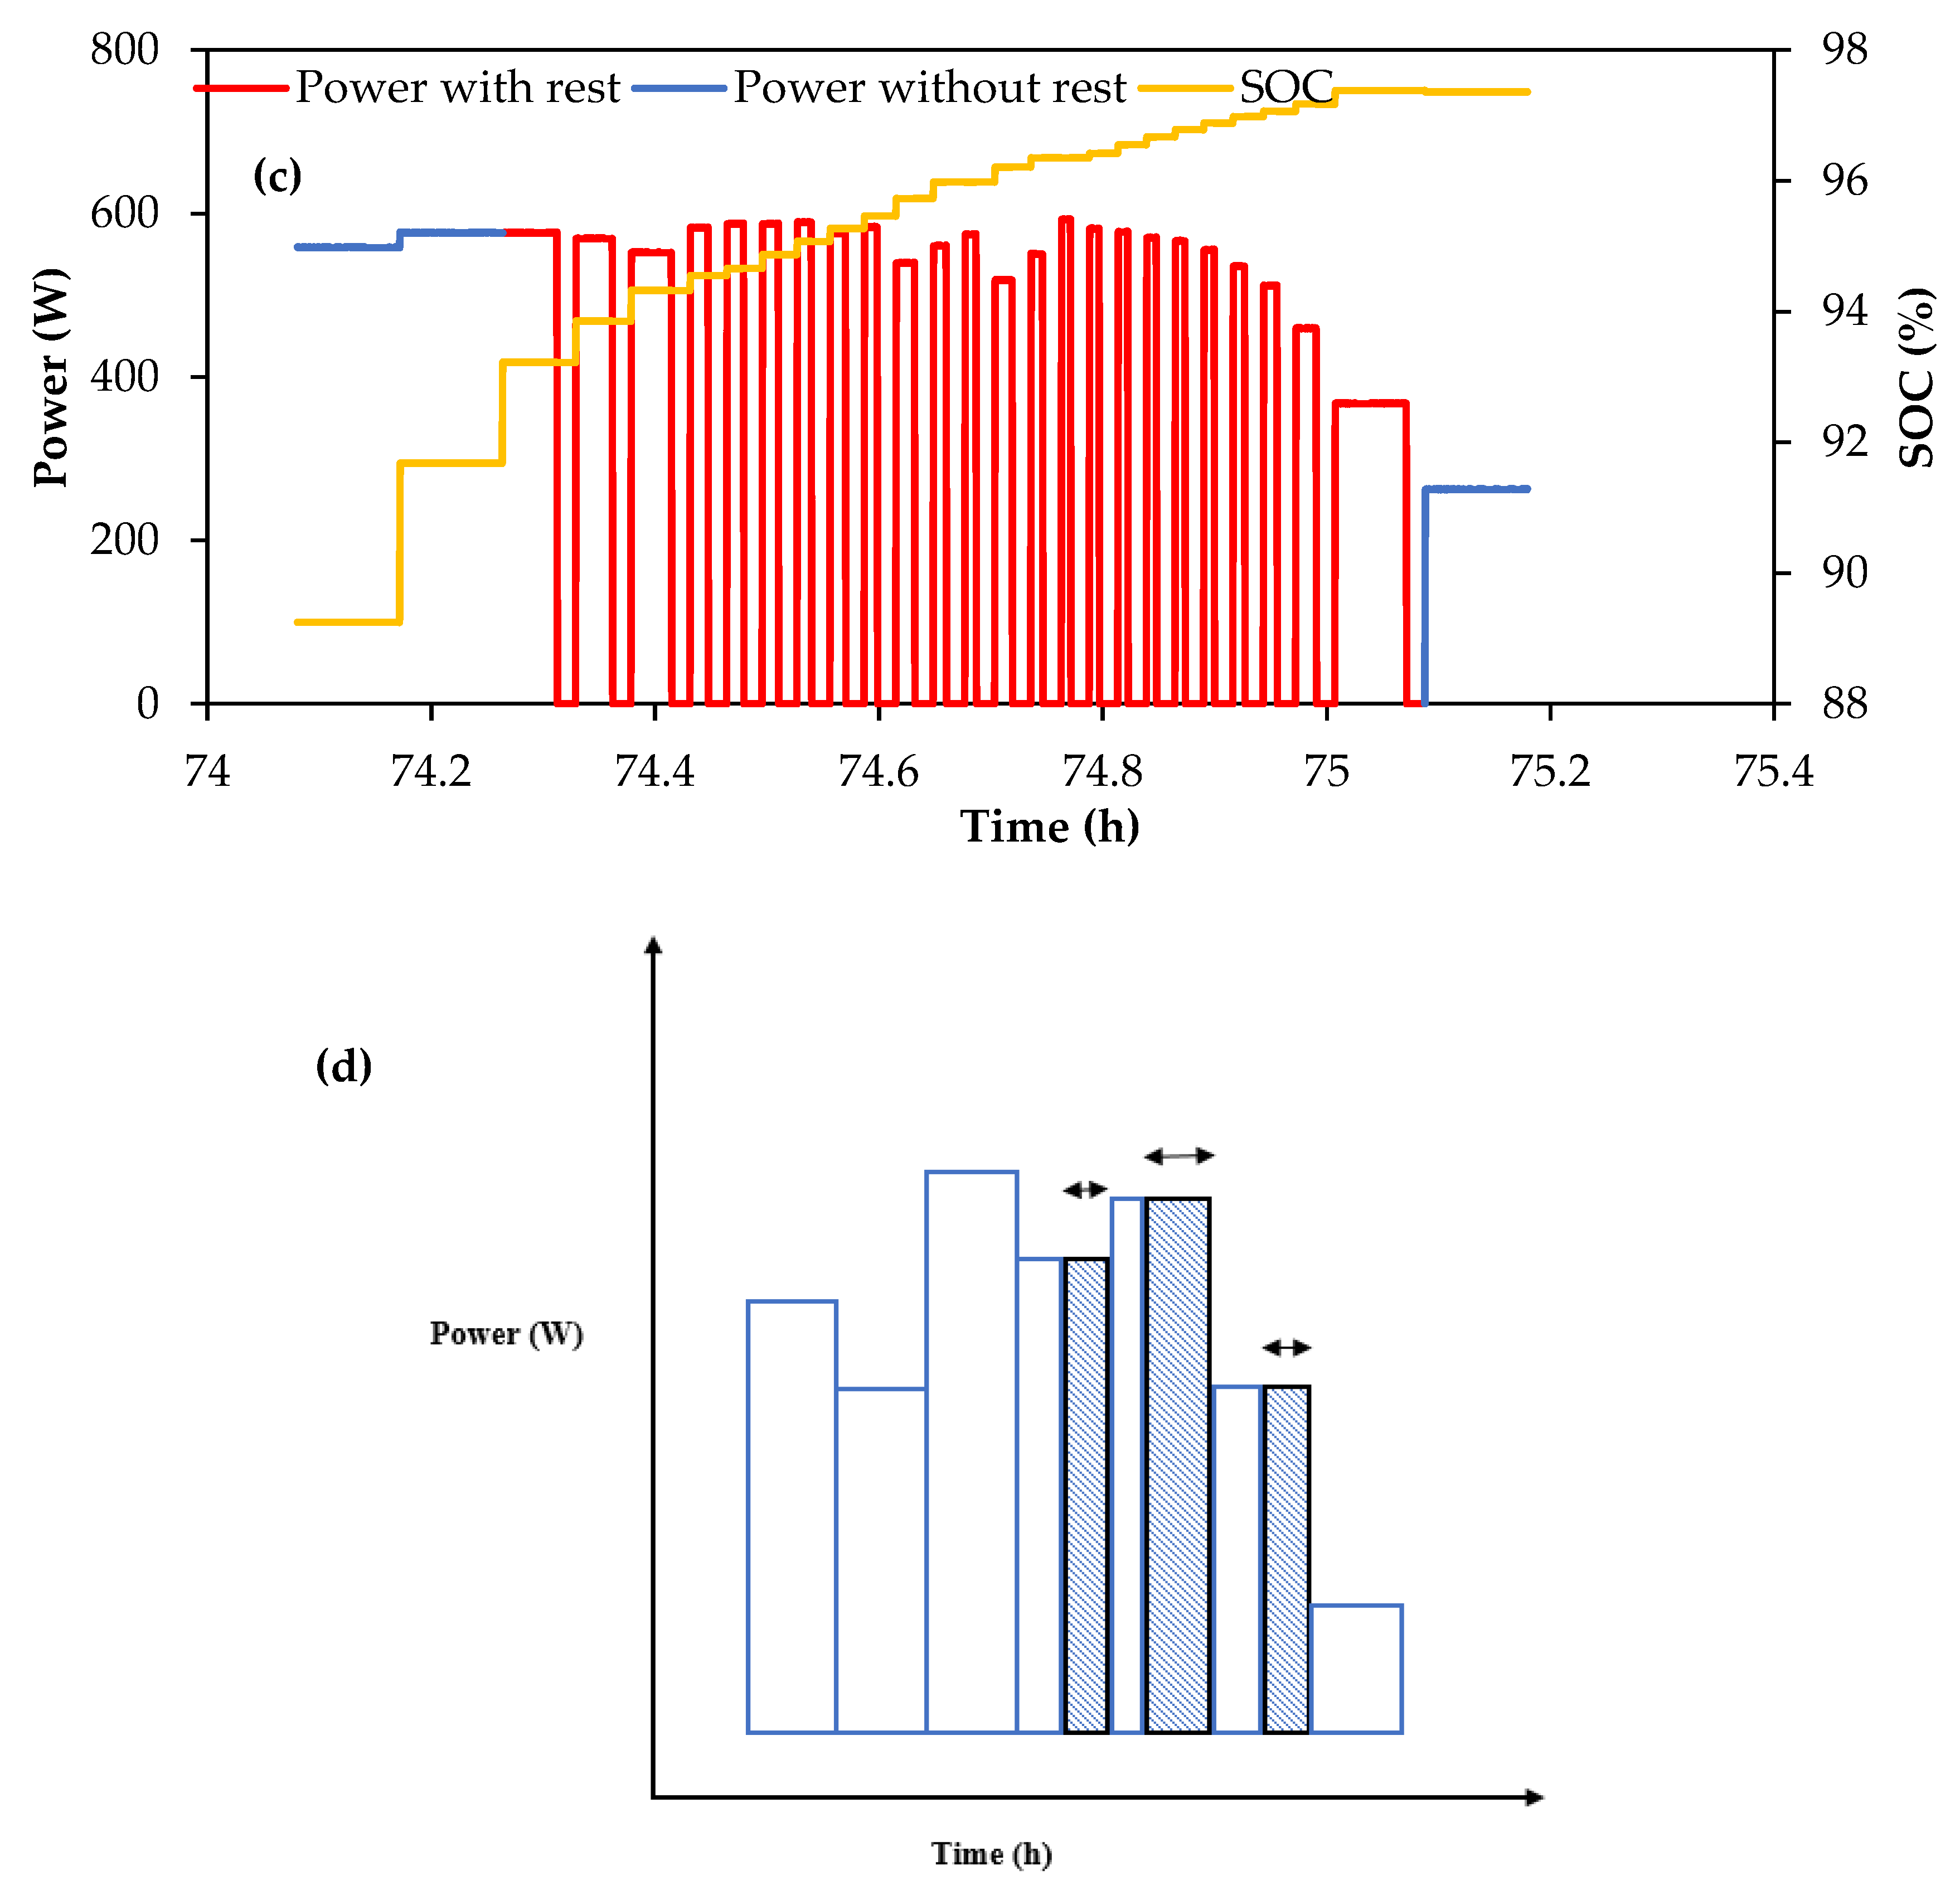
The response of the battery to the imposed power steps is depicted in Figure 3a which shows the variation of power and SoC over the seven-day period. (It may be noted that the total duration of each experiment would depend on the time scale factor as well as on the number of failures and the number of OCV steps and would therefore change from run to run. For ST of ½, if the OCV measurement steps are discounted and if there are no charging or discharging failures, then the duration would be 84 h). The experiment started at midnight of the first day, and thus, with a discharge step and would then go continuously over a series of charging and discharging steps and would finish with a partial discharge of the 7th day. The SoC obtained using measured OCV is also plotted in the figure. One can see that the power variation follows the expected variation and that the steep changes in power are easily handled by the battery. The repeated variation of SoC over a wide range without lasting ill effects on the battery is also noteworthy. The full range of SoC of the battery is thus being utilized and this is an important feature of the vanadium flow battery.
One can also see in Figure 3a several instances of failure of the stack to deliver or absorb the required amount of power. Charging failures occur when the SoC is very high and discharging failures occur at very low SoC values. An expanded view of one such discharging failure is shown in Figure 3b which shows repeated failure to execute discharge power step over the simulation period of 13.6 h to 14.3 h. During this period, the SoC is particularly low (~9%) and the stack was unable to discharge even 120 W of power. (More power could have been extracted from the battery by increasing the electrolyte circulation rate or decreasing the power; however, such active management of the electrolyte was not done in the present study). An instance of battery failure during charging is shown in close-up view in Figure 3c which shows charging failure towards the end of charging on the 7th day over the period 74.3 to 75 h. One can see that the SoC is rather high at around 92%. Figure 3d shows the nomenclature used in the present study to characterize battery failure to deliver by time and energy. Typically, the stack will be able to meet the power demand for part of a power step and it may then fail for the rest of the duration of the time step. Cumulative amounts of time during which the power demand has not been met is used to determine battery failure by time. The shaded areas in Figure 3d represent the amount energy demand that has not been met. This is used to determine the cumulative battery failure % by energy.
The daily changes in energy flows during charge and discharge are listed in Table 2. One can see the amount of energy output from the battery during the 1st charge is only 419 Wh and the profile requires the battery to discharge up to 1100 Wh on certain days. Due to depletion of stored energy, its SOC becomes so low that it has been unable to deliver the load demand requirement. The battery is able to accommodate the charge energy from PV during the 2nd day of insolation but is not able to deliver again during the early morning of the 2nd night discharge as the intended discharge energy is 10% higher than what the battery has been able to absorb during the 2nd charge while the amount of energy put in during the 2nd day charging is only 10% higher than what battery is expected to discharge in the night. Third day’s charging is of high energy content and the battery fails briefly towards the end of the charging time because the SoC has reached 95% and it is unable to accommodate the amount of energy coming in at the high power of 570 W. The high energy input during the third day means no discharge failures on the 3rd night. The relatively lower amounts of charge on the 4th and the 5th day of charging lead to discharge failures on the succeeding discharging events. The amount of energy charged on the 6th day is the highest among the seven-day profile; as a result, the battery gets fully charged resulting in no discharge failure on the 6th day. The last day’s charge too is considerable and due to the high SoC at the beginning of charge (~25%), the battery soon gets fully charged leading to extensive charging failure on the last day and no discharge failure during the last night.
Table 3 shows the details of energy delivered and charged for various charge and discharge cycles. Energy-based % failure and time-based % failure for each case is also tabulated. Minor (1–2%) energy-based failures without corresponding time-based failures can be neglected as errors due to fluctuations in battery power supplied by the battery cycler. One can see that significant discharge failure has occurred in 1st, 2nd, 4th, and 5th discharges and significant charge failures in the 3rd, 6th, and 7th charges. The first discharge failure may be attributed to the exceptionally low insolation on the first day from an already depleted battery and is thus caused by initial conditions of the set-up. (In view of this, subsequent runs have been done with second day’s half discharge.) The 3rd and the 4th discharge failures may be attributed to the large amount of discharge that needed to be done. The more severe 5th discharge failure is somewhat surprising as the amount of discharge energy is smaller and the amount of charge energy in the preceding charge is higher. However, as can be seen in Figure 3a, the SoC at the beginning of discharge is lower than that at the corresponding stage of the 3rd and 4th discharges. Thus, discharge failures are associated with low SoC rather than high power under typical residential load conditions. In contrast, charge failures are a combination of high power and high SoC (compare the conditions of the 3rd, 6th, and 7th day charge failures in Figure 3a) as the charging power is significantly higher than the average discharging power in solar PV-residential load integration applications.
3.2. Power and Energy Scaling Studies
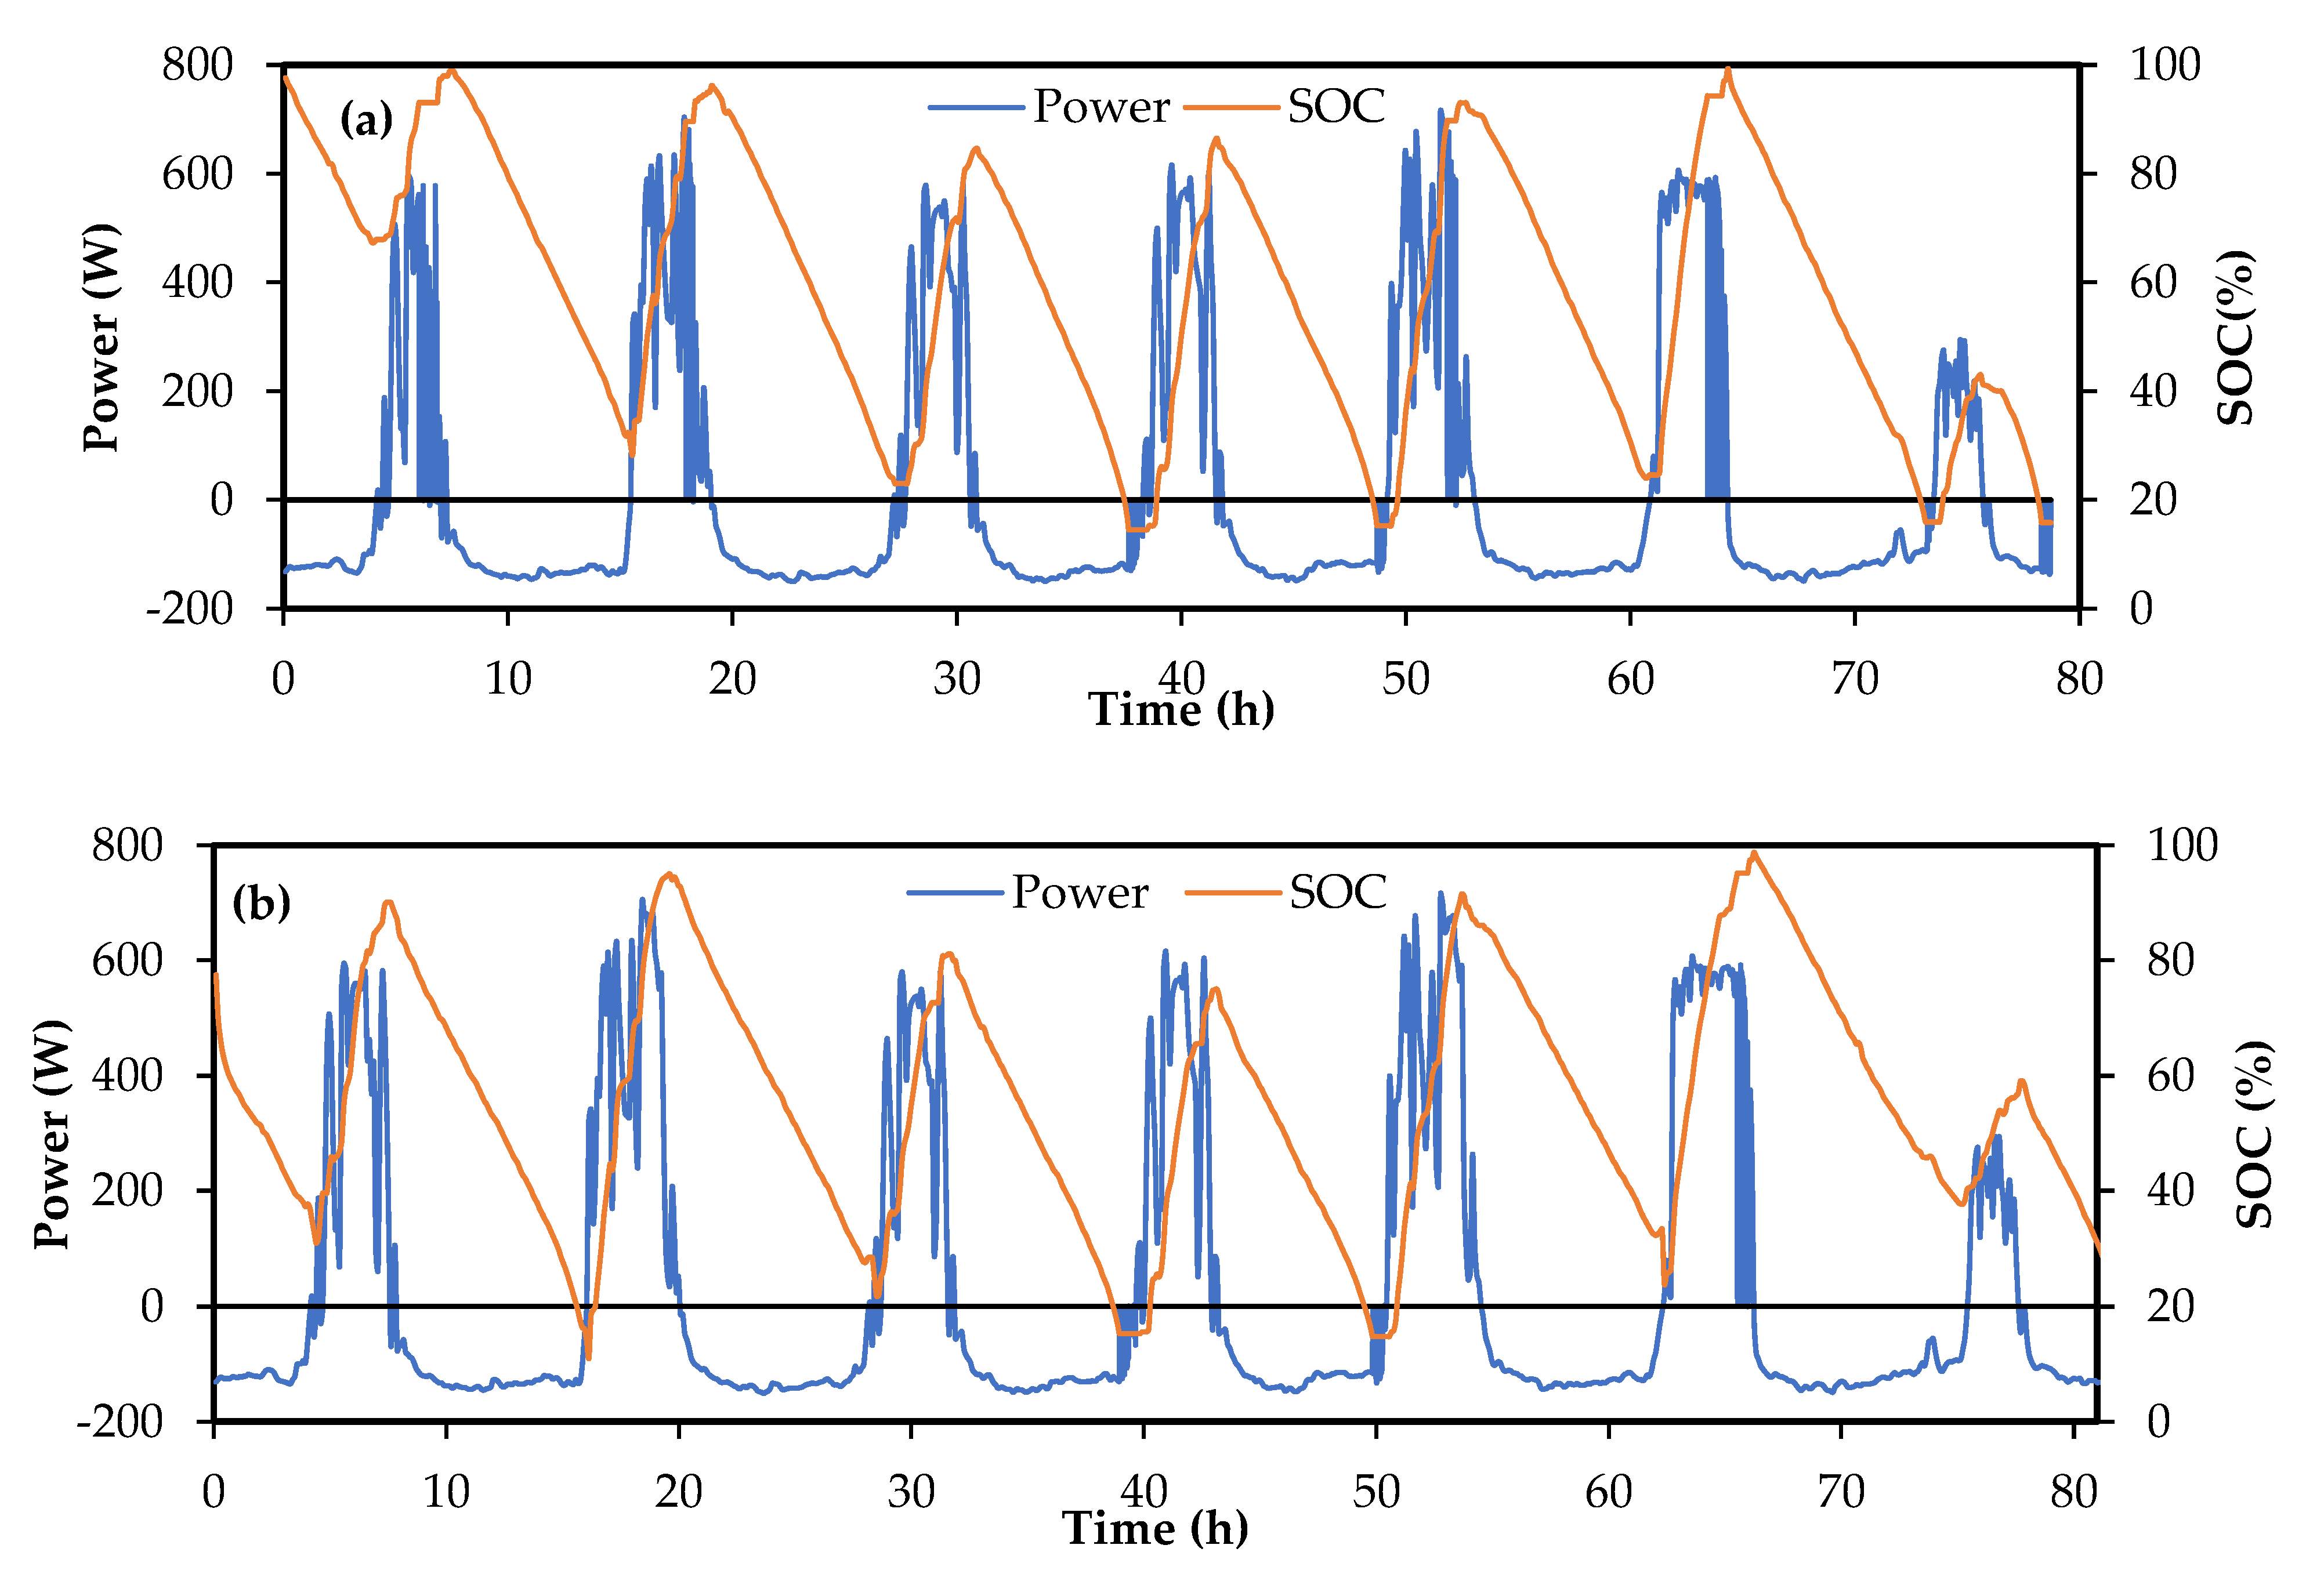
In order to study the influence of electrolyte volume, and hence the battery system’s energy storage capacity, on the dynamic performance of the integrated system, experiments have been carried out with the electrolyte volume increased from 30 liters to 35 liters on each side and then once again from 35 liters to 40 liters. The same stack operated with the same voltage limits and electrolyte circulation rates was used in these simulations. Thus, compared to the baseline case, the power scaling remains the same but energy storage capacity has been increased by 16.6% and 33%, respectively. As mentioned earlier, the ordering of the days has been changed from 1-2-3-4-5-6-7 to 2-3-4-5-6-7-1 to remove the anomalous influence of the starting day. The battery response in terms of power and SoC in these two cases is compared in Figure 4. It can be seen the first day discharging failures have disappeared but mid-week discharge failures are still there, though with reduced intensity, especially in the case with 40 L electrolyte volume on each side. In both cases, the mid-week discharge failures are associated with the battery reaching very low SoC despite increased storage capacity compared with the baseline case. Thus, increasing the electrolyte volume is beneficial in reducing discharge failures. Charge failures too have come down significantly, especially in the 40 L case in which instances of high SoC have reduced considerably.
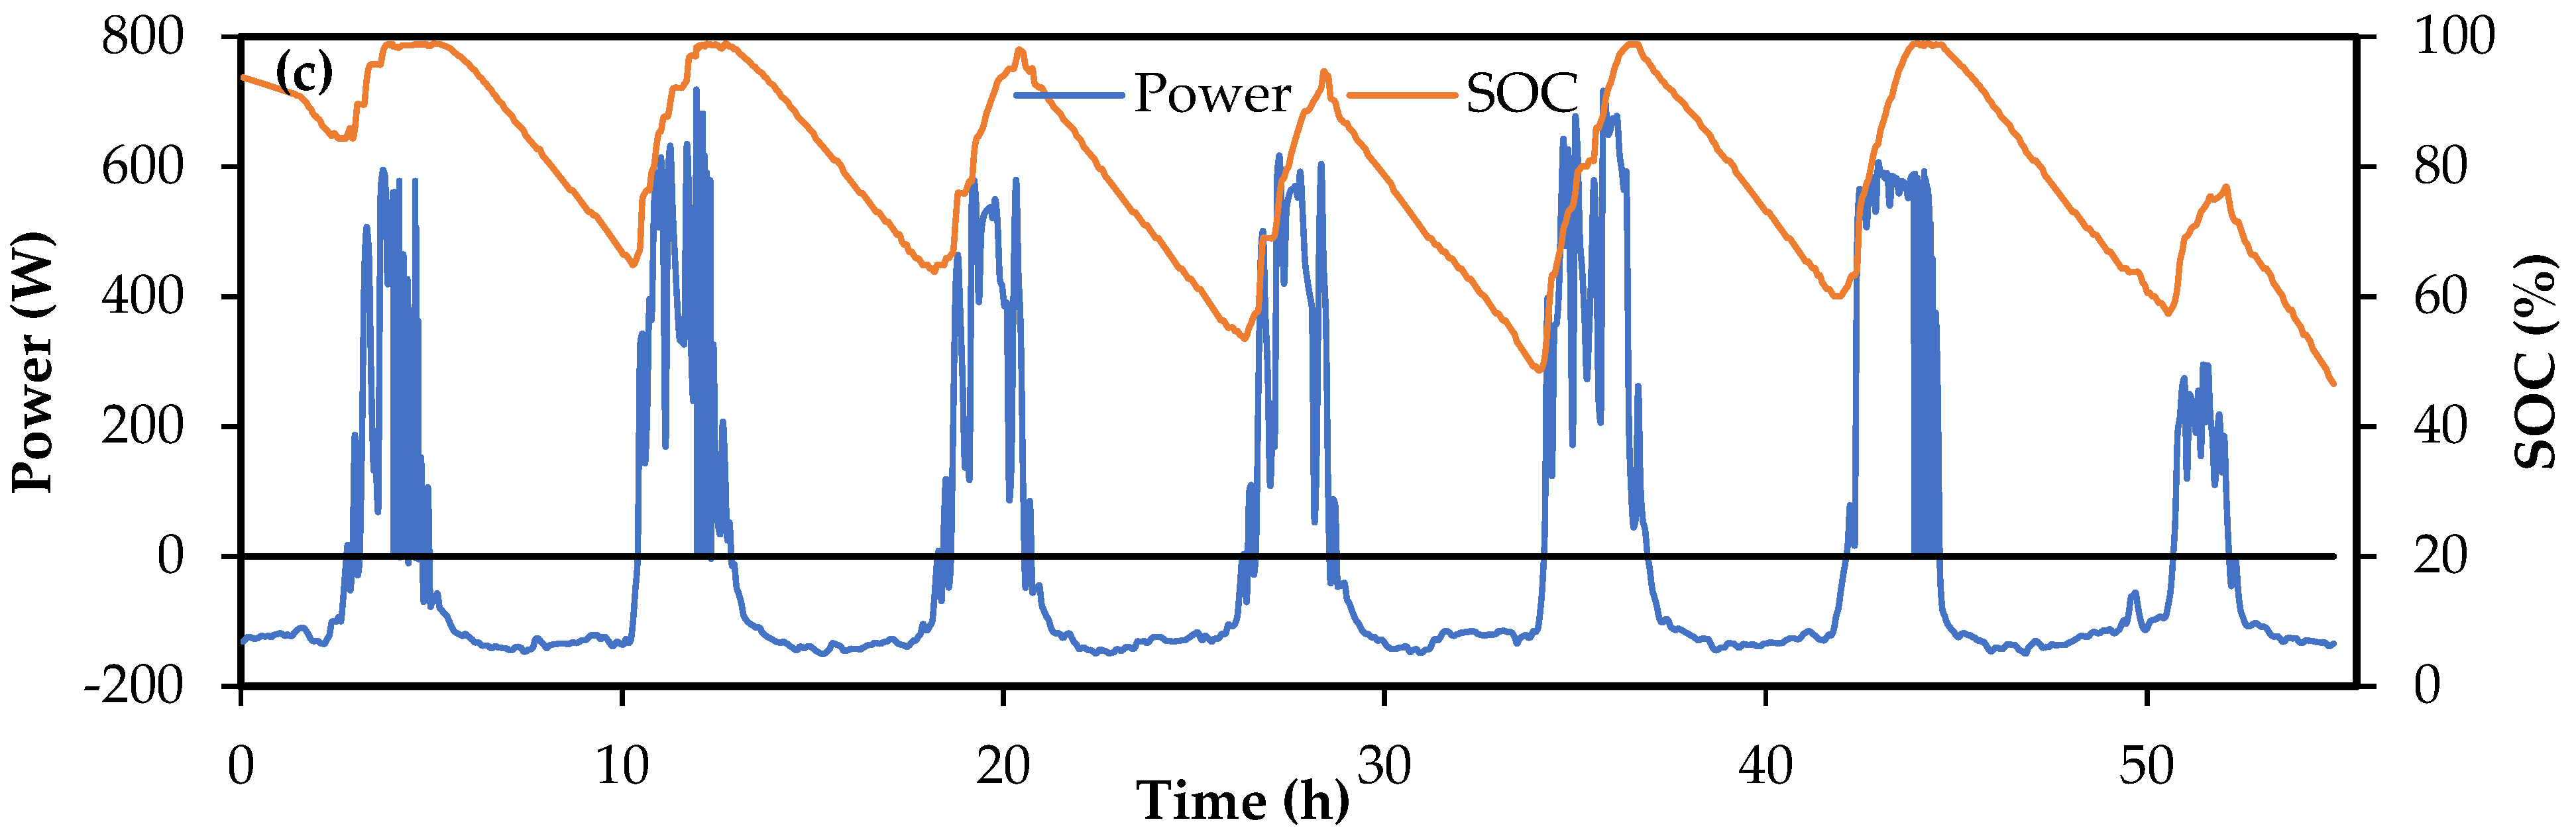
In the above two cases, the total energy intended to be traded is the same as that in the baseline case; only the energy storage capacity of the battery system is increased by increasing the electrolyte volume. Figure 4c shows the response for a stack with 40 L of electrolyte which is run on the same power scaling of SP = ½ but with a time scaling of ST = ⅓. This system has the same energy storage capacity as that of Figure 4b but the energy traded is reduced by ⅓rd. Thus, this experiment is equivalent to SP = ½ with ST = ½ scaling with 60 L of electrolyte at initial SoC of around 60% for the same battery stack. As can be seen from Figure 4c, there are no discharge failures as the SoC remains comfortably high (>40%) throughout the equivalent seven-day cycle. However, the battery has more charging failures because the SoC reaches high values (>90%) repeatedly. However, this failure to charge does not translate to failure to meet load demand because the system has high storage capacity (twice as much as that of the reference case).
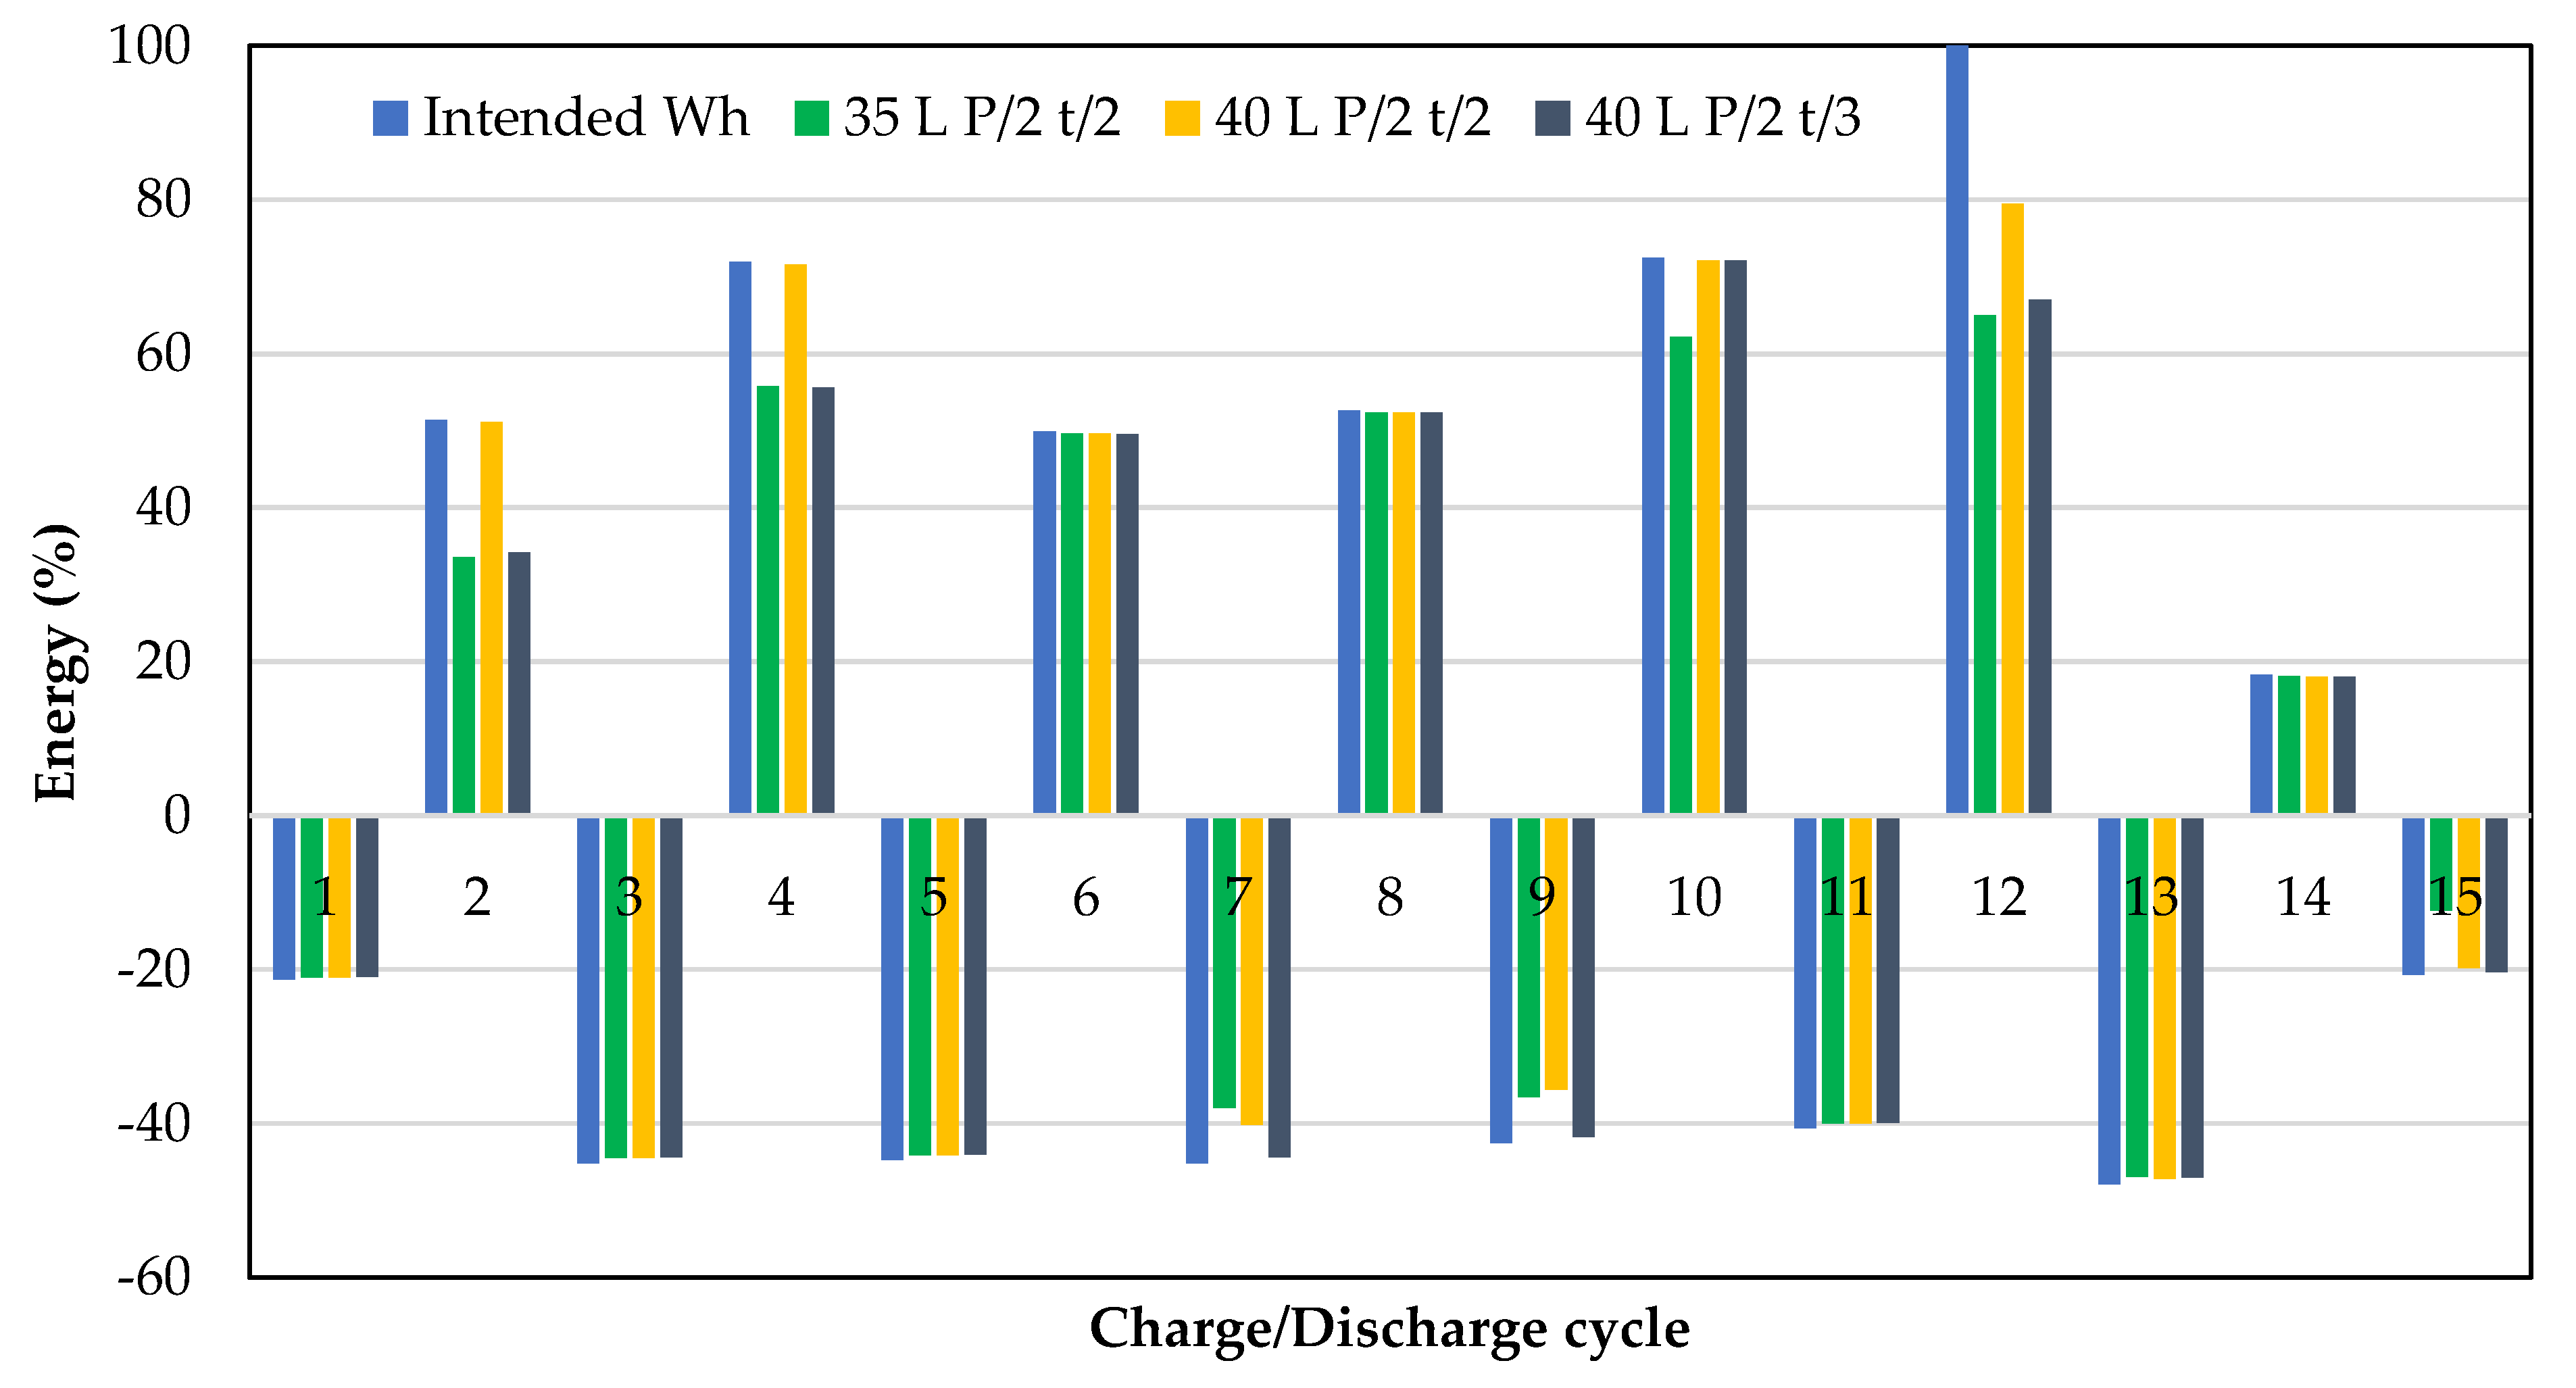
Figure 5 compares the energy traded (charged or discharged) in every charge/discharge cycle over the seven days for the three cases shown in Figure 4. In addition, given here is the intended amount of energy to be traded in each cycle. All the three cases (of 35 L with SP = ½ and ST = ½, 40 L SP = ½ and ST = ½ and 40 L with SP = ½ and ST = ⅓) have been non-dimensionalized by dividing the energy by the maximum energy traded in that seven-day period (this corresponds to the charging energy on the 6th day). It can be seen that the combination of (40 L, SP = ½ and ST = ⅓) is able to deliver discharge energy as intended over the entire period; however, there is considerable wastage of PV output. This is borne out by the SoC variation which is mostly in the range of 60 to 99% showing underutilization of the electrolyte. The intermediate case of (40 L, SP = ½ and ST = ½) is better at utilizing the PV output with occasional discharge failure while the case with (35 L, SP = ½ and ST = ½) may be said to be undersized with respect to energy storage capacity. Proper energy sizing of the energy system is necessary to optimally use its storage capacity.
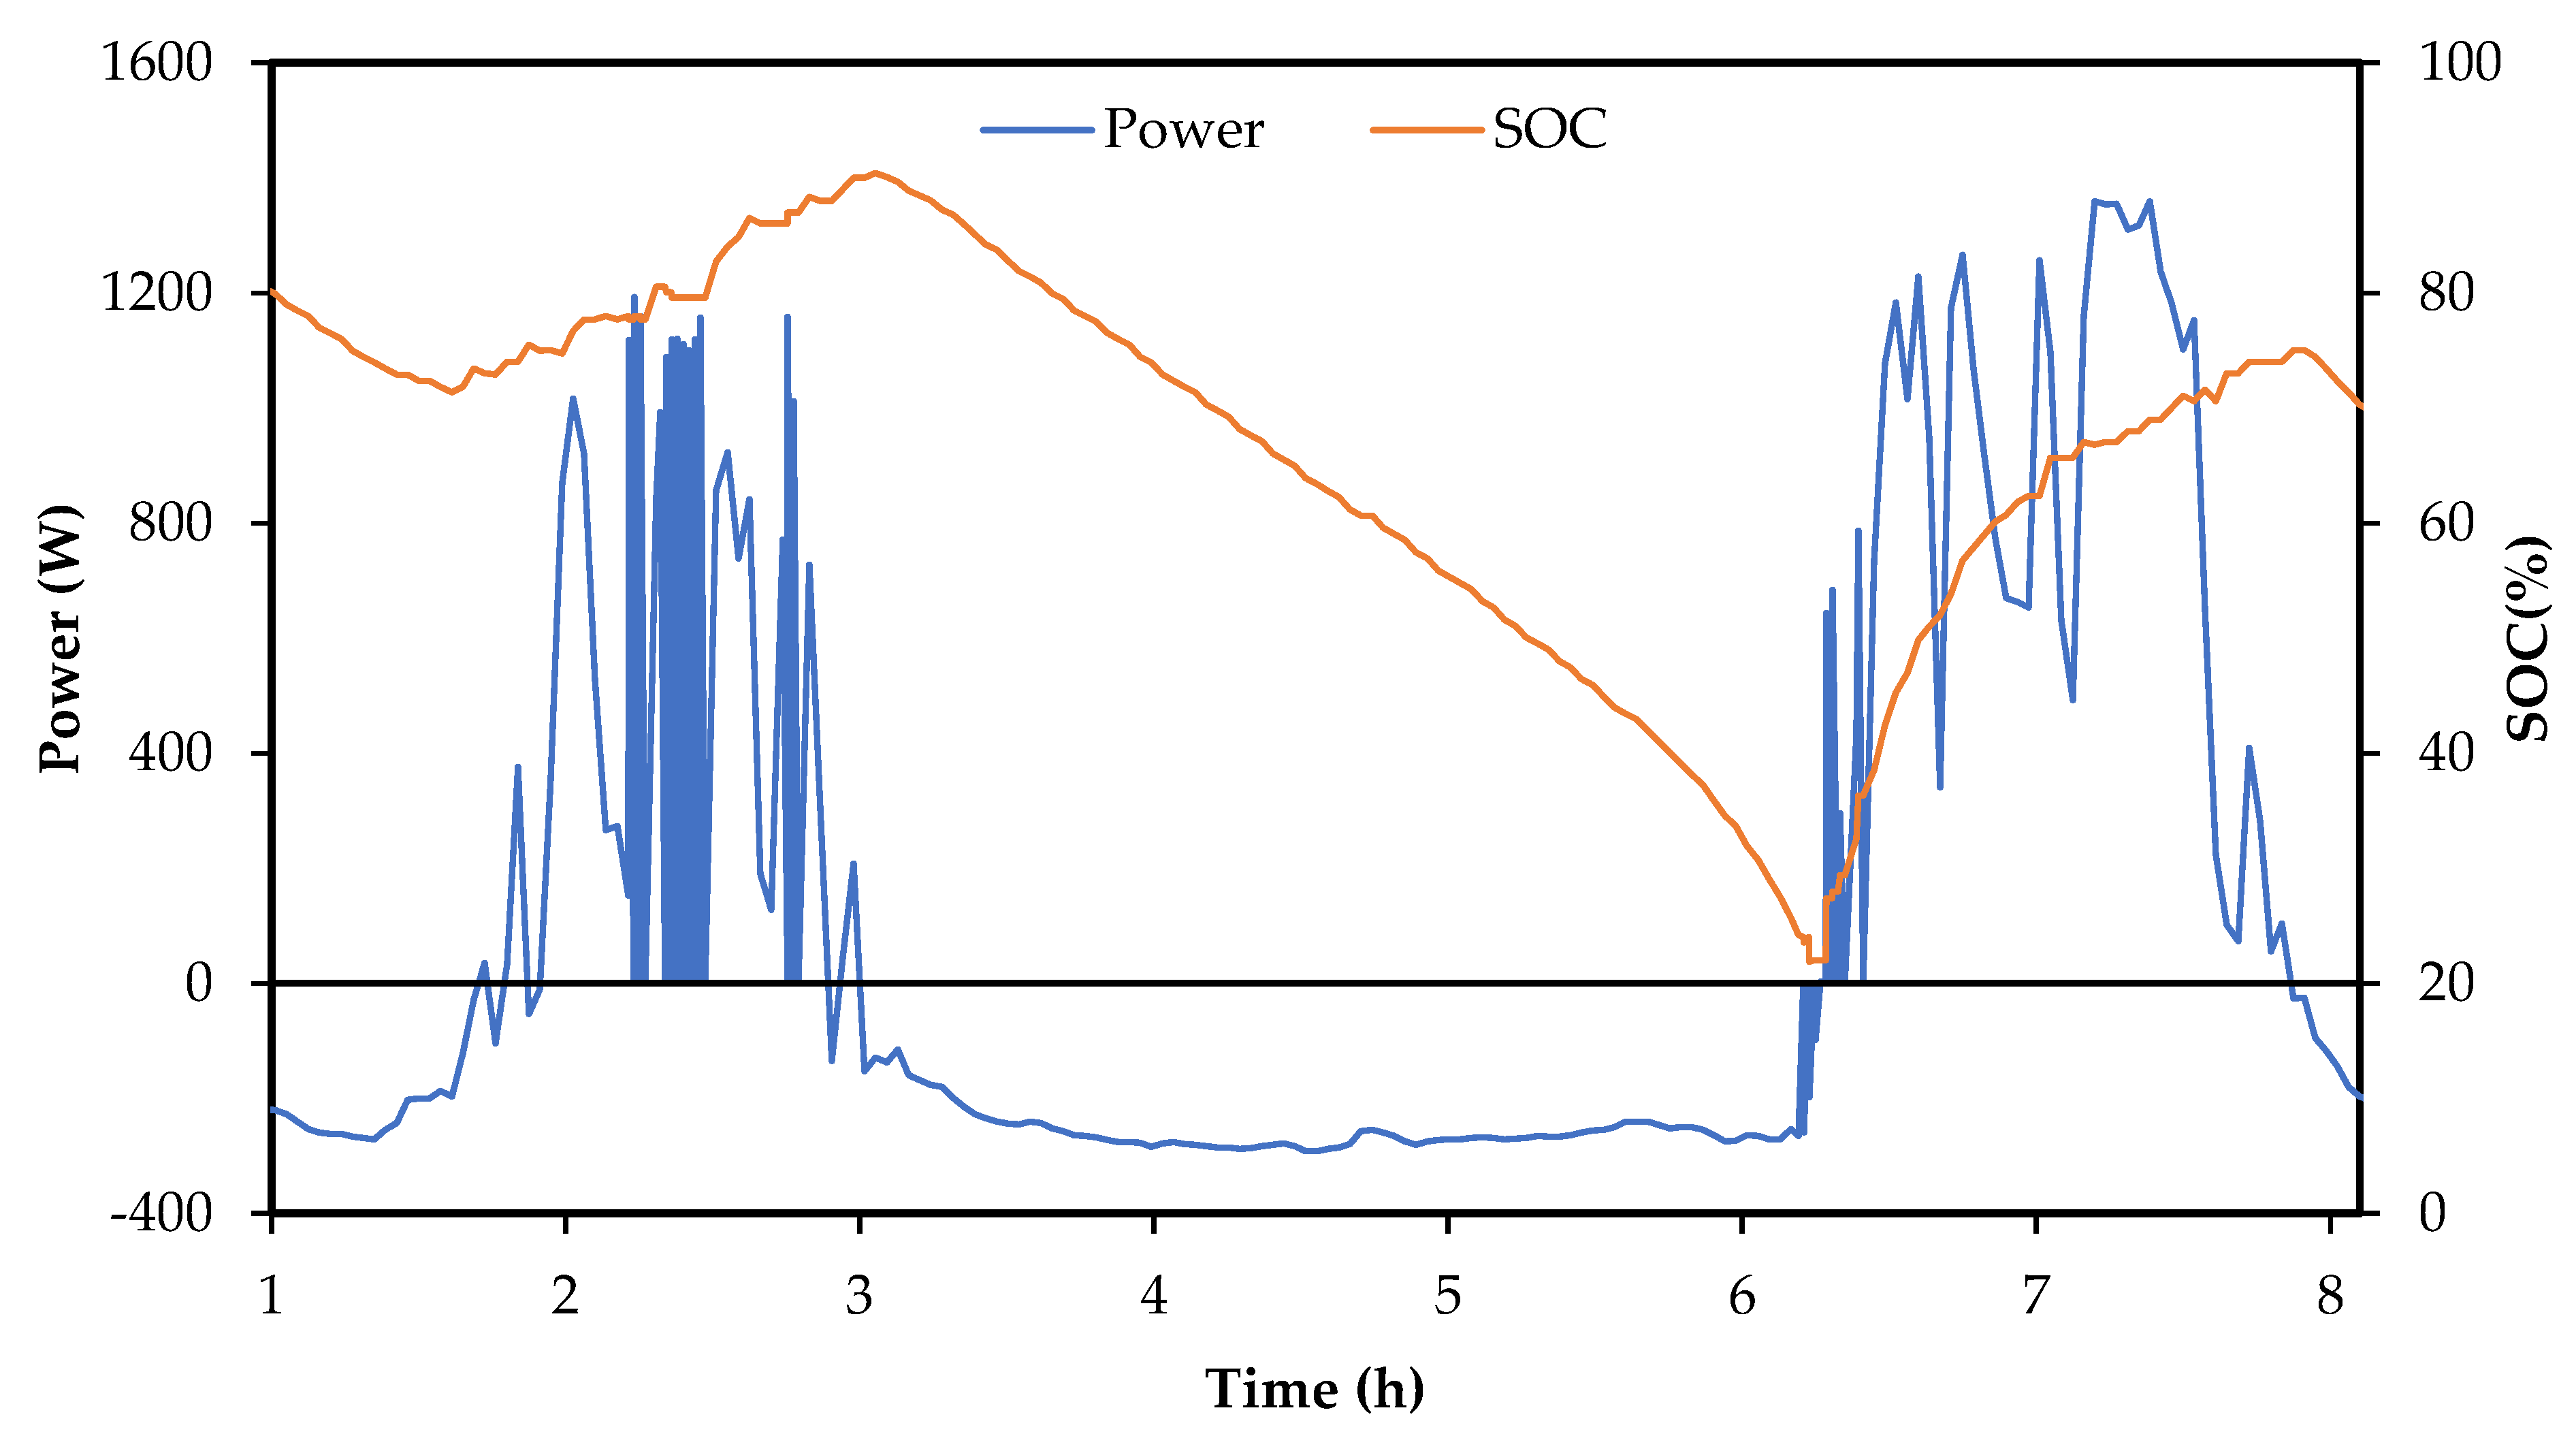
In order to bring out the effect of stack sizing, a further simulation has been carried with an electrolyte volume of 40 L but with SP = 1. In view of the limited energy storage capacity associated with 40 L electrolyte volume, the time scale factor is reduced such that ST = ⅕ leading to SE of ⅕ compared to that of ¼ for the baseline case. The reduced energy scaling is consistent with anticipated higher efficiency losses associated with higher powers of charge and discharge due to doubling of power compared to the baseline case. The response of the battery system for the first two days is summarized in Figure 6. One can see that high power charging leads to significantly higher overpotential so that charging failure occurs on the first day itself even for SoC < 80% and the SoC remains less than 90% at the end of first day’s charging. As a result, there is a hint of failure at the far end of the first full discharge. Due to high charging losses, the SoC does not even reach 80% at the end of 2nd day’s charging. This is in contrast to the corresponding case in Figure 4b where the SoC is well in excess of 90% at the corresponding stage. Coupled with this low SoC, higher discharge losses due to higher average discharge power leads to extensive failure in the next discharge cycle (not shown) which has a knock-on effect on subsequent charge and discharge cycles, each of which suffers from extended periods of battery failure to meet power demand. This case, which is representative of an undersized stack, thus illustrates the importance of power sizing of the integrated system. The battery should be able to tackle high charging powers; otherwise, subsequent discharge and charge cycles will suffer.
3.3. Charging and Discharging Efficiency
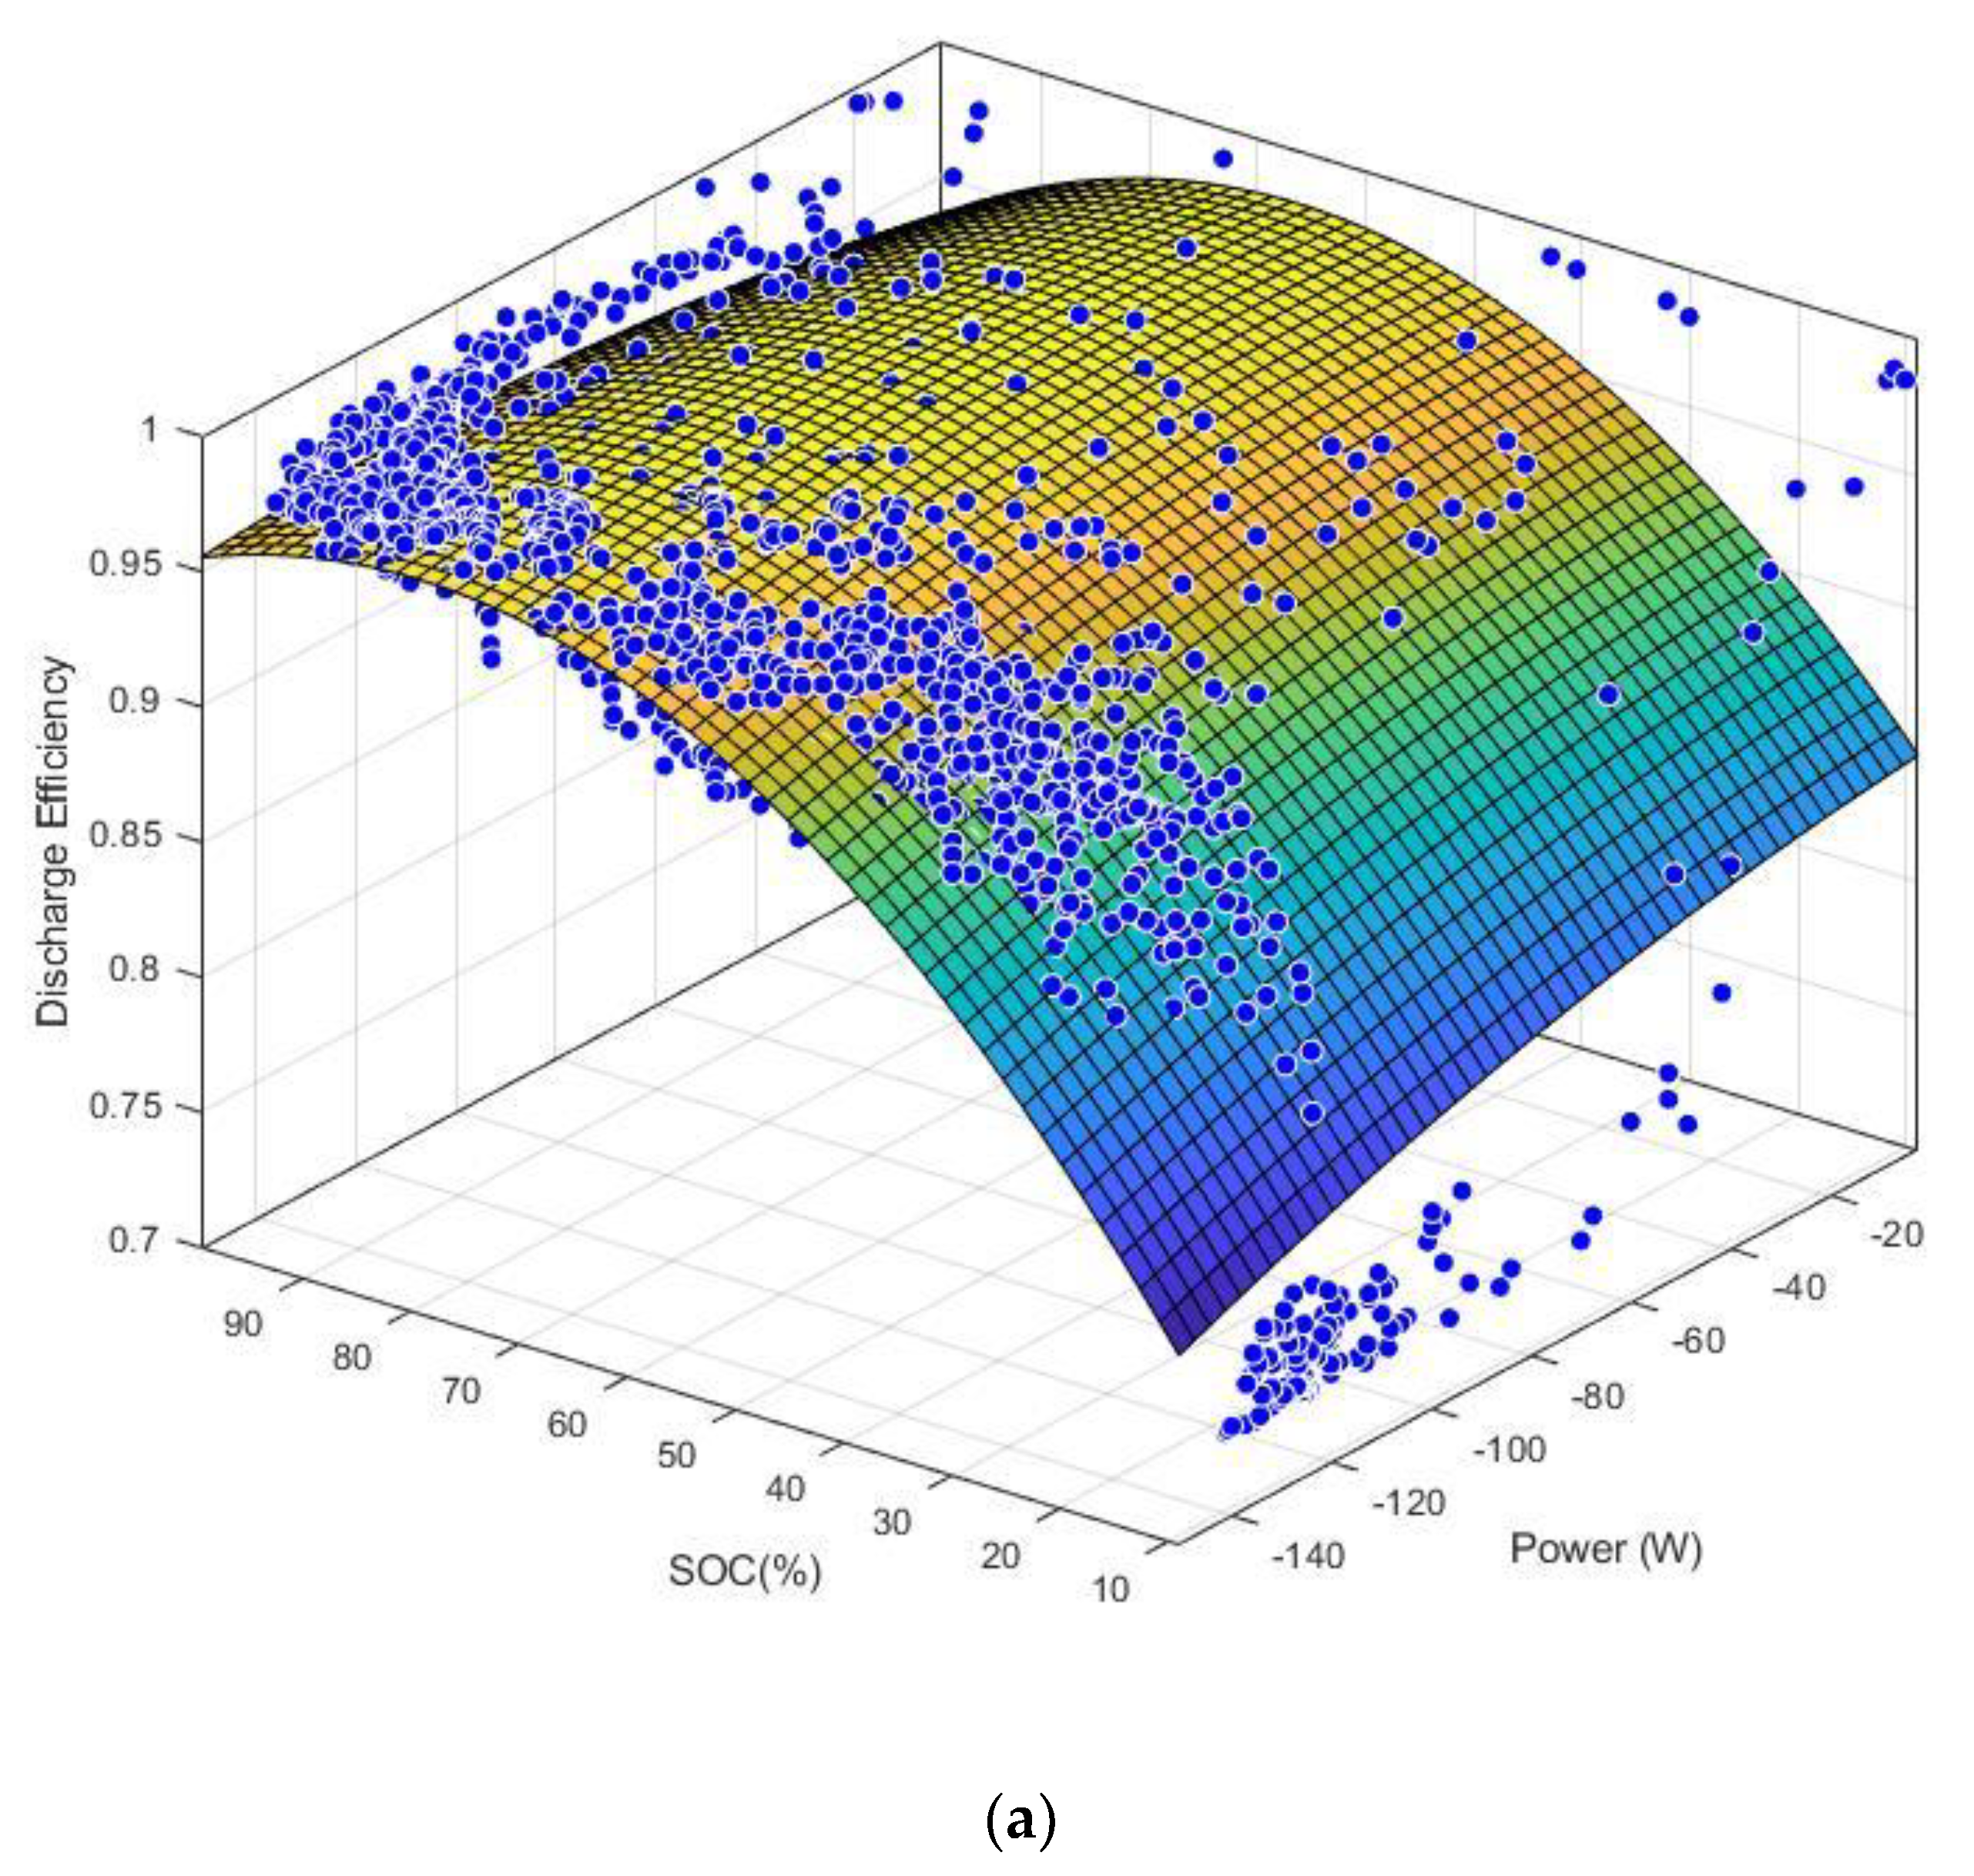
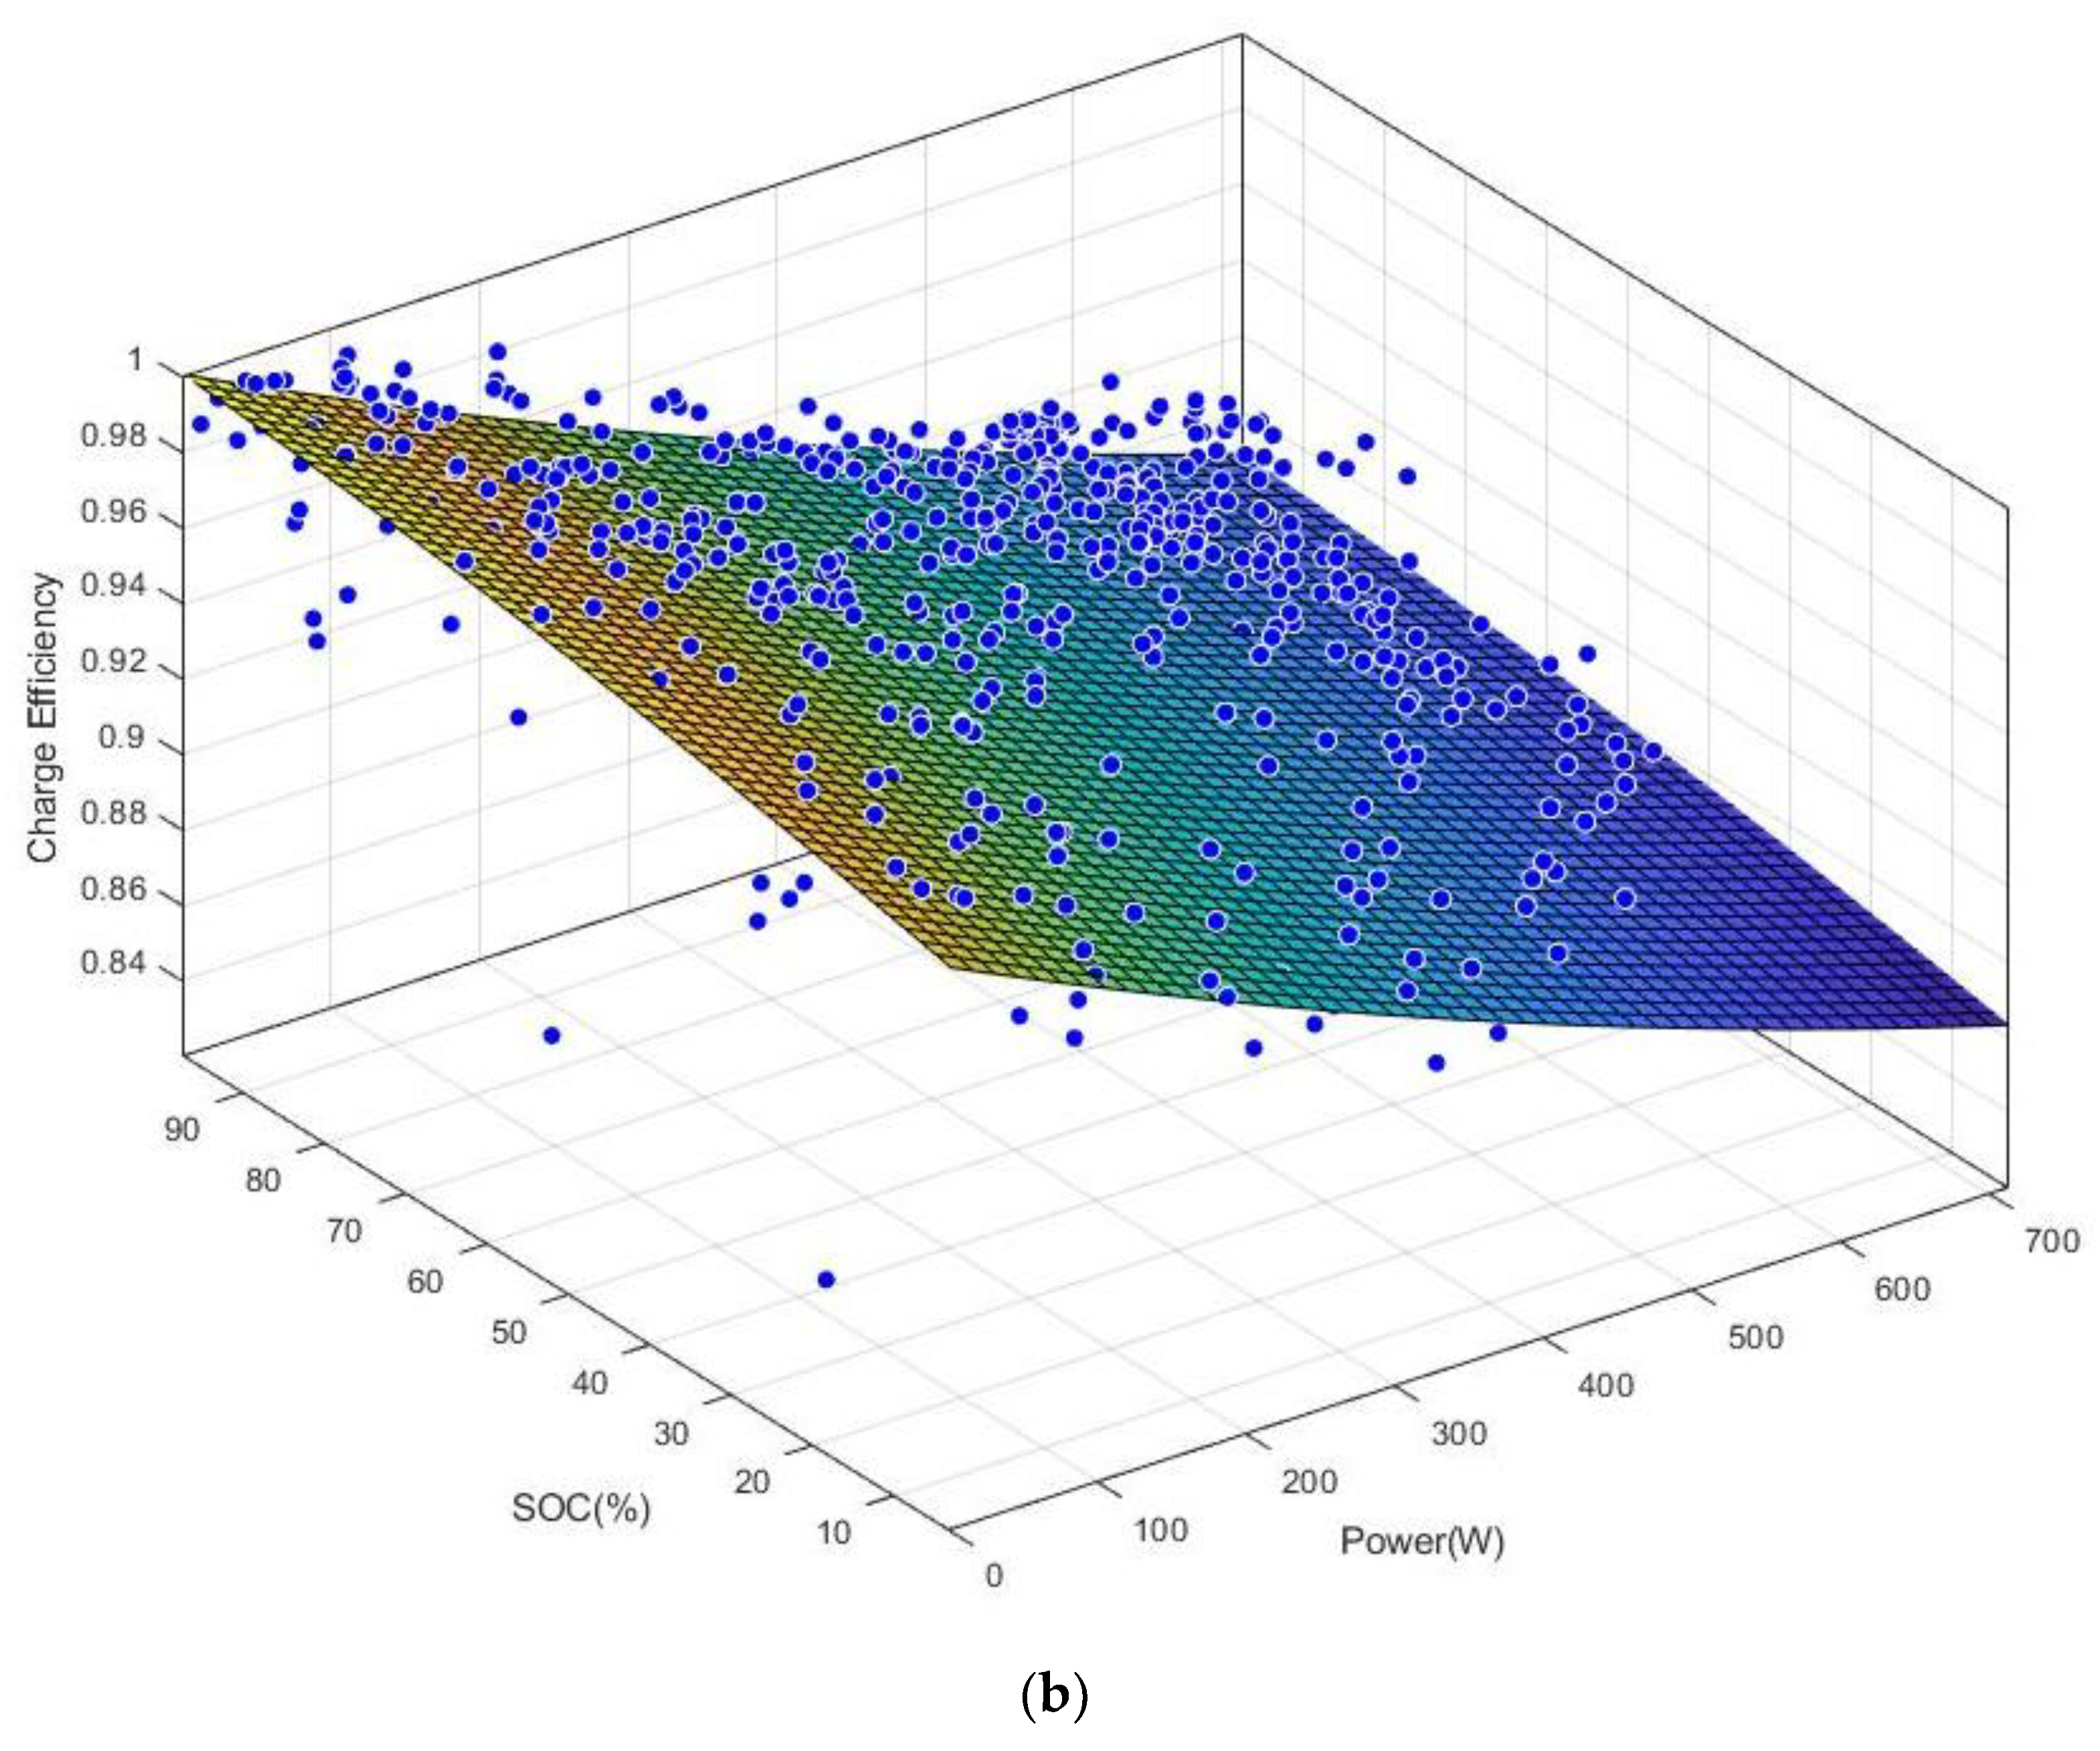
From measured OCV at the end of every power step, the average overpotential for every step could be determined. From this, the charging efficiency and discharging efficiency could be computed over the entire seven-day period for a given integrated system. For a given VRFB stack operating at a constant electrolyte circulation rate, both efficiencies depend primarily on the power at which charge or discharging takes places and the SoC of the electrolyte, both of which vary dynamically in a given situation. Figure 7 shows the data of charging and discharging efficiencies over the seven-day period wherein data from for all the three cases shown in Figure 4 are plotted together. One can see that the discharge efficiency is not strongly influenced by power (probably because the discharging power is low and varies in a rather narrow range) and remains relatively high (~0.95) for SoC > 30%. On the contrary, the charging efficiency is a strong function of power and almost varies linearly with charging power. Since charging power is about three times higher than the discharging power, the average charging efficiency is lower at about 0.9.
3.4. Lead Acid Battery Performance
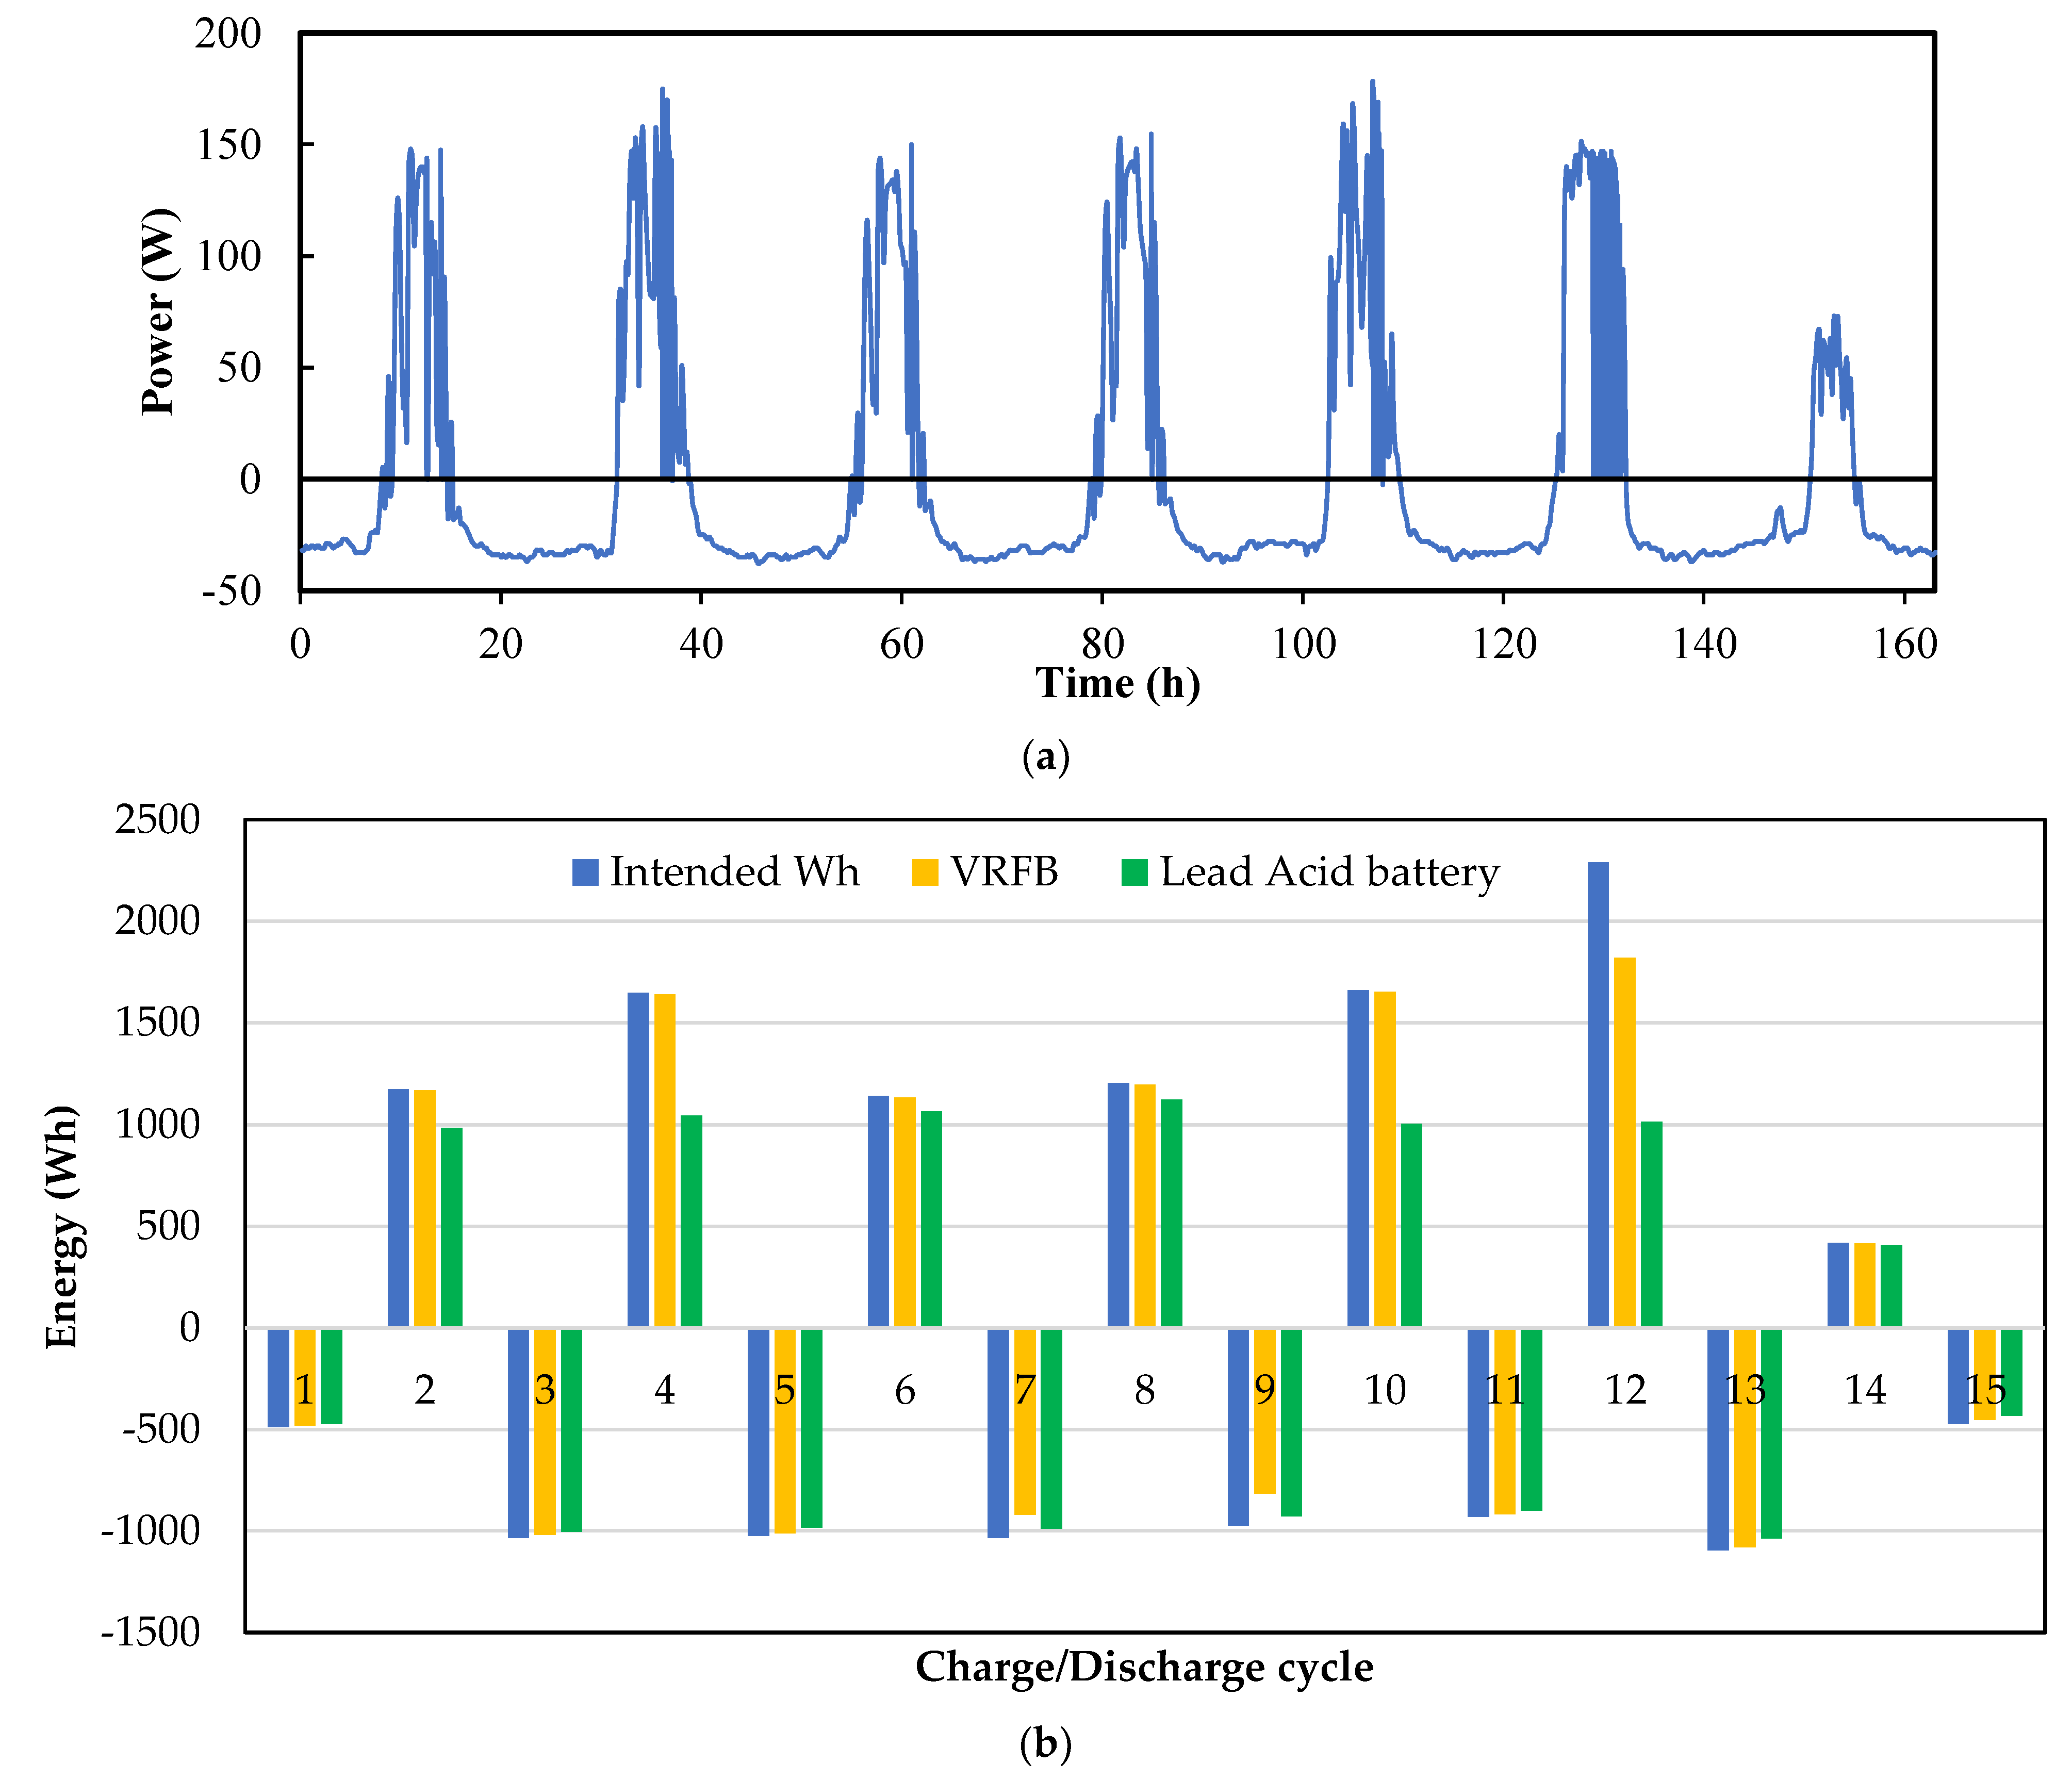
The same 7-day profile is operated using a lead-acid battery for understanding its performance to dynamically changing requirements. A new lead-acid battery of 150 Ah capacity at 12 V was used for these experiments. Since the commercial lead acid battery has a power rating of 180 W and energy rating of 1800 Wh, a power scaling factor, SP, of ⅛ and a time scale factor, SF, of 1 were used giving energy scaling factor, SE, of ⅛. Since ST = 1, each power step lasted 11 min; this was followed by a one-minute OCV measurement step. Figure 8 shows the battery response for the seven-day profile in terms of power step by power step response (Figure 8a) and in terms of normalized cumulative energy traded in each charge/discharge step (Figure 8b) where the data for the VRFB case of 40 L electrolyte volume, SP = ½ and ST = ½ are also given. One can see from Figure 8a that the lead-acid battery suffers charging failures on each of the first six days; however, due to its high energy storage capacity (and favorable power scaling), it shows no failures in discharge. Figure 8b shows that in comparison with VRFB, the energy charged in each cycle is significantly less in charging cycle. On the other hand, it outperforms the VRFB in discharge as it is able to meet the discharge demand in every cycle. However, it must be kept in mind that the lead acid battery case has an energy scaling factor of ⅛ whereas SE for the VRFB is ¼. Given that the rated energy storage capacity of the former is 1800 Wh compared to about 1000 Wh for the latter, the lead acid battery system is grossly underutilizing its energy storage capacity.
It may further be noted that the VRFB system worked well for about 50 consecutive charge + discharge cycles without noticeable degradation in performance whereas the new lead acid battery showed signs of rapid degradation. After three seven-day profile experiments were conducted with SP of ⅛, ⅙ and ¼, the battery was found to have retained a capacity of only 50 Ah. When the seven-day profile was repeated with SP of ⅛, the reduced capacity was found to have led to extensive failures in both charging and discharging. Although this cannot be considered as a well-controlled study of degradation behavior of the lead acid battery (which was procured off-the-shelf from a commercial store), the VRFB system does have the advantage of long life under repeated cycles which is necessary for solar PV applications.
4. Conclusions
A 1 kW-rated 8-cell stack of 900 cm2 cell active area vanadium redox flow battery has been investigated to serve as electrical energy storage system in a conceptually integrated PV-battery-residential load system intended to run as a stand-alone system. A series of seven-day profile runs of battery power have been made to simulate different energy storage and power delivery capacities. The following conclusions can be drawn from the study:
- Typical insolation and load profiles for an integrated solar PV-battery-residential load system have about a quarter of the PV output going directly to meet the load demand during sunshine hours. This means that nearly three-quarters of energy flow to the load occurs through the battery. Account must therefore be taken of charging and discharging energy efficiencies.
- The seven-day power profiles for the integrated system show the vast differences between charging and discharging conditions for the battery of such an integrated system. Average charging power is about three times that of average discharge power. Further, due to the different nature of variations of solar insolation and aggregated residential load, ratio of peak power in charging to that in discharging of the battery is 4.7. Thus, charging conditions are much more severe than discharging. The stack power rating should therefore be based on the charging condition during peak solar insolation. Too low stack power rating can lead to considerable charging failures which can subsequently translate into discharging failures.
- For residential load applications, the daily energy variation is not highly variable. The energy rating of the VRFB system, i.e., electrolyte volume, should be based on the maximum daily discharge load and the range of operable SoC.
- Due to the rather mild discharging conditions of the battery, favorable discharging efficiencies can be maintained in a properly-sized stack for SoC variations in the range of 20 to 90%. A stack operating over this range may be expected to have, given that it is designed for harsh charging conditions, net discharge efficiency of 90% or higher.
- The sizing of the PV plant should be based on both charging and discharging efficiencies of the battery. Given that the stack should be designed for peak charging power, and given that the peak-to-average charging power is nearly two, the stack charging efficiency is likely to between 85 to 90%. With discharge efficiency being in the range of 90 to 95%, a net round trip energy loss of about 80% may be expected.
- Considering the fact that about 75% energy flow occurs through the battery (with a round-trip efficiency of 80%) with the rest going through to load directly with a considerably higher efficiency, and making some allowance for failure to charge, the PV plant should be rated at about 25% more energy than the average daily energy demand from the load.
The present analysis does not include transmission and distribution losses and consideration of these may increase about 10% power and energy storage requirements. In summary, it can be concluded that the ability to design a VRFB with a high ratio of power-to-energy makes it particularly attractive for PV-load integration.
Author Contributions
P.P.: conceptualization, methodology, software, data curation, visualization, writing—original draft. R.G.: conceptualization, methodology, visualization, data curation. S.J.: conceptualization, data curation, validation, writing—review and editing, supervision, funding acquisition. All authors have read and agreed to the published version of the manuscript.
Funding
This research was funded by grants from MHRD (Grant reference no. F.NO.41-2/2015-T.S.-I (Pt.)) and DST-Solar Energy Harnessing Centre (Grant reference no. DST/TMD/SERI/HUB/1(C)), both from the Government of India.
Institutional Review Board Statement
Not applicable.
Informed Consent Statement
Not applicable.
Data Availability Statement
Not applicable.
Acknowledgments
Financial supports from the Ministry of Human Resource Department and Department of Science and Technology, both from the Government of India, are gratefully acknowledged. The authors also acknowledge the load data made available by eMARC, Prayas Energy group for case studies and analysis performed in the present work.
Conflicts of Interest
The authors declare no conflict of interest.
References
- Global Renewables Outlook: Energy Transformation 2050, International Renewable Energy Agency. 2020. Available online: https://www.irena.org/publications/2020/Apr/Global-Renewables-Outlook-2020 (accessed on 20 June 2020).
- Duffie, A.J.; Beckman, A.W. Solar Engineering of Thermal Processes; John Wiley & Sons: Hoboken, NJ, USA, 2013. [Google Scholar]
- Gur, T.M. Review of electrical energy storage technologies, materials and systems: Challenges and prospects for large scale grid storage. Energy Environ. Sci. 2018, 11, 2696–2967. [Google Scholar] [CrossRef]
- Sufyan, M.; Rahim, N.A.; Aman, M.M.; Tan, C.K.; Raihan, S.R.S. Sizing and applications of battery energy storage technologies in smart grid system: A review. J. Renew. Sustain. Energy 2019, 11, 014105. [Google Scholar] [CrossRef]
- Liu, J.; Chen, X.; Cao, S.; Yang, H. Overview on hybrid solar photovoltaic-electrical energy storage technologies for power supply to buildings. Energy Convers. Manag. 2019, 187, 103–121. [Google Scholar] [CrossRef]
- Huggins, R.A. Energy Storage: Fundamentals, Materials and Applications; Springer: Berlin/Heidelberg, Germany, 2016. [Google Scholar]
- Whitehead, A.H.; Rabbow, T.J.; Trampert, M.; Pokorny, P. Critical safety features of vanadium redox flow battery. J. Power Sources 2017, 351, 1–7. [Google Scholar] [CrossRef]
- Angenendt, G.; Zurmühlen, S.; Axelsen, H.; Sauer, D.U. Comparison of different operation strategies for PV battery home storage systems including forecast-based operation strategies. Appl. Energy 2018, 229, 884–899. [Google Scholar] [CrossRef]
- Litjens, G.B.M.A.; Worrell, E.; van Sark, W.G.J.H.M. Assessment of forecasting methods on performance of photovoltaic-battery systems. Appl. Energy 2018, 221, 358–373. [Google Scholar] [CrossRef]
- Jing, W.; Lai, C.H.; Wong, W.S.; Wong, M.D. A comprehensive study of battery-supercapacitor hybrid energy storage system of standalone PV power system in rural electrification. Appl. Energy 2018, 224, 340–356. [Google Scholar] [CrossRef]
- Gharavi, H.; Ardehali, M.; Ghanbari-Tichi, S. Imperial competitive algorithm optimization of fuzzy multi-objective design of a hybrid green power system with considerations for economics, reliability, and environmental emissions. Renew. Energy 2015, 78, 427–437. [Google Scholar] [CrossRef]
- Hadidian-Moghaddam, M.J.; Arabi-Nowdeh, S.; Bigdeli, M. Optimal sizing of a stand-alone hybrid photovoltaic/wind system using new grey wolf optimizer considering reliability. J. Renew. Sustain. Energy 2016, 8, 035903. [Google Scholar] [CrossRef]
- Hakimi, S.M.; Moghaddas-Tafreshi, S.M. Optimal sizing of a stand-alone hybrid power system via particle swarm optimization for Kahnouj area in south-east of Iran. Renew. Energy 2009, 34, 1855–1862. [Google Scholar] [CrossRef]
- Ekren, O.; Ekren, B.Y. Size optimization of a PV/wind hybrid energy conversion system with battery storage using simulated annealing. Appl. Energy 2010, 87, 592–598. [Google Scholar] [CrossRef]
- Askarzadeh, A. A discrete chaotic harmony search-based simulated annealing algorithm for optimum design of PV/wind hybrid system. Sol. Energy 2013, 97, 93–101. [Google Scholar] [CrossRef]
- Moghaddam, M.J.H.; Kalam, A.; Nowdeh, S.A.; Ahmadi, A.; Babanezhad, M.; Saha, S. Optimal sizing and energy management of stand-alone hybrid photovoltaic/ wind system based on hydrogen storage considering LOEE and LOLE reliability indices using flower pollination algorithm. Renew. Energy 2019, 135, 1412–1434. [Google Scholar] [CrossRef]
- Fetanat, A.; Khorasaninejad, E. Size optimization for hybrid photovoltaic–wind energy system using ant colony optimization for continuous domains based integer programming. Appl. Soft Comput. 2015, 31, 196–209. [Google Scholar] [CrossRef]
- Ajlan, A.; Tan, C.W.; Abdilahi, A.M. Assessment of environmental and economic perspectives for renewable-based hybrid power system in Yemen. Renew. Sustain. Energy Rev. 2017, 75, 559–570. [Google Scholar] [CrossRef]
- Lu, P.; Leung, P.; Su, H.; Yang, W.; Xu, Q. Materials, performance, and systems design for integrated solar flow batteries—A mini review. Appl. Energy 2021, 282, 116210. [Google Scholar] [CrossRef]
- Minke, C.; Turek, T. Materials, System designs and modelling approaches in techno-economic assessment of all-vanadium redox flow batteries—A review. J. Power Sources 2018, 376, 66–81. [Google Scholar] [CrossRef]
- Akter, P.; Li, Y.; Bao, J.; Skyllas-Kazacos, M.; Rahman, M.F. Optimal Charging of Vanadium Redox Flow Battery with Time-Varying Input Power. Batteries 2019, 5, 20. [Google Scholar] [CrossRef] [Green Version]
- Gundlapalli, R.; Jayanti, S. Comparative Study of Kilowatt-Scale Vanadium Redox Flow Battery Stacks Designed with Serpentine Flow Fields and Split Manifolds. Batteries 2021, 7, 30. [Google Scholar] [CrossRef]
- García-Quismondo, E.; Almonacid, I.; Martinez, M.A.C.; Miroslavov, V.; Serrano, E.; Palma, J.; Salmerón, J.P.A. Operational Experience of 5 kW/5 kWh All-Vanadium Flow Batteries in Photovoltaic Grid Applications. Batteries 2019, 5, 52. [Google Scholar] [CrossRef] [Green Version]
- Mongird, K.; Viswanathan, V.; Alam, J.; Vartanian, C.; Sprenkle, V.; Baxter, R. 2020 Grid Energy Storage Technology Cost and Performance Assessment; Technical Report No. DOE/PA-0204; US Department of Energy: Washington, DC, USA, 2020.
- Zhang, Y.; Liu, L.; Xi, J.; Wu, Z.; Qiu, X. The benefits and limitations of electrolyte mixing in vanadium flow batteries. Appl. Energy 2017, 204, 373–381. [Google Scholar] [CrossRef]
- Wang, K.; Liu, L.; Xi, J.; Wu, Z.; Qiu, X. Reduction of capacity decay in vanadium flow batteries by an electrolyte-reflow method. J. Power Sources 2017, 338, 17–25. [Google Scholar] [CrossRef]
- Sun, C.; Negro, E.; Nale, A.; Pagot, G.; Vezzù, K.; Zawodzinski, T.A.; Meda, L.; Gambaro, C.; Di Noto, V. An efficient barrier toward vanadium crossover in redox flow batteries: The bilayer [Nafion/(WO3)x] hybrid inorganic-organic membrane. Electrochim. Acta 2021, 378, 138133. [Google Scholar] [CrossRef]
- Bhattacharjee, A.; Saha, H. Design and experimental validation of a generalized electrical equivalent model of Vanadium redox flow battery for interfacing with renewable energy sources. J. Energy Storage 2017, 13, 220–232. [Google Scholar] [CrossRef]
- Zhang, X.; Li, Y.; Skyllas-Kazacos, M.; Bao, J. Optimal Sizing of Vanadium Redox Flow Battery Systems for Residential Applications Based on Battery Electrochemical Characteristics. Energies 2016, 9, 857. [Google Scholar] [CrossRef] [Green Version]
- Sarkar, T.; Bhattacharjee, A.; Samanta, H.; Bhattacharya, K.; Saha, H. Optimal design and implementation of solar PV-wind-biogas-VRFB storage integrated smart hybrid microgrid for ensuring zero loss of power supply probability. Energy Convers. Manag. 2019, 191, 102–118. [Google Scholar] [CrossRef]
- Behi, B.; Baniasadi, A.; Arefi, A.; Gorjy, A.; Jennings, P.; Pivrikas, A. Cost-benefits analysis of a virtual power plant including solar PV, flow battery, heat pump, and demand management: A western Australia case study. Energies 2020, 13, 2614. [Google Scholar] [CrossRef]
- Solar Park 2000 MW Capacity in the State of Karnataka, Detailed Project Report. 2015. Available online: https://cdkn.org/wp-content/uploads/2017/07/Up-Karnataka-Solar-park-DPR-1.pdf (accessed on 10 November 2019).
- Ali, S. The Future of Indian Electricity Demand: How Much, by Whom, and under What Conditions, Brooking India. 2018. Available online: https://www.brookings.edu/wp-content/uploads/2018/10/The-future-of-Indian-electricity-demand.pdf (accessed on 20 December 2019).
- Available online: http://emarc.watchyourpower.org/energycurve.php (accessed on 20 December 2019).
- Chunekar, A.; Sreenivas, A. Towards an understanding of residential electricity consumption in India. Build. Res. Inf. 2018, 47, 75–90. [Google Scholar] [CrossRef]
- Walker, A.; Kwon, S. Analysis on impact of shared energy storage in residential community: Individual versus shared energy storage. Appl. Energy 2020, 282, 116172. [Google Scholar] [CrossRef]
- Gundlapalli, R.; Jayanti, S. Effective splitting of serpentine flow field for applications in large-scale flow batteries. J. Power Sources 2021, 487, 229409. [Google Scholar] [CrossRef]
- Jayanti, S.; Gundlapalli, R.; Chetty, R.; Jeevandoss, C.R.; Ramanujam, K.; Monder, D.S.; Rengaswamy, R.; Suresh, P.V.; Swarup, K.S.; Varadaraju, U.V.; et al. Characteristics of an Indigenously Developed 1 KW Vanadium Redox Flow Battery Stack. In Proceedings of the 7th International Conference on Advances in Energy Research, Mumbai, India, 10–12 December 2019; Springer: Singapore, 2021. [Google Scholar]
- Gundlapalli, R.; Kumar, S.; Jayanti, S. Stack Design Considerations for Vanadium Redox Flow Battery. INAE Lett. 2018, 3, 149–157. [Google Scholar] [CrossRef]
- Gundlapalli, R.; Jayanti, S. Effect of electrode compression and operating parameters on the performance of large vanadium redox flow battery cells. J. Power Sources 2019, 427, 231–242. [Google Scholar] [CrossRef]
Figure 1.
(a) Schematic diagram of the solar PV-flow battery-residential load integrated system. (b) Modelled system for the experimental study.
Figure 1.
(a) Schematic diagram of the solar PV-flow battery-residential load integrated system. (b) Modelled system for the experimental study.

Figure 2.
Seven day profile of June 2019 (a). Solar PV variation and load demand (b). Expected battery charge and discharge cycle.
Figure 2.
Seven day profile of June 2019 (a). Solar PV variation and load demand (b). Expected battery charge and discharge cycle.

Figure 3.
VRFB performance for SP = ½ and ST = ½ showing with 30 L electrolyte: (a) Complete 7-day profile with SoC variation. (b) Discharge failure in 1st discharge cycle. (c) Charge failure in 7th day charge. (d) Schematic diagram of battery with failure to deliver power and without failure.
Figure 3.
VRFB performance for SP = ½ and ST = ½ showing with 30 L electrolyte: (a) Complete 7-day profile with SoC variation. (b) Discharge failure in 1st discharge cycle. (c) Charge failure in 7th day charge. (d) Schematic diagram of battery with failure to deliver power and without failure.


Figure 4.
Battery performance with SoC variation for SP = ½ and ST = ½ for (a) 35 L electrolyte (b) 40 L electrolyte and (c) with 40 L electrolyte with SOC variation for SP = ½ and ST = ⅓.
Figure 4.
Battery performance with SoC variation for SP = ½ and ST = ½ for (a) 35 L electrolyte (b) 40 L electrolyte and (c) with 40 L electrolyte with SOC variation for SP = ½ and ST = ⅓.


Figure 5.
Comparative plot showing traded energy (%) in each charge/discharge cycle over a seven-day period for a VRFB with (electrolyte volume, SP and ST) combinations of (35 L, ½, ½), (40 L, ½, ½) and (40 L, ½, ⅓).
Figure 5.
Comparative plot showing traded energy (%) in each charge/discharge cycle over a seven-day period for a VRFB with (electrolyte volume, SP and ST) combinations of (35 L, ½, ½), (40 L, ½, ½) and (40 L, ½, ⅓).

Figure 6.
Battery performance with 40 L electrolyte with SoC variation for SP = 1 and ST = ⅕.

Figure 7.
Efficiency variation with SoC and operating power of VRFB for (a) discharging and (b) charging for the three runs shown in Figure 4.
Figure 7.
Efficiency variation with SoC and operating power of VRFB for (a) discharging and (b) charging for the three runs shown in Figure 4.


Figure 8.
(a) Lead acid battery performance for SP = ⅛ and ST = 1. (b) Energy comparison for VRFB with 40 L with SP = ½ and ST = ½ with 2 lead acid battery performance.
Figure 8.
(a) Lead acid battery performance for SP = ⅛ and ST = 1. (b) Energy comparison for VRFB with 40 L with SP = ½ and ST = ½ with 2 lead acid battery performance.


Table 1.
Summary of June 2019 profile (no scale down, SE = 1).
| PV | Load | Battery | |
|---|---|---|---|
| Power (W) | Power (W) | Charge Power (W) | Discharge Power (W) |
| Max–1670 | Max–303 | Max–1432 | Max–303 |
| Min–0 | Min–156 | Min–2.9 | Min–5.9 |
| Avg–640 | Avg–238 | Avg–769 | Avg–238 |
| Energy per day (Wh) | Energy per day (Wh) | Charge energy per day (Wh) | Discharge energy per day (Wh) |
| Max–11,110 | Max–5944 | Max–9240 | Max–4316 |
| Min–2600 | Min–3716 | Min–1720 | Min–1840 |
| Avg–7144 | Avg–5713 | Avg–5450 | Avg–4029 |
| Solar insolation to load (%) | 23.4 | Solar insolation to battery (%) | 76.6% |
Table 2.
Daily energy variations for PV, load and battery in Wh with an energy scaling factor, SE, of ¼ (C-charge, DC-discharge).
Table 2.
Daily energy variations for PV, load and battery in Wh with an energy scaling factor, SE, of ¼ (C-charge, DC-discharge).
| Cycle | PV | Load | Battery |
|---|---|---|---|
| 1 half DC | 47 | 697 | 653 |
| 1 C | 650 | 232 | −419 |
| 2 DC | 51 | 1004 | 957 |
| 2 C | 1545 | 373 | −1173 |
| 3 DC | 35 | 1065 | 1035 |
| 3 C | 2066 | 421 | −1648 |
| 4 DC | 70 | 1090 | 1025 |
| 4 C | 1494 | 354 | −1142 |
| 5 DC | 66 | 1095 | 1034 |
| 5 C | 1521 | 317 | −1205 |
| 6 DC | 36 | 1005 | 973 |
| 6 C | 2082 | 425 | −1660 |
| 7 DC | 52 | 979 | 931 |
| 7 C | 2775 | 486 | −2291 |
| 8 half DC | 13 | 454 | 443 |
Table 3.
VRFB energy during charge/discharge cycle 30 L for SP = ½, ST = ½.
| Cycles | Intended Wh | Experimental Wh | Energy Based % Failure | Time Based % Failure |
|---|---|---|---|---|
| 0th Discharge | 653 | 643 | 2 | 0 |
| 1st Charge | 419 | 415 | 1 | 0 |
| 1st Discharge | 957 | 677 | 29 | 28 |
| 2nd Charge | 1173 | 1172 | 0 | 0 |
| 2nd Discharge | 1035 | 850 | 18 | 16 |
| 3rd Charge | 1648 | 1606 | 3 | 1 |
| 3rd Discharge | 1025 | 1011 | 1 | 0 |
| 4th Charge | 1142 | 1136 | 1 | 0 |
| 4th Discharge | 1034 | 977 | 5 | 5 |
| 5th Charge | 1205 | 1199 | 0 | 0 |
| 5th Discharge | 973 | 877 | 10 | 8 |
| 6th Charge | 1660 | 1550 | 7 | 4 |
| 6th Discharge | 931 | 912 | 2 | 0 |
| 7th Charge | 2291 | 1288 | 44 | 40 |
| 7th Discharge | 443 | 437 | 1 | 0 |
Publisher’s Note: MDPI stays neutral with regard to jurisdictional claims in published maps and institutional affiliations. |
© 2021 by the authors. Licensee MDPI, Basel, Switzerland. This article is an open access article distributed under the terms and conditions of the Creative Commons Attribution (CC BY) license (https://creativecommons.org/licenses/by/4.0/).
Share and Cite
MDPI and ACS Style
Parmeshwarappa, P.; Gundlapalli, R.; Jayanti, S. Power and Energy Rating Considerations in Integration of Flow Battery with Solar PV and Residential Load. Batteries 2021, 7, 62. https://0-doi-org.brum.beds.ac.uk/10.3390/batteries7030062
AMA Style
Parmeshwarappa P, Gundlapalli R, Jayanti S. Power and Energy Rating Considerations in Integration of Flow Battery with Solar PV and Residential Load. Batteries. 2021; 7(3):62. https://0-doi-org.brum.beds.ac.uk/10.3390/batteries7030062
Chicago/Turabian StyleParmeshwarappa, Purnima, Ravendra Gundlapalli, and Sreenivas Jayanti. 2021. "Power and Energy Rating Considerations in Integration of Flow Battery with Solar PV and Residential Load" Batteries 7, no. 3: 62. https://0-doi-org.brum.beds.ac.uk/10.3390/batteries7030062
Note that from the first issue of 2016, this journal uses article numbers instead of page numbers. See further details here.