
Simulation of the Electrochemical Response of Cobalt Hydroxide Electrodes for Energy Storage


1
Centro de Química Estrutural, Institute of Molecular Sciences, Departamento de Engenharia Química, Instituto Superior Técnico, Universidade de Lisboa, Av. Rovisco Pais, 1049001 Lisboa, Portugal
2
C2CnewCap, Av. José Francisco Guerreiro, Paiã Park, Armazém A2.12, 1675078 Odivelas, Portugal
3
Departamento de Engenharia Mecânica, GI-MOSM, ISEL/Instituto Politécnico de Lisboa, 1950062 Lisboa, Portugal
*
Author to whom correspondence should be addressed.
Batteries 2022, 8(4), 37; https://0-doi-org.brum.beds.ac.uk/10.3390/batteries8040037
Submission received: 28 February 2022
/
Revised: 8 April 2022
/
Accepted: 13 April 2022
/
Published: 18 April 2022
(This article belongs to the Topic Electrolyte Design and Interface Engineering toward Safer Energy Storage)
Abstract
:Cyclic Voltammetry is an analysis method for characterizing the behaviors of electrochemically active materials by measuring current through defined potential sweeps. The current–potential relationship depends on key variables such concentration of electrolyte, electron-transfer rate, and the distance and time of species in relation to the electroactive surface of the material. A MATLAB® simulation was developed on a diffusion and kinetics basis, simulating the equations of Fick’s second law and Butler–Volmer, respectively, towards understanding the energy-storage mechanisms of cobalt hydroxide electrodes. The simulation was compared to a real cobalt hydroxide system, showing an accurate approximation to the experimentally obtained response and deviations possibly related to other physical/chemical processes influencing the involved species.
1. Introduction
Energy demand is pressing the world towards sustainable and efficient energy-supply systems, which steadily face greener and more renewable alternatives rather than the conventional fossil counterparts. With the exciting potential and increasing domination of renewable energy sources, the management of the produced energy becomes a greater challenge due to their intermittent nature that limits the scope of their use. This challenge can only be addressed with highly efficient storage systems that prevent needless wastes of energy while opening the door to a wider array of future applications.
By 2018, behind-the-meter storage deployment had doubled compared to the latter year, considerably overtaking the grid-scale applications. Energy consumers are increasingly investing in systems deployed closer to them and with a higher control. Increasing proximity and access to storage technologies allows for the better management of energy at a much faster rate than the rate at which the grid-scale deployment is evolving [1]. The International Energy Agency (IEA) reports that the growing worldwide capacity reflects in the ongoing increase in investment in renewable energy sources, with an accompanying decrease in costs of operation and deployment, creating room for the further expansion of storage technologies [2].
In the overall panorama of the most well-known modern energy-storage systems, namely for high-power needs, this work addresses the working principles of pseudocapacitors, namely their theoretical models and governing mechanisms via computational simulation (with MATLAB® software). The main goal is to predict and model the electrochemical response of cobalt hydroxide electrodes via cyclic voltammetry. Cobalt hydroxide was chosen for this study as it is an interesting electrode material, known by its pseudocapacitive properties, that has been widely used in energy-storage devices such as supercapacitors and batteries [3,4,5].
Neither batteries nor capacitors can provide simultaneously large yields of energy and fast rates of charge and discharge. Conventional batteries can reach energy densities above 100 Wh/kg, greatly surpassing conventional capacitors, but display a much lower power density. Therefore, these two classes of devices are used in complementary applications where either energy or power densities are of utmost importance, with batteries typically being used to store high quantities of energy while capacitors fill the needs in terms of power requirements. Nevertheless, a gap is left in the array of electrochemical applications as the two referenced extremes dominate the electrochemical energy-storage field. This gap opens several investigation opportunities to create solutions between batteries and conventional capacitors. This has raised the interest in different devices’ assemblies, which can potentially translate into more versatile systems with increased energy density, while providing good power capacity such as asymmetric supercapacitors.
Conventional supercapacitors store energy electrostatically through the reversible adsorption/desorption of electrolyte ions at the electrode’s surface. These differ from conventional capacitors due to the local polarization of the electrolyte’s ions and the consequent formation of double-layer planes [6,7]. The double layer is a complex molecular phenomenon that several different models have attempted to describe by understanding the behavior of the electrolyte’s components and their realistic interactions with the electrode’s surface. These models follow the theories concerning the double-layer, namely Helmholtz, Gouy–Chapman, and Gouy–Chapman–Stern models, and attempt to answer the present flaws and deviations from reality by formulating new assumptions and considerations regarding the properties of the electrolyte’s components [8,9].
Pseudocapacitors are faradaic devices that store energy via highly reversible and fast redox reactions that contribute to a higher energy density without greatly compromising fast charge/discharge rates. It is important to make the appropriate distinction between faradaic and non-faradaic processes. These two concepts derive from the validity of Faraday’s laws of electrolysis in the interface between an electrode and an adjacent electrolyte phase, labeling the behavior and movement of charge and chemical components involved in the energy-storage process. Faraday’s laws state that the composition of a material in the electrode–electrolyte interface is directly proportional to the amount of electricity passed. Despite the simple mathematical definition, labeling a process as faradaic may not be as straightforward as expected. Biesheuvel and Dykstra [10] analyzed the factors that differentiate faradaic from non-faradaic processes by considering the presence of the movement of charged species and the location of the electrode–electrolyte interface. It is a long and profound discussion that goes beyond the objective of this work. Therefore, it is hereby assumed that a faradaic process is one where any redox reaction occurs at the electrode–electrolyte interface. In opposition, a non-faradaic process is one where separation of charge (electrons in the electrode side and cations in the Helmholtz layer) in the electrode–electrolyte interface occurs as a result of the EDL phenomena (electrostatic storage).
Pseudocapacitance is the term that refers to the faradaic processes encompassed in this charge-storage system. Depending on the electrode material’s properties, pseudocapacitance can be expressed as inherently intrinsic or extrinsic. Intrinsic pseudocapacitance is exhibited in a broad spectrum of morphologic conditions showcasing the same electrochemical pseudocapacitive behavior regardless of the structure of the material. Extrinsic pseudocapacitance, contrary to the intrinsic one, manifests itself differently with the morphology of the active material, as its behavior is not the same in crystalline conditions as it is in layered/porous structures.
It is important to understand whether the pseudocapacitive behavior of a material is intrinsic or extrinsic to efficiently optimize the electrochemical response to the intended goal values. There are three known mechanisms that create different pseudocapacitance behaviors: fast reversible redox reactions, intercalation processes, and underpotential deposition. What characterizes pseudocapacitors the most is their redox-like features responsible for the high-energy capacity at fast rechargeable rates. Faradaic processes in pseudocapacitors consist of surface or near-surface, fast reversible redox reactions. With these reactions occurring at the surface, the specific surface area (SSA) is one of the most important factors liable to the optimization of the electrochemical response. This is where the creative combination of pseudocapacitive materials (e.g., metal oxides and hydroxides such as cobalt hydroxide) with interesting 3D nanostructures takes place, combining the intrinsic and extrinsic properties alike. The charge-storage redox mechanism of pseudocapacitors is very similar to that of batteries: during the charging process, an external power supply injects electrons into the circuit, forcing the current to flow from the positive to the negative electrode. The electronic density in the negative electrode attracts the cations from the electrolyte and a reduction reaction occurs in the active material.
Nowadays, computational simulation can be used as a valuable tool in understanding the electrochemistry behind processes. Simulation allows scientists to approximate models and theories to experimental results, inferring on the mechanisms and physic-chemical processes that occur in their studied materials. It also enables the elaboration of new ideas and investigation pathways by manipulating different variables and observing the resulted changes in the simulation.
The current demand for materials with enhanced, fit-to-purpose performance is placing a growing pressure to find time and human-resource-effective methodologies to advance materials development at a higher pace. For electrochemical energy-storage applications, understanding the materials performance through electrochemical simulations can be effectively used to predict and answer inquiries that are otherwise complex and laborious to conduct experimentally [11].
To construct an accurate simulation that includes all the processes in the electrode is a grand challenge. There are clear constraints that limit computational techniques, which have been often associated with the dynamics of the involved species such as solvent polarization, species behavior in reactive environments, and their relationship with the electron-transfer processes at the surface–electrolyte interface [12].
In fact, the interactions between electrolyte species and electrode surfaces have been a topic for many different interpretations. Spohr et al. [13] provides an interesting discussion and modeling of electrochemical systems, namely the importance of simulating the structure of diffuse layers at finite ion concentrations (which has been extensively focused on the simulation developed in this work), understanding the transport phenomena of the involved species in a given electrolyte, and considering the presence of defects at an electrode’s surface [13].
These modeling problems have been addressed in the literature in the form of simulations, which become as complex as the phenomena they try to accurately describe. These models sometimes require extensive knowledge of computational fluid dynamics [14], electronic circuitry [15,16], or a deep understanding of electrical double-layer theories [17]. While these simulations are good examples on how complex it is to model real electrode phenomena with accuracy, the question still open is if some complex electrochemical processes can be answered by simpler simulations. This work hereby proposes a simpler simulation approach based on the hypothesis that diffusion and kinetics can be used to describe an intriguing system of apparent complexity such as the charge-storage mechanism of a cobalt hydroxide pseudocapacitive electrode.
2. Simulation Setup
Computational simulations of cyclic voltammetry (with MATLAB®) were developed to observe the current and voltage values, as well as the shape of the cyclic voltammetry (CV) curves, to draw conclusions regarding the behavior of the system. A critical discussion will follow the simulated CV curves to discuss how well, or poorly, simple mathematical models correlate to reality. Therefore, a comparative study will be presented comparing simulated and experimentally obtained CV curves.
During a CV measurement, the behavior of the pseudocapacitor active material is tested as the potential sweep enables oxidation and reduction reactions that translate in the charge and discharge mechanisms, respectively.
2.1. Potential Sweep
In a potential sweep, just like how it is conducted in the laboratorial execution, potential varies linearly with time under a specific scan rate (ν) measured in Vs-1. The higher the scan rate, the higher the speed at which the experiment’s voltage varies. The overall potential sweep will increase from an initial value to a final value, upon which the sweep will be reversed (backward sweep) back to the initial voltage. The minimum and maximum potential, ψmin and ψmax, define the potential window (Δψ) and the shape of a potential sweep can be observed by plotting it in a function of time (Figure 1). The total duration of the sweep (tCV) can be obtained with Δψ and ν by using Equation (1). The potential throughout time can then be defined in two domains, as calculated, and presented in Equation (2).
The classical triangle-shaped graph of a potential sweep (Figure 1) displays the forward and backward sweeps set by a positive and negative slope (whose modules are the scan rate) that intersect each other at the maximum potential. With the potential sweep of the simulation established, it is now pertinent to develop the electrochemical kinetics of the system.
2.2. Butler–Volmer Kinetics
The Butler–Volmer equation (Equation (3)) describes the behavior of current intensity in an electrode in function of the overpotential present in the system. It is considered to be one of the most important equations in electrochemistry.
where jF and j0 are the faradaic current density and the exchange current density (A/m2), respectively; α is the system’s transfer coefficient; z is the number of transferred electrons; R is the gas law constant (J/K mol); T is the temperature (K); and η is the overpotential (V), which can be defined by Equation (4).
where ψ0 is the equilibrium potential of the system and ψ(t) is the potential sweep previously defined by Equation (2). There are several inherent parameters inside the Butler–Volmer equation that will vary during the cathodic and anodic reactions of the electrode. These variables will change depending on the kinetic order of the reactions occurring at the electrode active material. Therefore, for the cobalt hydroxide system, a fast and reversible redox reaction (Reaction I) will be the ruling mechanism of the faradaic response.
The direct reaction occurs in the oxidation sweep and the inverse in the reduction. It is hereby being assumed that the simulation’s system will consist of a cobalt electrode with a cobalt hydroxide active surface that will react with a basic electrolyte as its main energy-storage mechanism. The oxidant in the system is the hydroxyl anion OH−, and the reductant is water, while the electrode’s surface will change its composition from to during oxidation, and vice versa during reduction. Few further assumptions were made in order to simplify the problem at hand: no solid-state diffusion occurs in the bulk of the active material; the reaction will follow a heterogeneous zero-order (i.e., catalytic behavior); and there is no secondary reaction or accumulation of species occurring in the system.
With these assumptions, the problem is thereby initiated with the heterogeneous electron-transfer rate constant, This approximation is made taking into consideration the surface (and/or, in reality, near-surface) region in which pseudocapacitive redox reactions occur, unlike batteries where the storage mechanism is processed in the bulk of the active material. Therefore, the system is not limited by the concentration of reactants but by the active material itself, generating concentration gradients that will ultimately result in diffusion gradients in the near regions of the electrode surface. The insertion of this constant will further breakdown the Butler–Volmer equation into two analogous terms, one for the oxidation (Equation (5)) and one for the reduction reaction (Equation (6)) [18].
With varying η, the oxidative and reductive constant rates ( and ) will change exponentially throughout the duration of the simulation. They will later be used to determine the mass flux at the surface of the active material, but firstly, the concentration gradient of the oxidant and reductant ( and ) needs to be determined.
2.3. Diffusion Gradients
The generated diffusion gradients formed in the electrolyte adjacent to the electrode surface will follow Fick’s 2nd Law, expressed by Equations (7) and (8).
where Dox and Dred are the diffusion coefficients of the oxidant and the reductant, respectively; Cox and Cred are the concentration of oxidant and reductant, respectively; and x is the distance of the redox species to the electrode’s surface. This differential equation is well-known in chemical engineering and adds to the problem a new dimension: the distance to the electrode. Therefore, the simulation now has two independent dimensions (time and space) that will define the concentration gradients through solving Fick’s second law of diffusion. In his work [18], Brown used a point-cell method to solve the diffusion-gradient problem for a binary redox system, aimed at the application of Microsoft Excel for the interpretation of cyclic voltammetry. This work will provide MATLAB® simulations coded like the method that Brown applied in Excel, the point method. The point method consists in the approximation of the concentration gradient to a cell-based grid defined by a time and a distance axis. Spatial and temporal indexes were defined as i and j, respectively, creating a cell grid constituted by those same dimensions. The aim is to conduct a discretization of the differential equations to obtain an expression that will calculate the concentration of a cell based on the prior concentrations in space and time. The discretization of Fick’s second Law is presented with Equations (9) and (10).
Equation (10) is the fully discretized form of Fick’s second law of diffusion, including the point concentrations presented in Figure 2 and λ (cm−1) as an auxiliary factor (Equation (11)) that groups up the diffusion coefficient of the species, D (cm2/s); and the time and distance increments, Δt (s) and Δx (cm), respectively obtained by dividing tCV and L (the thickness of the diffuse layer) by the total number of increments of those dimensions, nt (Equation (12)) and nx, (Equation (13)).
Equation (11) is applied to both oxidant and reductant concentration gradients by taking initial and boundary conditions that will respectively be the first values used by Equation (10). This system can be observed in Figure 2.
It is observed in Figure 2 that the point method requires three boundary conditions (first and last column, and bottom row). These conditions are stated below from Equation (14) to Equation (17) for both oxidant and reductant concentrations.
where and are the concentrations of the oxidant and reductant at the bulk of the electrolyte, and and in the electrode’s surface, respectively; L is calculated with Equation (18) which corresponds to six times the distance the species are expected to diffuse during the experiment.
Unlike the initial and bulk conditions, the concentrations at the electrode surface (green column in Figure 2, explicit by Equations (16) and (17)) are unknown at the start of the simulation. Therefore, the point method will not be able to provide these concentrations, and an extra calculation step that includes the molar flux of the redox species must be conducted afterwards. In order to circumvent this degree of freedom in the system, the fluxes Jox and Jred (mol cm−2 s−1) will be rewritten from their classical definition to an expression that includes the available concentrations one distance-increment away from the electrode surface, and (Equations (19) and (20)).
With the fluxes defined, the concentrations at the electrode surface can be further calculated with Equations (21) and (22).
The flux can be calculated again with the surface concentrations by Equations (23) and (24).
With the fluxes fully determined in function of the concentration gradients governed by Butler–Volmer kinetics and Fick’s second law of diffusion, the faradaic current density, iF (A/g), can be finally obtained with Equation (25), where m is the mass of the electrode’s active material.
The capacitive contribution of the double-layer effect in the pseudocapacitor can be included and approximated to the behavior of an ideal capacitor (Equation (26)) with the sum of the capacitive current density, iC (A/g) to iF, obtaining the total current density, iT, in Equation (27).
3. Simulation
In this section, the models and methods previously explained will be applied in the development of a simulated cyclic voltammogram, intended to showcase the electrochemical response of a cobalt hydroxide nanofoam electrode, constructed by DHBT electrodeposition [19] and oxidative functionalization. Once the CV curve is obtained, a comprehensive analysis of the influence of certain parameters over the shape of the voltammogram will be conducted, before the final comparison with a real, experimentally obtained, CV curve of cobalt hydroxide nanofoam is analyzed.
3.1. Operating Condition
The parameters necessary to conduct the simulation are presented in Table 1, where the relevant properties of the cobalt hydroxide nanofoam system are depicted. Although the nanoporous framework is not modeled for the simulation, the assumption that the redox reactions purely occur at the surface of the active material approximates the properties of the nanofoam structure to the simple definition of the electrode surface area.
3.2. Simulated Cyclic Voltammetry
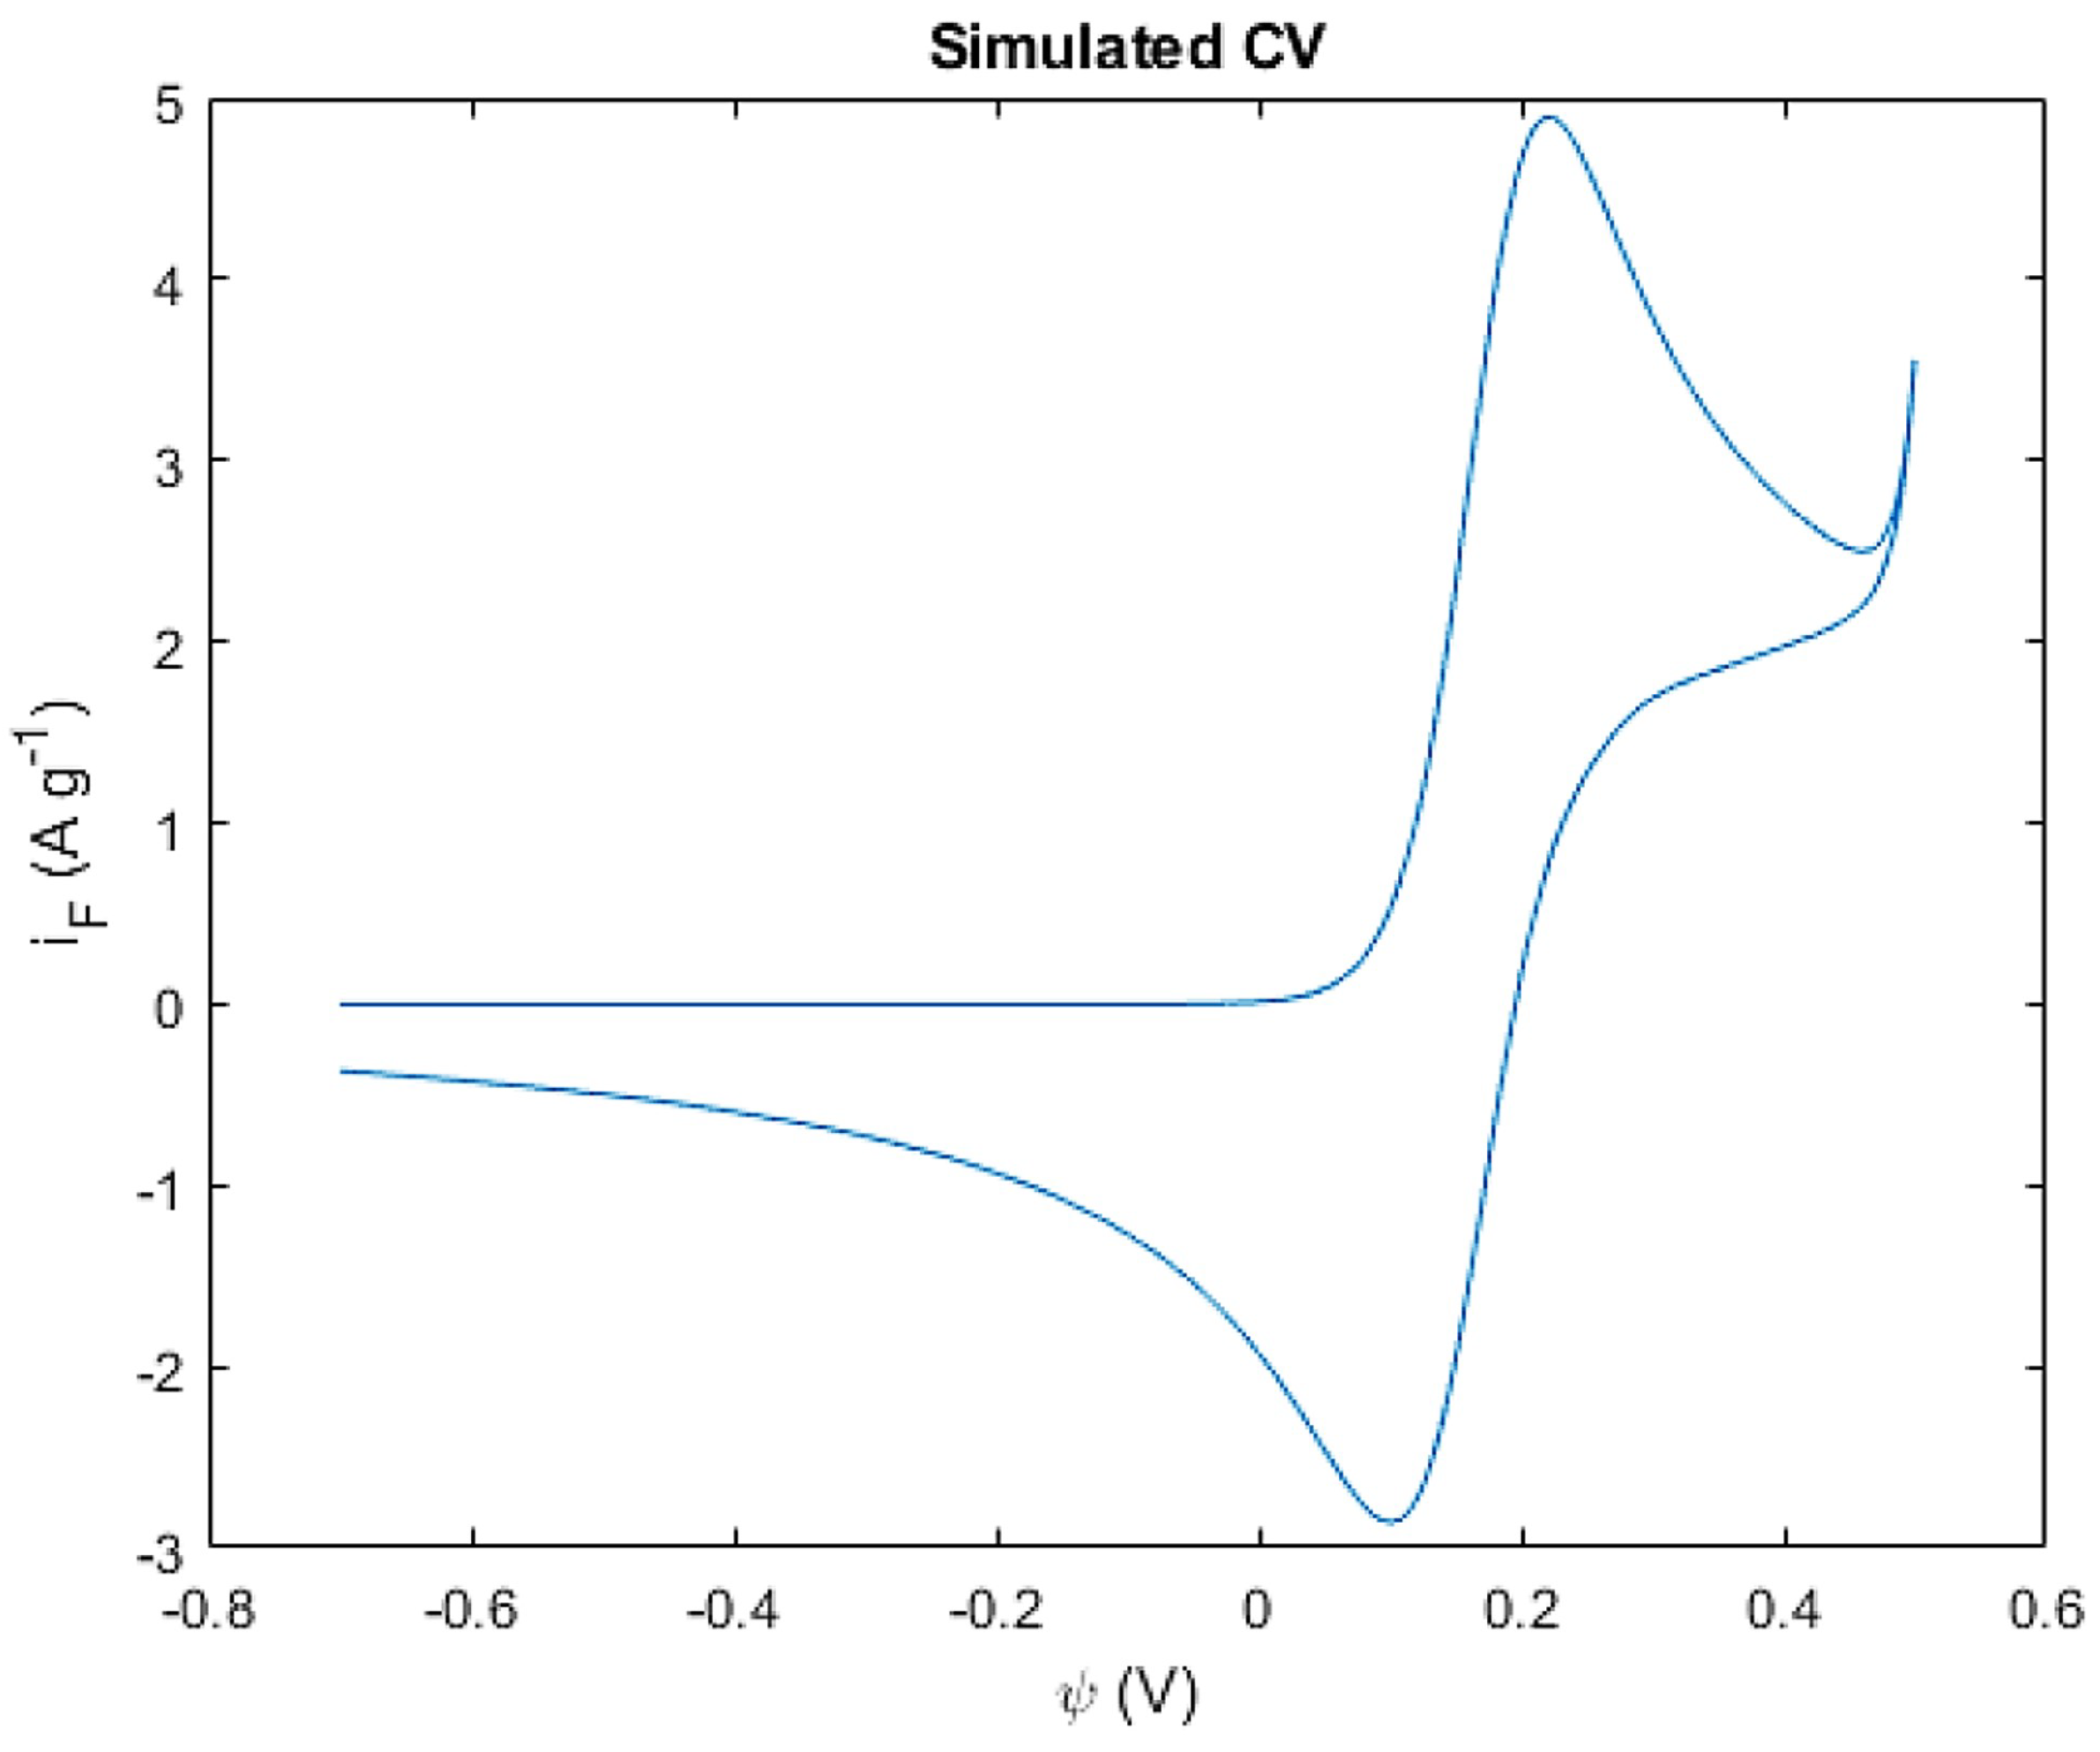
Using and coding the models and parameters previously stated, the resulting CV curve for the cobalt hydroxide system was obtained and displayed in Figure 3.
It is possible to observe two well-defined peaks in the obtained CV curve, indicating the faradaic behavior of the system. In Figure 3 the anodic and cathodic current peaks are highlighted by ipC and ipC, respectively defining the oxidation and reduction reactions.
According to the simulated CV curve, the electrochemical response starts, as intended, from the minimum/starting potential (ψmin) of −0.7 V from where the current intensity remains null until a steep increase is noted at 0.2 V. At this stage, the active material is behaving as an anode onto which the oxidation is governed by the Butler–Volmer kinetics until it reaches the anodic current peak of 0.32 V, which represents the maximum that the active material can oxidize at the given conditions. Once the Co(OH)2 surface is fully oxidized into CoOOH, no more OH− ions are being required by the active material to react with. With the oxidative step completed, the current intensity will decrease until the potential sweep is reversed or until a secondary oxidation is activated by a higher potential. Considering the construction of this system and its limitations, no more reactions will occur during the forward sweep and the electrochemical response will be diffusion controlled. Upon reaching the maximum/ending potential (ψmax) of 0.5 V, the potential sweep is reversed, and the backward step begins. With the potential now decreasing linearly over time under a constant rate of −ν, the Butler–Volmer kinetics govern again and force the active material to be reduced from CoOOH back to Co(OH)2. The current decreases to the cathodic current peak of 0.2 V, representing the full reduction of the active material. Analogous to the forward sweep, the backward sweep is then controlled by diffusion and increases gradually as the negative current density increases until the potential reaches ψmin again.
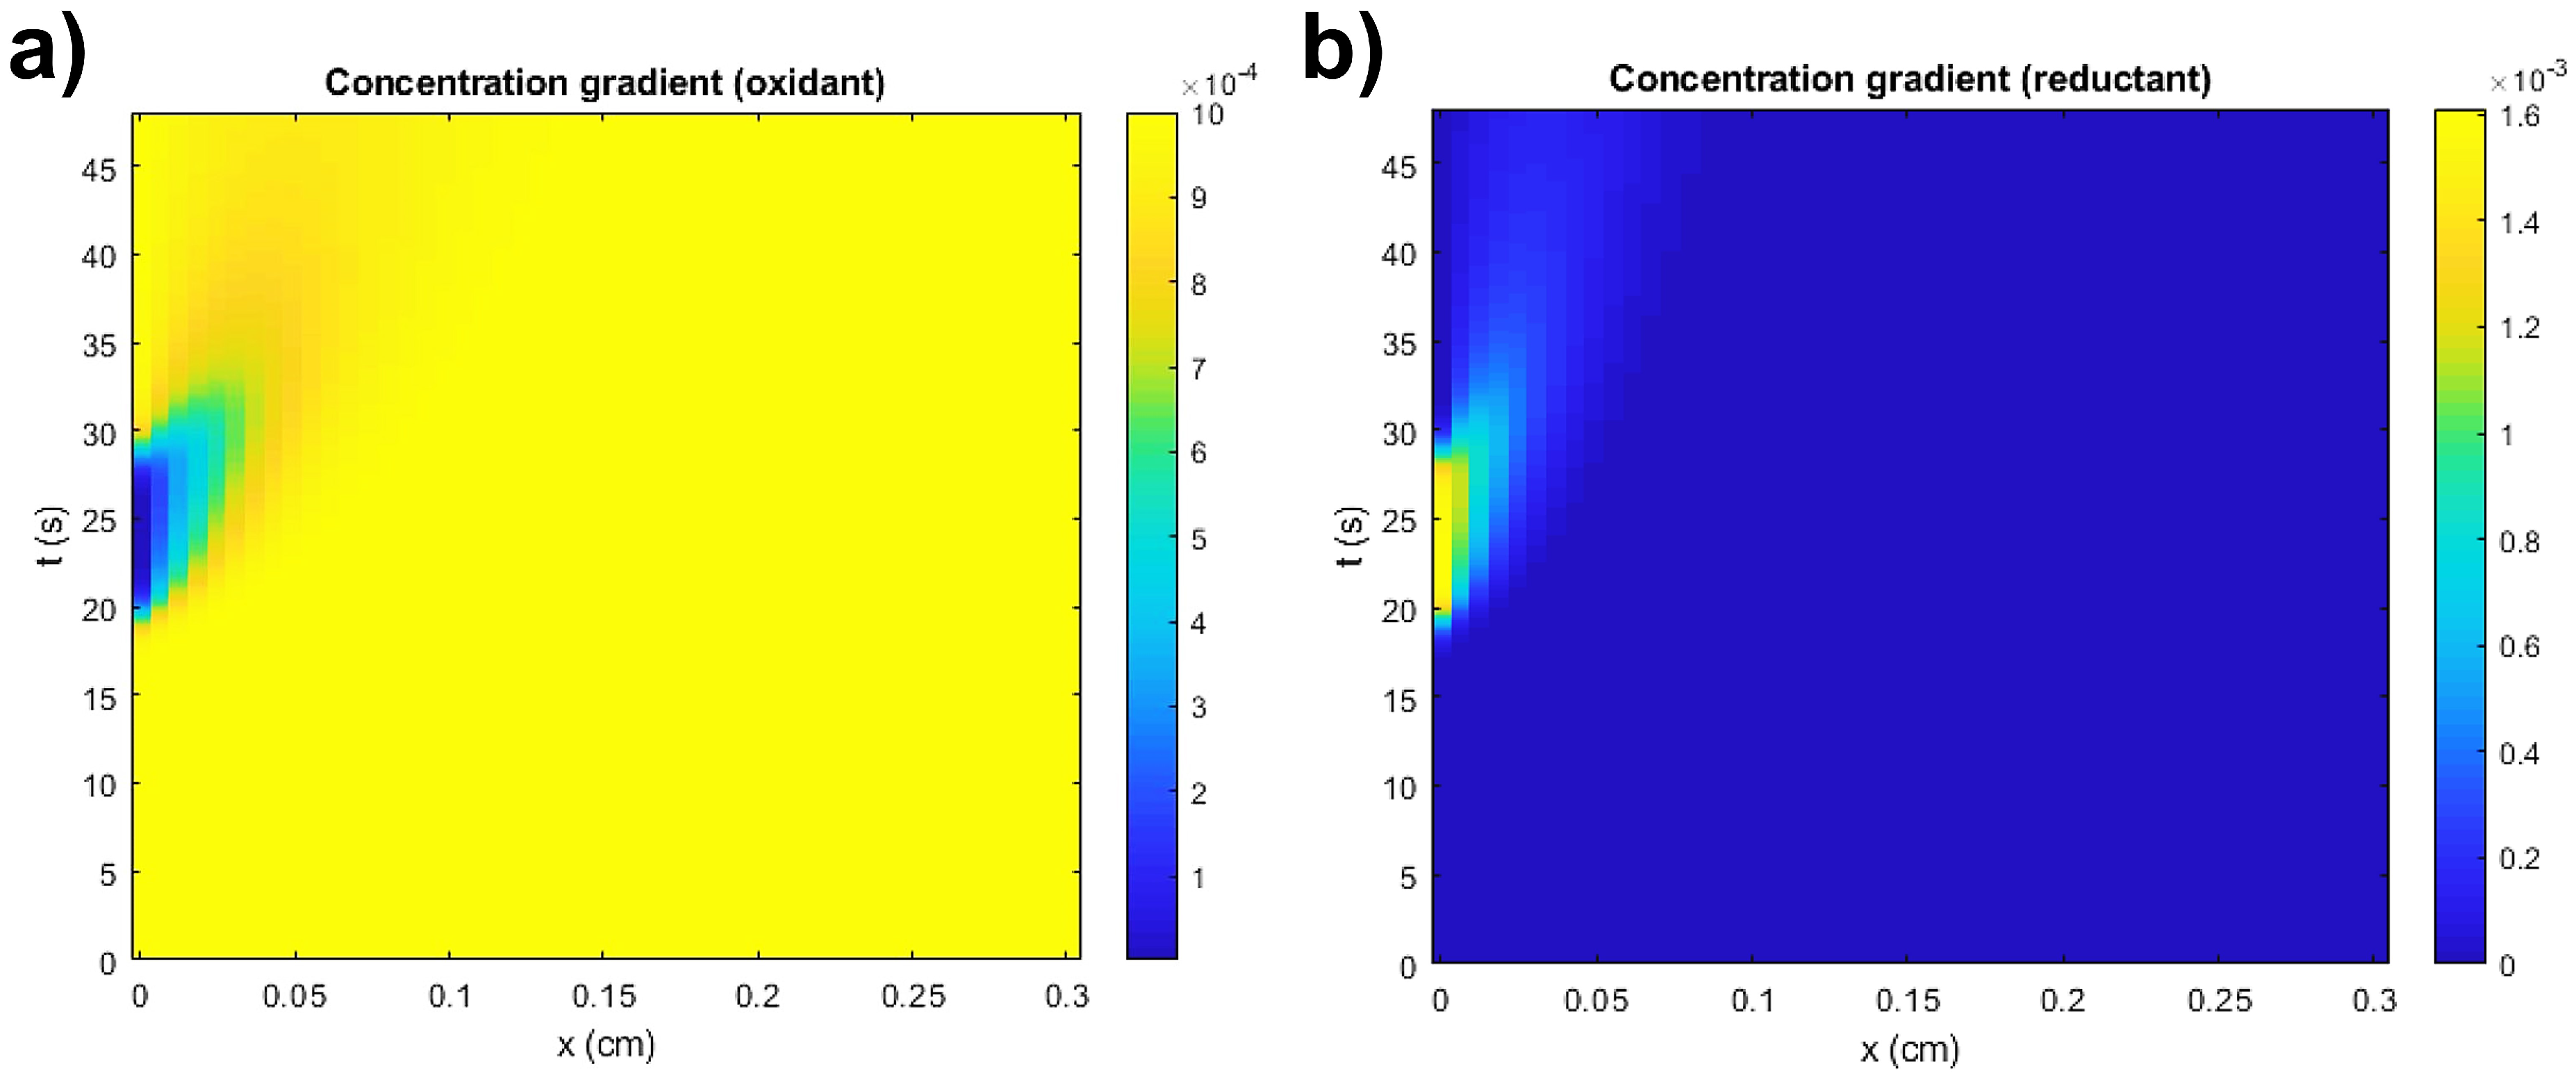
The simulated CV curve displays a marked faradaic redox behavior which shape, and values, will be later studied and analyzed with the objective of understanding their influence in the overall response of the electrochemical system of cobalt hydroxide. The concentration gradients can also demonstrate the behavior of the redox species across the diffuse layer throughout time and distance to the active surface. These gradients are represented by Figure 4a,b for the oxidant and reductant, respectively.
It can be immediately observed that the oxidant’s concentration changes at the surface of the electrode (x = 0 cm), displaying a colored stain in the gradient. According to the simulated data of the oxidant at the surface and near-surface areas, its concentration remains unchanged over time until the maximum potential is reached, , concluding the oxidative/forward sweep, after which the reduction begins when the potential decreases and the reductive/backward sweep takes place.
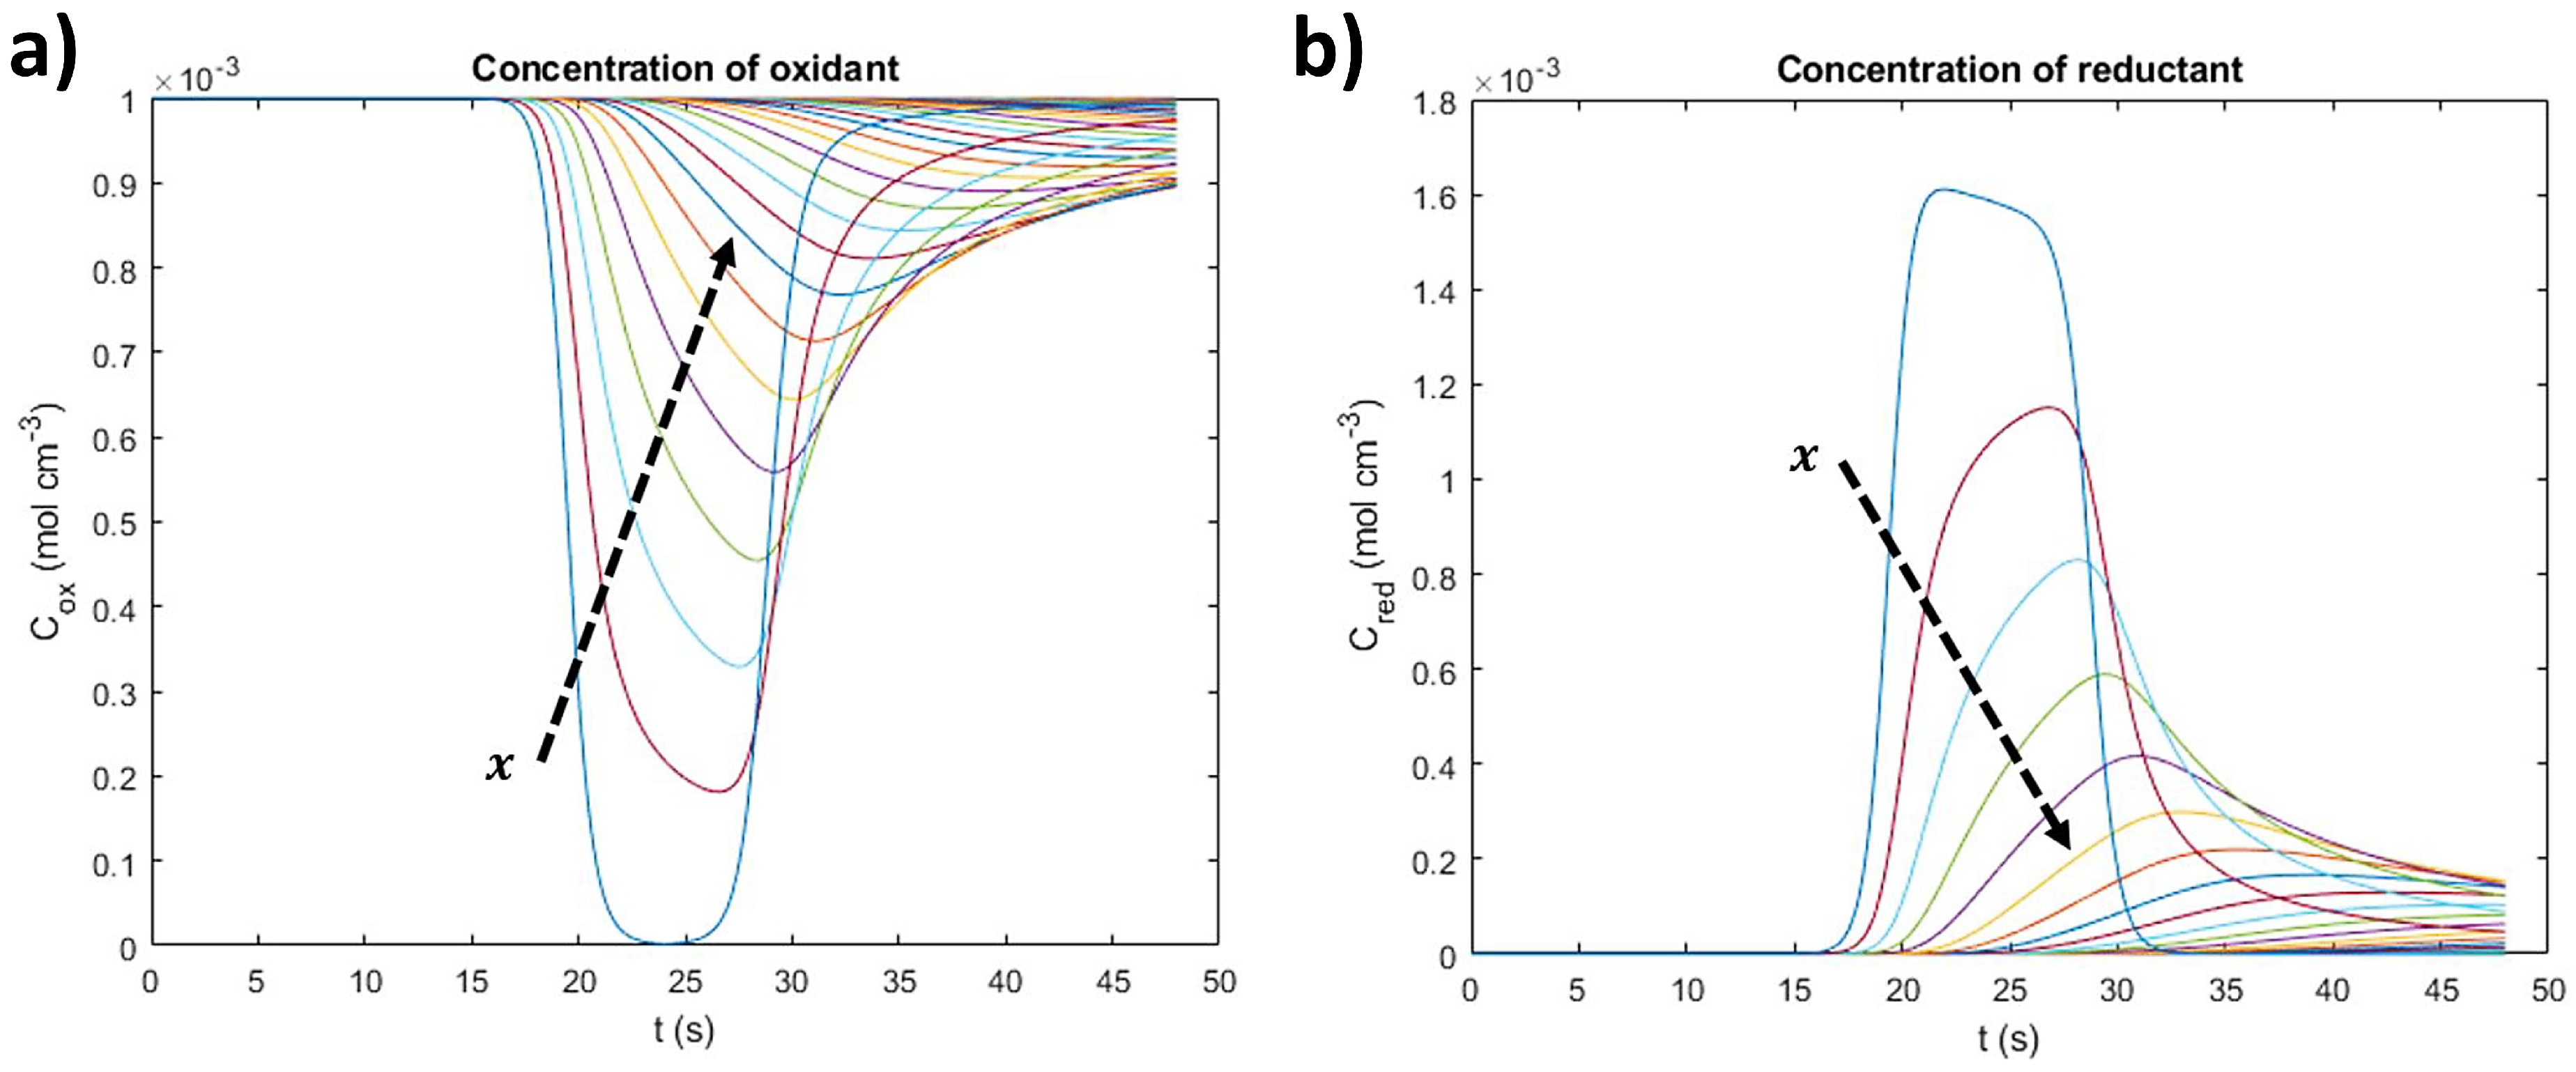
This simulates the diffusion of oxidant molecules to the surface of the active material so that they oxidize to CoOOH (thus decreasing their concentration) and then are generated again when the active material is reduced back to Co(OH)2. It is a simple comprehensive way of observing how Butler–Volmer kinetics can demonstrate the electrochemical behavior of a redox couple such as Co(OH)2/CoOOH when combined with Fick’s 2nd Law of diffusion. The concentration gradient of the reductant occurs in a relatively analogous process to the oxidant, but with a contrary driving force. Considering the different diffusion coefficients that define the diffusion behavior of the electrolyte species, the gradients will differ slightly in the shape of the colored stain evidently visible. The gradients can be also displayed on the distance planes (Figure 5a,b).
The peaks of each concentration curve correspond to the maximum or minimum of the oxidant and reductant’s concentration, respectively, at ψmax. In the case of the oxidant (Figure 5a), the minimum concentration is higher as the distance to the electrode increases because the redox processes only occur at the active material’s surface or at its near-surface. The opposite situation occurs for the reductant (Figure 5b).
3.3. Sensitivity Analysis
In this section, some of the key ruling parameters (scan rate, temperature, and reaction rate constant) of the simulation will be subject to a sensitivity analysis, in which they will be varied in defined windows as the electrochemical response of the CV will be observed and conclusions regarding the simulation’s approach to reality will be taken.
Scan rates of 50, 100, 150, 200, 250, and 300 mV/s were imposed in the simulation and the respective CV curves were obtained. The results are presented in Figure 6a. Increasing scan rates results in more positive anodic-current peaks and more negative cathodic-current peaks, extending the maximum and minimum of the cyclic voltammograms. This relationship between ν and the current peaks is described by the Randles–Sevcik equation (Equation (28)), which states that the current peaks are highly dependent on the diffusion properties of the system and of its scan rate.
The Randles–Sevcik equation essentially describes that with a higher scan rate the concentration gradient will be higher near the electrode’s surface, which abides by the kinetics of the Nernst equation. Note that the Nernst equation is not defined in the present simulation setup, but instead, Butler–Volmer kinetics is. The Nernst model is a subset of the Butler–Volmer equation for the particular case of a system in equilibrium. This can be mathematically demonstrated as explicitly shown by the work of Kulikovsky et al. [25]. It is noteworthy that the changes caused by the increasing scan rates are in agreement with the behavior expected for cobalt hydroxide [3,4].
Temperatures of 25, 100, 200, 300, and 400 °C were imposed in the simulation parameters, and the following sensitivity analysis present in Figure 6b was conducted. As the temperature increased, the distance between peaks decreased as the CV curves flattened. This behavior is mathematically expected within the scope of the simulation considering the placement of the temperature term in the Butler–Volmer expressions (Equations (5) and (6)) that translate into an Arrhenius type of exponential response that will always decrease with higher temperatures. From an experimental perspective, it is well-reported in the literature [26] that increasing the temperature will facilitate the overcoming of the activation energy necessary for the exchange of charged species, reducing the hysteresis of the electrochemical response. This smoothing of the CV curve peaks is noticeable in Figure 6b by the less steep evolution of the current intensity towards the peaks, indicating the involvement of more easily achieved energetic states.
The heterogeneous reaction rate constant was changed from the initial 0.01 to a final 0.0001 cm/s, and the respective electrochemical behavior of the CV curve was observed in Figure 6c. The variation of the reaction rate constant resulted in interesting curve shapes which can be summarized with the considerable increase in the distance between the oxidation and reduction potentials as the reaction constant decreases. Slower kinetics result in the oxidation requiring higher potentials in order to be achieved, and in reduction requiring more negative potentials, respectively. It can also be observed that as the module of the current peaks decreases, the rate at which they decrease is slower for the same pace of decreasing rate constants. This suggests that the system has a limit to which the kinetics are so slow that the diffusion is then fully dominant of its response, requiring a higher potential window as a consequence of lack of kinetic contribution.
3.4. Capacitive Contribution
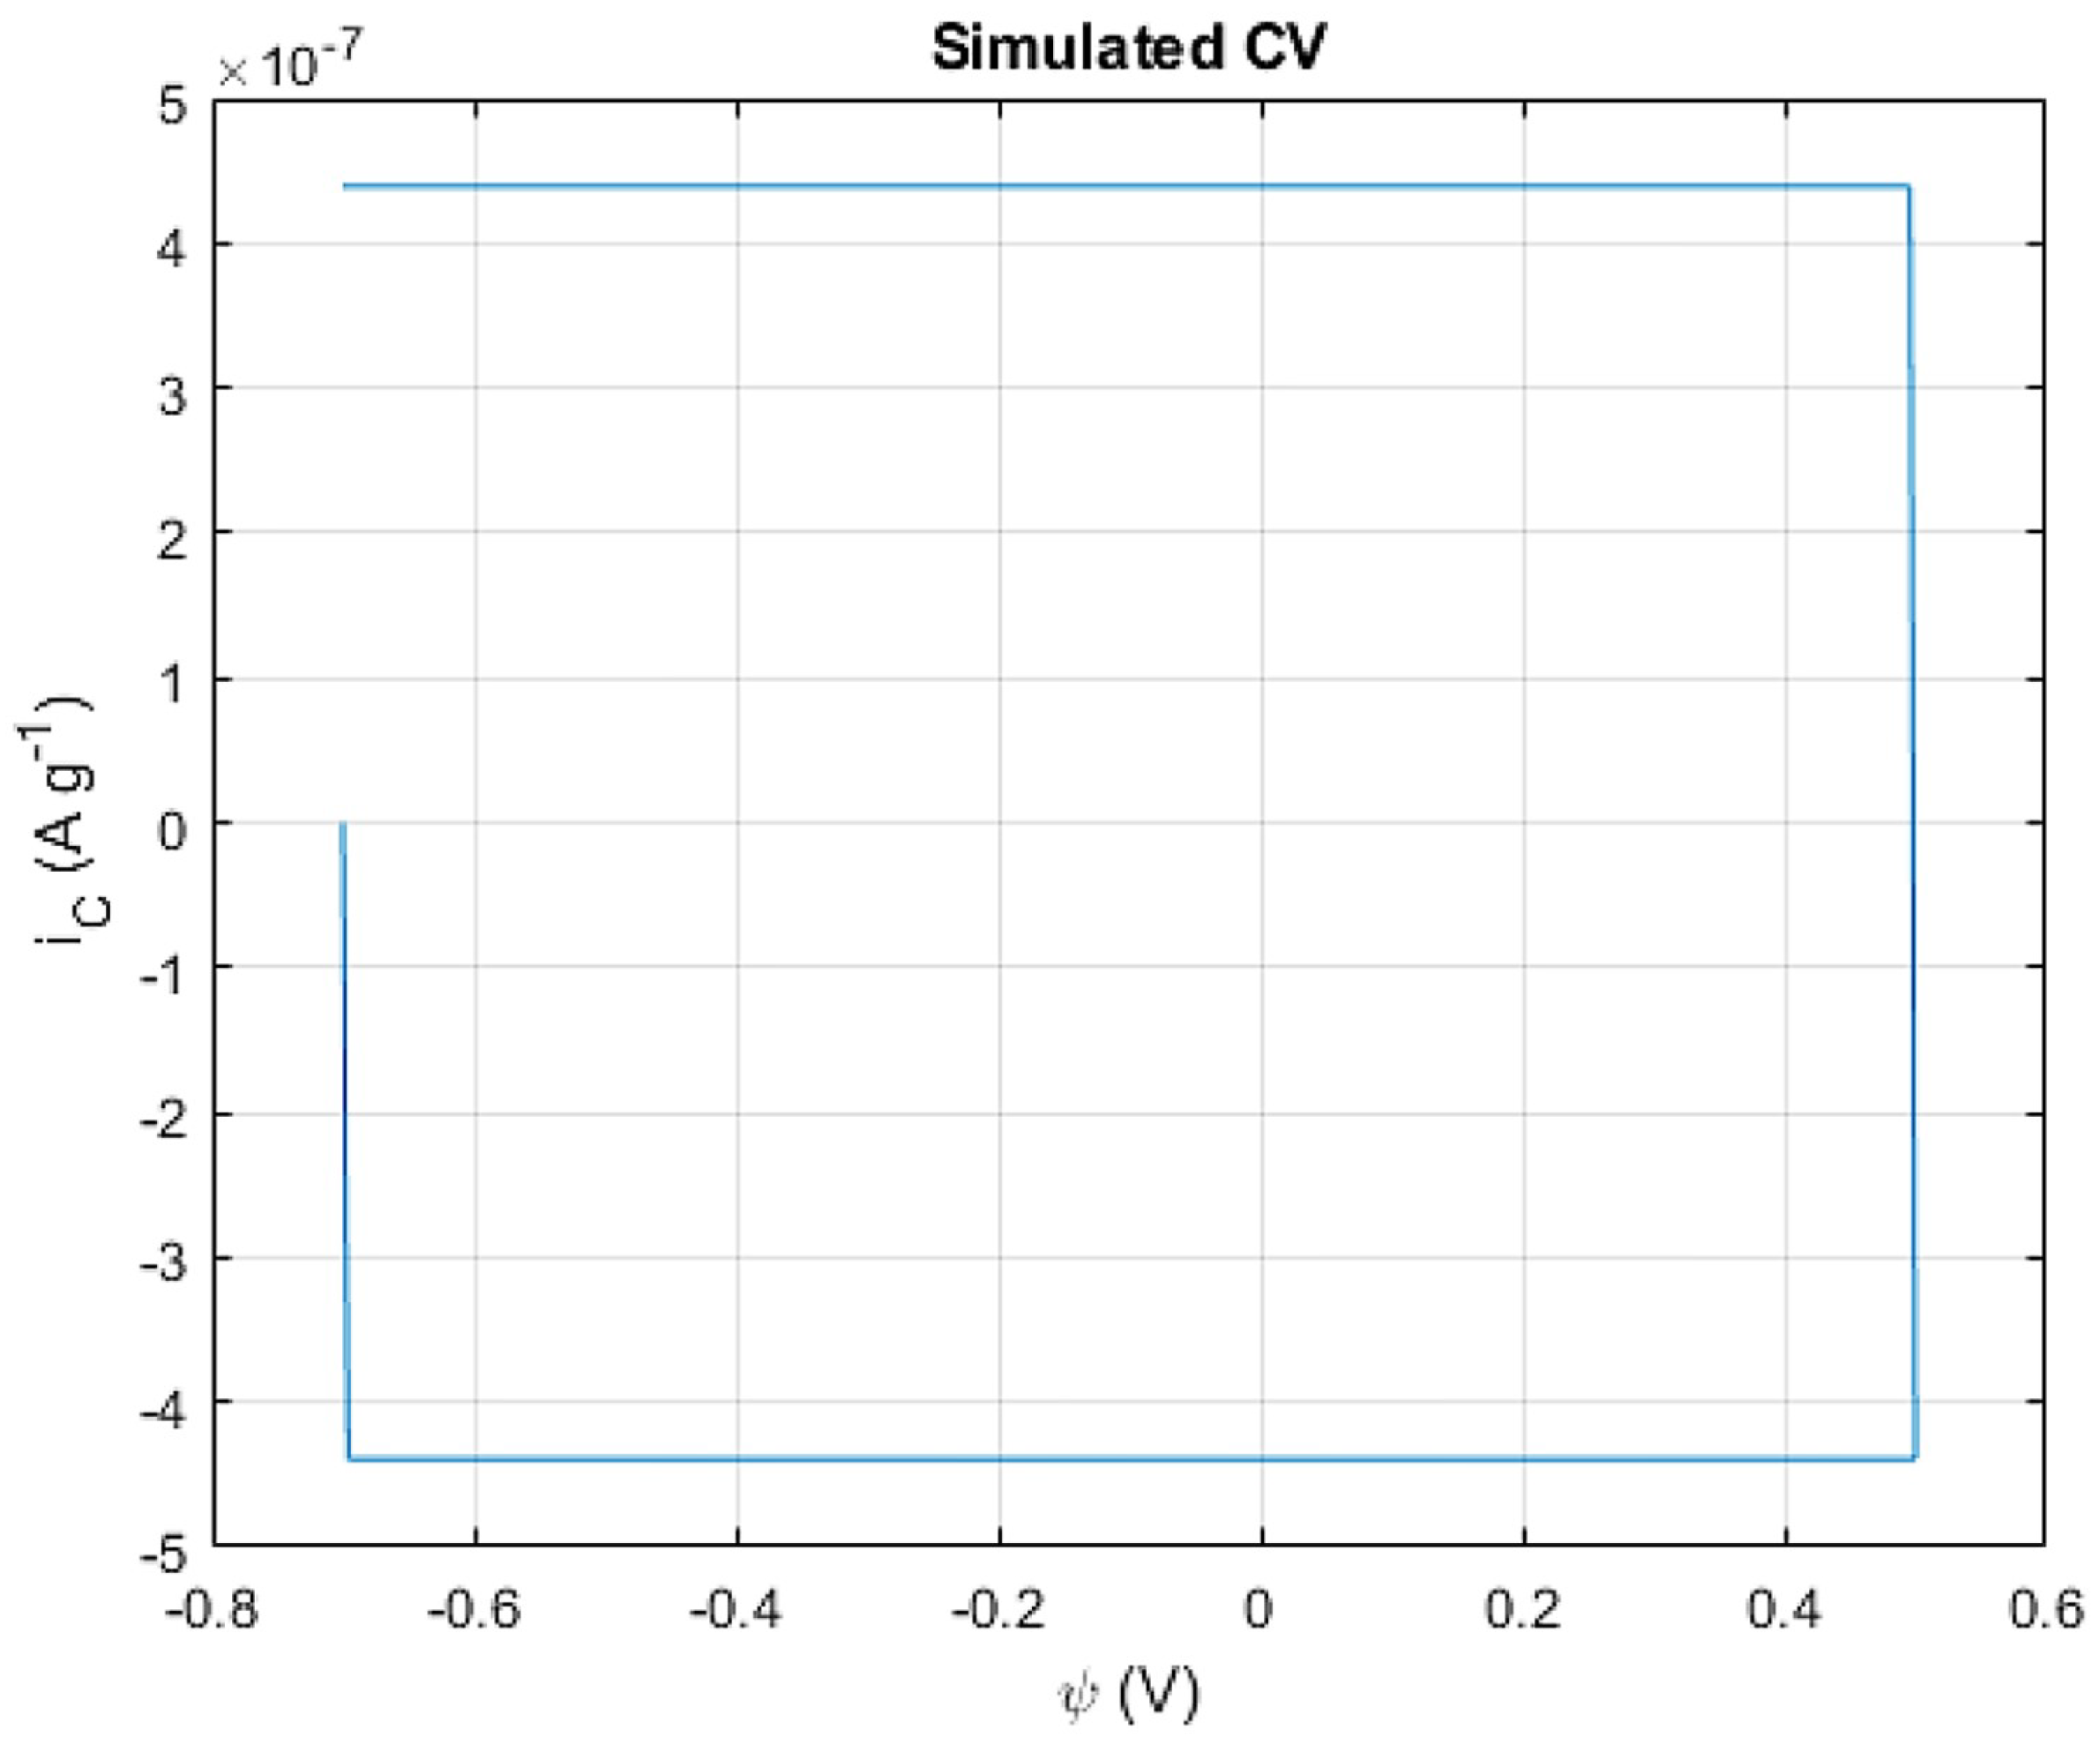
To evaluate the capacitive contribution in the Co(OH)2/CoOOH system, an extra step of the simulation was added, in which the ideal capacitor approximation stated by Equation (26) was assumed, leading to the pure capacitive CV curve observed (Figure 7).
The classic rectangular-shaped CV curve is clearly observed and is a characteristic shape of an almost-instant electrostatic-energy storage at the surface of an electrode. In the study of electrochemical capacitors, the voltammograms usually differ from the pure rectangular-shaped curves due to the presence of other phenomena that occur in the interface of the electrode’s surface and the media’s bulk.
As far as capacitive contribution is concerned, a sharp current increase can be observed at the start of the potential sweep, maintaining a constant current value until an inversion of the sweep occurs and the reverse process takes place, leading to a symmetric sharp decrease in current. This behavior is consistent with the physical nature of the purely electrostatic process [27].
The simulated capacitance is calculated to be approximately 8 μF, which matches the expected capacitance range of capacitive contribution in pseudocapacitors [28]. It should be noted that this simulation is heavily constructed in the working principles of a redox-storage mechanism, and the charge transfer resulting from this mechanism far outweighs what could ever be simulated by capacitance contribution. Thus, this contribution is not noticeable when added to the full simulation of the cobalt hydroxide system, and was therefore neglected in the scope of this simulation.
3.5. Simulation vs. Reality
In this section, a qualitative comparison between the simulated CV curves and curves experimentally obtained for the cobalt hydroxide nanofoam system will be conducted. The simulation showcased in Figure 8 has approximated inputs (Table 1) that were used in the experimentally obtained CV curve of an electrodeposited (by DHBT method) cobalt nanofoam for 45 s and chemically treated with H2O2 before being submitted to a CV test in 1 M KOH at 25 °C and 50 mV s−1.
It can be observed that both simulated and experimentally obtained curves share the same potential placement for the cathodic- and anodic-current peaks at around 0.20 V and 0.32 V, respectively. This suggests that the simulated Butler–Volmer kinetics are a good fit to the real kinetics in nature, respecting the expected Co(OH)2/CoOOH redox potentials. A similar approach to the current peaks is also visible at those potentials, with the distance between peaks being more extensive in the simulated curve than the experimental one. This may have to do with the effectively activated surface of the electrode that participates and enables the redox reactions, usually experimentally obtained through functionalization methods such as the oxidative treatment of the metal foam, as described in the previous chapter. Additionally, the overall area of the experimental curve is considerably wider than the simulation’s, most likely as a consequence of other diffusion processes, and possibly other reactions and kinetic phenomena, that are not covered within the simulation models. Unconsidered secondary reactions are also known to occur in these types of pseudocapacitive systems. In fact, the small current peak noticeable at the end of the forward sweep of the experimental curve is possibly related to water electrolysis usually under the form of oxygen evolution reactions (OER). This reaction is essentially the effective oxidation of water under one of four possible mechanisms for alkaline media [29]. Therefore, the addition of the OER was included in the simulation as an extra reaction. According to the Pourbaix diagram of water, for highly alkaline solutions such as of the simulation’s and experiment’s case of 1 M (KOH), the standard potential for the oxidation of water is set at a ψ0 of 0.401 V. The resulting simulation is in Figure 9.
The results presented in Figure 9 showcase the OER occurring at around 0.4 V as expected. The current density would continue to increase until another peak would be established as the limit of the OER. The simulation can thereby include more than one reaction within its kinetics and diffusion models, contributing to a more accurate representation of the reactions that truly occur in the electrode. It is to be noted that the simulated curve is considerably thinner than the experimentally obtained one. This indicates the presence of other charged species within the electrolyte, contributing to the diffusion phenomena that are usually associated with intercalation mechanisms or other processes. It is difficult to consider the entirety of these processes, but not impossible, as the simulation’s parameters, models, and code can be simpler or more extensive, depending on the system’s complexity. Nevertheless, the cobalt hydroxide nanofoam system can be decently simulated with all the parameters and models previously considered, especially when it comes to pinpointing the placement of the redox current peaks, current density, and potentials.
4. Conclusions
Pseudocapacitors are promising devices capable of placing a new class of electrochemical capacitors in the gap between electrical capacitors and batteries by providing high power and energy capacities alike, creating solutions for a wide range of applications with their continuous research. Furthermore, understanding the energy-storage methods of pseudocapacitors is of utmost importance in the academic scope due to the presence of a wide array of mechanisms that can be practically localized in the functioning of every other electrochemical device.
By simulating the electrochemical response of a cobalt hydroxide nanofoam system, it has been concluded that simpler mathematical modeling based on the well-known Butler–Volmer kinetics and Fick’s laws of diffusion is precise enough to achieve a decent level of accuracy when the pertinent parameters and operating conditions are well-defined and adjusted. This simulation is also applicable to other metal hydroxides by updating the parameters directly related to the material’s inherent properties, namely the standard potential, number of transferred electrons, charge-transfer constant, and rate constant, which are introduced at the beginning of the simulation. Furthermore, the simulated CV curves evidenced good accuracy of the current and potential placement of the anodic and cathodic peaks, as well as being able to include secondary reactions occurring parallel to the energy-storage redox couple, such as the OER. The sensitivity analysis of key parameters such as scan rate, reaction rate constant, and temperature demonstrated that the simulation abides by the expected behavior of the CV curve when these parameters are varied.
Author Contributions
Conceptualization, G.G.C., M.T.S. and M.F.M.; methodology, investigation and software, G.G.C.; writing—original draft, G.G.C., M.T.S. and M.F.M.; writing—review and editing, G.G.C., S.E., M.T.S. and M.F.M.; project administration and supervision, M.T.S. and M.F.M.; funding acquisition, M.T.S. All authors have read and agreed to the published version of the manuscript.
Funding
The authors would like to thank Fundação para a Ciência e a Tecnologia (FCT, Portugal) for financial support under the projects CQE-UIDB/00100/2020, UIDP/00100/2020, IMS-LA/P/0056/2020, PTDC/QUI-ELT/28299/2017, UIDB/00100/2020.
Institutional Review Board Statement
Not applicable.
Informed Consent Statement
Not applicable.
Data Availability Statement
Not applicable.
Acknowledgments
Authors acknowledge the financial support of the project Baterias 2030, with the reference LISBOA-01-0247-FEDER-046109, co-funded by Operational Programme for Competitiveness and Internationalization (COMPETE 2020), under the Portugal 2020 Partnership Agreement, through the European Regional Development Fund (ERDF).
Conflicts of Interest
The authors declare no conflict of interest.
References
- IEA. Annual Storage Deployment, 2013–2018. 2019. Available online: https://www.iea.org/data-and-statistics/charts/annual-storage-deployment-2013-2018 (accessed on 27 February 2022).
- IEA. World Energy Investment; IEA: Paris, France, 2019; Volume 2019. [Google Scholar]
- Jagadale, A.D.; Guan, G.; Du, X.; Hao, X.; Li, X.; Abudula, A. Cobalt hydroxide [Co(OH)2] loaded carbon fiber flexible electrode for high performance supercapacitor. RSC Adv. 2015, 5, 56942–56948. [Google Scholar] [CrossRef]
- Lin, X.; Li, H.; Musharavati, F.; Zalnezhad, E.; Bae, S.; Cho, B.-Y.; Hui, O.K.S. Synthesis and characterization of cobalt hydroxide carbonate nanostructures. RSC Adv. 2017, 7, 46925–46931. [Google Scholar] [CrossRef] [Green Version]
- Santos, C.S.; de Oliveira, R.D.; Marchesi, L.F.; Pessôa, C.A. Electrodeposited cobalt hydroxide in expanded carbon graphite electrode obtained from exhausted batteries applied as energy storage device. Arab. J. Chem. 2020, 13, 3448–3459. [Google Scholar] [CrossRef]
- Gogotsi, Y.; Simon, P. Materials for electrochemical capacitors. Nat. Mater. 2008, 7, 845–854. [Google Scholar]
- Selvamani, V. Stability Studies on Nanomaterials Used in Drugs. In Characterization and Biology of Nanomaterials for Drug Delivery; Elsevier Science: Amsterdam, The Netherlands, 2019; pp. 425–444. [Google Scholar]
- Najib, S.; Erdem, E. Current progress achieved in novel materials for supercapacitor electrodes: Mini review. Nanoscale Adv. 2019, 1, 2817–2827. [Google Scholar] [CrossRef] [Green Version]
- Gao, X.; Wang, P.; Pan, Z.; Claverie, J.P.; Wang, J. Recent Progress in Two-Dimensional Layered Double Hydroxides and Their Derivatives for Supercapacitors. ChemSusChem 2020, 13, 1226–1254. [Google Scholar] [CrossRef] [PubMed]
- Biesheuvel, P.M.; Dykstra, J.E. The difference between Faradaic and non-Faradaic electrode processes. Chem. Phys. 2021. [Google Scholar] [CrossRef]
- Franco, A.A.; Doublet, M.L.; Bessler, W.G. Physical Multiscale Modeling and Numerical Simulation of Electrochemical Devices for Energy Conversion and Storage: From Theory to Engineering to Practice, 1st ed.; Green Energy and Technology, Springer: Berlin/Heidelberg, Germany, 2015; p. 249. [Google Scholar]
- Roldan, A. Frontiers in first principles modelling of electrochemical simulations. Curr. Opin. Electrochem. 2018, 10, 1–6. [Google Scholar] [CrossRef]
- Spohr, E. Computer Simulations of Electrochemical Interfaces. In Advances in Electrochemical Science and Engineering; Wiley Online Library: Weinheim, Germany, 1999; pp. 1–75. [Google Scholar]
- Rivera, F.F.; Pérez, T.; Castañeda, L.F.; Nava, J.L. Mathematical modeling and simulation of electrochemical reactors: A critical review. Chem. Eng. Sci. 2021, 239, 116622. [Google Scholar] [CrossRef]
- Singh, T.; Kumar, S. Modeling and Simulation of Electrochemical Supercapacitor for High Power Delivery. Int. J. Adv. Res. 2017, 5, 509–516. [Google Scholar] [CrossRef] [Green Version]
- Şahİn, M.E.; Blaabjerg, F.; Sangwongwanİch, A. Modelling of Supercapacitors Based on Simplified Equivalent Circuit. CPSS Trans. Power Electron. Appl. 2021, 6, 31–39. [Google Scholar] [CrossRef]
- Kroupa, M.; Offer, G.J.; Kosek, J. Modelling of Supercapacitors: Factors Influencing Performance. J. Electrochem. Soc. 2016, 163, A2475–A2487. [Google Scholar] [CrossRef] [Green Version]
- Brown, J.H. Development and Use of a Cyclic Voltammetry Simulator to Introduce Undergraduate Students to Electrochemical Simulations. J. Chem. Educ. 2015, 92, 1490–1496. [Google Scholar] [CrossRef]
- Arévalo-Cid, P.; Adán-Más, A.; Silva, T.; Rodrigues, J.A.; Maçôas, E.; Vaz, M.; Montemor, M. On the growth and mechanical properties of nanostructured cobalt foams by dynamic hydrogen bubble template electrodeposition. Mater. Charact. 2020, 169, 110598. [Google Scholar] [CrossRef]
- Adán-Más, A.; Duarte, R.G.; Silva, T.M.; Guerlou-Demourgues, L.; Montemor, M.F.G. Enhancement of the Ni-Co hydroxide response as Energy Storage Material by Electrochemically Reduced Graphene Oxide. Electrochim. Acta 2017, 240, 323–340. [Google Scholar] [CrossRef]
- Brown, M.A.; Goel, A.; Abbas, Z. Effect of Electrolyte Concentration on the Stern Layer Thickness at a Charged Interface. Angew. Chem. Int. Ed. Engl. 2016, 55, 3790–3794. [Google Scholar] [CrossRef]
- Samson, E.; Marchand, J.; Snyder, K.A. Calculation of ionic diffusion coefficients on the basis of migration test results. Mater. Struct. 2003, 36, 156–165. [Google Scholar] [CrossRef]
- O’Reilly, D.E.; Peterson, E.M. Self-Diffusion Coefficients and Rotational Correlation Times in Polar Liquids. II. J. Chem. Phys. 1971, 55, 2155–2163. [Google Scholar] [CrossRef]
- Fawcett, W.R.; Opallo, M. The Kinetics of Heterogeneous Electron Transfer Reaction in Polar Solvents. Angew. Chem. Int. Ed. Engl. 1994, 33, 2131–2143. [Google Scholar] [CrossRef]
- Kulikovsky, A.A. Fuel cell basics. In Analytical Modeling of Fuel Cells; Elsevier: Amsterdam, The Netherlands, 2019; pp. 1–33. [Google Scholar]
- Gavilán-Arriazu, E.M.; Mercer, M.P.; Pinto, O.A.; Oviedo, O.A.; Barraco, D.E.; Hoster, H.E.; Leiva, E.P.M. Effect of Temperature on The Kinetics of Electrochemical Insertion of Li-Ions into a Graphite Electrode Studied by Kinetic Monte Carlo. J. Electrochem. Soc. 2019, 167, 13533. [Google Scholar] [CrossRef]
- Al-Zubaidi, A.; Inoue, T.; Matsushita, T.; Ishii, Y.; Kawasaki, S. Ion adsorption on the inner surface of single-walled carbon nanotubes used as electrodes for electric double-layer capacitors. Phys. Chem. Chem. Phys. 2012, 14, 16055–16061. [Google Scholar] [CrossRef] [PubMed]
- Brezesinski, T.; Wang, J.; Tolbert, S.H.; Dunn, B. Next generation pseudocapacitor materials from sol–gel derived transition metal oxides. J. Sol-Gel Sci. Technol. 2010, 57, 330–335. [Google Scholar] [CrossRef] [Green Version]
- Wang, F.; Shifa, T.A.; Zhan, X.; Huang, Y.; Liu, K.; Cheng, Z.; Jiang, C.; He, J. Recent advances in transition-metal dichalcogenide based nanomaterials for water splitting. Nanoscale 2015, 7, 19764–19788. [Google Scholar] [CrossRef] [PubMed]
Figure 1.
Potential sweep at scan rate of 50 mV/s.

Figure 2.
Concentration grid with initial and border conditions.

Figure 3.
Cobalt hydroxide nanofoam-simulated CV.

Figure 4.
Simulated concentration gradients of (a) oxidant and (b) reductant.

Figure 5.
Concentration over time for different distance planes for (a) oxidant and (b) reductant.

Figure 6.
Sensitivity analysts of CV simulation for (a) scan rate, (b) temperature, and (c) reaction rate constant.
Figure 6.
Sensitivity analysts of CV simulation for (a) scan rate, (b) temperature, and (c) reaction rate constant.

Figure 7.
Simulated capacitive contribution to CV simulation.

Figure 8.
Simulated and experimental CV curves of the cobalt hydroxide nanofoam system.

Figure 9.
Simulated CV with the presence of OER.


Table 1.
Operating conditions of simulation.
| Parameter | Definition | Value | Units | Reference |
|---|---|---|---|---|
| Number of transferred electrons | 1 | – | – | |
| Charge transfer coefficient | 0.5 | – | – | |
| Gas law constant | 8.31451 | J mol−1 K−1 | – | |
| Faraday’s constant | 96486 | C/mol | – | |
| Temperature | 298.15 | K | [20] | |
| Standard potential | 0.25 | V | [20] | |
| Minimum potential | −0.7 | V | [20] | |
| Maximum potential | 0.5 | V | [20] | |
| Scan rate | 0.05 | V/s | [20] | |
| CV duration | 24 | s | Calc. Equation (1) | |
| Electrode area | 0.154 | cm2 | [5] | |
| Mass of Co(OH)2 nanofoam | 0.01 | g | [20] | |
| Diffuse layer thickness | 0.3019 | cm | Calc. Equation (18) | |
| Helmholtz layer | cm | [21] | ||
| Time increment | 0.08 | s | Calc. Equation (12) | |
| Distance increment | 0.0062 | cm | Calc. Equation (13) | |
| Diffusion coefficient of OH− | cm2/s | [22] | ||
| Diffusion coefficient of H2O | cm2/s | [23] | ||
| Bulk concentration of OH− | 0.001 | mol/cm3 | [20] | |
| Bulk concentration of H2O | 0 | mol/cm3 | [20] | |
| Heterogeneous rate constant | 0.01 | cm/s | [24] |
Publisher’s Note: MDPI stays neutral with regard to jurisdictional claims in published maps and institutional affiliations. |
© 2022 by the authors. Licensee MDPI, Basel, Switzerland. This article is an open access article distributed under the terms and conditions of the Creative Commons Attribution (CC BY) license (https://creativecommons.org/licenses/by/4.0/).
Share and Cite
MDPI and ACS Style
Carvalho, G.G.; Eugénio, S.; Silva, M.T.; Montemor, M.F. Simulation of the Electrochemical Response of Cobalt Hydroxide Electrodes for Energy Storage. Batteries 2022, 8, 37. https://0-doi-org.brum.beds.ac.uk/10.3390/batteries8040037
AMA Style
Carvalho GG, Eugénio S, Silva MT, Montemor MF. Simulation of the Electrochemical Response of Cobalt Hydroxide Electrodes for Energy Storage. Batteries. 2022; 8(4):37. https://0-doi-org.brum.beds.ac.uk/10.3390/batteries8040037
Chicago/Turabian StyleCarvalho, Gabriel Garcia, Sónia Eugénio, Maria Teresa Silva, and Maria Fátima Montemor. 2022. "Simulation of the Electrochemical Response of Cobalt Hydroxide Electrodes for Energy Storage" Batteries 8, no. 4: 37. https://0-doi-org.brum.beds.ac.uk/10.3390/batteries8040037
Note that from the first issue of 2016, this journal uses article numbers instead of page numbers. See further details here.