


Modelling and Estimation of Vanadium Redox Flow Batteries: A Review


Institut de Robòtica i Informàtica Industrial (IRII), Centre mixte CSIC-UPC (Consejo Superior Investigaciones Científicas—Universitat Politècnica de Catalunya), Llorens i Artigas 4-6, 08028 Barcelona, Spain
*
Author to whom correspondence should be addressed.
Batteries 2022, 8(9), 121; https://0-doi-org.brum.beds.ac.uk/10.3390/batteries8090121
Submission received: 30 July 2022
/
Revised: 26 August 2022
/
Accepted: 1 September 2022
/
Published: 8 September 2022
(This article belongs to the Special Issue Feature Papers to Celebrate the First Impact Factor of Batteries)
Abstract
:Redox flow batteries are one of the most promising technologies for large-scale energy storage, especially in applications based on renewable energies. In this context, considerable efforts have been made in the last few years to overcome the limitations and optimise the performance of this technology, aiming to make it commercially competitive. From the monitoring point of view, one of the biggest challenges is the estimation of the system internal states, such as the state of charge and the state of health, given the complexity of obtaining such information directly from experimental measures. Therefore, many proposals have been recently developed to get rid of such inconvenient measurements and, instead, utilise an algorithm that makes use of a mathematical model in order to rely only on easily measurable variables such as the system’s voltage and current. This review provides a comprehensive study of the different types of dynamic models available in the literature, together with an analysis of the existing model-based estimation strategies. Finally, a discussion about the remaining challenges and possible future research lines on this field is presented.
1. Introduction
Energy production constitutes the cornerstone of the society’s economic and industrial development. During the last two centuries, fossil fuels have consistently been the main energy source because of their inherent flexibility and, originally, their high abundance [1]. However, this way of producing energy has proved to be non-sustainable, given the fast reduction of fossil fuels reserves and, especially, the grave environmental impacts originated by carbon dioxide and other pollutants emissions resulting from their burning. To confront this scenario, global efforts are being put by governments and international organisations to migrate to a new energy matrix based on renewable energies [2]. For instance, the International Energy Agency (IEA) states that the growth of renewable energy is accelerating faster than ever worldwide, expecting it to be 60% higher by 2026 in comparison to 2020 [3]. Similar predictions are shared by other reports, such as the one presented at [4], that looking further into the future, expects a use of renewable energy close to 85%.
In the traditional fossil-fuel based paradigm, the energy production can be planned and regulated in order to match the demand. In contrast, this is not possible with most renewable sources, such as wind, solar and marine, owing to their intermittent and stochastic nature [5]. Therefore, this energy transition can only be accomplished if the renewables are complemented with efficient energy storage systems (ESS) capable to balance the energy production and demand [6,7]. These could enable renewables to be the base-load of the electricity supply, eliminating grid stability concerns as well as the need of a conventional energy reserve [8,9,10]. ESS can be classified according to the way of converting energy into three main groups:
- Mechanical. These use mechanical physical principles to store the energy. The most common types are the pumped hydroelectric (PH) and compressed air (CA).
- Chemical. These use a fuel to produce energy from a chemical reaction. The traditional fossil fuels are based in this principles, as well as their renewable counterparts such as biogas or biodiesel. Although electric power can be produced from these sources, the inverse process is generally not possible.
- Electrochemical. These use different chemical species that react with an electric field, allowing the storage or delivery of energy. Within this group it is possible to find all different types of batteries such as molten salt, lithium-ion (Li-ion), lead-acid and redox flow batteries (RFB). Hydrogen technologies (HT), based on electrolysers/fuel cells are also included in this category.
In order to compare the different types of ESS named, some characteristics have been analysed, which are summarised in Table 1. This table shows some of the most important indicators for ESS, such as the power and energy density [11], lifetime, efficiency and capital cost per unit (CPU) of energy [12]. Note that, in the case of the lifetime, the time unit utilised is years. However, for batteries, the typical unit used is the number of cycles, considering as a cycle a total charging and discharging process at the operational conditions for which the battery has been designed.
As can be noticed from the characteristics presented in Table 1, the mechanical ESS have the advantage of generating high power during several hours. However, the low energy density of CA is a strong limitant in many applications, while PH depends on the existence of geographical heights and the availability of large volumes of water. For its part, hydrogen technologies, although very appealing for vehicles, are rather limited for stationary applications because of their comparatively low efficiency. Finally, the use of electrochemical ESS appear as a good choice due to their short and long-term energy discharges, high energy densities and efficiencies which make them suitable for different types of applications. Nevertheless, it should be noted that its lifetime is limited to a certain number of cycles, being the RFB the ones with the largest number of them.
Besides their long lifespan, there are other reasons that explain why RFB have become one of the most promising candidates for large-scale energy storage. The most distinctive feature of this technology is that the energy is contained in two solutions of chemical active species which are stored in two independent reservoirs, while the electric power is produced in a separate device, where the electrochemical reactions take place. Thus, the energy capacity, linked to the volume of electrolyte stored in the tanks, can be completely decoupled from the system power which is associated with the size of the electrochemical stack [14]. This confers RFB a great deal of flexibility with respect to their scalability, modular design and, if required, enables the possibility of a fast recharge by renewing the tanks content [15]. Additionally, it can be remarked their high round-trip efficiency (∼75%), fast response time, simple and safe operation, absence of environmental risks and low maintenance [16].
Considering all these characteristics related to the RFB, there is a wide variety of applications in which they can be very useful, being in particular applications the best alternative among the different ESS presented. Some specific applications in which RFB can perform particularly well are briefly described below:
- Energy management. This include the load levelling and the peak shaving processes, in which the battery is charged during low demand periods and discharged during high demand. Specifically, the objective of load levelling is stabilising the electrical load, avoiding sharp fluctuations in the consumed power. In the case of peak shaving process, the battery is in standby mode most of the time, and the stored energy is used only to remove load peaks consumption [15]. This function is essential in electric grids based on renewable energies.
- Grid stabilisation. In combination with other ESS such as supercapictors, the RFB can be utilised to create hybrid systems able to quickly release and absorb active power within tens of milliseconds. Thus, it can be employed to improve the power quality by participating in the sag compensation, power smoothing, and voltage and frequency regulation processes. This guarantees that the power quality meet the requirements, and thereby provides stability to the grid [17,18].
- Backup power in critical applications. In those applications where it is critical to guarantee an uninterrupted supply of energy (e.g., hospitals), RFB can be used as a backup energy system when the main power source fails. This is possible thanks to their very low self discharge rate when they are in standby mode and the pumps are shut down [14,19].
- Buffering in electric vehicle charging station. The steep growth in electric vehicles proportion, together with the development of fast charging technologies of over 100 kW is coupled with some challenging issues [15]. In particular, the high power demand may cause grid instability and, in addition, the cost of the transformers for the interconnection with the fast charging station can be very high. However, as the peak power is only reached during relatively short time windows, the utilisation of redox flow batteries as a buffering module becomes an appealing possibility [20]. In this hybrid topology, the battery would gradually store energy during low-demand periods and release it in load peaks. As a result, the interconnection cost would be substantially reduced and, furthermore, the RFB could be also used to improve the quality of the grid power during low demand.
- Powering electric vehicles. Although the use of RFB in mobile applications is limited by their low energy density, they are well suited to be used in applications where weight and autonomy are not an issue, such as in urban electric buses [21,22]. Furthermore, in the future, high energy density RFBs could be competitive for powering a broader range of electric vehicles, with the particular advantage that, if necessary, they could be fastly recharged by renewing the tanks contents [23].
- Dual redox flow batteries for hydrogen production. The development of new technologies of RFBs gives the opportunity to create extended topologies that include a hydrogen production module. In these systems, the RFB active species may not only be used in the energy storing process but also as a reactant in a hydrogen production catalytic reactor. This concept has several advantages over conventional electrolysis in terms of safety, durability, modularity, and purity, and may be specially interesting in certain applications such as a combined electric/fuel cell vehicles charging station [24].
There are different types of redox flow batteries, which can be classified depending on the chemical composition of the active species of electrolytes. The pool of possible electrolyte chemistriesis practically unlimited, and several options have already been tried, ranging from the classic chromium-iron RFB, discovered in 1973 [25] to the recently developed of organic base [26], such as sulfonate viologen, going through the vanadium redox flow batteries (VRFB) invented by Professor Skyllas-Kazacos in 1983 [27]. A comparison of some of the different types of RFB in terms of maximum cell voltage, power and energy densities and lifetime in number of cycles is presented in [28], being summarized in Table 2.
From the different alternatives developed so far, the VRFB are considered to be the closest to reach a commercial success. The main advantage of this particular technology is that, as the active species in both tanks are based on vanadium, degradation problems associated to the electrolyte cross-contamination are prevented which, in turn, results in a very long lifespan of 10,000–20,000 charge/discharge cycles [38]. The same property is exhibited by the iron-iron RFB, but compared to the VRFB, the other performance indicators have lower values. Thus, although organic and zinc-bromine RFBs have better performance in terms of cell voltage and power and energy densities compared to VRFB, their useful life is much shorter, which can be translated into higher long-term costs [16]. Considering these aspects, the VRFB is the most used and studied, being the protagonist of the vast majority of works related to redox flow batteries and cited in this review. For this reason, from this point on, no further distinction will be made between the different types of RFBs, considering always the case of the VRFB for discuss all properties and important aspects. However, it must be remarked that, as the fundamental principles of the majority of RFB technologies are essentially the same, most of the analysis and formulations presented hereafter can be readily extended to other RFB systems.
Redox flow batteries auspicious prospect has motivated many efforts to make them commercially competitive compared with other mature technologies, such as Li-ion and lead-acid batteries. To this end, research is being conducted to reduce the cost of RFBs systems, as well as to improve their efficiency, reliability and service life. In particular, a great deal of the current work is focused on the development of materials with enhanced properties to be used as membranes, electrodes and, especially, new electrolyte chemistries (both active species and additives) to achieve lower costs and higher energy densities [39,40,41]. Furthermore, new flow fields and patterns [42], as well as stack-level structures and configurations [43], are being designed and tested to improve the hydraulic and electrochemical performance of the system.
Another hot research topic is the system modelling and monitoring [44]. In order to manage the RFB operation properly, the knowledge of the battery internal information is of paramount importance. However, some of the most relevant variables, such as the State of Charge (SoC) and State of Health (SoH), cannot be directly measured in a simple way. Traditional approaches based on experimental measures, such as UV-vis spectroscopy analysis and conductivity measurements require the installation of additional sensors to the system which, in turn, increases the cost and complexity of the facilities [45]. Additionally, these direct measures usually require large amounts of experimental data under every possible operating condition and, moreover, need to be periodically re-calibrated in order to avoid error originated by drifts in the sensor or changes in the electrolyte properties. To overcome the limitations of experimental based measures, the alternative is to utilise algorithms capable to infer the internal states of the battery, only from easily measurable variables such as the current and the terminal voltage [46]. As a result, numerous methodologies have been developed in recent years to indirectly estimate the RFB internal states. These methodologies typically involve two steps [47]. The first step is to define a mathematical model capable to describe, with sufficient accuracy, the behaviour of the RFB system. The second step is to implement an estimation algorithm in order to process the measured data and determine the battery parameters and states.
The information obtained through the estimation algorithms is not only necessary to monitor the battery status, but is also needed to develop advanced automatic control setups to optimise the performance and extend the lifetime of RFB systems. However, given the intrinsically non-linear nature of RFB, together with the multiplicity of variables and phenomena involved in their operation, flow batteries’ estimation remains an open challenging field with plenty of problems that still need to be worked out. Therefore, the design of new estimation strategies is essential for the viability of RFB technologies.
In spite of the growing interest and dynamism of VRFB state and parameter estimation, to the authors knowledge no work has yet been published dedicated to organise and analyse the existing literature on the subject. Therefore, this review aims to fill up this gap, providing a valuable tool for those willing to implement any of these algorithms, on the one hand; and for those interested in improving the existing state of the art, on the other. The remaining of this paper is organised as follows: Section 2 provides a general description of a VRFB system; Section 3 presents the models that represent the behaviour of a VRFB available in the literature, specially focusing on those suitable for estimators design; Section 4 systematically analyses the existing model-based methodologies for estimating the battery State of Charge, State of Health and other internal parameters; and, finally, Section 5 presents the conclusions and discusses the current challenges in the field, aiming to orientate future research lines.
2. System Description
This section addresses the main characteristics of a vanadium redox flow battery system, to facilitate the understanding of the next modelling and estimation sections. First of all, the fundamental components and general working principles of VRFB are described. Afterwards, the main side reactions that can damage the system, reduce its efficiency and lifetime and, especially, provoke a condition known as electrolyte imbalance are introduced. Then, it is presented the sizing of a VRFB in terms of power and energy and, finally, the main indicators that permit to characterise and monitor the behaviour of the battery are defined.
2.1. General Working Principles
In VRFB, the energy is provided by the electrochemical redox reaction between vanadium ions with four possible oxidation states. These, in turn, are found dissolved in a sulphuric acid solution known as electrolyte. The function of the sulphuric acid is to enhance the solubility of vanadium species, on the one hand, and to provide the protons that allow to conduct the electric current in the cells and to balance the main reactions of the battery, on the other. The system is divided in a “negative side”, where the electrolyte (anolyte) contains and , and a “positive side”, where the electrolyte (catholyte) contains and (the latter in the form of the oxides and , respectively) [23]. Normally, a VRFB system is integrated by, at least, three essential components: a pair of tanks where both electrolytes are stored; an electrochemical stack responsible of producing the electric power; and an hydraulic subsystem in charge of the electrolytes flow between the previous components [39]. An schematic representation of a VRFB system is presented in Figure 1.
When the battery is operating, the electrolytes are pumped from the tanks to the electrochemical stack where the electron transfer reaction takes place. Specifically, the reaction occurs at the surface of the electrodes, which are typically a porous material made of carbon fibres. Within the stack, both electrolytes are kept separated by a proton exchange membrane that allows the passage of protons in order to close the circuit internally, hence keeping the electrical neutrality of the solutions [48]. As the electrolytes flow through a closed circuit, once they leave the stack they are reintroduced to their respective tanks. In order to achieve greater voltages and power, it is common practice to arrange several cells in series to conform a stack. In such case, each cell is separated from the other by a bipolar plate which is also responsible of providing structural support to the stack and electrical connection between adjacent cells [49]. The electrons released in the eletrochemical reaction are collected in the current collectors located at the end cells of the stack, which are connected to the power load/source. The battery operation is reversible so, when an external voltage is applied, the reaction proceeds in opposite direction regenerating the reactants consumed during the discharge.
The main reactions that take place at the surface of the electrodes are the following (note that the are provided by the sulphuric acid present in the electrolyte):
The amount of energy stored in the system is directly related to the volume of electrolyte in the tanks and the concentration of the vanadium “charged species” ( and ). Evidently, charged species concentrations will increase during charge operation and decrease during discharge. Due to limitations in the vanadium solubility, the total vanadium concentration in each electrolyte rarely exceeds 2 M [50].
2.2. Side Reactions and Electrolyte Imbalance
Besides of the fundamental working principles described in the previous subsection, in VRFB there exist other undesired processes that occur at a lower pace, but may have a strong influence in the system’s performance. These processes are typically caused by imperfections in the membrane, that allows a passage of small amounts water and vanadium, or by side reactions, i.e., reactions that take place at the same time as the main reaction, but at a lesser extent, as illustrated in Figure 2. These undesired processes include:
- 1
- Vanadium ions crossover. Despite the membrane is ideally only permeable to protons, in practice it can also be crossed by small amounts of vanadium species [51]. After crossing the membrane, and species become very unstable in the positive half cell, while the inverse occurs to and in the negative one. Therefore, once these ions reach the opposite half cell, they tend to react very fast with other ions present in the electrolyte. These chemical reactions are assumed to be instantaneous, and proceed as follows [52]:If the flux to the positive half cell is exactly compensated by the flux to the negative one, the crossover is said to by symmetric, and its only effect is to accelerate the electrolyte self discharge. However, in practice, crossover will be generally asymmetric, thus leading not only to self discharge, but also to a build up on one of the electrolytes and a dilution on the other. Although the direction of this mechanism depends on several factors such as the operating conditions and the membrane composition, typically, the net vanadium flow is from the negative to the positive half cell [53].
- 2
- Water transfer. In certain cases, the water may also cross the membrane from one half cell to the other due to several driving forces, such as diffusion, osmosis, electro-osmotic drag and hydraulic pressure difference [54,55]. This may lead to a net volume change of the battery’s electrolytes. Less likely, the evaporation of water from the tanks can also contribute to a change in the electrolyte volume.
- 3
- Gas evolution side reactions. These side reactions occur at the surface of the electrodes, when the supposedly inert support electrolyte (particularly, water and protons), starts participating in the electron transfer reactions generating gaseous products, competing with the redox reaction of the vanadium species. The most common gassing reaction is the hydrogen evolution, that takes place during charging at the negative electrode [56,57]. In this case, the electrons are taken by the protons which get reduced to gaseous hydrogen (see Equation (5)). Since a fraction of the current destined to charge the anolyte is captured by the protons, the reduction of at the negative electrode becomes slower than the oxidation of at the positive one. Hence, the concentration in the catholyte becomes lower than the in the anoloyte, causing electrolyte imbalance. Additionally, this process may have other serious consequences, such as the corrosion of the carbon electrodes [58] and the bipolar plates [50,59]. The other gassing side reaction is the oxygen evolution at the positive electrode [60] (see Equation (6)), which has similar effects to the hydrogen evolution although its occurrence is comparatively less frequent.
- 4
- Air oxidation. When the negative electrolyte tank is exposed to the atmosphere, oxygen present in the air tends to dissolve in the liquid and produce the oxidation of to [61].Consequently, in order to prevent this phenomenon, it is essential to keep the negative electrolyte tank isolated from the atmosphere. This protection can be also attained by periodically purging the electrolyte with an inert gas, such as nitrogen [62].
- 5
- Vanadium precipitation. All vanadium ions present in a VRFB may precipitate as a result of employing an excesively concentrated solution or because of thermal inestabilty. Vanadium precipitation does not only reduce the available active species of the system but, more importantly, also may block the electrolyte channels and damage the membrane, seriously affecting the performance of the VRFB [63]. It has been found found that is the most unstable among the four species, and has a strong tendency to form solid when the temperature surpasses 40 °C [53], as expressed in Equation (8). On the contrary, the remaining of the vanadium ions tend to precipitate in the form of sulphates when the operating temperature is below 5 °C [50,64]. Therefore, to prevent vanadium precipitation the system temperature should be kept within the range 5–40 °C.
- 6
- Solid components corrosion. The strongly acidic nature of the electrolyte together with the oxidising nature of the make VRFB medium highly corrosive [49]. This forces the utilisation of carbon based electrodes and bipolar plates rather than metallic ones, as well as a particularly chemically stable membrane. In spite of utilising these resistant materials, VRFB components corrosion has been often reported, especially when the system is subjected to overcharging [53].
One of the most important consequences of the aforementioned processes is the electrolyte imbalance. In principle, vanadium redox flow batteries are expected to be balanced, i.e., that the liquid volume in both tanks is the same and concentrations of and in the negative electrolyte are equal to the concentrations of and in the positive electrolyte, respectively. However, these undesired processes have a cumulative effect that may generate electrolyte imbalance over extended charge-discharge cycling.
Electrolyte imbalance is a serious issue for redox flow batteries because it undermines the system performance, leading to capacity loss and, when unnoticed, even more severe consequences such as electrodes corrosion or membrane damage [46,54]. Consequently, understanding the multiple causes of this phenomenon is important not only to recognise and mitigate the main mechanism that is causing the problem but also to determine the best way to recover the electrolyte. Processes 1 and 2 cause what it’s commonly known as “stoichiometric imbalances”, which can be addressed in a relatively simple way by remixing the electrolytes of both reservoirs, thereby equalising the vanadium concentrations and liquid levels. Conversely, imbalances associated to mechanisms 3 and 4, commonly known as “faradaic imbalances”, can only be corrected by means of more complex chemical or electrochemical methods [51]. The difference between these two kind of imbalances is explained by the fact that the former mechanisms do not alter the original average oxidation state of the electrolytes (often referred to as ), while the latter produce a net shift towards a lower (oxidative imbalance) or higher (reductive imbalance) oxidation states [55]. As for the mechanisms 5 and 6, they typically do not occur during the VRFB normal operation and, when detected, specific measures aiming to solve the underlying cause must be taken.
Given the negative consequences of electrolyte imbalance, it is crucial, in first place, to design a proficient management system to mitigate, as far as possible, the progression of this phenomenon [51]. Secondly, as electrolyte imbalance cannot be completely eliminated even when the VRFB is correctly operated, it is also essential to develop a methodology that permits to rapidly detect and quantify the imbalance and its causes [65]. Finally, a smart strategy to restore the imbalanced electrolyte is required [55,66].
2.3. Sizing
Being the modularity in terms of power and energy the main property of a RFB, it is important to clarify on which parameters and variables they depend.
- Power. It depends exclusively on the current flowing through the cell from the current collectors, and the voltage generated between these plates. Therefore, power only depends on the cell-stack properties.The current is directly related with the area of the electrodes, and the current density that go through them, being computed as:where I is the current, the electrode area and j the current density.It is straightforward to see that in order to increase the current, there are two possibilities. On the one hand, make greater the area of the cell, which will lead to higher costs due to the materials. On the other hand, increasing the current density seems to be the optimal solution as it does not have associated costs of any kind and the cell does not need to modify its size. However, high current densities lead to less efficient behaviour of the battery and reduce the lifetime [67]. Typical values of current densities are ranged between 100 and 400 mA/cm with energy efficiency ranging from 82% to 88% [68]. Other studies have shown that for current densities of 200, 400 and 600 mA/cm the energy efficiencies obtained are 91.98%, 86.45% and 80.83%, respectively [69], where it can be clearly appreciated the negative effects of operating at high current densities.The voltage depends on the nature of the RFB species, as well as other variables such as the temperature and current in the cell. Its calculation is discussed in detail in Section 3.2, where the the expression to compute the voltage of a single cell is derived. Once the voltage of a single cell is known, it is possible to compute the voltage of the stack, namely , as:where is the cell voltage and n is the number of cells that compose the stack. Considering the VRFB as the case of study, the experimental value found in the literature for achieves a maximum 1.7 V for a charging process, going down to a minimum of 0.8 V for a discharging one [70].Therefore, considering (9) and (10) it is possible to determine the power as:
- Energy. It depends exclusively on the amount of electrolyte stored in the system and its concentration. Taking into account that the tanks are much larger in size compared to the cell, the latter contribution can be generally neglected.Beginning from the definition of electric energy as the product between the potential difference and charge, it is possible to obtain the following expression:where is the energy and is the charge inside the tanks, that can be computed as:being the electrolyte tank volume, F the Faraday constant and the vanadium concentration.As the total energy is divided in the two tanks, if they are considered of the same size, its value can be calculated in Joules as:or in the most common unit of energy in Wh as:It is obvious by looking expression (15) that the energy can be selected by choosing the volume of the tanks and the total vanadium concentration. It is important to remark, that as have been previously explained, due to the limitations of vanadium solubility, can not exceed 2 M. For this reason, the tank volume is the parameter that has to be designed according to the desired energy capacity.The energy density can be obtained directly from Equation (15) dividing by two times the volume of each tank. Theoretically, it is possible to calculate the energy density of a RFB if all parameters and variables are known. Thus, considering as a cell voltage the maximum value, = 1.7 V and a total vanadium concentration of 2 M, the energy density obtained is 53.51 Wh/L. However, the battery can not operate at maximum voltage, so most works consider an average value of 1.35 V obtaining an energy density of 36.12 Wh/L [71]. Moreover, it is important to remark that expression (15) is related with the energy stored in the electrolyte, but in order to compute the ones of the complete battery some factors must be considered as for example the energy consumed by the pumps or the external and internal losses in form of side reactions or overpotentials. Considering all these aspects, the real values of energy densities for VRFB are close to 25 Wh/L [72].
2.4. Indicators
Like any other type of battery, RFB have different indicators that allow to describe their behaviour. There is no universal consensus regarding the formulation of most of these indicators, being in many cases simplified to facilitate their computation. The aim of this section is to present the most important ones [46].
- Charge (). It is the electric charge the battery can provide, starting from a not necessarily fully charged initial condition, if it is operated during a time until it gets fully discharged:
- Charge capacity (). It is the electric charge the battery can deliver from fully charged, if it is operated during a time until it gets fully discharged:
- Nominal charge capacity (). It is the original charge capacity of the battery, i,e., a reference value that assumes that it has not experienced any degradation or capacity loss.
- State of Charge (SoC). It is an index that is typically defined as the ratio between the electric charge stored in the battery (Q) at a specific time and the total battery capacity (), as expressed in Equation (18). Note that the maximum electrical charge that the battery can deliver when fully charged, , may vary over extended cycling as a consequence of electrolyte imbalance or other degradation phenomena and, consequently, needs to be differentiated from its nominal value .As previously said, the electrical charge stored in a VRFB system depends on the amount of vanadium charged species present in the electrolyte. Therefore, an equivalent concentration-based definition for the SoC can be derived. Assuming that the battery is balanced, the resulting equation for the SoC in terms of the vanadium species concentrations is:where is the concentration of vanadium species V. When the VRFB suffers from electrolyte imbalance, Equation (19) is no longer valid, and it becomes necessary to define a different SoC for each half-cell electrolyte:
- State of Health (SoH). It is a figure of merit that compares the battery condition at a specific moment with the ideal one corresponding to a new or nominal battery. Depending on what aspect of the battery’s degradation is being considered, different definitions may be given for the SoH. The most popular one is related to its maximum capacity [73]:where is the critical (or minimum acceptable) capacity value.Another possibility is to express the SoH in terms of the increase of the battery’s internal resistance, as follows [74]:where is the nominal internal resistance, corresponding to a new battery, and is the end-of-life internal resistance ( depends on the specific application, but it is usually 60% higher than ) [75].
- Coulombic efficiency (). It is the ratio between the electric charge the battery can provide in discharge and the charge received during charging, in a complete cycle:
- Voltage efficiency (). It is the ratio between the average voltage the battery provides, for a certain current, in discharge and the voltage received during charging, in a complete cycle:where E is the battery voltage that can be computed for the case of a single cell with or with for the case of a stack with several cells.
- Energy efficiency (). It is the ratio between the energy the battery can provide in discharge and the energy received during charging, in a complete cycle. Therefore, it can be computed by means of the integral of the power as:where P is the battery power, which can be computed as the product between the current and voltage. Assuming that the current is constant, it is possible to redefine the computation of in terms of previous coulombic and voltage efficiencies:
3. Vanadium Redox Flow Battery Dynamic Modelling
The starting point to address an estimation problem is to develop a mathematical model capable to accurately represent the behaviour of the essential variables of the system. It must be highlighted that modelling is not only a necessary step to develop these strategies, but also constitute a useful-often indispensable-tool to simulate the dynamic behaviour of the system, that may be used to complement and interpret the more costly and time-consuming laboratory analysis [6,48]. Additionally, these models provide an adequate framework for comprehensive understanding of the underlying theoretical and working principles of complex systems that involve many interrelated phenomena, such as the VRFB [48].
There is not a single nor a best way to model a VRFB. On the contrary, there exist many ways to model the behaviour of the system depending on which components are being considered and the level of detail with which those components need to be analysed. In general, observation and automatic control theory require the models to be dynamic, i.e., that comprise a set of equations that include time derivatives of the system variables to represent its time evolution.
Probably, the most convenient way to classify VRFB models is between Distributed Parameter Models (DPM), if they consider a spatial distribution of the system variables and parameters, and Lumped Parameter Models (LPM), if they concentrate all the information of the system into a set of discrete entities with uniform properties [44]. In addition, the latter are subsequently classified in electrochemical models, if their equations are derived from the physics of the system, and electric equivalent circuit models, if the system is represented with an electric circuit that behaves similarly to the real plant.
As a general reflection, the more complete the model is, the greater the level of details that can be achieved but at the expense of dealing with a more complex and time consuming model. Therefore, although DPM are the most faithful in terms of their representation of the real system and constitute powerful tools for design purposes, they are difficult to be handled, and usually cannot be easily adapted to be used in most control and estimation approaches. Conversely, LPM are much simpler and thus normally well suited to be used in the design of control and estimation strategies if all the essential phenomena are included.
3.1. Distributed Models
Distributed models attempt to represent, in a comprehensive way, the behaviour of the real system by considering the spatial distribution of its variables and parameters. Although they may be unsuitable to be directly employed in the development of estimation and control strategies, they contribute to interpret the physics of the system, and constitute the base for the simplified lumped parameter models.
The wide majority of VRFB distributed parameter models developed up to now are focused on the electrochemical stack. This is reasonable because, as the chemical reaction takes place in this component, its processes are the most determinant in the overall system performance, as well as the most complex to be analysed. In general, VRFB electrochemical models rely on a series of balances of mass, momentum, charge, energy and chemical species that describe the relationship between the different phenomena that occur inside the stack. Therefore, a brief summary of the governing equations that build up a DPM of a VRFB is presented and discussed below.
- Continuity Equation. Expresses the electrolyte mass conservation at every position of the system, under the common assumption that the fluid is uncompressible, i.e., that its density is constant [76].where is the velocity of the electrolyte.
- Dracy’s Law. It is a simplification of the more complex Navier-Stokes equation, that is applicable for porous media such as the electrodes of the VRFB. Specifically, it is utilised to represent the momentum conservation of the electrolyte, relating its velocity at every point in a linear law with the pressure gradient [77].where p is the liquid pressure, is the liquid viscocity, is the electrode porosity, is the mean pore diameter and K is the Kozeny-Carman constant for a porous medium.
- Nernst-Planck Equation [78]. It permits to express charged chemical balances in a fluid medium. In a VRFB, it is utilised to describe the protons and vanadium species balances in the electrolyte. In certain cases, it has also been utilised to express the motion of these ions in the membrane, accordingly adjusting the values of the phisicochemical constants [76].where , , and are the concentration, the effective diffusivity, the ion charge and the stoichiometric number of the species i, respectively; and T is the temperature, is the ionic potential of the electrolyte, F is the Faraday constant, and j is the current density.On the left hand of the Nernst-Planck equation, the first term stands for the accumulation of species i. The second term represents the convective transport due to the electrolyte flow; the third one represents the diffusive transport caused by the gradient of species i concentration; and the fourth one represents the migration caused by the electrical potential gradient. The right side of the equation contains the source term, originated by the consumption or generation of species i as a consequence of the electrochemical reaction.It is usually assumed that the Bruggemann correction is valid to derive the effective diffusion coefficient from the free-space value :Additionally, presents a positive dependency with the temperature, which is given by the Arrhenius Equation [79]:where A and are two physicochemical constants, called the Pre-exponential Factor and the Activation Energy, respectively.
- Electroneutrality. Expresses that the charge of the electrolyte must be strictly equal to 0 at every point of the space, and it is usually employed to obtain the value of the concentration [77].
- Charge conservation. Expresses that, at the porous electrodes, the charge leaving the solid phase is equal to the charge entering the electrolyte .In turn, the total current density in the electrolyte can be obtained by combining the Equations (30) and (33), and summing for all species [77]:where is the effective electrical conductivity of the electrolyte that can be calculated by:
- Thermal balance. Describes the temperature variation and its distribution along the porous electrodes, taking into account the heat generation and its transference [80].where is the especific heat capacity of the electrolyte and and are the volume-averaged thermal conductivity and thermal capacitance, respectively. are the heat generation terms, originated by the electrochemical reaction, side reactions, and voltage and hydraulic losses. In many applications, when the produced heat is not significant, it is common practice to assume that the VRFB operates isothermically. Therefore, if the variation of temperature across the electrochemical stack is neglected, the energy balance can be omitted.
The former set of equations constitute the core of the distributed model formulations. In order to be employed in simulation they need to be coupled with boundary and initial conditions such as those presented in [77,81,82,83,84]. Moreover, additional work has been conducted to enhance DPM to include other relevant phenomenons. For instance, Shah et al. [57] and Al-Fetlawi et al. and [60] developed models that include the hydrogen and oxygen evolution at the electrodes, respectively. These models include the electrochemical kinetics of these side reactions and significantly increase the complexity of the approach, by considering a liquid-gas multiphase system. Likewise, Delgado et al. [78] have expanded the model by considering the differences between the cells that comprise the stack, hence predicting the bypass currents that flow through the electrolyte manifolds commonly known as shunt currents.
Other authors, have focused their work in adapting the conservation Equations (28) to (44) to analyse membrane phenomena such as the Donnan potential originated by the difference of concentrations in the positive and negative electrolytes [85] or the multiple water transport and vanadium crossover mechanisms [76,82,85,86]. The inclusion of explicit dependencies of the system parameter on the temperature and concentration is another aspect that received much attention in the DPMs. In [81] the effects of the temperature and concentration on the ion mobility is analysed, while in [64] a distributed model is utilised to predict the possibility of vanadium precipitation under low temperature operation conditions.
On the other hand, research has also been conducted in the opposite direction: instead of introducing more phenomena to increase the accuracy of the model, they attempted to simplify it to obtain equations that could be handled more easily [87]. With this aim, in [83,84] some assumptions are made to find analytical solutions to the mass and charge balances. Some proposals have also been made aiming to reduce the original DPM to a 1D plug flow model that neglect any variations but those in the flow direction [88,89]. Conversely, other authors have utilised 1D models that only consider gradients in the direction perpendicular to the membrane [90,91,92].
3.2. Cell Voltage
The cell voltage () of an electrochemical cell can be calculated as the sum of an open circuit voltage (OCV) and a series of overpotentials, which represent the deviation with respect to the OCV originated by the passage of electric current [93,94] (see Equation (38)). Evidently, the effect of the overpotentials will be to reduce the when the battery operates in discharge mode, and increase it when charging. This means that the voltage required to charge the battery will be higher than the voltage that provides the battery in discharge, consequently reducing the energy efficiency of the VRFB.
where is the real voltage of the electrochemical cell, is the open circuit voltage, is the overpotential associated to ohmic resistances of membrane, the electrolyte, the porous electrodes and the current collector; and and are the overpotentials associated to the electrochemical reaction that takes place at the positive and negative elctrode, respectively. The sign of the overpotentials is positive in charge and negative in discharge. As previously discussed, in applications that require stacks of n cells in series, assuming that all of them behave exactly the same, the open-circuit voltage of the stack is straightforwardly given by (10).
The OCV is calculated by means of the Nernst Equation:
where is the standard cell voltage, is the concentration and are the activity coefficients of the species involved in the reaction. With respect to the vanadium species concentrations () it is normally used an average value between the inlet cell concentration () and the outlet cell concentration () [95]:
In practice, activity coefficients are very difficult to be evaluated. Then, by assuming they remain approximately constant throughout operation, Equation (39) can be reduced to a simplified version where is replaced by a nominal voltage () that groups all the constant terms in (39), whose value is approximately 1.35 V [96]:
Some authors also consider the protons concentration constant, thereby incorporating their effect in () [95]. Other authors have proposed to take into account the Donnan potential, that appears in the membrane when the concentration of protons in the catholyte and anolyte differ [97]. Then, Equation (41) can be reformulated as:
where and are the the concentration in the catholyte and anolyte sides, respectively.
The voltage drop can be calculated by summing the effects of the different elements that make up the electrochemical cell:
where , , and are the thicknesses and , , , are the electrical conductivity of the membrane, the current collector and the electrolyte/porous electrode of the negative and positive half cells, respectively. Alternatively, these ohmic effects can be combined in a single equivalent resistance, .
The overpotentials and are given by the Butler-Volmer Equation (44) [78]. This equation takes into account the combined effect of the activation and concentration overpotentials. The first one is associated to the mass transport resistance that leads to a reactant depletion and a product accumulation next to the electrode’s surface described by Equation (45), whereas the second one is linked to the energy required to produce the charge transfer reaction on the active sites of the electrode. Note that the Butler-Volmer equation is implicit in .
where are the reaction rate constants and is the charge transfer coefficient of the reaction. The Butler-Volmer equation takes into account the possible concentration difference between the bulk electrolyte () and the surface of the electrode () as a consequence of mass transfer resistance. It is assumed that this difference occurs in a thin layer next to the electrode’s fibres surface and follows a lineal law, governed by the mass transfer coefficient of species i, [35]:
Under certain assumptions, Murthy et al. deducted expressions that decouple activation and concentration contributions of the overpotentials and [98]:
For during charging, the negative sign holds and species i represents , whereas the positive sign holds and species i represents during discharging. Equivalently, for during charging, the negative sign holds and species i represents whereas the positive sign holds and species i represents during discharging. For its part, represents the difference between the bulk and the surface concentration () and is obtained from Equation (45): .
Other authors use more drastic simplifications of the Butler-Volmer equation. For instance, in [99,100], the activation component is combined with the ohmic overpotential by defining an equivalent resistance that takes into account both effects. Then, they use a simplified expression for the concentration overpotential in each half cell:
where is the limiting current density (i.e., a theoretical maximum) for a certain concentration of reactive :
Other authors neglect the effects of mass transport resistance, and consequently the term of the Butler-Volmer Equation (44) becomes equal to 1 for all species [93]. Consequently, and can be computed in the way presented in Equations (46a) and (46b). Moreover, for high values of overpotentials, the Butler-Volmer equation for each electrode reaction can be further simplified to an expression known as Tafel equation [72]:
where and are the reduced and oxidised species of the redox couple, respectively.
Finally, it’s worth mentioning that the relative contribution of each overpotential to the total voltage drop may vary with the operating conditions. In general, activation overpotentials are dominant for very low current densities, while ohmic losses prevail in a wide range of intermediate current densities. For its part, concentration overpotential become much more relevant when the current is high or the battery is reaching the end of a charge-discharge cycle, as under these conditions the factor (equal to ) tends to be much lower than 1 for the reactants. The described situation is qualitatively illustrated in Figure 3.
3.3. Vanadium Species Balances
In this subsection, the LPM that describe the evolution of the active species concentrations of a VRFB system are presented. These models neglect space variations by considering a discrete set of subsystems with uniform properties. In general, for VRFB these subsystems are the electrolyte tanks and the electrochemical stack.
The first LPM models developed for redox flow batteries were developed by Li et al. [101] and Shah et al. [94]. Although these models accounted significantly well some relevant phenomena of the VRFB, they neglected a critical aspect of these batteries: despite the membrane is supposed to be permeable only to protons, small amounts of vanadium species can also cross the membrane, as discussed in Section 2.2. The first model to take crossover processes into account was presented by Skyllas-Kazacos et al. [52]. Since then, this model has been the most commonly used to describe the time evolution of vanadium species in a VRFB system. The model was completed by Li et al. [102] by introducing a term to describe the oxidation with atmospheric oxygen that may suffer the present in the negative electrolyte reservoir, as introduced in Section 2.2.
The vanadium species balances proposed by Skyllas-Kazacos, with Li’s contribution are the following:
Note that the molar flow of species i through the membrane () does not only appear in the dynamic equation of that species, but also in the dynamic equations of the species present in the opposite half-cell. This is explained by the fact that, as introduced in Section 2.2, and species are very unstable in the positive half cell, while the inverse occurs to and in the negative one. Therefore, after reaching the opposite half cell, the vanadium species react with other vanadium ions according to Equations (1)–(4), further affecting the species mass balance.
The molar flux through the membrane is a rather complex factor, as it is affected in a non linear way by the operating conditions, variables and parameters of the stack. The main mechanisms that produce a crossover of vanadium species are: diffusion, caused by the gradient of species i concentration; migration, caused by the electrical potential gradient that appears when there is a net current in the cell; and convection, caused by a net flow of electrolyte through the membrane, and can be easily visualised in the distributed Equation (30). Under certain assumptions, Darling et al. [103] provide an analytical solution for that takes into account the three mechanisms, obtained by integrating the Nernst-Planck equation in the membrane. A slightly improved version of this expression that explicitly distinguishes the direction of the flux is presented in [99] (see Equations (54)–(56)).
- When convection and migration are in the same direction with diffusion:
- When convection and migration are in the opposite direction with diffusion:
Note that diffusion always proceeds in opposite direction to the concentration gradient, i.e., and go from the negative half cell to positive one, and the other way round for and . Conversely, the direction of migration and convection depend on the sign of the electric current. In discharge mode, the electric current goes from the negative electrode to the positive one which requires to be compensated by a ion flux through the membrane to keep the electroneutrality (see Figure 1). Therefore, as all the vanadium ions have a net positive charge, for and the migration and convection flux go in the same way as diffusion as described in Equation (54), while for and migration and convection are opposed to diffusion and the equation to be applied is (51). In charge mode, the electric current goes from the negative electrode to the positive one and, accordingly, the situation is inverted.
It is also important to remark two additional aspects regarding . Firstly, it must be stressed that the effects of migration/convection are present even when they flow in the same direction to the concentration gradient (e.g., in charge mode there will be migration of from the positive to the negative electrolyte). This may seem impossible, as each vanadium species are only present in one of the half cells (e.g., concentration is 0 in the catholyte). However, as Equations (54) and (55) come from integrating the distributed Nernst-Planck equation in the membrane and within the membrane the four vanadium species may be present, it is possible to interpret that in this case the effect of migration/convection is to diminish diffusion. Secondly, a qualitative difference can be highlighted between the processes of diffusion, on the one hand, and convection/migration, on the other. While the former is only proportional to concentration gradients, the latter also depend on the electric current. When migration/convection mechanisms are not being considered, the expression for gets reduced to a purely diffusive expression (see Equation (57)) but, as a consequence of the previous analysis, this is only strictly true when I is equal to 0.
Another aspect that may be taken into account in the mass balances are the gassing side reactions described in Section 2.2, particularly, the hydrogen evolution. To obtain the reaction rate of the evolution, a Butler-Volmer equation equivalent to that presented in Section 3.2 for the vanadium species can be formulated which, in turn, can be simplified to a Tafel expression [57].
where is the exchange current density, is the transfer coefficient and is the overpotential of the hydrogen evolution reaction. Then, given that the potential difference between the solid and the liquid at the negative electrode is unique and can be computed either by considering the main reduction reaction or the undesired hydrogen evolution, the following equality holds:
where and are the Nernst potentials of the and the reduction reactions, respectively: and ranges from 0 to +0.1 depending on the protons concentration.
By solving Equation (59), the can be obtained and then replaced in Equation (58) to obtain the hydrogen evolution rate . Then, the current can be computed. As this reaction competes with the reduction of , it must be subtracted from the electrochemical reaction terms of Equations (50a) and (51a), and the effective electric current in these equations becomes: .
It is worth mentioning that the electrochemical reduction of is thermodynamically favoured over the main reduction and is only limited by the very low values of . Therefore, it is very important to prevent operating the VRFB in conditions that produce very high , which is more likely to occur at high currents and SoC.
3.4. Thermal Model
Thermal effects in flow batteries are not as significant as in other devices that have similar operating principles, such as fuel cells. Therefore, in many cases it is possible for them to operate at room temperature without resorting to temperature control strategies.
However, temperature has a substantial influence in some of the most important phenomena that take place in the system [104]. Firstly, as already stated, it affects the voltage of the system by means of the Nernst equation. Secondly, it strongly influences the internal resistance of the VRFB, by increasing the electrode and electrolyte conductivity and the constant k of the Butler-Volmer equations, hence reducing the overpotentials and increasing the voltage efficiency . Furthermore, electrolyte viscosity also reduces with temperature, which means that a lower pump power will be required if the VRFB is operating at higher temperature. On the other hand, it was found that a high operating temperature increases the permeability of the vanadium ions in the membrane [79] resulting in a higher crossover, and accelerates the reaction rate of the undesired hydrogen and oxygen evolution side reactions [105].
The thermal stability of the electrolyte is another key aspect that must be taken into account. As discussed in Section 2.2, precipitates if the temperature rises above 40 °C whereas, on the contrary, the remaining ions may precipitate when the battery operates below 5 °C. Given the serious consequences of vanadium precipitation, it is essential to keep the system temperature in the range of 5–40 °C, which may require active control strategies if the VRFB is placed in a site with severe weather conditions. This temperature control may be achieved, for instance, by installing a heat exchanger between the tanks and the stack [63].
In the remaining of this subsection the thermal balances of the VRFB are described. The equations are based on the work of Tang et al. [106], with the inclusion of the entropic heat proposed by Trovo [107]. The system is divided in seven discrete elements: the electochemical stack, represented by the subscript s; the electrolyte tanks represented by the subscrpit t; the pipes that connects the tanks with the stack inlet, represented by the subscrpit and the superscript , and the pipes that connects stack outlet with the tanks, represented by the subscrpit and the superscript ; the subscript k indicates the positive () or negative () side of the battery and applies to every element, except the stack. In order to clarify this description, the different temperatures of the system are shown in Figure 4.
The thermal energy balance in the stack is:
where is the specific heat of the electrolyte, is the heat transfer coefficient between the stack and the environment, is the external surface of the stack, is the temperature of the surrounding air, is the entropy change of the main reaction, is the reaction heat of the self discharge reactions, are each of the overpotentials of the stack and the power of the pump.
In this balance, the left side of the equation stands for the accumulation of thermal energy in the stack. The first two terms of the right side represent the thermal energy carried by the negative and positive electrolytes, respectively. The third term stands for the energy transferred to the environment as a consequence of the temperature difference between the stack and the surrounding air. The fourth term is the entropic heat generated by the main electrochemical reactions, while the fifth one is the reaction heat due to the self-discharge reactions. Finally, the sixth term represents the heat generated by the stack overpotentials, and the seventh is the heat produced by the electrolyte friction with the porous electrode. As the stack is the main source of pressure drop in the hydraulic system, the last term is assumed to be equal to , i.e., it is assumed that the energy provided by the pump is mainly used in overcoming the friction of the stack [63]. The entropic (or “reversible”) heat rate is negative during charge (endothermic reaction) and positive during discharge (exothermic reaction) [107]. The rest of the generation terms are always positive, thereby, the stack temperature tends to increase in both operation modes if the heat transfer capacity of the stack and the fluid is not enough.
The thermal energy balances in the remaining elements of the VRFB system are:
In the previous balances the temperature of the stack is assumed to be unique and, consequently, only one balance is needed to represent its behaviour. Some authors lifted that hypothesis [79,107,108] by considering a different balance for each of the n cells that make up the stack. In such case, Equation (60) would become a set of n equations, which would be essentially identical to the original one but with a new term that accounts for the heat transfer between the cells as a consequence of their temperature difference.
In many cases, since the heat transferred and produced in the pipes is relatively small in comparison with that of the stack and the tanks, Equations (60) to (63) may be simplified by neglecting the balances in the pipes, combining their effects with the tanks. Note that, in case that a heat exchanger is used for temperature control, the balances would remain exactly the same, with the only difference that the exchange between the pipes and the air in the previous formulation would be replaced by that produced in the heat exchanger, thereby becoming much more relevant.
3.5. Hydraulic Model
In VRFB, the electrolyte flow rate plays an important role in the overall system performance: to provide a sufficiently high supply of reactants to the stack is crucial to guarantee its proper operation. Generally speaking, a high flow rate increases the cell voltage in discharge and reduces it in charge, hence improving the voltage efficiency of the system, . This positive effect on the electrochemical performance is explained by the fact that a high flow rate increases the reactant concentration inside the stack, thus raising (reducing) the discharge (charge) voltage via the Nernst equation and, more importantly, enhances the mass transport, which permits to substantially reduce the concentration overpotentials [109]. Furthermore, as the end points of the charge/discharge processes are usually determined by voltage limits, the flow rate also affects the effective charge capacity of the battery [110]. In other words, as the concentration overpotentials are reduced when operating at high flow rates, the accessible SoC window is expanded, while an insufficient flow rate would result in an premature voltage cut-off. However, an excessive flow rate results in an increase of the pump power, and augments the pressure drop within the cells which, in turn, may increase the risk of leakage.
The theoretical minimum flow of electrolyte () is such that it provides the stack with a reactant supply that is exactly equal to the consumption produced by the electrochemical reaction (see Equation (64)) [110]. However, in practice, an excess supply is always needed to ensure that enough reactant will reach the electrolyte active sites, as well as to reduce overpotentials and minimise the risk of side reactions such as hydrogen evolution. Then, a “flow factor” that links the real flow rate (q) with can be defined as follows: [109].
The most common approach is to select an appropriate so that the total losses of the system (hydraulic and electrochemical) are minimised [109,111]. There exist other more complex approaches to determine the optimal flow rate but their discussion is out of the scope of this review [112,113]. In any case, to select the optimal q as well as to analyse the behaviour of the VRFB system, it is essential to have an hydraulic model that permits to compute the hydraulic losses in terms of the electrolyte flow rate, as discussed below. Additionally, both the and the optimal q will be highly dependent on the battery SoC, remarking the necessity of having an accurate SoC estimation methodolgy, which will be analysed in deep in Section 4.
The total pressure drop in the system is produced by the viscous friction between the electrolyte and all the elements that make up the hydraulic circuit of the battery [110]:
The can be calculated by using an integrated version of the Dracy’s Law presented in (29) of Section 3.1 [114]:
where and are the length and cross-section area of the electrode’s channels, respectively, and is the permeability coefficient of the electrode, which can be calculated from its porosity , its mean fiber diameter and the Kozeny-Carman constant .
The can be calculated in the follwing way [110]:
where and are the pipe diameter and the pipe length, respectively. f is the friction factor, which depends on the Reynolds number . In laminar flow, f cam be computed as:
Usually the circuit involves more than one pipe section, in which case the contribution of each of them must be added to obtain the total .
To compute the pressure drop caused by congestions in the hydraulic circuit, such as bends in the pipes, tanks inlet and outlet, sensors and other ancillaries, etc., it is employed a parameter that is characteristic of each of these elements:
Then, the pump power required to produce the desired flow q in the VRFB system will be proportional to the total pressure drop, according to the following equation [43]:
where is the efficiency of the pump, which is typically obtained from correlations or tables provided by the manufacturer.
3.6. Equivalent Circuit Models
Equivalent circuit models (ECM) are a particular type of lumped parameter models that utilise electrical components such as resistances, capacitors and voltage or current sources to represent the behaviour of a dynamical system [14]. Although modelling VRFB with ECM has some limitations in their ability to reflect the details of the physicochemical processes that take place in the system, they are very popular for control and estimation applications [99]. This is thanks to their simplicity and fast computation time on the one hand and, on the other, because they demonstrate excellent adaptability and a great deal of accuracy in predicting the electric dynamic response of the system [95].
The first ECM for VRFB were basic models derived from those utilised in lithium-ion batteries [116]. More recently, researchers have introduced more complete ECMs that take into account some of the particular phenomena of the VRFB such as the self discharge because of vanadium crossover [95], the coupling between the electrochemical and thermal dynamics [117] and the relation between the state of charge and the flow rate with the model parameters [118]. ECM can also be used to model the shunt currents that may appear in the electrolyte manifolds [43,78].
A typical scheme of an ECM for a VRFB is presented in Figure 5 and the meaning of its components is discussed below.
- (a)
- Open circuit voltage (). This element represents the open circuit voltage of the stack, given by the Nernst equation [95]. It depends on the SoC of the battery and also on its temperature if the system is considered non-isothermal. Alternatively, the open circuit voltage may be composed by a nominal constant voltage source in series with a non-linear capacitor that reproduces the non linear behaviour defined by the Nernst equation [75].
- (b)
- Series resistance (). It lumps all the ohmic losses due to the resistance of the current collectors, porous electrodes, electrolyte, membrane and bipolar plates.
- (c)
- RC modules (). A series of n resistor-capacitor pairs is included to represent transient dynamics of such as activation and concentration polarisation. If these phenomena are considered separately, there would be two RC modules, while a simplified 1st order RC network can be employed if only one dynamic is taken into account. Up to now, there are no published works that include more than 2 RC modules.
- (d)
- Self-discharge. The self discharge that takes place in the cell because of the vanadium crossover through the membrane and the shunt currents due to potential gradient across the stack cells are typically represented by a parallel resistance () [75,117] or a controlled current source [95]. Alternatively, the shunt current effects can be modelled in a more detailed way by considering each cell individually, interconnected by a network of series and parallel resistances. Although the self discharge resistance (or current source) permits to represent satisfactorily the Coulombic efficiency, it does not account for the capacity loss caused by the electrolyte imbalance originated by side reactions or differential vanadium ion transfer across the membrane.
- (e)
- Thermal subsystem. A module representing the thermal behaviour of the system may be attached to the main circuit. Xiong et al. [117] proposed a third-order Cauer network to mimic the heat transfer process in the stack, the tanks and, eventually, the heat exchangers. Another possibility would be to model the electrochemical behaviour with the ECM, and combine it with the thermal model previously presented in Section 3.4. In Xiong’s work, only the dependence of the OCV with temperature is considered, but further temperature dependencies of the ECM elements may be also included.
To clarify the most relevant concepts discussed in the current section, the following summary analysis can be provided. It can be firstly established that the models utilised in the literature to describe the behaviour of VRFB can be primarily classified between distributed parameter models and lumped parameter models. The former are suitable for simulation and design purposes and, furthermore, provide a comprehensive understanding of the main processes that take place within a VRFB. It was found that these models are usually centred in the electrochemical stack, where the complex electrochemical processes and mass transport phenomena have more relevance. However, DPM entail a highly complex computational problem that cannot normally be solved online, and, furthermore, are difficult to be handled in an analytical manner, resulting almost always in a numerical resolution. In contrast, LPM are generally simpler. They allow to reduce the simulation time, facilitate their online implementation and can be analytically manipulated for the design of estimation strategies, such as those developed in the following section. These, in turn, can be classified in electrochemical models that preserve the physic interpretation of the variables, and equivalent circuit models if a higher degree of simplicity is preferred.
The central aspects to consider regarding dynamic modelling, especially oriented to control and estimation design, are the mass balances of the vanadium species and the stack voltage. The former permit to describe the time evolution of the active species of the battery originated by the main electrochemical reactions and possible side reactions. For its part, the stack voltage is normally expressed as a sum of an ideal open circuit voltage, given by the Nernst equation, and a series of overpotentials originated by different processes such as the ohmic, concentration and activation losses. It was found in the literature that those overpotentials can be expressed from the rather complex Butler-Volmer equations, to simpler versions that allow an explicit expression for the concentration or activation losses. Additionally, models have also been formulated to describe the thermal and hydraulic dynamics of the VRFB, which may be particularly relevant in certain applications, especially in those where a fine optimisation of the system operation is performed.
4. Redox Flow Battery Internal State Estimation
The internal state estimation is one of the most challenging topics at the moment in VRFB research. To have accurate information of the system is essential to monitor and properly plan its operation, as well as to optimise its performance and prevent its degradation. One of the most relevant indicators to be estimated is the State of Charge, which quantifies the available energy of the battery. Not less important is the State of Health, which provides a measure of the battery condition. Therefore, this section reviews the existent methodologies to estimate the aforementioned indicators and other VRFB parameters of interest.
4.1. Estimation Algorithms
This review is particularly focused in model-based estimation methodologies, although some experimental methods are briefly discussed in the next subsection. From the theoretical point of view, the variables to be estimated can be classified as states, if its time evolution is described by the dynamic equations of the model; and parameters, if their possible variation is not described by the model.
The state estimation task is generally carried out by a so-called state observer, whose function is to estimate the internal state (x) of a system (in this case, the VRFB), from measurements of the inputs (u) and outputs (y) of the real plant. These typically consist of a copy of the model dynamics able to provide an estimation of the internal state () and a correction term which, in the simplest case, is proportional to the difference (e) of a function of the measured output and its estimation () using the model, as illustrated in Figure 6.
State observers [119,120,121] permit to obtain online estimation of the SoC, SoH or other battery internal states by employing only easily measurable variables such as the current or the terminal voltage. Apart from the information provided by the sensors, this approach requires to have a mathematical model that links the measurable inputs and outputs with the system internal states and, on the other hand, an algorithm capable to adequately process the incomplete and imperfect acquired data to reconstruct a reliable estimation of the system state. Although these methods generally require an accurate battery model and increase the computational demands, they are considered to be particularly cost effective as they enable to substantially simplify the monitoring setup and simultaneously increase the robustness and reliability of the measurement process by increasing the rejection to measurement noise. With an adequate model, if the observer is properly designed and the input signal contains enough information, the estimated states converge, at least asymptotically, to the real ones and, hence, variables as the SoC of the system can be determined [122].
Parameter estimation usually utilise a different type of algorithms which, in turn, can be run either online or offline. This is possible thanks to the fact that parameters normally vary much more slowly than states. The offline approach is the simplest one, and consists in performing a set of parameter identification experiments and assuming them approximately constant during the system operation. However, offline methods require time-consuming experiments that may interrupt the system’s operation and, furthermore, are not capable to track the variations they may suffer because of changes in the operating conditions or the ageing status. In contrast, online methods involve a more complex joint estimation of parameters and states, but are better suited for system monitoring with strongly time-varying parameters.
Before delving deeper in the specific estimation objectives, a short summary of the types of algorithms that have been utilised in VRFB estimation is presented hereafter in order to ease the comprehension of the remaining of this section. In addition to the linear and non-linear state observers reported in the literature, some algorithms specifically oriented to parameter estimation as well as data driven algorithms are also presented. The main features of these algorithms are summarised in Table 3.
- (a)
- Linear state observers
- Extended Kalman filter (EKF).This is a classic state observer for dynamic systems that, in essence, transforms a non linear system into a linear one by computing the first order Taylor series expansion, namely the Jacaobian matrix, around the estimated operation point, at every time instant [123]. Therefore, the nonlinear system is described as a continuous of linearised operation points. The measurement noise and process perturbation are assumed to be zero-mean, Gaussian and independent of each other. It is very popular in a wide range of applications, such as in navigation systems and GPS, but may be inaccurate if the system is highly non-linear and, furthermore, there is no guarantee of stability and convergence if the initial values of the state variables are far from the real ones.
- H-Infinity observer (H).This method aims to find the corresponding states that solves a mathematical optimization problem which can be expressed by means of the H norm. The objective of their implementation is to find an optimal solution for a set of different plants that represent possible level of uncertainty or noise. Therefore, they have certain advantages over EKF, such as a higher robustness against uncertainties in the model and being able to deal with unknown noise statistics [124]. However, they require an important level of mathematical understanding and have a strong dependency on the plants used for their design. Moreover, if the real operating conditions are different from the ones used to design the observer, convergence is not guaranteed.
- Particle filter (PF).It is an stochastic approach that utilises Monte Carlo methods to estimate the states of a dynamic system, assuming a set of discrete observations with random perturbations. PF requires the discretisation of the continuous system and, subsequently, assuming a certain probability distribution for the system noises, generates a set of particles with different likelihood to represent different possible states of the dynamic system. It has been reported that PF is six times faster than EKF in ESS applications [125].
- (b)
- Non linear state observers
- Unscented Kalman filter (UKF).Unscented Kalman Filter is a non linear version of the KF, that generally shows better performance than EKF when dealing with highly non-linear systems. This is because it utilises the unscented transformation rather than computing the Jacobian matrix of the system at every operation poing. Furthermore, the requirement of a Gaussian noise distribution is also lifted. The algorithm generates a set of “Sigma Points” around the mean of the whole set of sample points which, in turn, are utilised to obtain the covariance of the state distribution. In spite of the advantages of this approach, it is not robust to model uncertainties or disturbances [125].
- Sliding mode observer (SMO).Sliding mode observers are well suited to deal directly with non linear systems, the use the sliding mode control ideas [126] to design feedback laws for observer design. By utilising a discontinuous correction term (i.e., a gain tending to infinity), these bring the system states to a surface where there is no difference between the measured and estimated output. Consequently, if the system is observable, the estimated states converge to the real ones [120,127]. SMO have the ability to minimise modelling error and uncertainties effect while, at the same time, permit to bring coordinates of the observer error dynamics to zero in finite time. The main disadvantage of this approach is that the discontinuous nature of the correction term usually result in high frequency commutations that increment its computational cost [75]. The implementation of these type of observers can be improved using adaptive gain [120] or zero-crossing techniques [128,129].
- High gain observer (HGO).High gain observers [119,121] have a very similar theoretical background to SMO, in the sense that they utilise a high-gain (but in this case continuous) feedback as a correction term. This continuous correction term contribute to avoid the permanent commutation typical of the SMO. Despite their good performance in non-linear system state estimation, HGO are prone to present the so-called “peaky phenomenon”, which implies that, during a transient before converging, the estimates may take values that strongly differ from the real ones [130].
- (c)
- Algorithms for parameter estimation
- Recursive least squares (RLS).This is the most commonly used method to identify the model parameters in a wide range of ESS. The algorithm finds the coefficients that minimise a weighted squared error between the estimated signal and the measured output. RLS presents good accuracy and short convergence time, although its computational cost is relatively high. The algorithm can be coupled with a “forgetting factor”, which gives more weight to the recently obtained data, hence permitting to update online the model parameters [75]. Similarly, other type of online parameter estimation algoritms could be used [131,132].
- Particle swarm optimizer (PSO).PSO is a computational method used to optimise a problem by searching iteratively a candidate solution [131,133]. It is based on the use of the pose and velocity information of a set of initially candidates presented in the space in the form of swarm, to find the optimal one with regard to a given measure of quality. PSO is metaheuristic and can search very large spaces of possible solutions, therefore it is useful to identify several parameters of a model. In addition, PSO do not require the model to be differentiable. However, it has a high computational cost and due to its metaheuristic nature, optimal solution searching a global minimum is not guaranteed.
- Genetic Algorithm (GA).This is a metahuristic method used to optimise problems and estimate model parameters in a multiple linear regression. Emulating genetic systems, this approach consists in proposing many possible solutions (or “chromosomes”) to an optimisation problem, and subsequently, permitting the best of them to “breed with each other”, allowing to find better solutions [134]. The use of GA ensure the convergence to global optimal solution in complex problems suspected to be multi-modal. As advantage, it is important to remark its high accuracy and robustness against noise. However, requires heavy computation.
- (d)
- Data driven algorithms
- Neural network (NN).Among the data driven algorithms, neural networks are the most popular. This is a self-learning approach that do not rely on a specific model but have a flexible structure that adapts to the training data in order to predict the behaviour of the real system [135]. In other words, the NN relates the system inputs and outputs, but the model is a “black box” whose internal dynamics are unknown. Although their convergence is not proven, they present very good results in predicting the dynamic response of a system. However, they generally require large amounts of training data and are prone to high estimation errors when the operating conditions fall outside the training range.
- Support vector machine (SVM).Support vector machine utilises a “kernel” algorithm in order to transform a nonlinear system into a linear one of higher dimension [135]. The main advantage of SVM is that it gives flexibility to set the maximum admissible error in the model and, consequently, finds a higher order surface to fit the data. On the other hand, the interpretation of the transformed model is not very clear and may be sensitive to missing data as well as issues when an inadequate kernel is chosen.
4.2. State of Charge
The SoC is a key indicator to be monitored because of its direct relation with the amount of energy stored in the VRFB system. Furthermore, many control and optimisation strategies, such as electrolyte flow regulation, require having online a reliable SoC value. Finally, knowing the individual electrolyte SoC is the starting point to compute different SoH indicators, to develop rebalancing systems and to protect the battery from overcharging. Accordingly, in this subsection it is firstly reviewed the existing experimental methods for SoC determination is firstly reviewed, and subsequently, an exhaustive literature analysis of its algorithm-based estimation is presented.
4.2.1. Conventional Experimental-Based SoC Measurement
Probably the simplest way to determine the SoC is the so called Coulomb Counting method which, given a known starting SoC, permits to track its evolution based on the numerical integration of the measured current.
However, as a consequence of side reactions and inaccuracy in the current measurements, this method is prone to severe error accumulation and, furthermore, it is not capable to detect electrolyte imbalance. For this reason, though useful for short term measurements, it must never be used as stand-alone method for long term SoC monitoring. Aiming to overcome this limitation, more sophisticated experimental techniques relying on additional measures of the battery variables have been developed [46]. These include:
- Titration. This technique employs a solution with known reactant concentration (usually, potassium permanganate), that undergoes a defined reaction with the analyte (i.e., the vanadium species). By measuring how much titrating solution is needed to react with a certain volume of electrolyte, the concentration of a specific vanadium species, and consequently the SoC, is determined. The end point is marked by a colour change of the solution or, more commonly in VRFB, by a potential change versus a reference electrode (potentiometric titration). This technique is highly accurate and reliable but is time consuming, requires to use a chemical reagent and is not suitable for online measurement. Therefore, it is commonly used to validate and evaluate the estimation errors of other SoC measurement techniques [136,137].
- Optical methods. The most popular is UV/vis spectroscopy, that takes advantage on the fact that each vanadium species has a characteristic colour depending on its oxidation state. Then it is possible to measure the absorbance in some specific wavelengths to determine the proportion of each species. The main problem of these techniques is that concentrated vanadium solutions are extremely dark in colour and, furthermore, positive electrolyte absorbance presents a strongly non linear dependency on SoC [138]. Alternative proposals to overcome these problems have been presented such as measuring the transmission spectrum at many wavelengths instead of the absorbance at a single one [139], utilising methods based on refractive index analysis [140] or infrared spectroscopy [141].
- Electric conductivity. It is based on the differences in the vanadium species electrical conductivities and, specially, on the changes of proton concentration that occur during charge/discharge cycle as a consequence of the electrochemical reaction [138,142]. Although this method presents high accuracy when performed under controlled conditions, it is highly sensitive to several variables such as the temperature or the total vanadium concentration. Therefore, a big deal of calibration data is required to cover all possible temperature and concentration combinations.
- Acoustic properties. Two methods to measure the SoC based on the acoustic properties of the electrolyte were reported. The first one utilises the ultrasonic velocity which, with a reliable calibration curve, permits an accurate fast measurement of the SoC. However, this technique is severely sensitive to temperature variations, hence the error increases sharply even with a small temperature change [143]. The second method, based on acoustic attenuation, is much less sensitive to temperature variation and permits to estimate the SoC with an acceptable error, below 5% [144].
- Physical properties. These methods utilise the electrolyte density [145] or viscosity [146] to determine its SoC. Although to measure these variables is relatively easy, the dependence of these properties on SoC is rather weak, and they are highly influenced by the electrolyte temperature. Therefore, the method needs to be carefully calibrated periodically in order to minimise the SoC estimation error.
- Amperometry. This method is based on the fact that, when there are important limitations for mass transfer, there is a maximum current density which, in turn, is proportional to the vanadium reactant concentration in the way presented in Equation (48). Therefore, it is posible to use an auxiliary electrode with a high mass transport resistance to measure the limit current for the different reactions that take place in the cell and then obtain the value of the vanadium species concentrations [147,148].
- Open circuit voltage. This is a simple approach that consists in introducing an open-circuit cell that measures the which subsequently allows to monitor the SoC by using a look-up table or solving the Nernst Equation. Although this technique gives good results when the VRFB is balanced, it does not take into account possible electrolyte imbalances which considerably limits its applicability. To overcome this limitation, this method can be expanded by including two additional reference electrodes to measure the individual equilibrium potential of the cathode and the anode. This permits to determine the individual SoC of the electrolytes and their imbalance. It must be noted that the reference electrodes usually suffer from important potential drifts, hence require periodical recalibration [46,145].
The aforementioned methods permit to measure the SoC of the VRFB at the expense of installing additional equipment that needs to be carefully operated and periodically re-calibrated in order to minimise the measurement error. As a result, the SoC monitoring setup may significantly increase the cost and the complexity of the VRFB systems.
4.2.2. Algorithm-Based SoC Estimation
To provide an alternative to the previously described experimental SoC measurements and overcome their limitations, algorithm based SoC estimation methodologies have gained a great deal of attention in recent years. If correctly designed, these can reliably track the system SoC, eliminating the necessity of incorporating additional measures to the system. The existing methodologies will be discussed below in terms of the model in which they are based, the required measurements, and the utilised algorithms.
- Models utilised in SoC estimation
As anticipated in Section 3, VRFB estimation designs typically utilise dynamical lumped parameter models. More specifically, many of the proposed methodologies rely on an ECM to perform the SoC estimation task, owing to their great simplicity and sufficient accuracy. A very commonly used electrical circuit is simply composed by an OCV source, a series resistance and a first order RC module [149,150,151,152,153,154]. Other authors have resorted to an enhanced version of that model, that includes either a self discharge resistance [75,116,155,156,157] or a second order RC network [117,158].
The main drawback of the described ECM is that they do not explicitly take into account the effect of the flow rate on the system dynamics, hence forcing to impose the not always acceptable hypothesis of “very high flow” (i.e., to assume that the flow rate is always sufficiently high to neglect the concentration difference between the tanks and the stack) or, alternatively, to consider that the flow rate varies slowly and its effect on the model parameters can be satisfactorily tracked by the estimation algorithm. Additionally, they generally do not consider the dependency of the ECM parameters on the SoC and eventual electrolyte imbalances.
The second large group of models employed in SoC estimation are the electrochemical LPM based on the Skyllas-Kazacos formulations presented in Equations (50)–(53) [44,130,159,160]. At the expense of an increase in the complexity, these models permit to represent dynamics associated to the flow rate and the difference in the half cell concentrations. It must be stressed, however, that according to Jienkulsawad et al. [160], the vanadium concentrations, and hence the electrolyte imbalance, cannot be estimated only by the traditional voltage and current measurements, being necessary the use of additional measurements. Recently, Khaki and collaborators have introduced algorithms that jointly employ ECM and concentration models to perform the SOC estimation [161,162].
Although the temperature is a commonly measured variable, the thermal dynamics are generally not taken into account in the models used for SoC estimation. To our knowledge, the only exceptions are Xiong’s [150] and Khaki’s works [134] where a simple ECM and a concentration electrochemical model are coupled with a thermal model similar to that presented in Section 3.4 of this report, respectively.
Finally, some authors proposed models that are not directly linked to a physical interpretation of the system or a predefined structure, but are rather constructed by processing collected data, such as neural network (NN) [146,163,164] and auto-regressive exogenous (ARX) [165] models. This data driven approach is well suited for non linear systems and permit to increase the flexibility on model order and structure. However, their accuracy rely on the amount and quality of the training data and may lead to large errors when the operating conditions deviate from the training data.
- Measured variables
Regarding the measured variables required, independently of the estimation algorithm and the utilised model, most of the proposals rely only on current, voltage and, eventually, temperature and flow rate measurements. The reasons for this are twofold. On the one hand, these variables are easily measurable and, as they are normally monitored anyway for operational purposes, its measurement does not imply the installation of additional sensor hardware. On the other hand, there are many models, such as those presented in Section 3 of this report, that permit to link them to the internal states of the battery, which can then be estimated.
However, some designs require additional measures to be able to perform the estimation. Specifically, those works that utilise an electrochemical model and intend to reconstruct the whole state-space without assuming the balanced electrolyte hypothesis require of further measures to make the system observable, such as the individual half cell OCV against a reference electrode (or electrolyte) [159,160]. A notable exception that dispenses with the measurement of electrical variables is the algorithm proposed by Li which, taking advantage of the dependence of electrolyte viscosity with the SoC, only utilises pressure drop in the stack (or in a porous media introduced ad hoc in the stack inlet pipe), along with electrolyte flow rate and temperature as the model inputs.
- Algorithms utilised for SoC estimation
The most popular observer for VRFBs is the extended Kalman filter (EKF) and its derived algorithms [149,150,151,153,158,159,160]. Owing to its simplicity, there are many works in the literature that apply this method both to ECM and electrochemical LPM. However, this approach may lead to large linearisation errors and, furthermore, it is difficult to ensure that such observer will be stable and work properly on every operation point. Some authors utilised other methods based on the Kalman filter approach, such as the unscented KF [116], that uses the unscented transformation rather than the Jacobian matrix to linearise the model; an improved EKF [157], that defines an adaptive gain based on the output error and impose physical-based constraints of the possible states of the system (specifically, ); and a Hybrid EKF [162], that permits to deal with discrete measures of the output and, simultaneously, a continuous-time dynamic model. Zhao et al. use simultaneously a classic EKF and an adaptive version of the EKF and subsequently, combine both results to obtain an improved “dual fusion” EKF [166]. Another approach is the previously described linear H that has some advantages over the EKF, such as a higher uncertainties toleration in the model and being able to deal with unknown noise statistics. In this sense, two works were published utilising a H algorithm, one of them applied to a ECM [154] and the other one to an ARX model [165].
To overcome the limitations of the KF approach, an appealing possibility is to use observers prepared to deal directly with non-linear models. Among them, the most popular are sliding mode observers (SMO), that have shown good results for estimation tasks when applied to ECM [155,156] or simplified (but still non-linear) versions of the electrochemical model presented in this report [133]. This is explained by the inherent robustness of this approach, together with its ability to bring the error coordinates to zero in finite time. For its part, Fornaro et al. [75] have resorted to Sliding Mode differentiators to compute robustly the derivatives of the system current and voltage and, in a next stage, utilise that information to reconstruct the states and parameters of an ECM. The method showed an excellent performance in estimating the battery SoC by simulation with an error below 1%, although an experimental validation is still lacking. A similar approach that has been also utilised in VRFB SoC estimation is the High-Gain Observer (HGO), whose features and working principles are comparable to the SMO, but where the convergence is attained with a continuous correction term [130].
Besides, there are some works that utilise specially designed algorithms such as a multi-timescale estimator that decouples the estimation of each variable of a simple ECM circuit, and subsequently, permits the SOC estimation via a SOC versus OCV look-up table [152]. Another method that has recently been implemented to estimate VRFB SoC is the particle filter, which, according to Khaki [162], exhibited an error in the SoC estimation of 4.2%, a slightly better perfomance in comparison with the Hybrid EKF (4.4%) and considerably better than the classic Coulomb Counting method (7.4%). Finally, most of the authors that employ a neural network approach to model the system also propose, once the NN is trained, its utilisation to directly compute the SoC, without need to couple it with an specific estimation algorithm [88,163,164].
Table 4 provides a summary of the literature on VRFB estimation, in terms of the utilised algorithms and the estimation objective. The SoC estimation works corresponds to the first row of the table although many of them also estimate other relevant parameters of the system. The remaining of the state of the art on VRFB estimation will be analysed in the next subsections.
4.3. State of Health
In general, vanadium redox flow batteries have a lifetime considerably longer than other battery technologies (10,000–15,000 cycles). Nevertheless, they are not exempt of suffering several degradation phenomena that undermine their performance, reducing their capacity and efficiency. In this context, the concept of the State of Health (SoH) emerges which, as introduced in Section 2.4, permits to quantify the degree of degradation or loss of performance of the system. It is noteworthy that there is not only one process that lead to a reduction of the battery SoH, but a combination of several mechanisms that affect the different components that make up the VRFB, such as the electrolyte, the membrane and the electrodes. Consequently, the SoH cannot be conceived as a single index and, hence, many different definitions for it can be given, being the most popular those presented in Equations (22) and (23) of Section 2.4. As for now, however, almost all of the works that analyse the VRFB SoH focus on the capacity fade which, in turn is normally associated to the electrolyte status. The SoH in terms of the maximum charge capacity can be defined as in Equation (22).
As previously stated, the electrolyte imbalance is the main cause of capacity fade in VRFB systems. Therefore, it is clear that any of the conventional experimental methods described in Section 4.2.1 capable to measure the individual reactant concentrations can be employed to determine the electrolyte capacity and, thus, the SoH [46]. However, as discussed in Section 4.2.1, direct measurement of species concentration is complex and, consequently, the development of a reliable method to indirectly estimate this index becomes a priority. In comparison to the SoC, there are less works that cover the SoH estimation. In fact, most of them consist in a co-estimation of the SoC and the SoH and, accordingly, have already been presented in the previous section. Therefore, to avoid unnecessary repetitions, only the aspect of these works regarding the SoH estimation is discussed in this section.
Among these works it can be mentioned those presented by Wei and collaborators, that include as an additional parameter in the dynamic model and, subsequently, perform a co-estimation of SoC and SoH applying different estimation algorithms [151,152,153,154,165]. All of these works are based on two fundamental pillars. In first place, they impose the sensible hypothesis that the capacity fade dynamics are much slower than the rest of the system dynamics, which permits to decouple the SoC and SoH estimations and, furthermore, assume that the time derivative of is equal to zero in certain mathematical formulations. The second assumption, based on the authors’ experimental findings, is that the OCV versus SoC curve is independent of the ageing status, i.e., of the SoH. This is a highly questionable hypothesis and, although it may be valid for certain particular cases, it cannot be generalised as it directly contradicts the Nernst equation for most types of electrolyte imbalances.
Xiong et al. incorporates a “fading factor of capacity degradation ()” that explicitly considers a linear reduction of the the battery capacity over time, and utilise a sliding mode observer to estimate the battery capacity even in presence of model uncertainties [155,156]. However, the procedure to obtain the value of is not clear, although it is implied that it was obtained a priori via computer simulation tests. Similarly, Khaki focuses on the capacity loss associated to the volume change in the electrolytes and derives an empirical polynomial correlation to describe the evolution of the VRFB capacity in terms of the number of cycles [173]. The problem with this approach is that a complex beforehand calibration is needed and, moreover, it is essentially open looped and there is no guarantee that the system will behave in the same way as in the calibration test during the normal operation. For its part, Yu [159] and Jienkulsawad [160] approaches, based on two OCV measures of the voltage between each electrolyte and an electrolyte with known reactant concentration, permit an straightforward estimation of the electrolyte imbalance. This is because their proposals allow to obtain the individual values of each of the vanadium ions concentrations. The knowledge on the electrolyte imbalance, in turn, is a strong indicator of the system SoH.
In principle, it is also possible to directly obtain the actual capacity of the VRFB by a coulomb counting method if combined with an accurate and independent SoC measurement, as follows:
The main drawback of this approach is that it is usually not possible to have a SoC measurement independent from the battery capacity. Stoltze’s has proposed a method that lies on an amperometric measure of the SoC which only depends on the ratio between the vanadium ions concentration but not on their individual values [148]. Then, it is performed a linear regression on a rearranged version of Equation (73) to determine the VRFB capacity. The maximum capacity permits to obtain directly the value of the , by evaluating Equation (22). Recently, Fornaro et al. have also applied Equation (73) to keep updated the value of the system , in order to track its SoH.
All the methods described in this section intend to estimate the of the VRFB system, although they do not differentiate the origin of such capacity decay. This would be important because, as explained in Section 2.2, the regeneration strategy strongly depends on the type of imbalance or degradation. Additionally, at the moment, very few works consider definitions of the SoH not related to its total capacity. For instance, in VRFB, the so called total internal resistance tends to increase throughout long term operation, as a consequence of the electrodes and membrane degradation [53]. Hence, its voltage efficiency drops, and furthermore, the system could even be unable to supply the requested power demand. In [75] the is evaluated following the expression presented in Equation (23) by tracking the system internal resistance. It is important to remark that the battery internal resistance can also vary in a reversible way as a result of changes in the operating conditions, such as the SoC or the temperature in the stack. Therefore, the evaluation of the internal resistance should be conducted always at the same operating conditions, in order to eliminate possible bias not associated to actual degradation of the battery components.
4.4. Model Parameters
In general, most SoC and SoH estimation methodologies require an accurate value of the model parameters. Consequently, the vast majority of the works that intend to estimate such indicators couple their proposal with an algorithm that permits to obtain, either offline or online, these parameters. Having a reliable way to estimate the model parameters is absolutely essential for empirical ECM, as they are not deducted from the fundamental physical laws. Consequently, the value of its parameters cannot be taken directly from physical characteristics tables. Conversely, the parameters of electrochemical models have a clear physical meaning and, accordingly, it is theoretically possible to utilise previous data reported on the field. In practice, however, they are highly influenced by the operating conditions and the specific design of the VRFB system. Then, to deal with parameter uncertainties and avoid serious inaccuracies in the SoC and SoH estimation, in this case it is also recommended to utilise a method to adjust their values to the real system.
Classic techniques are the most utilised to estimate the VRFB model parameters. These include the Recursive Least Squares (RLS) algorithms, which finds the coefficients that minimise a weighted squared error between the model output and the measured output, and methodologies based on the previously described Kalman filter. Besides their relative simplicity, the main advantage of these approaches is that they can be applied online, in order to track the parameter variation. For instance, RLS with forgetting factor has been utilised to track online the electric parameters of equivalent circuit models [75]. More recently, meta-heuristic non linear global optimization methods (NLGO) were utilised to estimate the parameters of VRFB as a previous step to perform the SoC (and eventually, SoH) estimation. Specifically, genetic algorithms (GA) have shown good performance in offline estimation of the model parameters [134,165]. A similar method is the so-called particle swarn optimisation, which iteratively generates a set of “particles” containing candidate solutions to find the optimal value of the parameters to tune the electrochemical model [133,134].
It must be remarked that the determination of the SoC and SoH are not the only reason that motivates the estimation of the parameters of a VRFB model. Indeed, there are other important applications that also require accurate values of the model parameters, such as in the design of operating conditions optimisation or automatic control strategies. In that framework, there exist some research articles that focus exclusively in the estimation of models’ parameters. For instance, Choi et al. proposed a genetic algorithm to estimate the electrochemical parameters of a semi-steady 2D model, from measures of the voltage response under different operating conditions [171]. More recently, He et al. used a physics constrained deep neural network (DNN) to estimate the electrochemical parameters of a 0D model [168]. In comparison to conventional DNN, by imposing physics constraints, the computational burden and required data associated to the parameter estimation is reduced.
4.5. Peak Power Estimation
Although, at the moment, most of the works dedicated to VRFB estimation are focused on the SoC, the SoH, and the model parameters, there exist other possible estimation objectives in VRFB. One of them is the peak power, which can be defined as the maximum charging or discharging power that is possible to be accepted or deliverd by the VRFB in a future time horizon without violating the design constraints. Its estimation is not widely addressed in the specialised literature, however it may provide useful information in certain applications. Conventionally, VRFB were designed for very long-term operation, with a relatively low and constant power output. Nevertheless, nowadays, power systems often require the ESSs to provide fast high power supply or consumption in short periods of time. Then, the peak power becomes a critical factor in certain cases, such as in electric grid quality regulation or in electric vehicles charging stations.
The first work that intended to estimate the peak power of a VRFB was written by Yu and collaborators [172]. There, a rather complex electrochemical model is coupled with a detailed hydraulic model to predict the instantaneous peak power under different operating conditions. However, this work relies on offline simulation and, moreover, does not impose constraints on the operative variables nor considers the capacity to maintain such power over an specific time horizon. Therefore, though useful for design purposes, it is not well suited for online applications. Then, Wei et al. proposed a methodology to estimate online the peak power by utilising an ECM whose parameters are estimated either by a RLS or an EKF algorithm. Subsequently, the peak power is obtained by computing the maximum constant current that the system can sustain during , subjected to multiple constraints on the SoC, the voltage, and the current [169]. The main issue is that assuming a constant current leads to a considerable estimation error, specially during the high and low SoC regions and, in addition, neglects the fact that the maximum allowable currents can be highly dynamic due to the changes in the terminal voltage. Recently, Xiong et al. have developed an improved methodology that utilises a RLS with forgetting factor to estimate the ECM parameters and an unscented Kalman filter to estimate its states [170]. Then, model predictive control is employed to find the sequence of input currents to achieve the maximum charge/discharge power during . As a result, by using a variable current, a higher peak power may be attained while keeping similar constraints for the SoC, the voltage and the current. For its part, the flow dynamics and the battery ageing have not yet been considered in online peak power estimation research.
To conclude this section, in Table 5 it is presented a full list of the available literature on VRFB estimation in terms of their objective, model, techniques and measured variables. By looking in detail Table 5, it is possible to see a predominance of the SoC as the estimation objective. In this context, the Kalman filter and its derived algorithms appear as the main techniques used for this purpose. Nevertheless, due the presence of non-linearities in most of the models, specially with the electrochemical ones, the use of nonlinear observers has also been explored. There exist also a great deal of research on the estimation of ECM parameters, which is most cases is also directly related with the SoC estimation. To obtain these parameters, the vast majority of the works resort to the use of the RLS algorithm.
An open line of study that has gained significant attention in recent years is the SoH estimation, which is related the serving life of a RFB system. In this regard, several aspects of the battery condition can be studied, although most of the works are focused on the charge capacity fade, and do not discriminate between its possible causes. For this purpose, the use of electrochemical models and ECM jointly with different estimation techniques has been found. Most of these estimators, together with the previous ones, use the current and voltage as input variables. The main reason of this election is that these variables can be easily measured and, in general, if adequately processed, contain enough information for the estimation of the objective indicators or parameters. Finally, it is worth mentioning that there are some specific aspects, such as the peak power, that are becoming more relevant as the possible range of applications for VRFB is getting wider.
5. Conclusions
In this paper, it has been clearly defined the potential of redox flow batteries as a large scale energy storage system that can contribute to the transition towards a new sustainable energy paradigm. Given their remarkable merits regarding their modularity, lifespan and efficiency, RFB are now positioned as one of the most promising ESS in a wide range of applications, such as providing support to an electric grid based on renewable energies, as a buffering module in electric vehicle charging stations, and even in the green hydrogen production process. In particular, it has been established that modelling and monitoring are key topics for the development of this technology in order to make it commercially competitive.
Modelling is a central aspect in the study of VRFB systems, since it permits to interpret their behaviour, constituting a key tool in the design stage and, furthermore, in the monitoring and operation of the device. This review organises the existing models, starting from the detailed distributed parameter models, to the less complex lumped parameter models. Given their comparative simplicity and lower computational cost, it can be concluded that the latter are the preferred ones in the design of observers and parameter estimation strategies.
Regarding VRFB monitoring, model-based internal state estimation is one of the most dynamic research fields at the moment. In particular, the state of charge and the state of health are the most common estimation objectives, given their utmost importance for the system monitoring and control. In this review, an exhaustive analysis of the existing VRFB estimation approaches reported in the literature was performed, together with a brief description of the main algorithms these utilise. It has been found that most of the proposals are based on the classic Extended Kalman Filter, although non linear observers, such as those based on Sliding Mode techniques have also been utilised. In addition, there are also works that develop data driven approaches, such as neural networks, to estimate the system internal states. The proposals are also analysed in terms of the models they utilise and the main hypothesis they assume. In this sense, it has been found that electric circuit models and simple versions of the concentration based models are, at the moment, the most popular for VRFB estimation purposes. Some common assumptions found in the literature include a balanced electrolyte and a very high flow rate that permits neglect the concentration difference between the stack and the electrolyte tanks. However, given the complexity and non linear nature of VRFB systems, its modelling and estimation still remains an open field, with several challenges that still need to be addressed.
In the light of the study and discussion of the state of the art in modelling and estimation of redox flow batteries, the authors suggest some strategic lines of future research:
- This review, as well as the majority of the information available in the literature is focused on VRFB. However, in line with the development of novel electrolyte chemistries, the adaptation of the existing models to the particularities of other types of these new RFB technologies becomes a necessity.
- VRFB dynamic models require the knowledge of a large set of parameters in order to accurately describe the behaviour of the systems. However, it is still not completely elucidated how these parameters depend on the operating conditions such as the temperature, and the ageing status of the battery. Therefore, further investigation is required to understand the parameter variation and its incorporation in the models which, in turn, will also contribute to its online estimation. For example, it would be very beneficial to study the impact of the temperature and membrane degradation status in the parameters related to the vanadium crossover, such as .
- Most of the models available in the literature assume that all the cells that conform the stack behave exactly the same. In stacks composed by many cells, however, this may lead to significant error. Therefore, the challenge is to develop a model that takes difference between the cells into account while, at the same time, keeping it simple enough to be utilised in estimation and control design. With the development of these new models that distinguish between cells, it would be possible to include in the estimator design other phenomena such as the shunt currents, as well as possible temperature gradients within the stack.
- The effect of the flow rate in the estimation strategies is generally neglected. This hypothesis is useful and significantly simplifies the models when the flow rate is always pumped in great excess. However, given the current trend of optimising the flow rate at every operation point in order to minimise the power consumption, the development of new strategies that explicitly take into account the effect of the flow rate are required.
- Most SoC estimation works assume balanced electrolytes. This is in general not valid because, even when the battery starts from a balanced condition, it naturally tends to imbalance over extended charge/discharge cycles, even if it is correctly operated. Therefore, it is needed to develop strategies able to deal with this situation, in order to minimise the estimation error. Furthermore, taking imbalance into account is essential to recognise the status of the electrolyte, mitigate its progression and timely, take the necessary and adequate actions to its recovery. For instance, by recognising if the imbalance is mainly stoichiometric or faradaic, it would be possible to decide beforehand whether a remixing strategy to recover the electrolyte would be effective or not.
- The estimation objectives along with the required accuracy may differ depending on the specific context of application. Furthermore, the power demand profiles and other operating conditions development are significantly influenced by the application. Therefore, the design of estimation strategies considering specific contexts is encouraged.
- As for now, it is difficult to perform a quantitative comparison of the existing VRFB estimation methodolgies, due to the different conditions in which each experiment was carried out. To confront this issue, the development of a standardised method to validate and compare the proposed methodologies is recommended.
Author Contributions
Conceptualisation, T.P. and A.C.; methodology, T.P. and A.C.; investigation, T.P. and A.C.; writing—original draft preparation, T.P. and A.C.; writing—review and editing, M.S. and R.C.-C.; visualisation, M.S. and R.C.-C.; supervision, R.C.-C. and M.S.; project administration, R.C.-C. and M.S.; funding acquisition, R.C.-C. and M.S. All authors have read and agreed to the published version of the manuscript.
Funding
The research that gave rise to these results received support from “la Caixa” Foundation (ID 100010434. Fellowship code LCF/BQ/DI21/11860023), the CSIC program for the Spanish Recovery, Transformation and Resilience Plan funded by the Recovery and Resilience Facility of the European Union, established by the Regulation (EU) 2020/2094, CSIC Interdisciplinary Thematic Platform (PTI+) Transición Energética Sostenible+ (PTI-TRANSENER+ project TRE2103000), the Spanish Ministry of Science and Innovation (project PID2021-126001OB-C31 funded by MCIN/AEI/10.13039/501100011033/ERDF, EU) and the Spanish Ministry of Economy and Competitiveness under Project DOVELAR (ref. RTI2018-096001-B-C32).
Institutional Review Board Statement
Not applicable.
Informed Consent Statement
Not applicable.
Data Availability Statement
Not applicable.
Conflicts of Interest
The authors declare no conflict of interest.
Glossary
Meaning and units of parameters:
| Latin | Meaning | Units | Greek | Meaning | Units |
| a | Tafel coefficient | - | Charge transfer coefficient | - | |
| A | Area | m | Hydrogen transfer coefficient | - | |
| b | Tafel slope | - | Electrode porosity | - | |
| c | Concentration | mol/m | Energy | Wh | |
| Fixed sites concentration | mol/m | Overpotential | V | ||
| Reactive concentration | mol/m | Activation overpotential | V | ||
| Total vanadium concentration | mol/m | Coulombic efficency | - | ||
| Specific electrolyte heat | J/kgK | Concentration overpotential | V | ||
| d | Diameter | m | Energy efficiency | - | |
| Mean pore diameter | m | Ohmic overpotential | V | ||
| Membrane thickness | m | Voltage efficiency | - | ||
| Diffusion coefficient | m/s | Electrical conductivity | S/m | ||
| Effective diffusivity | m/s | Effective electrical conducticity | S/m | ||
| E | Voltage | V | Water saturation coefficient | - | |
| Open circuit voltage | V | Liquid viscosity | Pa/s | ||
| Standard cell voltage | V | Water electro-osmotic coefficient | - | ||
| Activation energy | J/mol | Electrolyte density | kg/m | ||
| f | Friction factor | - | Ionic potential | V | |
| I | Current | A | |||
| j | Current density | A/m | Constants | ||
| Limiting current density | A/m | F | Faraday F = 96 485.33 | sA/mol | |
| Exchange current density | A/m | R | Ideal gas R= 8.314 | J/Kmol | |
| Permeability coefficient | m | ||||
| L | Length | m | Subscripts | ||
| n | Number of cells | - | 2 | Vanadium species | |
| N | Molar flow | mol/s | 3 | Vanadium species | |
| P | Power | W | 4 | Vanadium species | |
| Q | Charge | C | 5 | Vanadium species | |
| Charge capacity | C | c | Cell | ||
| Nominal charge capacity | C | Current collectors | |||
| Critical charge capacity | C | e | Electrolyte | ||
| Internal resistance | H | Hydrogen species | |||
| End-of-life internal resistance | i | Species | |||
| Nominal internal resistance | m | Membrane | |||
| State of charge | - | Negative side | |||
| State of health | - | Oxidised | |||
| Internal resistance state of health | - | Positive side | |||
| T | Temperature | K | Reduced | ||
| U | Heat transfer coefficient | W/mK | s | Solid phase/Stack | |
| v | Stoichiometric number | - | t | Tank | |
| Electrolyte velocity | m/s | ||||
| V | Volume | m | |||
| W | Pump power | W | |||
| z | Ion charge | - |
Abbreviations
The following abbreviations are used in this manuscript:
| Abbreviation | Meaning | Abbreviation | Meaning |
| CA | Compressed Air | PF | Particle Filter |
| DPM | Distributed Parameter Models | PH | Pumped Hydro |
| ECM | Equivalent Circuit Model | PSO | Particle Swarm Optimizer |
| EKF | Extended Kalman Filter | RFB | Redox Flow Battery |
| ESS | Energy Storage System | RLS | Recursive Least Squares |
| GA | Genetic Algorithm | SoC | State of Charge |
| HFC | Hydrogen Fuel Cell | SoH | State of Health |
| HGO | High Gain Observer | SMO | Sliding Mode Observer |
| LPM | Lumped Parameter Models | SVM | Support Vector Machine |
| NN | Neural Network | UKF | Unscented Kalman Filter |
| OCV | Open Circuit Voltage | VRFB | Vanadium Redox Flow Battery |
References
- Martins, F.; Felgueiras, C.; Smitkova, M.; Caetano, N. Analysis of Fossil Fuel Energy Consumption and Environmental Impacts in European Countries. Energies 2019, 12, 964. [Google Scholar] [CrossRef]
- Caetano, N.S.; Mata, T.M.; Martins, A.A.; Felgueiras, M.C. New Trends in Energy Production and Utilization. Energy Procedia 2017, 107, 7–14. [Google Scholar] [CrossRef]
- Renewables 2021: Analysis and Forecasts to 2026, International Energy Agency. 2021. Available online: https://www.iea.org/reports/renewables-2021 (accessed on 25 June 2022).
- Li, L.; Lin, J.; Wu, N.; Xie, S.; Meng, C.; Zheng, Y.; Wang, X.; Zhao, Y. Review and outlook on the international renewable energy development. Energy Built Environ. 2022, 3, 139–157. [Google Scholar] [CrossRef]
- Lucas, A.; Chondrogiannis, S. Smart grid energy storage controller for frequency regulation and peak shaving, using a vanadium redox flow battery. Int. J. Electr. Power Energy Syst. 2016, 80, 26–36. [Google Scholar] [CrossRef]
- Xu, Q.; Zhao, T.S. Fundamental models for flow batteries. Prog. Energy Combust. Sci. 2015, 49, 40–58. [Google Scholar] [CrossRef]
- Cecilia, A.; Carroquino, J.; Roda, V.; Costa-Castelló, R.; Barreras, F. Optimal Energy Management in a Standalone Microgrid, with Photovoltaic Generation, Short-Term Storage, and Hydrogen Production. Energies 2020, 13, 1454. [Google Scholar] [CrossRef]
- Kear, G.; Shah, A.A.; Walsh, F.C. Development of the all-vanadium redox flow battery for energy storage: A review of technological, Financial and policy aspects. Int. J. Energy Res. 2012, 36, 1105–1120. [Google Scholar] [CrossRef]
- Nair, U.R.; Sandelic, M.; Sangwongwanich, A.; Dragicevic, T.; Costa-Castelló, R.; Blaabjerg, F. An analysis of multi objective energy scheduling in PV-BESS system under prediction uncertainty. IEEE Trans. Energy Convers. 2021, 36, 2276–2286. [Google Scholar] [CrossRef]
- Nair, U.R.; Costa-Castelló, R. A Model Predictive Control-Based Energy Management Scheme for Hybrid Storage System in Islanded Microgrids. IEEE Access 2020, 8, 97809–97822. [Google Scholar] [CrossRef]
- Luo, X.; Wang, J.; Dooner, M.; Clarke, J. Overview of current development in electrical energy storage technologies and the application potential in power system operation. Appl. Energy 2014, 137, 511–536. [Google Scholar] [CrossRef] [Green Version]
- Yekini Suberu, M.; Wazir Mustafa, M.; Bashir, N. Energy storage systems for renewable energy power sector integration and mitigation of intermittency. Renew. Sustain. Energy Rev. 2014, 35, 499–514. [Google Scholar] [CrossRef]
- Izzati, L.; Ariffin, W.; Md Zain, A.S.; Nordin, J.; Saad, N. Comparative Study of Energy Storage Systems (ESSs). J. Phys. Conf. Ser. 2021, 1962, 012035. [Google Scholar] [CrossRef]
- Ra, N.; Bhattacharjee, A. An Extensive Study and Analysis of System Modeling and Interfacing of Vanadium Redox Flow Battery. Energy Technol. 2021, 9, 2000708. [Google Scholar] [CrossRef]
- Cunha, A.; Brito, F.P.; Martins, J.; Rodrigues, N.; Monteiro, V.; Afonso, J.L.; Ferreira, P. Assessment of the use of vanadium redox flow batteries for energy storage and fast charging of electric vehicles in gas stations. Energy 2016, 115, 1478–1494. [Google Scholar] [CrossRef]
- da Silva Lima, L.; Quartier, M.; Buchmayr, A.; Sanjuan-Delmás, D.; Laget, H.; Corbisier, D.; Mertens, J. Life cycle assessment of lithium-ion batteries and vanadium redox flow batteries-based renewable energy storage systems. Sustain. Energy Technol. Assess. 2021, 46, 101286. [Google Scholar] [CrossRef]
- Alotto, P.; Guarnieri, M.; Moro, F. Redox flow batteries for the storage of renewable energy: A review. Renew. Sustain. Energy Rev. 2014, 29, 325–335. [Google Scholar] [CrossRef]
- Nair, U.R.; Sandelic, M.; Sangwongwanich, A.; Dragicevic, T.; Costa-Castelló, R.; Blaabjerg, F. Grid congestion mitigation and battery degradation minimisation using model predictive control in PV-based microgrid. IEEE Trans. Energy Convers. 2021, 36, 1500–1509. [Google Scholar] [CrossRef]
- Bueno-Contreras, H.; Ramos, G.A.; Costa-Castelló, R. Power Quality Improvement through a UPQC and a Resonant Observer-Based MIMO Control Strategy. Energies 2021, 14, 6938. [Google Scholar] [CrossRef]
- Funke, S.; Jochem, P.; Ried, S.; Gnann, T. Fast charging stations with stationary batteries: A techno-economic comparison of fast charging along highways and in cities. Transp. Res. Procedia 2020, 48, 3832–3849. [Google Scholar] [CrossRef]
- Barelli, L.; Bidini, G.; Ottaviano, P.A.; Pelosi, D. Vanadium redox flow batteries application to electric buses propulsion: Performance analysis of hybrid energy storage system. J. Energy Storage 2019, 24, 100770. [Google Scholar] [CrossRef]
- Ramos, G.A.; Montobbio de Pérez-Cabrero, T.; Domènech-Mestres, C.; Costa-Castelló, R. Industrial Robots Fuel Cell Based Hybrid Power-Trains: A Comparison between Different Configurations. Electronics 2021, 10, 1431. [Google Scholar] [CrossRef]
- Guarnieri, M.; Mattavelli, P.; Petrone, G.; Spagnuolo, G. Vanadium redox flow batteries: Potentials and challenges of an emerging storage technology. IEEE Ind. Electron. Mag. 2016, 10, 20–31. [Google Scholar] [CrossRef]
- Reynard, D.; Girault, H. Combined hydrogen production and electricity storage using a vanadium-manganese redox dual-flow battery. Cell Rep. Phys. Sci. 2021, 2, 100556. [Google Scholar] [CrossRef]
- Sun, C.; Zhang, H. Review of the Development of First-Generation Redox Flow Batteries: Iron-Chromium System. ChemSusChem 2022, 15, e202101798. [Google Scholar] [CrossRef] [PubMed]
- Cao, J.; Tian, J.; Xu, J.; Wang, Y. Organic Flow Batteries: Recent Progress and Perspectives. Energy Fuels 2020, 34, 13384–13411. [Google Scholar] [CrossRef]
- Skyllas-Kazacos, M.; McCann, J. Chapter 10—Vanadium redox flow batteries (VRBs) for medium- and large-scale energy storage. In Advances in Batteries for Medium and Large-Scale Energy Storage; Menictas, C., Skyllas-Kazacos, M., Lim, T.M., Eds.; Woodhead Publishing Series in Energy; Woodhead Publishing: Sawston, UK, 2015; pp. 329–386. [Google Scholar] [CrossRef]
- Badwal, S.P.S.; Giddey, S.S.; Munnings, C.; Bhatt, A.I.; Hollenkamp, A.F. Emerging electrochemical energy conversion and storage technologies. Front. Chem. 2014, 2, 79. [Google Scholar] [CrossRef] [PubMed]
- Chatzivasileiadi, A.; Ampatzi, E.; Knight, I. Characteristics of electrical energy storage technologies and their applications in buildings. Renew. Sustain. Energy Rev. 2013, 25, 814–830. [Google Scholar] [CrossRef]
- Zhou, H.; Zhang, H.; Zhao, P.; Yi, B. A comparative study of carbon felt and activated carbon based electrodes for sodium polysulfide/bromine redox flow battery. Electrochim. Acta 2006, 51, 6304–6312. [Google Scholar] [CrossRef]
- Xu, Y.; Wen, Y.H.; Cheng, J.; Cao, G.P.; Yang, Y.S. A study of tiron in aqueous solutions for redox flow battery application. Electrochim. Acta 2010, 55, 715–720. [Google Scholar] [CrossRef]
- Mirle, C.; Medabalmi, V.; Ramanujam, K. Crossover-free hydroxy-substituted quinone anolyte and potassium ferrocyanide catholyte for aqueous alkaline organic redox flow battery. Catal. Today 2021, 370, 173–180. [Google Scholar] [CrossRef]
- Zhao, P.; Zhang, H.; Zhou, H.; Yi, B. Nickel foam and carbon felt applications for sodium polysulfide/bromine redox flow battery electrodes. Electrochim. Acta 2005, 51, 1091–1098. [Google Scholar] [CrossRef]
- DeBruler, C.; Hu, B.; Moss, J.; Luo, J.; Liu, T.L. A Sulfonate-Functionalized Viologen Enabling Neutral Cation Exchange, Aqueous Organic Redox Flow Batteries toward Renewable Energy Storage. ACS Energy Lett. 2018, 3, 663–668. [Google Scholar] [CrossRef]
- You, D.; Zhang, H.; Chen, J. A simple model for the vanadium redox battery. Electrochim. Acta 2009, 54, 6827–6836. [Google Scholar] [CrossRef]
- Eustace, D.J. Bromine Complexation in Zinc-Bromine Circulating Batteries. J. Electrochem. Soc. 1980, 127, 528–532. [Google Scholar] [CrossRef]
- Weber, A.; Mench, M.; Meyers, J. Redox flow batteries: A review. J. Appl. Electrochem. 2011, 41, 1137. [Google Scholar] [CrossRef]
- Iwakiri, I.; Antunes, T.; Almeida, H.; Sousa, J.P.; Figueira, R.B.; Mendes, A. Redox Flow Batteries: Materials, Design and Prospects. Energies 2021, 14, 5643. [Google Scholar] [CrossRef]
- Arévalo-Cid, P.; Dias, P.; Mendes, A.; Azevedo, J. Redox flow batteries: A new frontier on energy storage. Sustain. Energy Fuels 2021, 5, 5366–5419. [Google Scholar] [CrossRef]
- Lv, Y.; Han, C.; Zhu, Y.; Zhang, T.; Yao, S.; He, Z.; Dai, L.; Wang, L. Recent advances in metals and metal oxides as catalysts for vanadium redox flow battery: Properties, structures, and perspectives. J. Mater. Sci. Technol. 2021, 75, 96–109. [Google Scholar] [CrossRef]
- Ma, C.T. A novel state of charge estimating scheme based on an air-gap fiber interferometer sensor for the vanadium redox flow battery. Energies 2020, 13, 291. [Google Scholar] [CrossRef] [Green Version]
- Aramendia, I.; Fernandez-Gamiz, U.; Martinez-San-vicente, A.; Zulueta, E.; Lopez-Guede, J.M. Vanadium redox flow batteries: A review oriented to fluid-dynamic optimization. Energies 2021, 14, 176. [Google Scholar] [CrossRef]
- Moro, F.; Trovò, A.; Bortolin, S.; Col, D.D.; Guarnieri, M. An alternative low-loss stack topology for vanadium redox flow battery: Comparative assessment. J. Power Sources 2017, 340, 229–241. [Google Scholar] [CrossRef]
- Clemente, A.; Costa-Castelló, R. Redox flow batteries: A literature review oriented to automatic control. Energies 2020, 13, 4514. [Google Scholar] [CrossRef]
- Ghimire, P.C.; Bhattarai, A.; Lim, T.M.; Wai, N.; Skyllas-Kazacos, M.; Yan, Q. In-situ tools used in vanadium redox flow battery research—Review. Batteries 2021, 7, 53. [Google Scholar] [CrossRef]
- Nolte, O.; Volodin, I.A.; Stolze, C.; Hager, M.D.; Schubert, U.S. Trust is good, control is better: A review on monitoring and characterization techniques for flow battery electrolytes. Mater. Horizons 2021, 8, 1866–1925. [Google Scholar] [CrossRef]
- Li, N.; Zhang, Y.; He, F.; Zhu, L.; Zhang, X.; Ma, Y.; Wang, S. Review of lithium-ion battery state of charge estimation. Glob. Energy Interconnect. 2021, 4, 619–630. [Google Scholar] [CrossRef]
- Esan, O.; Shi, X.; Pan, Z.; Huo, X.; An, L.; Zhao, T. Modeling and Simulation of Flow Batteries. Adv. Energy Mater. 2020, 10, 2000758. [Google Scholar] [CrossRef]
- Satola, B. Review—Bipolar Plates for the Vanadium Redox Flow Battery. J. Electrochem. Soc. 2021, 168, 060503. [Google Scholar] [CrossRef]
- Lourenssen, K.; Williams, J.; Ahmadpour, F.; Clemmer, R.; Tasnim, S. Vanadium redox flow batteries: A comprehensive review. J. Energy Storage 2019, 25, 100844. [Google Scholar] [CrossRef]
- Jirabovornwisut, T.; Arpornwichanop, A. A review on the electrolyte imbalance in vanadium redox flow batteries. Int. J. Hydrogen Energy 2019, 44, 24485–24509. [Google Scholar] [CrossRef]
- Skyllas-Kazacos, M.; Goh, L. Modeling of vanadium ion diffusion across the ion exchange membrane in the vanadium redox battery. J. Membr. Sci. 2012, 399–400, 43–48. [Google Scholar] [CrossRef]
- Yuan, X.Z.; Song, C.; Platt, A.; Zhao, N.; Wang, H.; Li, H.; Fatih, K.; Jang, D. A review of all-vanadium redox flow battery durability: Degradation mechanisms and mitigation strategies. Int. J. Energy Res. 2019, 43, 6599–6638. [Google Scholar] [CrossRef]
- Kim, D.K.; Yoon, S.J.; Kim, S. Transport phenomena associated with capacity loss of all-vanadium redox flow battery. Int. J. Heat Mass Transf. 2020, 148, 119040. [Google Scholar] [CrossRef]
- Poli, N.; Schäffer, M.; Trovò, A.; Noack, J.; Guarnieri, M.; Fischer, P. Novel electrolyte rebalancing method for vanadium redox flow batteries. Chem. Eng. J. 2021, 405, 126583. [Google Scholar] [CrossRef]
- Schweiss, R.; Pritzl, A.; Meiser, C. Parasitic Hydrogen Evolution at Different Carbon Fiber Electrodes in Vanadium Redox Flow Batteries. J. Electrochem. Soc. 2016, 163, A2089–A2094. [Google Scholar] [CrossRef]
- Shah, A.A.; Al-Fetlawi, H.; Walsh, F.C. Dynamic modelling of hydrogen evolution effects in the all-vanadium redox flow battery. Electrochim. Acta 2010, 55, 1125–1139. [Google Scholar] [CrossRef]
- Sun, C.N.; Delnick, F.M.; Baggetto, L.; Veith, G.M.; Zawodzinski, T.A. Hydrogen evolution at the negative electrode of the all-vanadium redox flow batteries. J. Power Sources 2014, 248, 560–564. [Google Scholar] [CrossRef]
- Xu, Q. Corrosion behavior of a bipolar plate of carbon-polythene composite in a vanadium redox flow battery. RSC Adv. 2015, 5, 5928. [Google Scholar] [CrossRef]
- Al-Fetlawi, H.; Shah, A.A.; Walsh, F.C. Modelling the effects of oxygen evolution in the all-vanadium redox flow battery. Electrochim. Acta 2010, 55, 3192–3205. [Google Scholar] [CrossRef]
- Choi, N.H.; kwan Kwon, S.; Kim, H. Analysis of the Oxidation of the V(II) by Dissolved Oxygen Using UV-Visible Spectrophotometry in a Vanadium Redox Flow Battery. J. Electrochem. Soc. 2013, 160, A973–A979. [Google Scholar] [CrossRef]
- Ngamsai, K.; Arpornwichanop, A. Investigating the air oxidation of V(II) ions in a vanadium redox flow battery. J. Power Sources 2015, 295, 292–298. [Google Scholar] [CrossRef]
- Wei, Z.; Zhao, J.; Xiong, B. Dynamic electro-thermal modeling of all-vanadium redox flow battery with forced cooling strategies. Appl. Energy 2014, 135, 1–10. [Google Scholar] [CrossRef]
- Rho, K.H.; Yoon, S.J.; Ryu, J.; Cho, S.M.; Kim, M.S.; Kim, D.K. Study on thermal behavior of vanadium redox flow battery at low temperature to prevent precipitation. J. Energy Storage 2022, 49, 104110. [Google Scholar] [CrossRef]
- Roznyatovskaya, N.; Herr, T.; Küttinger, M.; Fühl, M.; Noack, J.; Pinkwart, K.; Tübke, J. Detection of capacity imbalance in vanadium electrolyte and its electrochemical regeneration for all-vanadium redox-flow batteries. J. Power Sources 2016, 302, 79–83. [Google Scholar] [CrossRef]
- Li, Z.; Liu, L.; Zhao, Y.; Xi, J.; Wu, Z.; Qiu, X. The indefinite cycle life via a method of mixing and online electrolysis for vanadium redox flow batteries. J. Power Sources 2019, 438, 226990. [Google Scholar] [CrossRef]
- Chen, J.Y.; Hsieh, C.L.; Hsu, N.Y.; Chou, Y.S.; Chen, Y.S. Determining the Limiting Current Density of Vanadium Redox Flow Batteries. Energies 2014, 7, 5863–5873. [Google Scholar] [CrossRef]
- Zhou, X.; Zeng, Y.; Zhu, X.; Wei, L.; Zhao, T. A high-performance dual-scale porous electrode for vanadium redox flow batteries. J. Power Sources 2016, 325, 329–336. [Google Scholar] [CrossRef]
- Jiang, H.; Sun, J.; Wei, L.; Wu, M.; Shyy, W.; Zhao, T. A high power density and long cycle life vanadium redox flow battery. Energy Storage Mater. 2020, 24, 529–540. [Google Scholar] [CrossRef]
- Clemente, A.; Ramos, G.A.; Costa-Castelló, R. Voltage h∞ control of a vanadium redox flow battery. Electronics 2020, 9, 1567. [Google Scholar] [CrossRef]
- Blanc, C. Modeling of a Vanadium Redox Flow Battery Electricity Storage System. Ph.D. Thesis, École Polytechnique Federale De Lausanne, Lausanne, Switzerland, 2009. [Google Scholar]
- Kim, J.; Park, H. Electrokinetic parameters of a vanadium redox flow battery with varying temperature and electrolyte flow rate. Renew. Energy 2019, 138, 284–291. [Google Scholar] [CrossRef]
- Shen, P.; Ouyang, M.; Lu, L.; Li, J.; Feng, X. The co-estimation of state of charge, state of health, and state of function for lithium-ion batteries in electric vehicles. IEEE Trans. Veh. Technol. 2018, 67, 92–103. [Google Scholar] [CrossRef]
- Noura, N.; Boulon, L.; Jemeï, S. A review of battery state of health estimation methods: Hybrid electric vehicle challenges. World Electr. Veh. J. 2020, 11, 66. [Google Scholar] [CrossRef]
- Fornaro, P.; Puleston, T.; Puleston, P.; Serra-Prat, M.; Costa-Castelló, R.; Battaiotto, P. Redox flow battery time-varying parameter estimation based on high-order sliding mode differentiators. Int. J. Energy Res. 2022. [Google Scholar] [CrossRef]
- Zhou, X.L.; Zhao, T.S.; An, L.; Zeng, Y.K.; Wei, L. Modeling of ion transport through a porous separator in vanadium redox flow batteries. J. Power Sources 2016, 327, 67–76. [Google Scholar] [CrossRef]
- Shah, A.A.; Watt-Smith, M.J.; Walsh, F.C. A dynamic performance model for redox-flow batteries involving soluble species. Electrochim. Acta 2008, 53, 8087–8100. [Google Scholar] [CrossRef]
- Delgado, N.M.; Monteiro, R.; Cruz, J.; Bentien, A.; Mendes, A. Shunt currents in vanadium redox flow batteries—A parametric and optimization study. Electrochim. Acta 2022, 403, 139667. [Google Scholar] [CrossRef]
- Yan, Y.; Skyllas-Kazacos, M.; Bao, J. Effects of battery design, environmental temperature and electrolyte flowrate on thermal behaviour of a vanadium redox flow battery in different applications. J. Energy Storage 2017, 11, 104–118. [Google Scholar] [CrossRef]
- Al-Fetlawi, H.; Shah, A.A.; Walsh, F.C. Non-isothermal modelling of the all-vanadium redox flow battery. Electrochim. Acta 2009, 55, 78–89. [Google Scholar] [CrossRef]
- Zhou, X.L.; Zhao, T.S.; An, L.; Zeng, Y.K.; Yan, X.H. A vanadium redox flow battery model incorporating the effect of ion concentrations on ion mobility. Appl. Energy 2015, 158, 157–166. [Google Scholar] [CrossRef]
- Jeong, D.; Jung, S. Numerical analysis of cycling performance of vanadium redox flow battery. Int. J. Energy Res. 2020, 44, 5209–5222. [Google Scholar] [CrossRef]
- Chen, Y.; Xu, Z.; Wang, C.; Bao, J.; Koeppel, B.; Yan, L.; Gao, P.; Wang, W. Analytical modeling for redox flow battery design. J. Power Sources 2021, 482, 228817. [Google Scholar] [CrossRef]
- Chen, Y.; Bao, J.; Xu, Z.; Gao, P.; Yan, L.; Kim, S.; Wang, W. A two-dimensional analytical unit cell model for redox flow battery evaluation and optimization. J. Power Sources 2021, 506, 230192. [Google Scholar] [CrossRef]
- Knehr, K.W.; Agar, E.; Dennison, C.R.; Kalidindi, A.R.; Kumbur, E.C. A Transient Vanadium Flow Battery Model Incorporating Vanadium Crossover and Water Transport through the Membrane. J. Electrochem. Soc. 2012, 159, A1446–A1459. [Google Scholar] [CrossRef]
- Yang, X.G.; Ye, Q.; Cheng, P.; Zhao, T.S. Effects of the electric field on ion crossover in vanadium redox flow batteries. Appl. Energy 2015, 145, 306–319. [Google Scholar] [CrossRef]
- Vynnycky, M. Analysis of a model for the operation of a vanadium redox battery. Energy 2011, 36, 2242–2256. [Google Scholar] [CrossRef]
- Li, Y.; Skyllas-Kazacos, M.; Bao, J. A dynamic plug flow reactor model for a vanadium redox flow battery cell. J. Power Sources 2016, 311, 57–67. [Google Scholar] [CrossRef]
- Chou, Y.S.; Yen, S.C.; Arpornwichanop, A.; Singh, B.; Chen, Y.S. Mathematical Model to Study Vanadium Ion Crossover in an All-Vanadium Redox Flow Battery. ACS Sustain. Chem. Eng. 2021, 9, 5377–5387. [Google Scholar] [CrossRef]
- Milshtein, J.D.; Tenny, K.M.; Barton, J.L.; Drake, J.; Darling, R.M.; Brushett, F.R. Quantifying Mass Transfer Rates in Redox Flow Batteries. J. Electrochem. Soc. 2017, 164, E3265–E3275. [Google Scholar] [CrossRef]
- Chen, C.L.; Yeoh, H.K.; Chakrabarti, M.H. An enhancement to Vynnycky’s model for the all-vanadium redox flow battery. Electrochim. Acta 2014, 120, 167–179. [Google Scholar] [CrossRef]
- Barton, J.L.; Brushett, F.R. A one-dimensional stack model for redox flow battery analysis and operation. Batteries 2019, 5, 25. [Google Scholar] [CrossRef] [Green Version]
- Sharma, A.K.; Ling, C.Y.; Birgersson, E.; Vynnycky, M.; Han, M. Verified reduction of dimensionality for an all-vanadium redox flow battery model. J. Power Sources 2015, 279, 345–350. [Google Scholar] [CrossRef]
- Shah, A.A.; Tangirala, R.; Singh, R.; Wills, R.G.A.; Walsh, F.C. A Dynamic Unit Cell Model for the All-Vanadium Flow Battery. J. Electrochem. Soc. 2011, 158, A671. [Google Scholar] [CrossRef]
- Zhang, Y.; Zhao, J.; Wang, P.; Skyllas-Kazacos, M.; Xiong, B.; Badrinarayanan, R. A comprehensive equivalent circuit model of all-vanadium redox flow battery for power system analysis. J. Power Sources 2015, 290, 14–24. [Google Scholar] [CrossRef]
- Kleinsteinberg, B.; Klick, S.; Sauer, D.U. Empirical approach to determine open-circuit voltage of a vanadium-redox-flow battery for models, based on published data for anion-exchange and cation-exchange membranes and temperature dependency. J. Energy Storage 2020, 28, 101109. [Google Scholar] [CrossRef]
- Knehr, K.; Kumbur, E. Open circuit voltage of vanadium redox flow batteries: Discrepancy between models and experiments. Electrochem. Commun. 2011, 13, 342–345. [Google Scholar] [CrossRef]
- Murthy, S.K.; Sharma, A.K.; Choo, C.; Birgersson, E. Analysis of Concentration Overpotential in an All-Vanadium Redox Flow Battery. J. Electrochem. Soc. 2018, 165, A1746–A1752. [Google Scholar] [CrossRef]
- Pugach, M.; Kondratenko, M.; Briola, S.; Bischi, A. Zero dimensional dynamic model of vanadium redox flow battery cell incorporating all modes of vanadium ions crossover. Appl. Energy 2018, 226, 560–569. [Google Scholar] [CrossRef]
- Chen, H.; Cheng, M.; Feng, X.; Chen, Y.; Chen, F.; Xu, J. Analysis and optimization for multi-stack vanadium flow battery module incorporating electrode permeability. J. Power Sources 2021, 515, 230606. [Google Scholar] [CrossRef]
- Li, M.; Hikihara, T. A coupled dynamical model of redox flow battery based on chemical reaction, fluid flow, and electrical circuit. IEICE Trans. Fundam. Electron. Commun. Comput. Sci. 2008, E91-A, 1741–1747. [Google Scholar] [CrossRef]
- Li, Y.; Sun, L.; Cao, L.; Bao, J.; Skyllas-Kazacos, M. Dynamic model based membrane permeability estimation for online SOC imbalances monitoring of vanadium redox flow batteries. J. Energy Storage 2021, 39, 102688. [Google Scholar] [CrossRef]
- Darling, R.M.; Weber, A.Z.; Tucker, M.C.; Perry, M.L. The Influence of Electric Field on Crossover in Redox-Flow Batteries. J. Electrochem. Soc. 2015, 163, A5014–A5022. [Google Scholar] [CrossRef]
- Zhang, C.; Zhao, T.; Xu, Q.; An, L.; Zhao, G. Effects of operating temperature on the performance of vanadium redox flow batteries. Appl. Energy 2015, 155, 349–353. [Google Scholar] [CrossRef]
- Wei, L.; Zhao, T.S.; Xu, Q.; Zhou, X.L.; Zhang, Z.H. In-situ investigation of hydrogen evolution behavior in vanadium redox flow batteries. Appl. Energy 2017, 190, 1112–1118. [Google Scholar] [CrossRef]
- Tang, A.; Bao, J.; Skyllas-Kazacos, M. Thermal modelling of battery configuration and self-discharge reactions in vanadium redox flow battery. J. Power Sources 2012, 216, 489–501. [Google Scholar] [CrossRef]
- Trovò, A.; Saccardo, A.; Giomo, M.; Guarnieri, M. Thermal modeling of industrial-scale vanadium redox flow batteries in high-current operations. J. Power Sources 2019, 424, 204–214. [Google Scholar] [CrossRef]
- Yan, Y.; Li, Y.; Skyllas-Kazacos, M.; Bao, J. Modelling and simulation of thermal behaviour of vanadium redox flow battery. J. Power Sources 2016, 322, 116–128. [Google Scholar] [CrossRef]
- Tang, A.; Bao, J.; Skyllas-Kazacos, M. Studies on pressure losses and flow rate optimization in vanadium redox flow battery. J. Power Sources 2014, 248, 154–162. [Google Scholar] [CrossRef]
- König, S.; Suriyah, M.R.; Leibfried, T. Innovative model-based flow rate optimization for vanadium redox flow batteries. J. Power Sources 2016, 333, 134–144. [Google Scholar] [CrossRef]
- Karrech, A.; Regenauer-Lieb, K.; Abbassi, F. Vanadium flow batteries at variable flow rates. J. Energy Storage 2022, 45, 103623. [Google Scholar] [CrossRef]
- Akter, M.P.; Li, Y.; Bao, J.; Skyllas-Kazacos, M.; Rahman, M.F. Optimal charging of vanadium redox flow battery with time-varying input power. Batteries 2019, 5, 20. [Google Scholar] [CrossRef] [Green Version]
- McCloy, R.; Li, Y.; Bao, J.; Skyllas-Kazacos, M. Electrolyte flow rate control for vanadium redox flow batteries using the linear parameter varying framework. J. Process. Control. 2022, 115, 36–47. [Google Scholar] [CrossRef]
- Wei, Z.; Zhao, J.; Skyllas-Kazacos, M.; Xiong, B. Dynamic thermal-hydraulic modeling and stack flow pattern analysis for all-vanadium redox flow battery. J. Power Sources 2014, 260, 89–99. [Google Scholar] [CrossRef]
- Xiao, W.; Tan, L. Control strategy optimization of electrolyte flow rate for all vanadium redox flow battery with consideration of pump. Renew. Energy 2019, 133, 1445–1454. [Google Scholar] [CrossRef]
- Dong, S.; Feng, J.; Zhang, Y.; Tong, S.; Tang, J.; Xiong, B. State of Charge Estimation of Vanadium Redox Flow Battery Based on Online Equivalent Circuit Model. In Proceedings of the 2021 31st Australasian Universities Power Engineering Conference (AUPEC), Perth, Australia, 26–33 September 2021. [Google Scholar] [CrossRef]
- Xiong, B.; Yang, Y.; Tang, J.; Li, Y.; Wei, Z.; Su, Y.; Zhang, Q. An Enhanced Equivalent Circuit Model of Vanadium Redox Flow Battery Energy Storage Systems Considering Thermal Effects. IEEE Access 2019, 7, 162297–162308. [Google Scholar] [CrossRef]
- Bhattacharjee, A.; Roy, A.; Banerjee, N.; Patra, S.; Saha, H. Precision dynamic equivalent circuit model of a Vanadium Redox Flow Battery and determination of circuit parameters for its optimal performance in renewable energy applications. J. Power Sources 2018, 396, 506–518. [Google Scholar] [CrossRef]
- Cecilia, A.; Serra, M.; Costa-Castelló, R. Nonlinear adaptive observation of the liquid water saturation in polymer electrolyte membrane fuel cells. J. Power Sources 2021, 492, 229641. [Google Scholar] [CrossRef]
- Luna, J.; Costa-Castelló, R.; Strahl, S. Chattering free sliding mode observer estimation of liquid water fraction in proton exchange membrane fuel cells. J. Frankl. Inst. 2020, 357, 13816–13833. [Google Scholar] [CrossRef]
- Cecilia, A.; Costa-Castelló, R. Observador de alta ganancia con zona muerta ajustable para estimar la saturación de agua líquida en pilas de combustible tipo PEM. Rev. Iberoam. Automática Inf. Ind. 2020, 17, 169–180. [Google Scholar] [CrossRef]
- Bernard, P.; Andrieu, V.; Astolfi, D. Observer Design for Continuous-Time Dynamical Systems. Annu. Rev. Control. 2022, 53, 224–248. [Google Scholar] [CrossRef]
- Grewal, M.S.; Andrews, A.P. Kalman Filtering: Theory and Practice; Prentice Hall: Hoboken, NJ, USA, 1993. [Google Scholar]
- He, F.; Shen, W.X.; Kapoor, A.; Honnery, D.; Dayawansa, D. H infinity observer based state of charge estimation for battery packs in electric vehicles. In Proceedings of the 2016 IEEE 11th Conference on Industrial Electronics and Applications (ICIEA), Hefei, China, 5–7 June 2016; pp. 694–699. [Google Scholar] [CrossRef]
- Hannan, M.; Lipu, M.; Hussain, A.; Mohamed, A. A review of lithium-ion battery state of charge estimation and management system in electric vehicle applications: Challenges and recommendations. Renew. Sustain. Energy Rev. 2017, 78, 834–854. [Google Scholar] [CrossRef]
- Moreno, J.A.; Fridman, L. Control por modos deslizantes de orden superior basado en funciones de Lyapunov. Rev. Iberoam. Automática Inf. Ind. 2022. [Google Scholar] [CrossRef]
- Spurgeon, S.K. Sliding mode observers: A survey. Int. J. Syst. Sci. 2008, 39, 751–764. [Google Scholar] [CrossRef]
- Anderson, J.L.; Moré, J.J.; Puleston, P.F.; Costa-Castelló, R. Fuel Cell Module Control Based on Switched/Time-Based Adaptive Super-Twisting Algorithm: Design and Experimental Validation. IEEE Trans. Control. Syst. Technol. 2022, 1–8. [Google Scholar] [CrossRef]
- Anderson, J.L.; Moré, J.; Puleston, P.; Roda, V.; Costa-Castelló, R. Control Super-Twisting con adaptación basada en cruce por cero. Análisis de estabilidad y validación. Rev. Iberoam. Automática Inf. Ind. 2022. [Google Scholar] [CrossRef]
- Clemente, A.; Cecilia, A.; Costa-Castello, R. SOC and diffusion rate estimation in redox flow batteries: An II-based high-gain observer approach. In Proceedings of the 2021 European Control Conference, ECC 2021, Delft, The Netherlands, 29 June–2 July 2021; pp. 1640–1644. [Google Scholar] [CrossRef]
- Xing, Y.; Bernadet, L.; Torrell, M.; Tarancón, A.; Costa-Castelló, R.; Na, J. Offline and online parameter estimation of nonlinear systems: Application to a solid oxide fuel cell system. ISA Trans. 2022. [Google Scholar] [CrossRef]
- Xing, Y.; Na, J.; Chen, M.; Costa-Castelló, R.; Roda, V. Adaptive Nonlinear Parameter Estimation for a Proton Exchange Membrane Fuel Cell. IEEE Trans. Power Electron. 2022, 37, 9012–9023. [Google Scholar] [CrossRef]
- Clemente, A.; Montiel, M.; Barreras, F.; Lozano, A.; Costa-Castelló, R. Vanadium Redox Flow Battery State of Charge Estimation Using a Concentration Model and a Sliding Mode Observer. IEEE Access 2021, 9, 72368–72376. [Google Scholar] [CrossRef]
- Khaki, B.; Das, P. Parameter identification of thermal model of vanadium redox batteries by metaheuristic algorithms. Electrochim. Acta 2021, 394, 139131. [Google Scholar] [CrossRef]
- Li, T.; Zhang, C.; Li, X. Machine learning for flow batteries: Opportunities and challenges. Chem. Sci. 2022, 13, 4740–4752. [Google Scholar] [CrossRef]
- Geiser, J.; Natter, H.; Hempelmann, R.; Morgenstern, B.; Hegetschweiler, K. Photometrical Determination of the State-of-Charge in Vanadium Redox Flow Batteries Part I: In Combination with Potentiometric Titration. Z. Fur Phys. Chem. 2019, 233, 1683–1694. [Google Scholar] [CrossRef]
- Ngamsai, K.; Arpornwichanop, A. Analysis and measurement of the electrolyte imbalance in a vanadium redox flow battery. J. Power Sources 2015, 282, 534–543. [Google Scholar] [CrossRef]
- Skyllas-Kazacos, M.; Kazacos, M. State of charge monitoring methods for vanadium redox flow battery control. J. Power Sources 2011, 196, 8822–8827. [Google Scholar] [CrossRef]
- Liu, L.; Xi, J.; Wu, Z.; Zhang, W.; Zhou, H.; Li, W.; Qiu, X. State of charge monitoring for vanadium redox flow batteries by the transmission spectra of V(IV)/V(V) electrolytes. J. Appl. Electrochem. 2012, 42, 1025–1031. [Google Scholar] [CrossRef]
- Zhang, Y.; Ma, K.; Kuang, X.; Liu, L.; Sun, Y.; Xi, J. Real-Time Study of the Disequilibrium Transfer in Vanadium Flow Batteries at Different States of Charge via Refractive Index Detection. J. Phys. Chem. C 2018, 122, 28550–28555. [Google Scholar] [CrossRef]
- Rudolph, S.; Schröder, U.; Bayanov, I.M.; Blenke, K.; Hage, D. High resolution state of charge monitoring of vanadium electrolytes with IR optical sensor. J. Electroanal. Chem. 2013, 694, 17–22. [Google Scholar] [CrossRef]
- Corcuera, S.; Skyllas-Kazacos, M. State-of-Charge Monitoring and Electrolyte Rebalancing Methods for the Vanadium Redox Flow Battery. Eur. Chem. Bull. 2012, 1, 511–519. [Google Scholar]
- Chou, Y.S.; Hsu, N.Y.; Jeng, K.T.; Chen, K.H.; Yen, S.C. A novel ultrasonic velocity sensing approach to monitoring state of charge of vanadium redox flow battery. Appl. Energy 2016, 182, 253–259. [Google Scholar] [CrossRef]
- Zang, X.; Yan, L.; Yang, Y.; Pan, H.; Nie, Z.; Jung, K.W.; Deng, Z.D.; Wang, W. Monitoring the State-of-Charge of a Vanadium Redox Flow Battery with the Acoustic Attenuation Coefficient: An In Operando Noninvasive Method. Small Methods 2019, 3, 1900494. [Google Scholar] [CrossRef]
- Ressel, S.; Bill, F.; Holtz, L.; Janshen, N.; Chica, A.; Flower, T.; Weidlich, C.; Struckmann, T. State of charge monitoring of vanadium redox flow batteries using half cell potentials and electrolyte density. J. Power Sources 2018, 378, 776–783. [Google Scholar] [CrossRef]
- Li, X.; Xiong, J.; Tang, A.; Qin, Y.; Liu, J.; Yan, C. Investigation of the use of electrolyte viscosity for online state-of-charge monitoring design in vanadium redox flow battery. Appl. Energy 2018, 211, 1050–1059. [Google Scholar] [CrossRef]
- Kroner, I.; Becker, M.; Turek, T. Monitoring the state of charge of the positive electrolyte in a vanadium redox-flow battery with a novel amperometric sensor. Batteries 2019, 5, 5–16. [Google Scholar] [CrossRef]
- Stolze, C.; Rohland, P.; Zub, K.; Nolte, O.; Hager, M.D.; Schubert, U.S. A low-cost amperometric sensor for the combined state-of-charge, capacity, and state-of-health monitoring of redox flow battery electrolytes. Energy Convers. Manag. X 2022, 14, 100188. [Google Scholar] [CrossRef]
- Sun, G.; Lu, J.; Ye, Q.; Ren, L.; Shi, J.; Tang, Y. State of charge estimation using EKF method for VRB. Adv. Mater. Res. 2012, 512–515, 986–994. [Google Scholar] [CrossRef]
- Xiong, B.; Zhao, J.; Wei, Z.; Skyllas-Kazacos, M. Extended Kalman filter method for state of charge estimation of vanadium redox flow battery using thermal-dependent electrical model. J. Power Sources 2014, 262, 50–61. [Google Scholar] [CrossRef]
- Wei, Z.; Lim, T.M.; Skyllas-Kazacos, M.; Wai, N.; Tseng, K.J. Online state of charge and model parameter co-estimation based on a novel multi-timescale estimator for vanadium redox flow battery. Appl. Energy 2016, 172, 169–179. [Google Scholar] [CrossRef]
- Wei, Z.; Tseng, K.J.; Wai, N.; Lim, T.M.; Skyllas-Kazacos, M. Adaptive estimation of state of charge and capacity with online identified battery model for vanadium redox flow battery. J. Power Sources 2016, 332, 389–398. [Google Scholar] [CrossRef]
- Wei, Z.; Bhattarai, A.; Zou, C.; Meng, S.; Lim, T.M.; Skyllas-Kazacos, M. Real-time monitoring of capacity loss for vanadium redox flow battery. J. Power Sources 2018, 390, 261–269. [Google Scholar] [CrossRef]
- Meng, S.; Xiong, B.; Lim, T.M. Model-based condition monitoring of a vanadium redox flow battery. Energies 2019, 14, 3005. [Google Scholar] [CrossRef] [Green Version]
- Xiong, B.; Zhao, J.; Su, Y.; Wei, Z.; Skyllas-Kazacos, M. State of Charge Estimation of Vanadium Redox Flow Battery Based on Sliding Mode Observer and Dynamic Model Including Capacity Fading Factor. IEEE TRansactions Sustain. Energy 2017, 8, 1658–1667. [Google Scholar] [CrossRef]
- Xiong, B.; Zhang, H.; Deng, X.; Tang, J. State of charge estimation based on sliding mode observer for vanadium redox flow battery. In Proceedings of the 2017 IEEE Power Energy & Society General Meeting, Chicago, IL, USA, 16–20 July 2017; pp. 1–5. [Google Scholar] [CrossRef]
- Qiu, Y.; Li, X.; Chen, W.; Duan, Z.; Yu, L. State of charge estimation of vanadium redox battery based on improved extended Kalman filter. ISA Trans. 2019, 94, 326–337. [Google Scholar] [CrossRef]
- Mohamed, M.R.; Ahmad, H.; Seman, M.N.; Razali, S.; Najib, M.S. Electrical circuit model of a vanadium redox flow battery using extended Kalman filter. J. Power Sources 2013, 239, 284–293. [Google Scholar] [CrossRef]
- Yu, V.; Headley, A.; Chen, D. A constrained extended kalman filter for state-of-charge estimation of a vanadium redox flow battery with crossover effects. J. Dyn. Syst. Meas. Control. 2014, 136, 041013. [Google Scholar] [CrossRef]
- Jienkulsawad, P.; Jirabovornwisut, T.; Chen, Y.S.; Arpornwichanop, A. Improving the Performance of an All-Vanadium Redox Flow Battery under Imbalance Conditions: Online Dynamic Optimization Approach. ACS Sustain. Chem. Eng. 2020, 8, 13610–13622. [Google Scholar] [CrossRef]
- Khaki, B.; Das, P. Sensorless parameter estimation of vanadium redox flow batteries in charging mode considering capacity fading. J. Energy Storage 2021, 33, 102033. [Google Scholar] [CrossRef]
- Khaki, B.; Das, P. An equivalent circuit model for Vanadium Redox Batteries via hybrid extended Kalman filter and Particle filter methods. J. Energy Storage 2021, 39, 102587. [Google Scholar] [CrossRef]
- Cao, H.; Zhu, X.; Shen, H.; Shao, M. A neural network based method for real-time measurement of capacity and SOC of vanadium redox flow battery. Int. Conf. Fuel Cell Sci. Eng. Technol. 2015, 56611, V001T02A001. [Google Scholar] [CrossRef]
- Niu, H.; Huang, J.; Wang, C. State of Charge Prediction Study of Vanadium Redox-Flow Battery with BP Neural Network. In Proceedings of the IEEE International Conference on Artificial Intelligence and Computer Applications (ICAICA), Dalian, China, 27–29 June 2020. [Google Scholar] [CrossRef]
- Wei, Z.; Xiong, R.; Lim, T.M.; Meng, S.; Skyllas-Kazacos, M. Online monitoring of state of charge and capacity loss for vanadium redox flow battery based on autoregressive exogenous modeling. J. Power Sources 2018, 402, 252–262. [Google Scholar] [CrossRef]
- Zhao, X.; Kim, K.; Jung, S. State-of-charge estimation using data fusion for vanadium redox flow battery. J. Energy Storage 2022, 52, 104852. [Google Scholar] [CrossRef]
- Khaki, B.; Das, P. Fast and simplified algorithms for SoC and SoH estimation of vanadium redox flow batteries. IEEE Green Technol. Conf. 2021, 2021, 494–501. [Google Scholar] [CrossRef]
- He, Q.Z.; Stinis, P.; Tartakovsky, A.M. Physics-constrained deep neural network method for estimating parameters in a redox flow battery. J. Power Sources 2022, 528, 231147. [Google Scholar] [CrossRef]
- Wei, Z.; Meng, S.; Tseng, K.J.; Lim, T.M.; Soong, B.H.; Skyllas-Kazacos, M. An adaptive model for vanadium redox flow battery and its application for online peak power estimation. J. Power Sources 2017, 344, 195–207. [Google Scholar] [CrossRef]
- Xiong, B.; Dong, S.; Li, Y.; Tang, J.; Su, Y.; Gooi, H.B. Peak Power Estimation of Vanadium Redox Flow Batteries Based on Receding Horizon Control. IEEE J. Emerg. Sel. Top. Power Electron. 2022. [Google Scholar] [CrossRef]
- Choi, Y.Y.; Kim, S.; Kim, S.; Choi, J.I. Multiple parameter identification using genetic algorithm in vanadium redox flow batteries. J. Power Sources 2020, 450, 227684. [Google Scholar] [CrossRef]
- Yu, V.K.; Chen, D. Peak power prediction of a vanadium redox flow battery. J. Power Sources 2014, 268, 261–268. [Google Scholar] [CrossRef]
- Khaki, B.; Das, P. Voltage loss and capacity fade reduction in vanadium redox battery by electrolyte flow control. Electrochim. Acta 2022, 405, 139842. [Google Scholar] [CrossRef]
- Won, S.; Oh, K.; Ju, H. Numerical analysis of vanadium crossover effects in all-vanadium redox flow batteries. Electrochim. Acta 2015, 177, 310–320. [Google Scholar] [CrossRef]
Figure 1.
General scheme of a VRFB and its main reactions.

Figure 2.
Scheme of a VRFB with its most important side reactions.

Figure 3.
Illustration of the regions of prevalence of each overpotential in a cell voltage vs. current density curve.
Figure 3.
Illustration of the regions of prevalence of each overpotential in a cell voltage vs. current density curve.

Figure 4.
Scheme of a VRFB with the temperatures involved in the thermal balances.

Figure 5.
Equivalent electric circuit model of a VRFB.

Figure 6.
General scheme of a state observer for a VRFB.


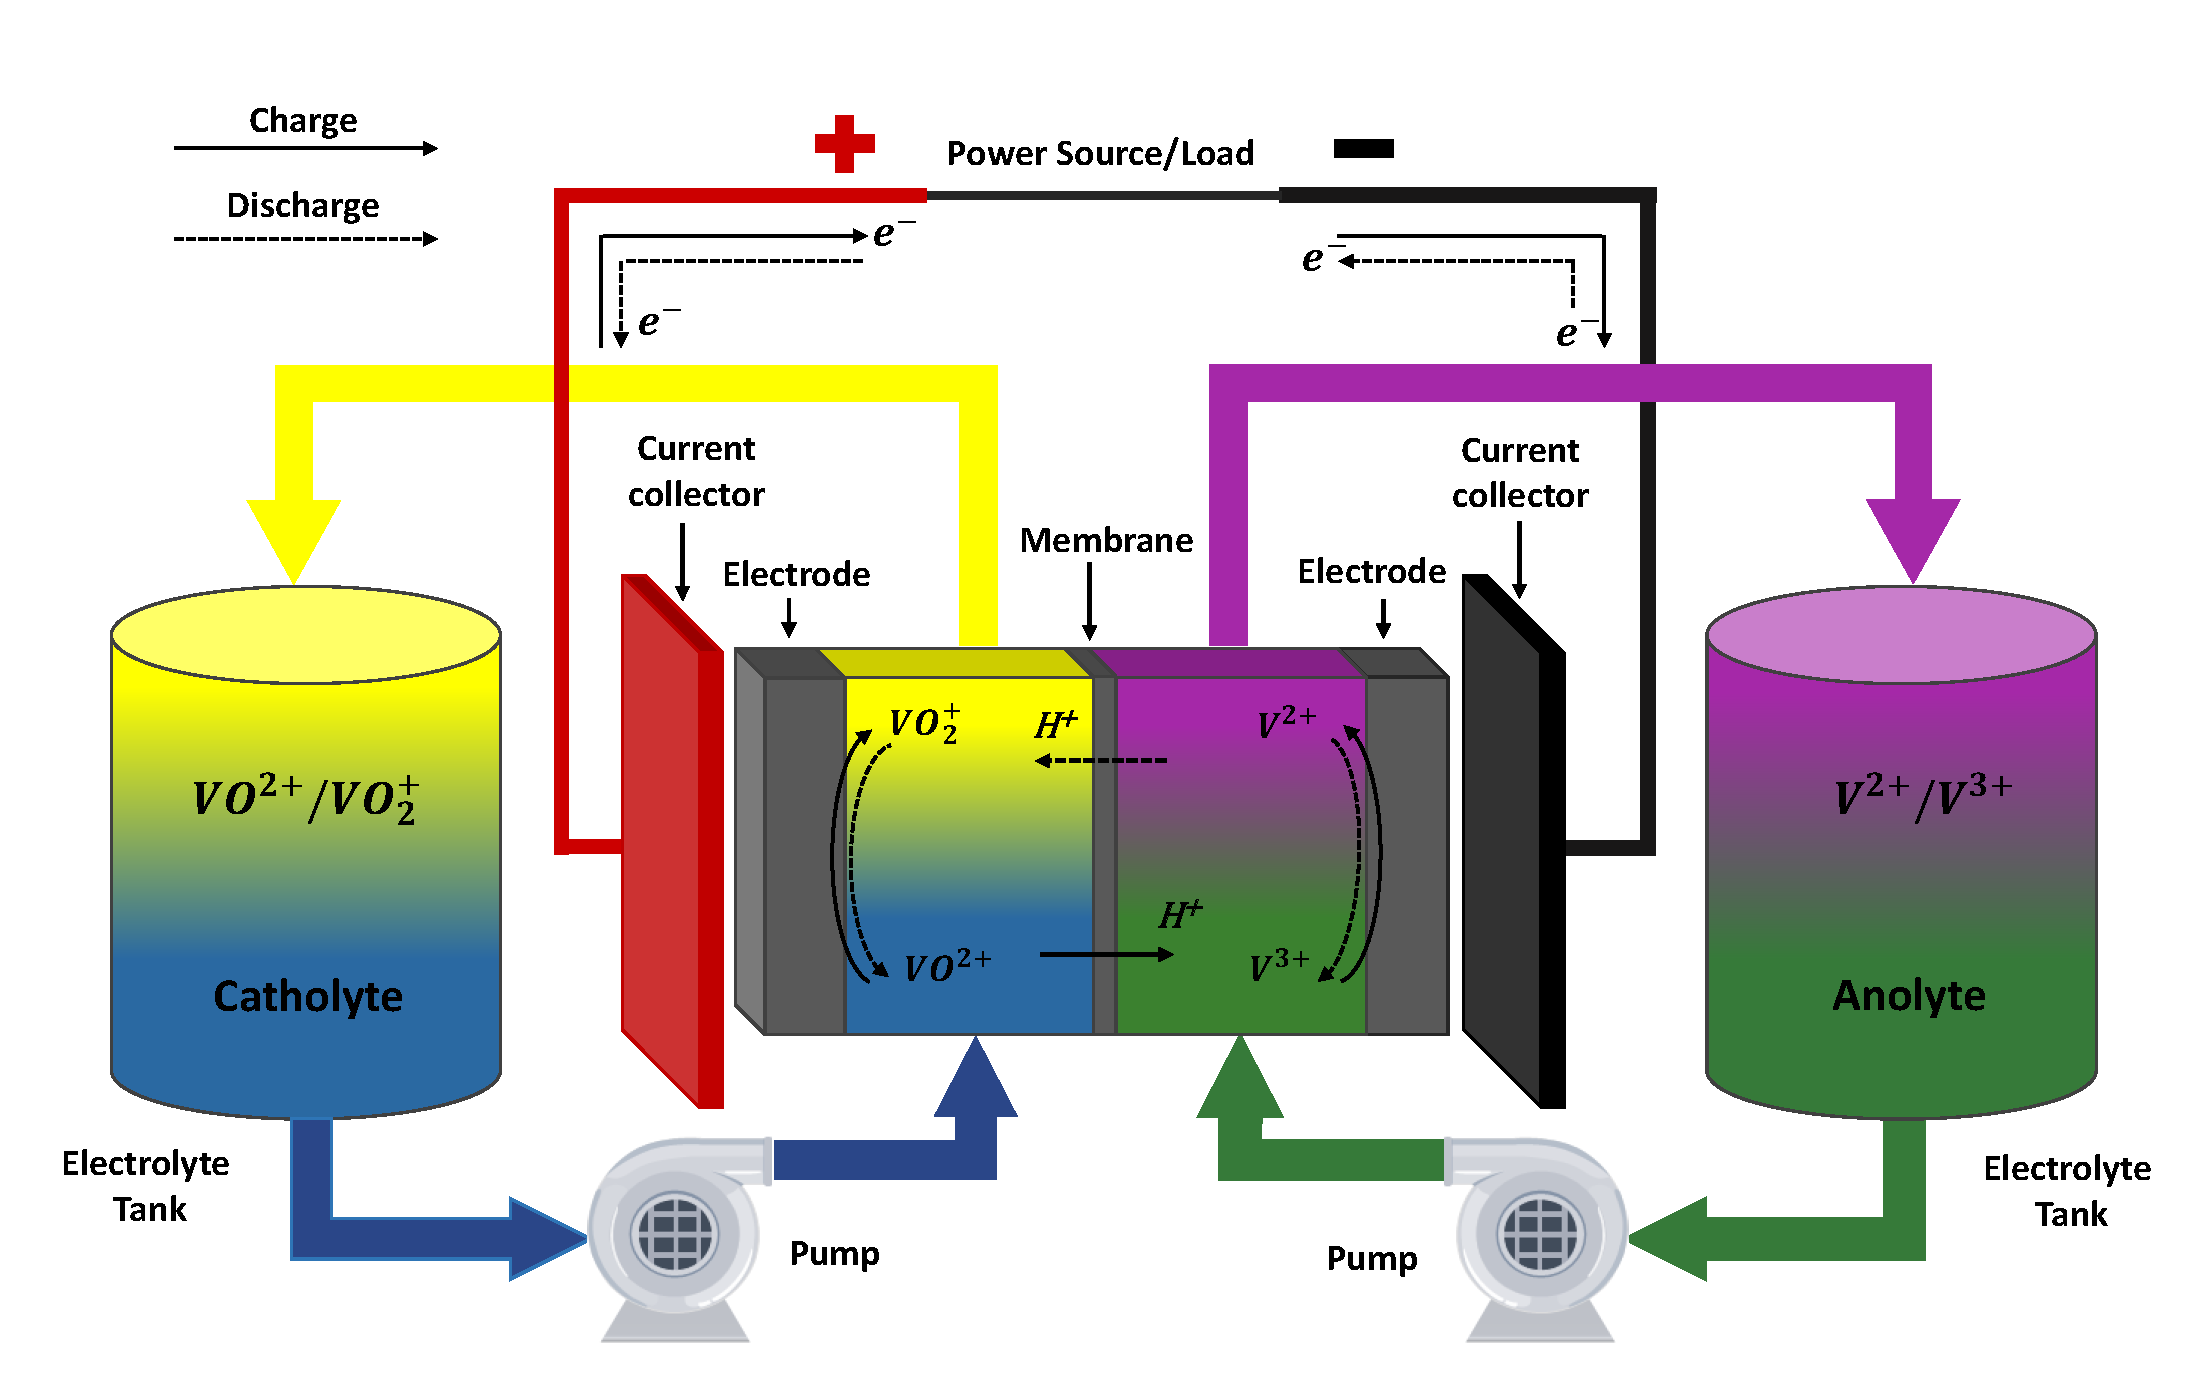
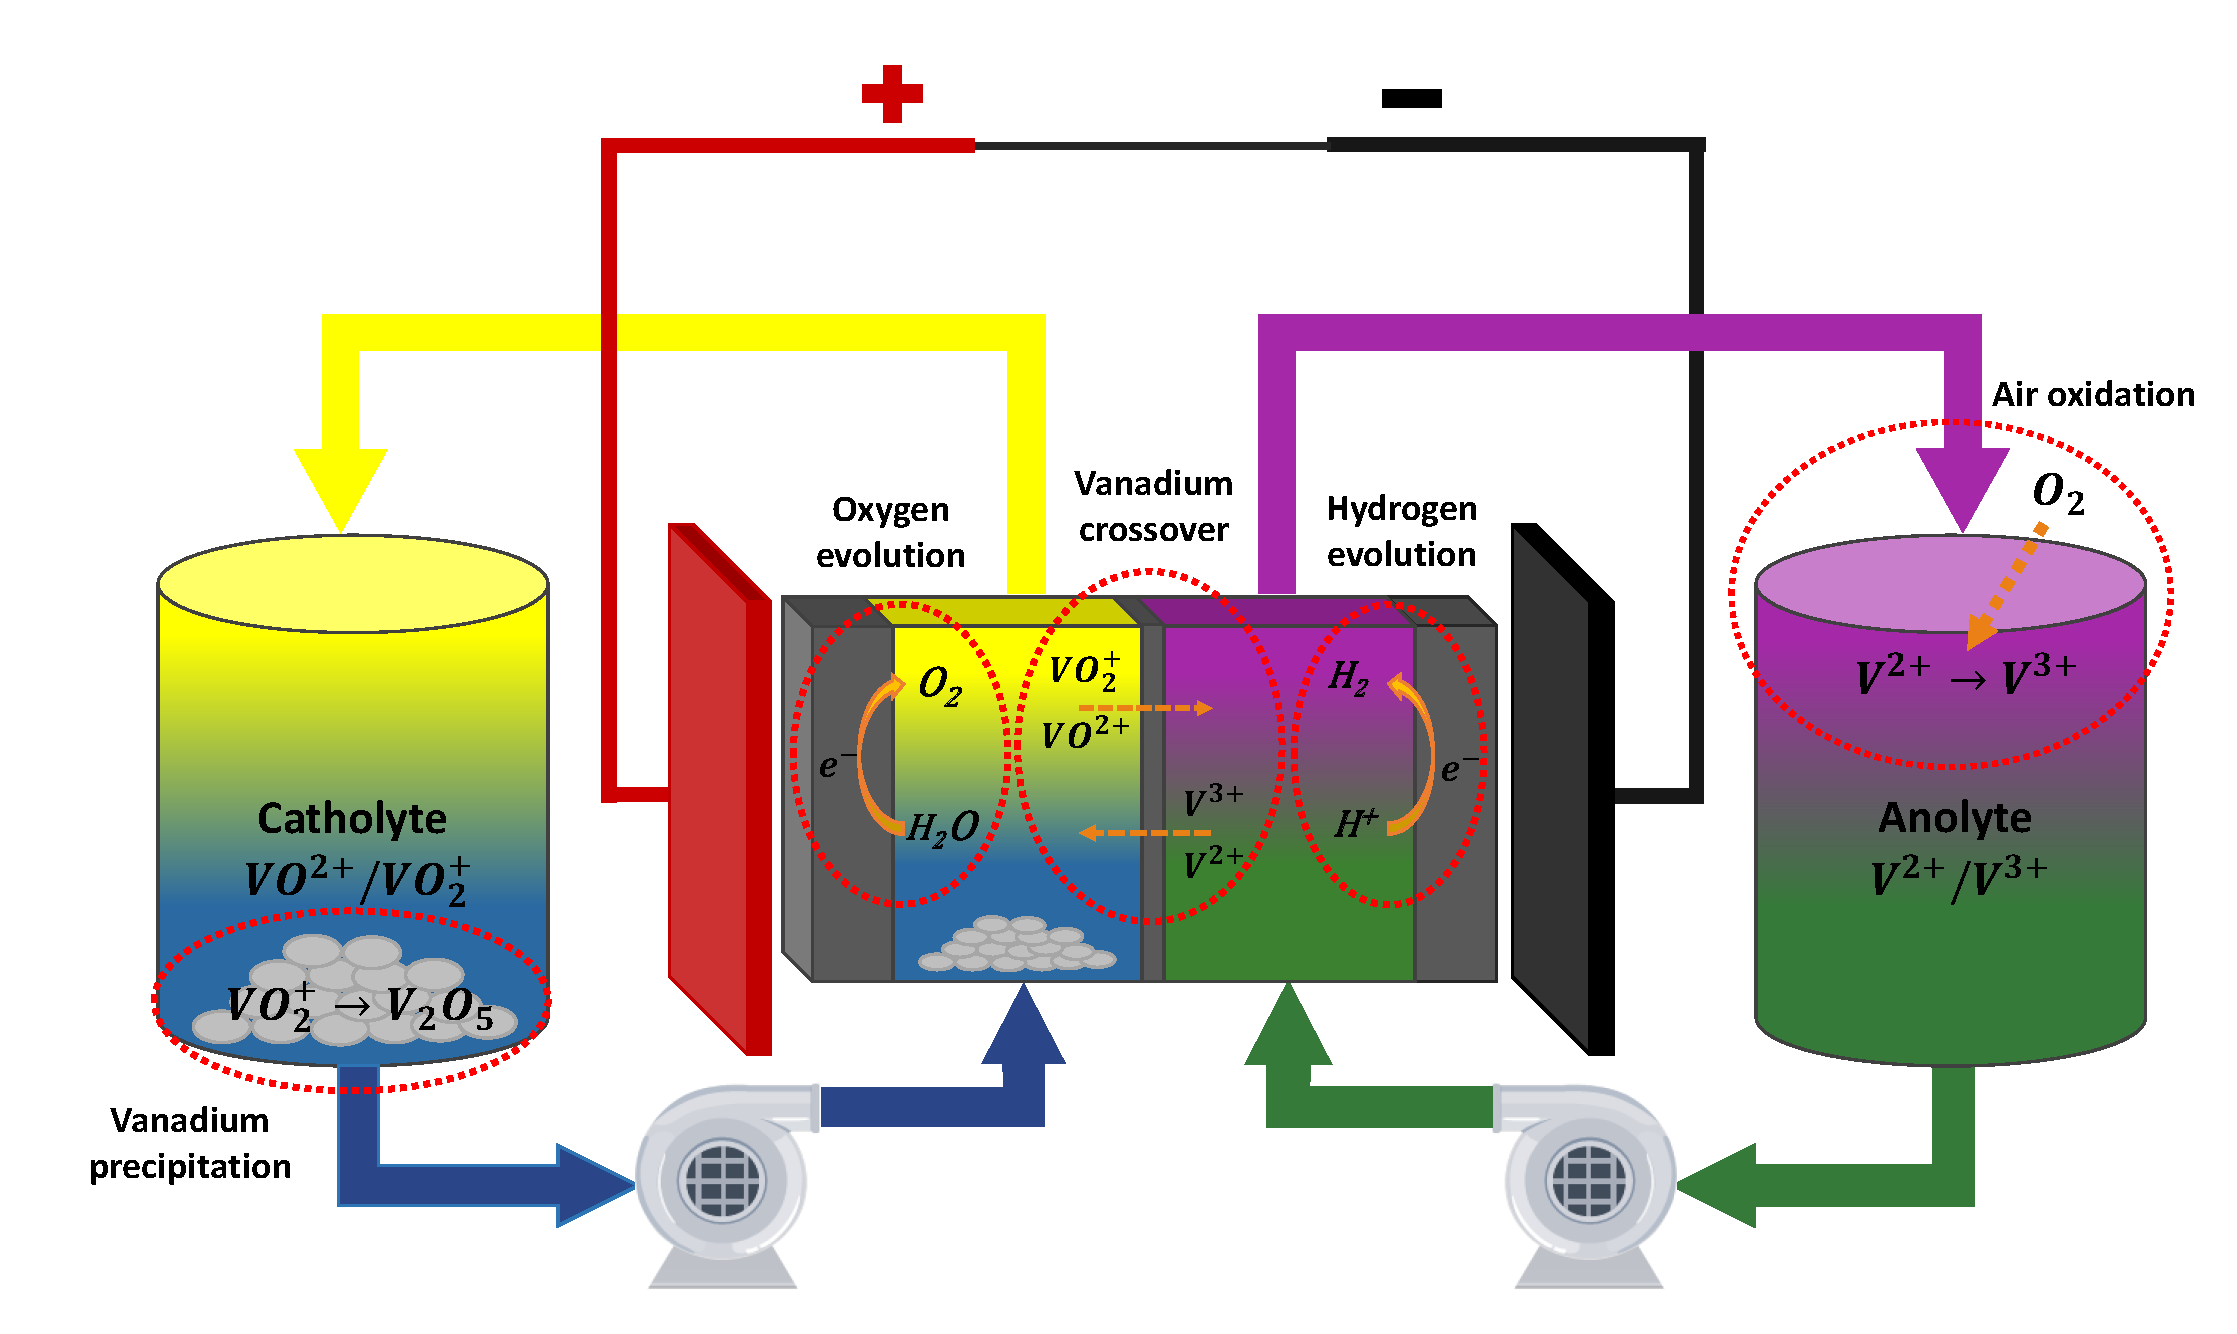
| ESS | Power | Energy | Lifetime | Efficiency | CPU of |
|---|---|---|---|---|---|
| Density (W/L) | Density (Wh/L) | (%) | Energy ($/kWh) | ||
| PH | 0.5–1.5 | 0.2–2 | 30–60 years | 70–85 | 500–2000 |
| CA | 0.5–2 | 2–6 | 20–40 years | 40–70 | 500–1000 |
| HT | 400–600 | 500–3000 | 5–30 years | 40–55 | 500–1500 |
| Molten salt | 140–180 | 70–210 | 1000–5000 cycles | 80–90 | 1000–3000 |
| Li-ion | 1500–10,000 | 200–400 | 1000–10,000 cycles | 85–95 | 1500–4000 |
| Lead-acid | 10–400 | 50–80 | 500–1000 cycles | 50–80 | 300–800 |
| RFB | 2–10 | 20–70 | 1000–20,000 cycles | 60–85 | 800–2000 |
| Active | Cell Voltage | Power Density | Energy Density | Lifetime |
|---|---|---|---|---|
| Species | (V) | (W/m) | (Wh/L) | (Cycles) |
| Chromium-iron [30] | 1.07 | 200 | 30 | 1000 |
| Iron-iron [31] | 1.21 | 500 | 20 | 10,000 |
| Organic–ferrocyanide [32] | 1.62 | 2000 | 21.7 | 75 |
| Organic–bromine [33] | 2.13 | 3000 | 35 | 10 |
| Sulfonate viologen [34] | 0.9 | 500 | 10 | 1000 |
| VRFB [35] | 1.4 | 800 | 25 | 20,000 |
| Zinc–bromine [36,37] | 1.85 | 1000 | 75 | 2000 |
Table 3.
Comparison of different state observers and parameter estimation algorithms.
| Algorithm | Features | Advantages | Disadvantages |
|---|---|---|---|
| EKF |
|
|
|
| H |
|
|
|
| PF |
|
|
|
| UKF |
|
|
|
| SMO |
|
|
|
| HGO |
|
|
|
| RLS |
|
|
|
| PSO |
|
|
|
| GA |
|
|
|
| NN |
|
|
|
| SVM |
|
|
|
Table 4.
Literature on VRFB estimation.
| Objective | KF Derived | H | PF | SMO | HGO | RLS | PSO | GA | NN | Others |
|---|---|---|---|---|---|---|---|---|---|---|
| [116] | [154] | [162] | [75] | [130] | [134] | [134] | [146] | [146] | ||
| [149,150,151] | [165] | [155] | [163] | [152] | ||||||
| [153] | [156] | [164] | [167] | |||||||
| SoC | [157,158,159] | [133] | [165] | |||||||
| [160] | [168] | |||||||||
| [162] | ||||||||||
| [166] | ||||||||||
| SoH | [151] | [154] | [75] | [163] | [148] | |||||
| Capacity | [153] | [165] | [155] | |||||||
| [160] | [156] | |||||||||
| [158] | [162] | [75] | [117] | |||||||
| [162] | [116] | |||||||||
| [169] | [151,152,153,154,155] | |||||||||
| ECM | [157] | |||||||||
| parameters | [166] | |||||||||
| [169] | ||||||||||
| [170] | ||||||||||
| Physical | [159] | [134] | [171] | [168] | [130] | |||||
| parameters | [133] | |||||||||
| Peak | [169] | [172] | ||||||||
| power | [170] |
Table 5.
Characteristics of each work related to VRFB estimation.
| Cite | Objective | Technique | Model | Variables |
|---|---|---|---|---|
| [75] | • SoC | • SMO | • ECM | • Current |
| • SoH/Capacity | • RLS | • Voltage | ||
| • ECM parameters | ||||
| [116] | • SoC | • EKF | • ECM | • Current |
| • ECM parameters | • RLS | • Voltage | ||
| [117] | • ECM Parameters | • PSO | • ECM | • Current |
| • Voltage | ||||
| • Temperature | ||||
| [133] | • SoC | • SMO | • Electrochemical | • Current |
| • Physical parameters | • RLS | • Voltage | ||
| [134] | • SoC | • PSO | • ECM | • Current |
| • ECM parameters | • PF | • Electrochemical | • Voltage | |
| [146] | • SoC | • NN | • Electrochemical | • Temperature |
| • Viscosity | ||||
| [148] | • SoH/Capacity | • Empirical | • Electrochemical | • Current |
| • Voltage | ||||
| • SoC | ||||
| [149] | • SoC | • EKF | • ECM | • Current |
| • Voltage | ||||
| [150] | • SoC | • EKF | • ECM | • Current |
| • Thermal | • Voltage | |||
| • Temperature | ||||
| [151] | • SoC | • EKF | • ECM | • Current |
| • SoH/Capacity | • RLS | • Voltage | ||
| • ECM parameters | • Temperature | |||
| [152] | • SoC | • Novel EKF | • ECM | • Current |
| • SoH/Capacity | • RLS | • Voltage | ||
| • ECM parameters | ||||
| [153] | • SoC | • Novel EKF | • ECM | • Current |
| • SoH/Capacity | • RLS | • Voltage | ||
| • ECM parameters | ||||
| [154] | • SoH/Capacity | • H | • ECM | • Current |
| • ECM parameters | • RLS | • Voltage | ||
| [155] | • SoC | • SMO | • ECM | • Current |
| • SoH/Capacity | • RLS | • Electrochemical | • Voltage | |
| • ECM parameters | ||||
| [156] | • SoC | • SMO | • Electrochemical | • Current |
| • SoH/Capacity | • Voltage | |||
| [157] | • SoC | • EKF | • ECM | • Current |
| • ECM parameters | • RLS | • Electrochemical | • Voltage | |
| [158] | • SoC | • EKF | • ECM | • Current |
| • ECM parameters | • Voltage | |||
| [159] | • SoC | • EKF | • Electrochemical | • Current |
| • Physical parameters | • Voltage | |||
| [160] | • SoC | • EKF | • Electrochemical | • Current |
| • Voltage | ||||
| [162] | • SoC | • EKF | • ECM | • Current |
| • ECM parameters | • PF | • Electrochemical | • Voltage | |
| [163] | • SoC | • NN | • NN | • Current |
| • SoH/Capacity | • Voltage | |||
| [164] | • SoC | • NN | • NN | • Current |
| • Voltage | ||||
| [165] | • SoC | • H | • ECM | • Current |
| • NN | • Voltage | |||
| [166] | • SoC | • EKF | • ECM | • Current |
| • ECM parameters | • RLS | • Voltage | ||
| [167] | • SoC | • Fast ECM | • ECM | • Current |
| • Voltage | ||||
| [168] | • SoC | • NN | • Electrochemical | • Current |
| • Physical parameters | • Voltage | |||
| [169] | • ECM parameters | • EKF | • ECM | • Current |
| • Peak power | • Voltage | |||
| [170] | • ECM parameters | • RLS | • ECM | • Current |
| • Peak power | • EKF | • Voltage | ||
| [171] | • Physical parameters | • GA | • Electrochemical | • Current |
| • Voltage | ||||
| [172] | • Peak power | • Optimal PP | • Electrochemical | • Current |
| • Voltage | ||||
| • Flow rate |
Publisher’s Note: MDPI stays neutral with regard to jurisdictional claims in published maps and institutional affiliations. |
© 2022 by the authors. Licensee MDPI, Basel, Switzerland. This article is an open access article distributed under the terms and conditions of the Creative Commons Attribution (CC BY) license (https://creativecommons.org/licenses/by/4.0/).
Share and Cite
MDPI and ACS Style
Puleston, T.; Clemente, A.; Costa-Castelló, R.; Serra, M. Modelling and Estimation of Vanadium Redox Flow Batteries: A Review. Batteries 2022, 8, 121. https://0-doi-org.brum.beds.ac.uk/10.3390/batteries8090121
AMA Style
Puleston T, Clemente A, Costa-Castelló R, Serra M. Modelling and Estimation of Vanadium Redox Flow Batteries: A Review. Batteries. 2022; 8(9):121. https://0-doi-org.brum.beds.ac.uk/10.3390/batteries8090121
Chicago/Turabian StylePuleston, Thomas, Alejandro Clemente, Ramon Costa-Castelló, and Maria Serra. 2022. "Modelling and Estimation of Vanadium Redox Flow Batteries: A Review" Batteries 8, no. 9: 121. https://0-doi-org.brum.beds.ac.uk/10.3390/batteries8090121
Note that from the first issue of 2016, this journal uses article numbers instead of page numbers. See further details here.