Article

Influence of Cell Selection and Orientation within the Traction Battery on the Crash Safety of Electric-Powered Two-Wheelers

Vehicle Safety Institute, Graz University of Technology, Inffeldgasse 23, 8010 Graz, Austria
*
Authors to whom correspondence should be addressed.
Submission received: 7 February 2023 / Revised: 20 March 2023 / Accepted: 21 March 2023 / Published: 24 March 2023

Abstract

:
The crash safety of lithium-ion traction batteries is a relevant concern for electric vehicles. Current passive safety strategies of traction batteries usually come at the cost of their volumetric or gravimetric energy density. This work analyses the influence of the variables cell selection and orientation within the traction battery on the crash safety of an electric-powered two-wheeler. These two variables do not negatively influence the traction battery’s volumetric or gravimetric energy density in the design process. Metamodels and numerical simulations are used to evaluate the crash safety of an electric-powered two-wheeler’s traction battery in a potentially dangerous crash scenario. The influence of the variable’s cell selection and orientation is evaluated through the internal short circuit risk of the integrated cells. The comparison of the metamodels shows that the cell orientation reduces the internal short circuit risk by up to 51% on average in the analysed crash scenario. The cell selection reduces it only up to 21% on average. The results show that crash safety can be increased in the design process, and a combination with the current protection strategies can increase crash safety further.

1. Introduction

Lithium-ion (Li-ion) represents nowadays the most common technology for the cells of the traction batteries of electric vehicles (EVs), including electric-powered two-wheelers (E-PTWs), thanks to its high volumetric and gravimetric energy density compared to other technologies [1]. Li-ion cells are available in three main shapes: cylindrical, prismatic, and pouch, which differ in construction [2]. Different formats (as an example for cylindrical cells in 18650, 21700, 4680, etc.) [3] and different chemistries (e.g., LiCoO2, LiFePO4, LiMn2O4, etc.) [4,5] are available for each shape.
Independent of the cell shape, relevant hazards, such as the venting of toxic gases, the release of harmful liquids, or the combustion of the entire cell due to the uncontrolled temperature rise called thermal runaway, can arise in case of abuse conditions due to thermal, electrical, and mechanical loads, such as those acting on the cells in the case of a crash [6,7].
The safety of Li-ion cells is commonly evaluated through experimental tests defined in various norms and standards [8,9,10] to identify safe cells for vehicle integration. The cells are subjected to abuse conditions representative of different load scenarios, inter alia mechanical loading [11,12,13]. The experimental tests evaluate the safety of a cell based on the cell reactions achieved during the test and categorise it through the EUCAR hazard level table [14]. A maximal level of four is usually aimed for vehicle integration [15]. This approach allows us to identify cells with potentially dangerous behaviour. However, it does not allow us to forecast the safety performance of the cell on the crash safety of the traction battery after integration into the vehicle. The effect of the cell is superimposed with other variables (e.g., load introduction points or energy dissipation components) introduced in the integration process.
The design and integration of the traction battery in EVs play a relevant role in its crash safety in case of a collision [16,17].
With the aim to reduce the risk of an internal short circuit (ISC) due to mechanical loads, commonly the trigger of hazardous reactions under crash loads, several passive safety strategies are present in the current state of the art. These strategies can be categorised into three working principles: (1) increase the energy dissipation performance of the traction battery, (2) reduce the intrusion into the traction battery, and 3) manipulate the load path In case of a crash.
Energy dissipation components to improve the crashworthiness of the traction battery can be applied to the traction battery housing [18,19], its connection to the frame [20], or inside the modules [11]. In all approaches, the authors of the studies achieved a reduction in the number of cells experiencing an ISC. However, these approaches decrease the traction battery’s volumetric energy density or increase the traction battery’s mass due to the volume and mass needed to integrate the energy dissipation components [19,21].
The intrusion in the traction battery, which can potentially damage the inner cells, can be reduced using stiff traction battery housing. By stiffening the traction battery housing or parts of it, a higher mechanical load is necessary to produce an intrusion and potentially damage the traction battery cells [19]. Various approaches can be found in the current state of the art using this principle. One research direction consists of optimising the geometry of the traction battery housing by determining the optimal thickness of each part of the traction battery enclosure [22] or optimising the geometry of the case itself [17].
In particular, Shui et al. [22] showed, by applying a multi-step optimisation process, the possibility of reducing the deformation of the traction battery in case of crash with similar loads by circa 22%, while also reducing the mass of the enclosure by circa 11%.
Further studies focus on the increase in the stiffness of the traction battery housing using different materials, such as composite material [23,24] or high-strength alloys [16,25], for the traction battery housing or part of it. Pan et al. [16] achieved a mass reduction of circa 10% using high-strength steels for the traction battery housing while maintaining the crash safety requisites for the integration of the traction battery into the vehicle.
Nevertheless, optimising the traction battery’s geometry or using high-strength materials does not always lead to a traction battery housing mass reduction, as shown by Szabo et al. [17]. Furthermore, the modification of the stiffness of the structure [26], by means of geometry or material modification can influence the response of the structure to external vibrations and the dynamic response of the vehicle itself under driving conditions. Therefore, the stiffness increase process is commonly conducted in combination with vibrational analyses to ensure the achievement of a feasible structure for the vehicle integration, as in the work of Shui et al. [22].
Faßbender et al. [27] proposed manipulating the traction battery load path in case of a crash by adopting a damage-tolerant traction battery through a module design based on a triangular shape. This allows a relative movement of the modules in the event of traction battery deformation, thus increasing the intrusion into the traction battery needed to damage the cells. Faßbender et al. [27] provide no information on the effects in terms of cells’ protection or changes in the traction battery’s gravimetric and volumetric energy density of the traction battery. However, such an effect can be expected due to the extra volume of the module housings needed to allow their relative displacement.
The strategies presented in the aforementioned studies have been successfully verified in a numerical environment. However, they can have a negative impact on the volumetric or gravimetric energy density of the traction battery due to added components or stiffening structures.
This study aims to investigate the use of mechanical capabilities of cells to absorb deformation energy until ISC occurs in the case of a crash. Therefore, the influence of the two variables, cell selection and orientation, on the crash safety of an E-PTW traction battery is investigated. The cell selection and orientation within the traction battery are two variables in the design process of a traction battery, which come at no volumetric or gravimetric energy density cost. The approach presented in this work represents an innovation in the current state of the art as it uses the cells’ mechanical properties to improve the traction battery’s crash safety without integrating further components into the traction battery that reduce its gravimetric or volumetric energy density.

2. Materials and Methods

To achieve the goal of this study, a finite element (FE) model of the entire E-PTW is built. The EPTW FE model is subjected to a potentially dangerous crash load condition through FE simulations, analysing its crash safety with the traction battery cells’ internal short circuit risk (ISCR).
With the FE model, the influence of the two variables is evaluated through:
  • The cell selection, by considering two 18650 cells from different manufacturers;
  • The cells orientation within the traction battery, by considering two different cell orientations.
Additionally, a thickness range of two components of the traction battery housing defining its mass and crashworthiness is analysed to evaluate the influence of cell selection and orientation independent from the crashworthiness of a specific traction battery housing. This measure ensures the overall validity of the study.
Metamodels of the ISCR as a function of the FE model variables are built to analyse the influence of the cell selection and orientation on the crash safety of the traction battery beyond the simulated cases, reducing the computational effort of the study.
The comparison of the ISCR trends of the traction battery of the E-PTW with different integrated cells and cell orientation permits us to observe their influence on the crash safety of the traction battery.

2.1. Reference E-PTW, Cells, and Crash Scenario

This work is based on an E-PTW concept of category L3e-A2 [28] for urban and commuting purposes. The E-PTW concept can integrate two structural (i.e., substituting the vehicle frame) traction battery concepts. Both integrated traction battery concepts (Concept Y and Concept Z) are composed of three identical modules (216 cells per module) connected in their series (see Figure 1) but differing in their orientation. Each module consists of 18650 cells with a 24s9p configuration. The modules are oriented with the cells’ longitudinal axis in the yM direction in Concept Y (see Figure 1a) and with an angle of 25.5° relative to the zM direction in Concept Z (see Figure 1b). The traction battery concepts integrate the connection to the steering head, motor, and swingarm. The volume of Concept Y and Concept Z is the same; therefore, integrating the same cells results in an identical volumetric energy density.
This study considers two commercial Li-ion cylindrical cells of the 18650 format with the chemical composition Lithium-Nickel-Manganese-Cobalt-Oxide (commonly called NMC). The two cells, referred to in this study as cell A and B, have the same format and do have the same dimensions according to the datasheets, namely a nominal diameter of 18 mm and an axial length of 65 mm. The cells are from different manufacturers and differ minimally in their electrical specifications. However, the electrical performance of both cells, based on the data sheets, is comparable. Additionally, both cells have their protection systems integrated (such as the current interrupt device, positive thermal coefficient switch, or safety vent).
The current literature [6,29,30] refers to the collision of an EPTW and a cylindrical object as a worst-case crash scenario for E-PTWs; therefore, this scenario is selected in this study. The cylindrical object has a diameter of 150 mm, as proposed in the SAE J2464 [31]. The impact speed is set to 8.9 m/s to represent a collision in urban areas, following the collision speed defined by Matsuda [20] and Ellersdorfer [6]. The collision area is set in the middle of the traction battery side to maximise the potential deformation of the traction battery.

2.2. E-PTW, Traction Battery, Cells, and Crash Scenario FE Modelling

Data on the traction battery’s crash safety are obtained using the FE simulations of the considered crash scenario. The cylindrical collision object is modelled with two-dimensional (2D) elements and a rigid material model.
The E-PTW concept is simplified in the FE modelling to reduce the computational effort of the analysis due to the high total number of cases that needed to be analysed numerically for the metamodel building (see Figure 2). The components of the E-PTW not part of the traction battery are modelled using 112 one-dimensional (1D) rigid elements. The mass of the 1D elements is chosen to obtain a mass and a centre of gravity position for the entire vehicle in the simplified model, as in the concept E-PTW.
More details are present in the FE model of the traction battery to achieve a higher accuracy in approximating its mechanical behaviour in the crash scenario. The FE model of the traction battery consists of the following components (presented in Figure 3 using Concept Y as reference):
  • The traction battery housing is composed of two components: the external plates (EPs), which define the external contour of the housing, and the longitudinal plates (LPs), which are placed between the modules for their fixation and thermal management. Both housing components are modelled with a total of 27,286 2D quadratic elements (average side length of 5 mm) with Belytschko-Tsay formulation with 5 integration points and using an elastoplastic aluminium material model without strain-rate hardening behaviour and with an effective plastic strain-based failure criterion in tension. The material model’s effective plastic strain at failure was calibrated using data retrieved from tensile tests executed with specimens of the same material. The thickness range of the EPs and LPs is defined through variable parameters to be used as the input in the analysis.
  • The modules consist of the following subcomponents:
    The cell holders are responsible for holding the cells together and are modelled with a total of 86,910 2D elements, combining quadratic and triangular elements (average side length 5 mm), with Belytschko-Tsay formulation with 5 integration points using an elastic material model without strain-rate hardening and with an effective plastic strain-based failure criterion resembling the material behaviour of an acrylonitrile butadiene styrene thermoplastic.
    The cells are modelled using a combination of 544 2D and 1881 1D elements, according to Raffler et al. [32]. Two-dimensional elements are used to geometrically model the outer surface of the cell, and one-dimensional elements are used to represent the cell’s mechanical behaviour under load.
    The connection between the modules and traction battery housing (i.e., connection screws) is modelled with 60 1D elements (average length 10 mm) with Hughes-Liu formulation with cross-section integration formulation and a steel elastic material model to simulate the screw connection needed to fix the modules within the traction battery housing.
The smallest time step of the undeformed model is 6 × 10⁻⁴ ms. Due to the deformation in the load case, the smallest time step can drop up to 1 × 10⁻⁴ ms. The smallest time step is limited to 1 × 10⁻⁴ ms by adding artificial mass to the elements to ensure the simulation’s stability and reasonable calculation time. Nevertheless, the maximal mass added was equal to 1.45 kg (less than 1% of the vehicle model mass).
A contact between all of the components of the FE model of the traction battery, except the 1D elements of the FE model of the cells, and the impactor using an automatic formulation are defined using the penalty method. The penalty method is used due to its good convergence in different contact conditions [34] and its easiness of implementation [35].
The FE simulations are performed with the single precision solver version R 9.20 of LS-DYNA® on the High-Performance Computing cluster of the Graz University of Technology, running on a Red Hat Enterprise Linux 5.4 platform.
The experimental tests, subjecting the cells with a 100% state of charge to quasistatic mechanical loads under three load configurations, as performed by Raffler et al. [33] (see Figure 4), provided the data on the cells’ mechanical behaviour. Five repetitions are conducted for every load configuration and cell.
The experiment data (Table A1 and Table A2) are used to calibrate the mechanical behaviour of the cell FE model and to determine the short circuit criterion using the method by Raffler et al. [33]. Previous studies [33,36,37] identified different ISC behaviours due to a deformation in the radial and axial cell direction; therefore, an internal short circuit risk at the cell level is defined for radial deformation ( I S C R r   c e l l ) and axial deformation ( I S C R a   c e l l ) (Equations (1) and (2)) with the description in Table 1.
I S C R r   c e l l = ε r ε r   S C  
I S C R a   c e l l = ε p ε p   S C
The maximum between I S C R r   c e l l and I S C R a   c e l l defines the ISCR of a single cell ( I S C R c e l l ), while the maximum between the I S C R c e l l of all of the cells of the traction battery defines the ISCR at the traction battery level.

2.3. Assessment of FE Models

The correlation and analysis (CORA) method is used to assess the validity of the mechanical behaviour of the FE models. Gehre et al. [38] first proposed the CORA method as an objective comparison method to assess the quality of compliance of the two curves. The method is used to compare different curves, including time-displacement [38], time-force [38,39], and displacement-force curves [40]. The CORA method consists of four independent procedures to separately evaluate the agreement for the size, phase, shape, and corridor of the two curves [38]. Every procedure provides a score (R) between zero and one, where zero defines no agreement between the signals and one is a perfect agreement. The four procedures are grouped into the “Corridor method”, including the corridor agreement comparison; and the “Correlation method”, consisting of the size, phase, and shape agreement comparison. The ISO/TR-9790 procedures [38,41], followed in this work, suggest calculating an overall rating divided into five grades (see Table 2) related to the agreement of the two curves by calculating the weighted average of the score of the four procedures.
The CORA method differs from other methods that also assess magnitude, shape, and phase, such as the “Enhanced Error Assessment of Response Time Histories” (EEARTHs) [42] or “The Normalized Integral Square Error” (NISE) [43] by the feature of corridor assessment. Additionally, there are no disadvantages that CORA has to the mentioned methods. The “Correlation of signals” method (CoSi) [44] assesses the same metrics as the CORA but has the disadvantages of individual factors for each metric and not supplying an overall rating. The minimum area discrepancy method (MADM) [45] is developed especially to compare force-displacement curves and has the advantage of also working for non-monotonic functions. However, the MADM does not directly evaluate the size and shape. In the literature, there are also numerous other evaluation methods, such as the “Sprague and Geers method” or “Cumulative standard deviation (CSD)”, but these methods cannot identify the key features such as phase, magnitude, and slope [39,44,46]. Therefore, the CORA is extensively used and implemented in norms and standards and is well-suited for use in this article because of the displacement-based data acquisition in the experiments.
The used parameters are chosen according to recommended values from the literature [47]. The FE model is considered valid when the overall score of the three load configurations achieved at least the grade of “Excellent”.
The CORA method is used to validate the FE models of the components for which hardware specimens are available to generate experimental data, i.e., the cells integrated into the traction battery and material models. Therefore, all components directly involved in the area of contact between the vehicle and pole in the crash scenario are valid. The remaining parts of the vehicle (wheels, swingarm, handlebar, …) are only responsible for reproducing the vehicle’s kinematics (kinetic energy, centre of gravity) and the load introduction between the traction battery and connected components. For this reason, only the centre of gravity and the vehicle mass are validated based on the CAD model of the baseline vehicle.
The curves that are compared through the CORA method for the validation of the FE cell model are the average force-displacement curve of the conducted experimental tests and the force-displacement curve of the FE simulation subjected to the same load configuration. All force-displacement curves of a load configuration are considered and resampled with a displacement resolution of 0.05 mm. The force values of every curve for the same displacement are averaged to obtain an average curve. The CORAplus tool [48] is used to develop the CORA analysis.

2.4. Metamodel Building and Assessment

Within this study, a metamodel-based approach [49,50] is used to investigate the influence of cell selection and orientation on the crash safety of the traction battery.
The metamodels are built using the response surface method (RSM) [51]. The method is called the “response surface” as the response (i.e., output) values of the phenomena investigated are interpolated using regression analysis to create a continuous surface [52] with a reduced number of experiments needed and a high computational efficiency [53]. The response surface is calculated using a multiquadric (MQ) radial basis function network (RBFN). These functions are commonly used to easily and accurately interpolate scattered data [54].
The variables of the study are the selected cell and the cell orientation. Additionally, the design parameters of the thickness of the LPs and thickness of the EPs are introduced. The thickness of the traction battery housing plates defines the crashworthiness and mass of the traction battery. The output responses are the ISCR of the traction battery in the crash scenario and the mass of the traction battery housing, both retrieved from the FE simulations.
To compare the ISCR of traction batteries with different cells integrated and different cell orientations within the traction battery, a metamodel is built for each combination of the selected cell and cell orientation. For each of these metamodels, only two design parameters, the thickness of the EPs and LPs, are used to reduce the complexity of the metamodel. The design space of the design parameters is limited between a minimal thickness of 3 mm and a maximal thickness of 20 mm. The limits of the two parameters are defined based on thickness manufacturing constraints for an aluminium moulding process.
The design points, i.e., combinations of the two design parameters of each metamodel in the design space, are generated using a space-filling approach based on a “maximin” method, i.e., maximising the pairwise minimum distance across the design points [49]. Sixty design points are used to build each response surface.
The results of each metamodel are validated by controlling that the ISCR of further ten design points is in the tolerance range (TR) of the ISCR response surface with a confidence interval of 95%. The design points are selected through simple random sampling and are not used to build the response surface. After proving that the ISCR error distribution between the observed ISCR in the FE simulations of the design points and the metamodel’s one is normal through the chi-squared goodness-of-fit test, the TR of the ISCR response surface is calculated, as in Equation (3), where:
  • μ is the mean ISCR error between the FE simulations and the metamodel;
  • σ is the standard deviation of the ISCR error.
T R = μ ± 1.96 σ
The metamodels are built with LS-OPT® 6.0.

2.5. Evaluation of the Crash Safety

The ISCR at the traction battery level of the metamodels is used in this study as the evaluation criteria for crash safety. Multiple ISCRs of the same mass point are possible because of the combination of EPs and LPs with different thicknesses. To ensure an objective comparison and evaluate the maximal influence of the cell selection and orientation, the lowest ISCR of every mass value point is considered. The ISCR, as a function of the traction battery housing mass, is further calculated for every combination of the investigated cell and cell orientation within the traction battery design parameters.
Comparing these functions permits the calculation of the maximal difference in the ISCR by substituting the integrated cell and changing the cell orientation for traction battery housing with the same mass.

3. Results

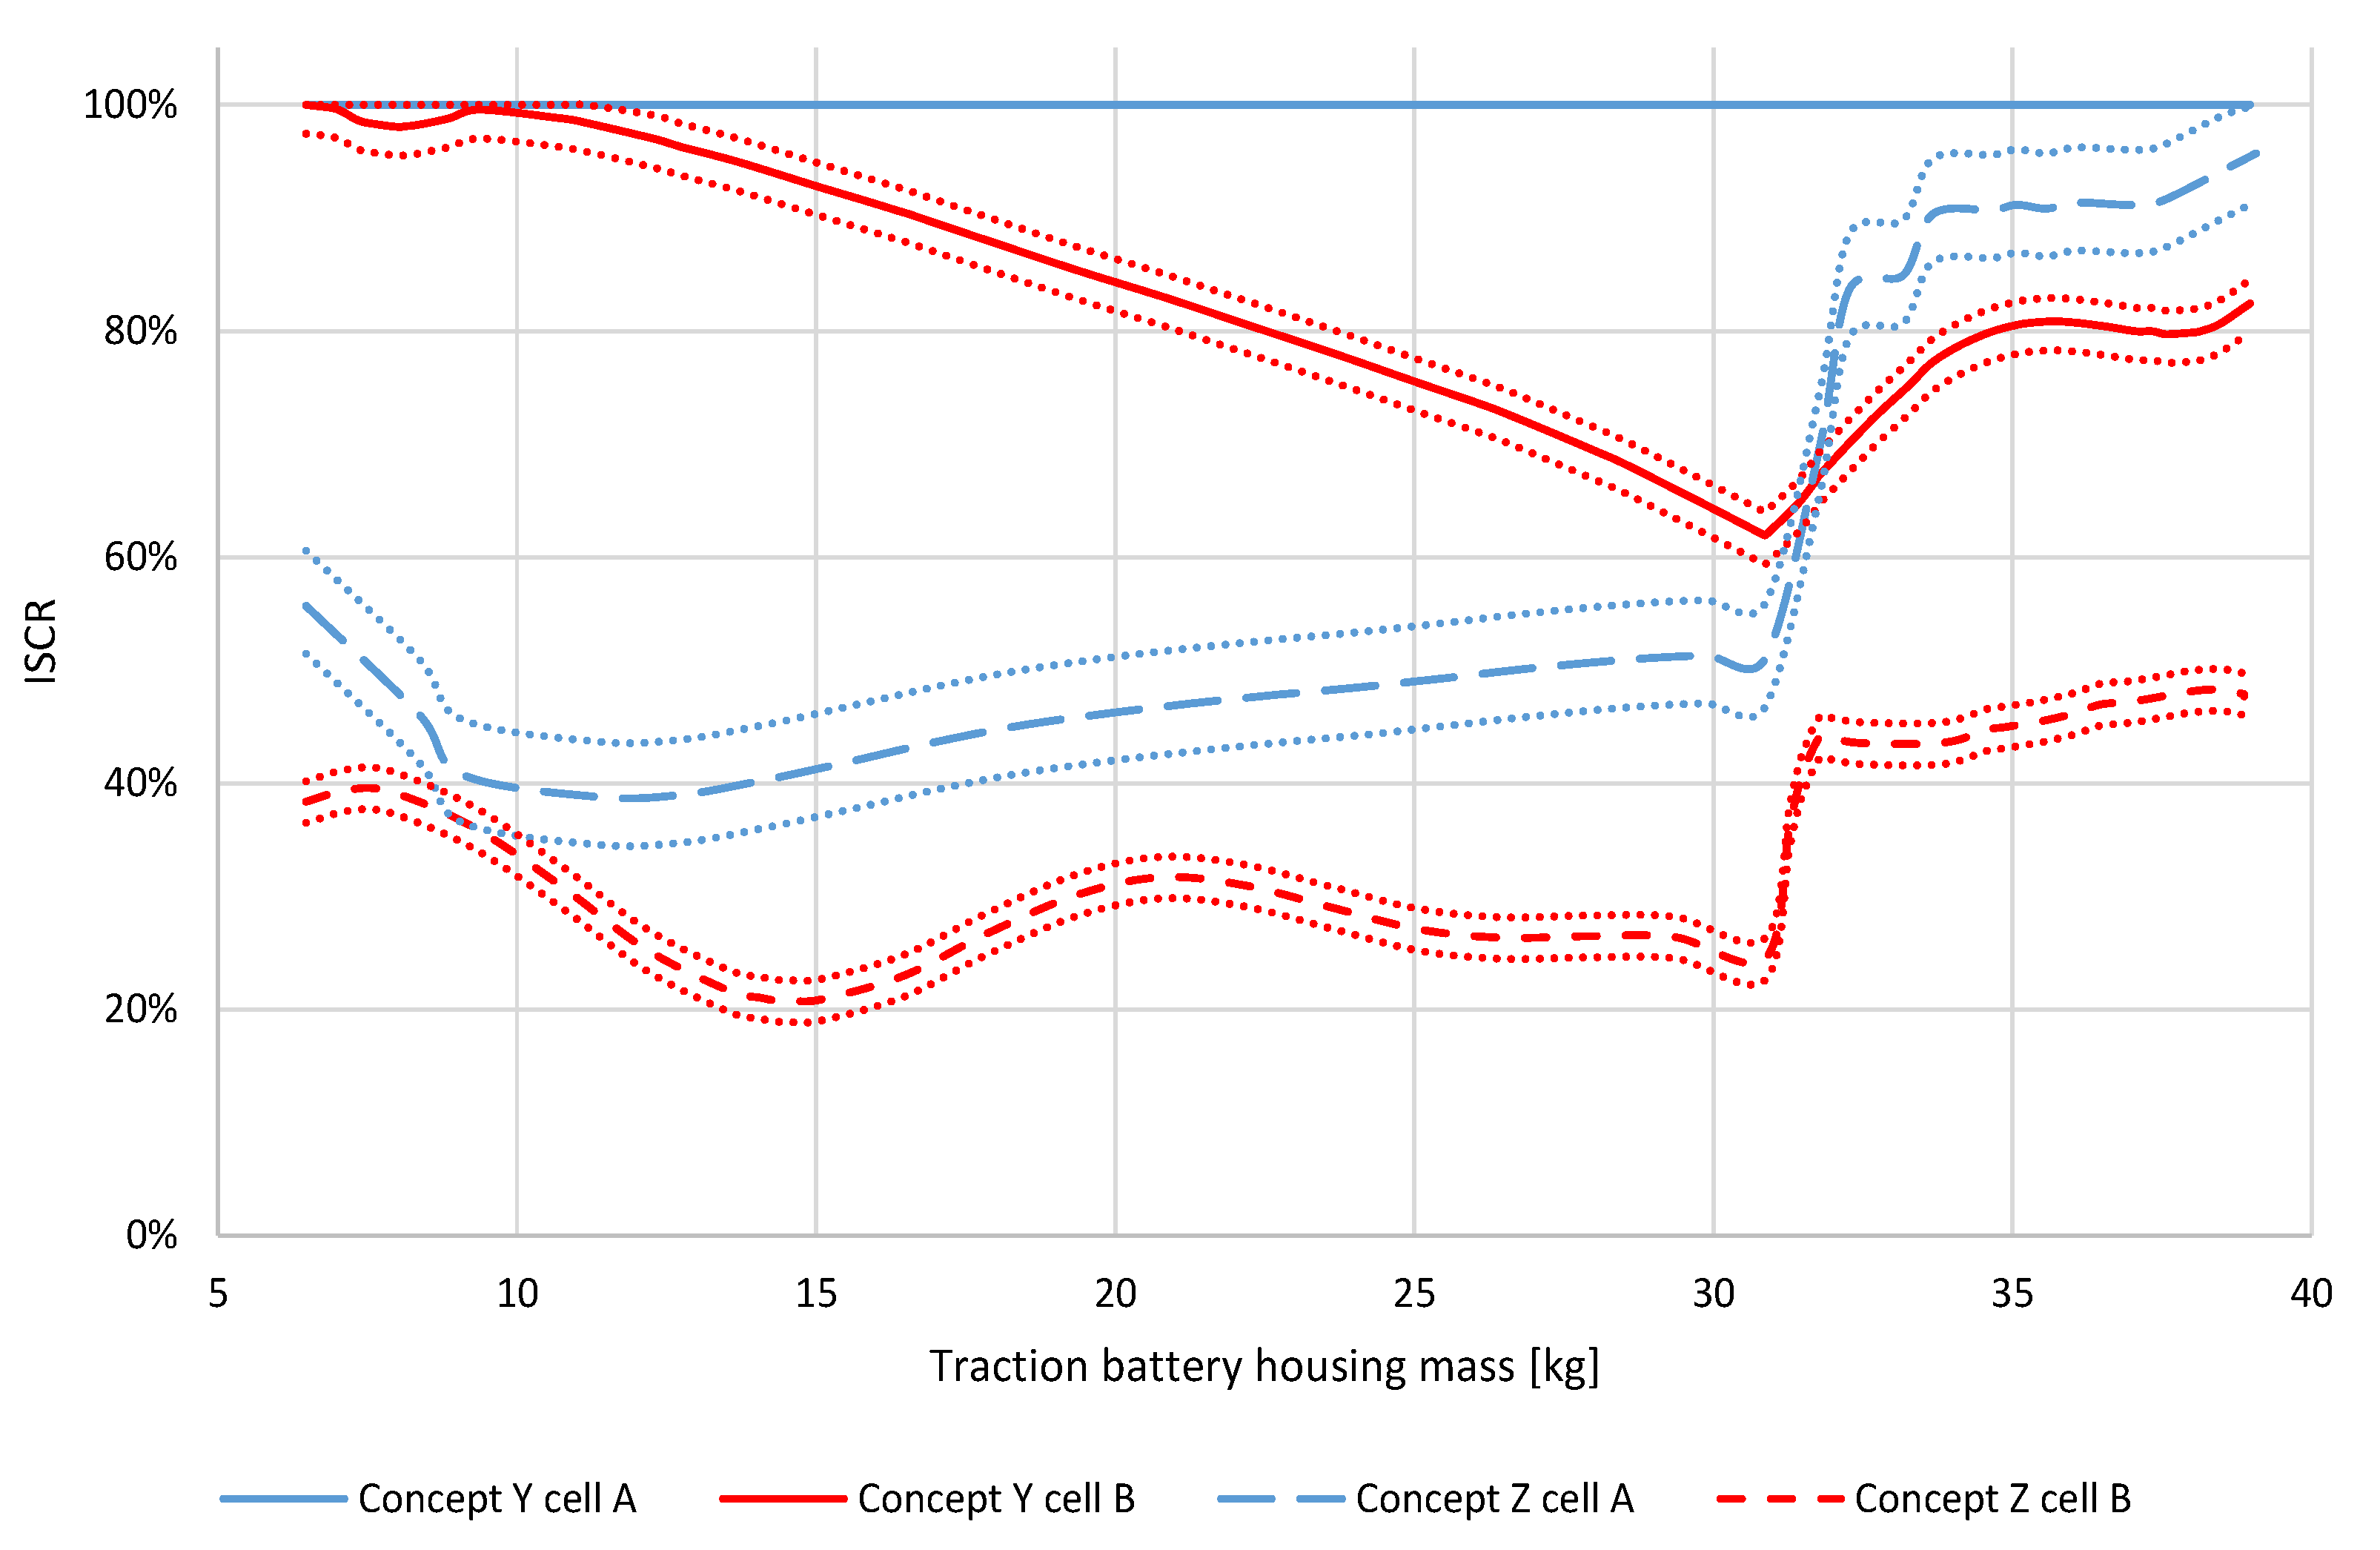
3.1. Influence of Cell Selection on ISCR—Concept Y

Due to the simple geometric construction, the response surface of the traction battery housing mass of Concept Y for cell A and B can be approximated to the function presented in Equation (4). The used variables are described in Table 3.
T B H m = ρ ( T H L P S L P + T H E P S E P )  
The response surface of the ISCR of Concept Y with cell A achieves an ISCR of 100% in the entire design space, i.e., due to the cell mechanical properties and their orientation, every combination in the design space of EPs’ and LPs’ thicknesses cannot avoid the onset of an ISC in the analysed crash scenario. The response surface of the ISCR of Concept Y with cell A is, therefore, not presented graphically. The response surface of the ISCR as a function of the EPs and LPs thickness of Concept Y with cell B is presented in Figure 5.
The global ISCR minimum in the response surface of Concept Y with cell B is 63% at a thickness of 20 mm and 3 mm for the EPs and LPs, respectively, while the maximum is 100% in the design area near a thickness of the LPs equal to 20 mm. Every point of the design space with a thickness of the EPs less than circa 10 mm achieves an ISCR higher than 90%.
As the thickness of the LPs increases, the ISCR increases. Analysing the load path during impact can explain this phenomenon. The LPs of Concept Y are not directly deformed during impact but limit the displacement of the cell in the yM direction. Therefore, increasing the thickness of the LPs and, thus, their stiffness reduces their bending under the load transmitted by the cells and increases the maximal deformation of the cells in the impact zone (see Figure 6a,b). An increase in the thickness of the EPs produces a decrease in the ISCR. The EPs deform directly upon contact. Therefore, increasing their thickness increases the stiffness, and reduces the deformation of the cells in the impact zone with a consequent reduction of the ISCR (see Figure 6a,c).
The error distributions in ISCR between the FE model of Concept Y with cells A and B are proven to be normal.
The evaluation of error distributions in ISCR between the FE model of Concept Y with cells A and B and their respective metamodel is presented in Table 4, where the used units are the percentage points of the relative ISCR.

3.2. Influence of Cell Selection on ISCR—Concept Z

The response surface of the traction battery housing mass for Concept Z, due to the same geometry of Concept Y but a different orientation of the modules, follows the same approximation presented in Equation (4).
Figure 7 shows the response surface of the ISCR as a function of the EPs’ and LPs’ thickness for Concept Z with cell A and B.
Based on the metamodel, the minimum and maximum ISCRs for Concept Z with cell A are 39% for an EP thickness of circa 6.5 mm and an LP thickness of 3.0 mm, and are 100% in the area for an EP thickness of 20 mm and an LP thickness of circa 10 mm, respectively.
In the case of Concept Z with cell B, the maximum and minimum ISCRs based on the metamodel are 19% for an EP thickness of circa 8.7 mm and an LP thickness of 3.0 mm, and are 46% for an EP thickness of 20.0 mm and LP thickness of 10.0 mm, respectively.
Increasing and decreasing the EP thickness of concept Z with cell A, starting from the point of minimum ISCR, increases the ISCR. In particular, decreasing the EPs’ thickness produces more intrusion in the traction battery, consequently increasing the ISCR. Increasing the Eps’ thickness reduces the intrusion in the traction battery. Nevertheless, the acceleration loads to which the cells are subjected to increase and lead to their deformation due to the impact on the LPs, thus increasing the ISCR. Increasing the LPs’ thickness and maintaining the EPs’ thickness constant produces the same effect. The effect is even more pronounced because the LPs have an important stiffening function for the entire traction battery housing due to the geometry of Concept Z.
The ISCR response surface for concept Z with cell B shows a striking resemblance to that of Concept Z with cell A, despite the former exhibiting a lower ISCR throughout the entire design space. This finding indicates that similar deformation modes of the traction battery and the integrated cells upon impact occur. However, a higher impactor displacement needed to trigger an ISC for cell B compared to cell A in all three tested configurations (see also Table 5) leads to a reduction of the ISCR of the metamodel of Concept Z with cell B.
The error distributions in ISCR between the FE model of Concept Z with cells A and B were proven to be normal.
The evaluation of error distributions in ISCR between the FE model of Concept Z with cell A and B and their respective metamodel is presented in Table 6, where the used units are the percentage points of the relative ISCR.

3.3. Influence of Cell Orientation on ISCR

The trends of the ISCR, inclusive tolerance range, as a function of the traction battery housing mas for Concept Y and Z with cell A and B are presented in Figure 8.
The ISCR trend of Concept Y with cell A is constant at 100%, as every design point in the design area achieved an ISCR of 100%.
The same concept but with cell B shows an ISCR equal to or higher than 95%, up to a traction battery housing mass of circa 13.5 kg. The ISCR monotonically decreases from a traction battery housing mass of 9.4 kg up to circa 31 kg when the EPs achieve the upper thickness limit of 20 mm. The ISCR then increases non-monotonically until reaching the maximal traction battery housing mass of 39 kg due to the thickness increase in the LPs in this traction battery housing mass range, due to the behaviour described in Section 3.2.
The ISCR for Concept Z with cell A ranges from a minimum of 39% to a maximum of 96%. The ISCR decreases monotonically in the traction battery housing mass range of 5 to 11.3 kg. In this range, the thickness of the LPs is constant at the lower limit and the thickness of the EPs increases. A further mass increase produces a non-monotonical rise in the ISCR. In particular, up to a traction battery housing mass of circa 31 kg, the thickness of the EPs increases up to the upper limit, while the LPs’ thickness is constant at the lower limit. For a traction battery housing mass of more than 31 kg, the combination of the variables that minimise the ISCR for a fixed mass, due to the form of the response surface, lays on a different area of the ISCR response surface, producing a leap in the curve trend.
The ISCR as a function of the mass for Concept Z with cell B shows a minimal ISCR of circa 21% and a maximal ISCR of circa 48%. Starting from the minimal mass, the ISCR increases to a traction battery housing mass of 7.9 kg and then decreases to the global minimum at a traction battery housing mass of circa 15 kg. If the mass further increases, a non-monotonical ISCR increase is produced. The same effect for Concept Z with cell A produces the sudden rise of the ISCR at a traction battery housing mass of circa 31 kg.

4. Discussion

The results of this study show a relevant influence of both the cell selection and orientation in the crash safety of an E-PTW traction battery.
In particular, the switch from cell A to cell B reduces the ISCR on average, in absolute values, by 17% in the case of Concept Y and by 24% in the case of Concept Z, with a maximal reduction of 38% for Concept Y and 48% for Concept Z. The differences in the cell deformation of the ISC onset for the two analysed cells explain these results. Cell B achieves an ISC at circa 60% higher deformation in global axial loading and circa 25% higher deformation in global radial loading than cell A. Therefore, more deformation of the traction battery housing is possible before achieving an ISCR of 100%. Consequently, the crashworthiness of the traction battery housing structure can be better exploited with cell B compared to cell A.
The cell orientation has an even stronger influence on the ISCR. Concept Z achieves a reduction in the ISCR on average, in absolute value, by 44% with cell A and 51% with cell B compared to Concept Y. Maximal ISCR reductions, in absolute values, up to 61% and 73%, respectively, for cell A and B are observed in Concept Z compared to Concept Y. The first reason for this effect is based on the cell’s properties; the deformation that triggers the ISC onset is up to 37% smaller in the case of global axial cell loading than in global radial cell loading. Secondly, it can be explained by the influence of the LPs in the load path of the traction battery housing; the main load path of Concept Z is oriented in the cells´ radial direction, while for Concept Y, it is in the cell´s axial direction. Therefore, Concept Z leverages the cells’ anisotropic ISC behaviour, decreasing the ISCR compared to Concept Y.
Considering the influence of the LPs, they are directly loaded upon impact in Concept Z, which is not the case in Concept Y, where only the EPs are mechanically directly loaded in the crash phase. Therefore, an LP’s thickness increase does not reduce the ISCR in Concept Y. In the case of Concept Z, a counterintuitive effect is present: an LP’s thickness increase raises the ISCR. In Concept Z, an LP’s thickness increase decreases the intrusion in the traction battery housing, but the stiffness increase produces higher acceleration pulses upon impact. These dynamic loads oscillate the inner modules and their collision with the traction battery housing. This provokes a local deformation of the cells, which increases the ISCR.

5. Limitations

The results provided in this study are assessed for one vehicle type only. Due to different boundary conditions and load scenarios, they can differ if applied to different EPTW categories such as off-road motorcycles or different vehicle types such as four-wheelers.
Furthermore, this work analysed two cells of the same shape and format, namely 18650 cells. Comparing cells of the same shape but different formats (e.g., 18650 and 21700 cells) and different shapes (e.g., cylindrical and pouch cells) could identify new insights to guide the selection of the optimal cell for the integration into EVs.
Finally, it should be considered that the cells’ FE models are validated under quasistatic mechanical loads. Current studies observed differences in the mechanical behaviour of Li-ion cells between quasistatic and dynamic loads, as the ones that cells are subjected to in the case of a crash [55,56]. These differences in mechanical behaviour can lead to different ISCRs of the metamodels.

6. Conclusions

In this work, the influence of the cell selection and orientation within the traction battery on the crash safety of the traction battery of an electric-powered two-wheeler under a potentially dangerous crash scenario for the traction battery is analysed through metamodels fitted to the numerical results provided by finite element simulations of the crash scenario. The integrated traction battery cells evaluate crash safety by the internal short circuit risk (ISCR). The following conclusions are obtained:
  • The cell orientation within the traction battery has the biggest influence on the crash safety of the traction battery. In particular, changing only the cell orientation can reduce the ISCR by 73%. This knowledge can be leveraged in the design phase of the traction battery of an electric vehicle if a potentially dangerous crash scenario is known by orienting the cell to obtain a loading in the cell radial direction during the collision. Therefore, the gravimetric energy density of traction batteries can be increased because fewer additional reinforcements are needed.
  • The cell selection can influence the crash safety of the traction battery of an electric-powered two-wheeler but with a smaller contribution than the cell orientation. In particular, switching from cell A to cell B can reduce the ISCR by 48%. Therefore, the crash safety of a traction battery can be improved without structural reinforcements or design changes in the traction battery housing or vehicle frame. Knowing this aspect, the crash safety of already existing traction batteries can be improved with small effort.
  • In a crash load condition, the longitudinal plates of the traction battery housing can improve the crashworthiness of the entire traction battery housing, acting as energy-absorbing structures while fulfilling their functional role for the traction battery assembly. Therefore, their design should be subjected to a crashworthiness assessment to avoid landing in an area of the design space with a high internal short circuit risk.
  • The investigation approach, using metamodels, has been proven as both computationally inexpensive and adequately precise (maximal absolute internal short circuit risk error range of 9.1%) for investigating the internal short circuit risk of traction battery concepts. The same approach can be used in a vehicle development phase to identify optimal combinations of the thickness of traction battery housing components, cell orientations, and selections to accelerate the development of crashworthy traction batteries.
Finally, it should be considered that the analysed variables, cell selection and orientation, can be combined with state-of-the -art passive protection strategies of the traction battery, further improving the crash safety of electric-powered two-wheelers and electric vehicles in general.

Author Contributions

Conceptualization, C.E.; Data curation, A.S.; Formal analysis, M.F.; Funding acquisition, C.E.; Investigation, A.S. and M.R.; Methodology, A.S. and C.E.; Project administration, C.E.; Resources, A.S.; Supervision, C.E.; Validation, M.F.; Writing—original draft, A.S.; Writing—review and editing, M.F. and C.E. All authors have read and agreed to the published version of the manuscript.

Funding

This research was funded by the Austrian Research and Promotion Agency (FFG), grant number 845337. Open Access Funding by the Graz University of Technology.

Institutional Review Board Statement

Not applicable.

Informed Consent Statement

Not applicable.

Data Availability Statement

Not applicable.

Acknowledgments

The authors acknowledge KTM AG, represented by Silvio Marcon and Martin Truss, for helpful discussions and the Zentral Informatikdienst (ZID) of the Graz University of Technology for the usage of the High-Performance Computing cluster. The Austrian Research and Promotion Agency (FFG), grant number 845337. Open Access Funding was provided by the Graz University of Technology.

Conflicts of Interest

The authors declare no conflict of interest.

Appendix A

The results of the FE cell model for cells A and B are presented in the following tables, including the CORA analysis outputs. The curves are trimmed at the displacement at which the first ISC onset in the experimental tests was observed.
Table A1. Comparison of the force-displacement curves of the FE model and experimental tests for cell A and results of the CORA evaluation.
GraphicMethodRatingWeight
Radial global crushBatteries 09 00195 i001Corridor method1.00.5
Correlation method0.9740.5
Total0.990
Axial global crushBatteries 09 00195 i002Corridor method1.00.5
Correlation method0.9950.5
Total0.997
IndentationBatteries 09 00195 i003Corridor method0.9720.5
Correlation method0.9710.5
Total0.972
The FE model of cell A achieves a total rating of 0.986 and a grade of “Excellent” and is, therefore, assessed positively to be integrated into the FE model of the E-PTW concept for the analysis of its crash safety.
Table A2. Comparison of the force-displacement curves of the FE model and experimental tests for cell B and results of the CORA evaluation.
GraphicMethodRatingWeight
Radial global crushBatteries 09 00195 i004Corridor method1.00.5
Correlation method0.9710.5
Total0.985
Axial global crushBatteries 09 00195 i005Corridor method0.9980.5
Correlation method0.9740.5
Total0.986
IndentationBatteries 09 00195 i006Corridor method0.9920.5
Correlation method0.9010.5
Total0.946
The FE model of cell B achieves a total rating of 0.973 and a grade of “Excellent” and is, therefore, assessed positively to be integrated into the FE model of the E-PTW concept for the analysis of its crash safety.

References

  1. Weiss, M.; Dekker, P.; Moro, A.; Scholz, H.; Patel, M.K. On the electrification of road transportation—A review of the environmental, economic, and social performance of electric two-wheelers. Transp. Res. D Transp. Environ. 2015, 41, 348–366. [Google Scholar] [CrossRef]
  2. Birke, P. Lithium-Ionen-Akkumulatoren Diskussion der verschiedenen Zellformate. ATZ Elektron 2014, 9, 38–43. [Google Scholar] [CrossRef]
  3. Schröder, R.; Aydemir, M.; Seliger, G. Comparatively Assessing different Shapes of Lithium-ion Battery Cells. Proc. Manuf. 2017, 8, 104–111. [Google Scholar] [CrossRef]
  4. Etacheri, V.; Marom, R.; Elazari, R.; Salitra, G.; Aurbach, D. Challenges in the development of advanced Li-ion batteries: A review. Energy Environ. Sci. 2011, 4, 3243. [Google Scholar] [CrossRef]
  5. Nitta, N.; Wu, F.; Lee, J.T.; Yushin, G. Li-ion battery materials: Present and future. Mater. Today 2015, 18, 252–264. [Google Scholar] [CrossRef]
  6. Ellersdorfer, C. Abbildung und Bewertung des Crashverhaltens von lithiumbasierten Batterien für elektrisch betriebene Motorräder. Ph.D. Thesis, Technische Universität Graz, Graz, Austria, 2016. [Google Scholar]
  7. Bisschop, R.; Willstrand, O.; Amon, F.; Rosengren, M. Fire Safety of Lithium-Ion Batteries in Road Vehicles; RISE Research Institute of Sweden: Boras, Sweden, 2019; ISBN 978-91-88907-78-3. [Google Scholar]
  8. IEC 62660-2:2010; Secondary Lithium-Ion Cells for the Propulsion of Electric Road Vehicles: Part 2: Reliability and Abuse Testing, Ed. 1.0. International Electrotechnical Commission: Geneva, Switzerland, 2010; ISBN 978-2-88912-302-5.
  9. Battery Safety Standards Committee. Electric and Hybrid Vehicle Propulsion Battery System Safety Standard—Lithium-based Rechargeable Cells; SAE International: Warrendale, PA, USA, 2011. [Google Scholar]
  10. United Nations. Recommendations on the Transport of Dangerous Goods—Manual of Tests and Criteria: UN 38.3 Lithium Metal and Lithium Ion Batteries. ST/SG/AC 10 ST/SG/AC.10/11/Rev.6; New York, NY, USA,, 2015. [Google Scholar]
  11. United Nations Economic Comission for Europe. Regulation No 100 of the Economic Commission for Europe of the United Nations (UNECE)—Uniform Provisions Concerning the Approval of Vehicles with Regard to Specific Requirements for the Electric Power Train, Revision 2; Economic Commission for Europe of the United Nations: Geneva, Switzerland, 2015. [Google Scholar]
  12. UL 1642; UL Standard for Safety: Lithium Batteries, Version 5. Underwriters Laboratories Inc.: Northbrook, IL, USA, 2012.
  13. UL 2580; Batteries for Use in Electric Vehicles, Edition 2.0. Underwriters Laboratories Inc.: Northbrook, IL, USA, 2016.
  14. Doughty, D.H.; Crafts, C.C.; Doughty, D.; Crafts, C. FreedomCAR: Electrical Energy Storage System Abuse Test Manual for Electric and Hybrid Electric Vehicle Applications; Sandia Report SAND2005-3123; FreedomCAR: Albuquerque, NM, USA; Livermore, CA, USA, 2006. [Google Scholar]
  15. EUCAR. Battery requirements for future automotive applications: Battery Requirements 2030, 2019.
  16. Pan, Y.; Xiong, Y.; Wu, L.; Diao, K.; Guo, W. Lightweight Design of an Automotive Battery-Pack Enclosure via Advanced High-Strength Steels and Size Optimization. Int. J. Automot. Technol. 2021, 22, 1279–1290. [Google Scholar] [CrossRef]
  17. Szabo, I.; Scurtu, L.I.; Raboca, H.; Mariasiu, F. Topographical Optimization of a Battery Module Case That Equips an Electric Vehicle. Batteries 2023, 9, 77. [Google Scholar] [CrossRef]
  18. Rawlinson, P.D.; Clarke, A.; Gadhiya, H.L.; Sumpf, R.D.; Edwards, B.P. System for absorbing and distributing side impact energy utilizing an integrated battery pack. U.S. Patent US20140182958A1, 30 January 2014. [Google Scholar]
  19. Funcke, M.; Schäfer, S.; Sturk, D.; Dufaut, D. Simulation and Active Protection of Li-Ion Traction Batteries. ATZ Worldw. 2015, 117, 10–15. [Google Scholar] [CrossRef]
  20. Matsuda, Y. A Study of Electric Motorcycle; SAE Technical Paper 2014-32-0012; SAE International: Warrendale, PA, USA, 2014. [Google Scholar] [CrossRef]
  21. Kukreja, J.; Nguyen, T.; Siegmund, T.; Chen, W.; Tsutsui, W.; Balakrishnan, K.; Liao, H.; Parab, N. Crash analysis of a conceptual electric vehicle with a damage tolerant battery pack. Extrem. Mech. Lett. 2016, 9, 371–378. [Google Scholar] [CrossRef] [Green Version]
  22. Shui, L.; Chen, F.; Garg, A.; Peng, X.; Bao, N.; Zhang, J. Design optimization of battery pack enclosure for electric vehicle. Struct. Multidisc. Optim. 2018, 58, 331–347. [Google Scholar] [CrossRef]
  23. Zhao, Y.; Shi, J.; Wang, K.; Wang, B.; He, C.; Deng, X. Mechanical Properties and Optimization Analysis on Battery Box with Honeycomb Sandwich Composite Structure. Int. J. Automot. Technol. 2023, 24, 1–14. [Google Scholar] [CrossRef]
  24. Um, H.-J.; Hwang, Y.-T.; Bae, I.-J.; Kim, H.-S. Design and manufacture of thermoplastic carbon fiber/polyethylene terephthalate composites underbody shield to protect the lithium-ion batteries for electric mobility from ground impact. Compos. Part B Eng. 2022, 238, 109892. [Google Scholar] [CrossRef]
  25. Biharta, M.A.S.; Santosa, S.P.; Widagdo, D.; Gunawan, L. Design and Optimization of Lightweight Lithium-Ion Battery Protector with 3D Auxetic Meta Structures. WEVJ 2022, 13, 118. [Google Scholar] [CrossRef]
  26. Xia, Y.; Wierzbicki, T.; Sahraei, E.; Zhang, X. Damage of cells and battery packs due to ground impact. J. Power Sources 2014, 267, 78–97. [Google Scholar] [CrossRef]
  27. Faßbender, S.; Eckstein, L.; Hören, B.; Stein, J.; Hesse, L.; Urban, P. Prospects of Holistic Purpose Design by the Example of the Electric Vehicle Concept “SpeedE”. In Proceedings of the 21st Aachen Colloquium Automobile and Engine Technology 2012, Aachen, Germany, 8–10 October 2012. [Google Scholar]
  28. European Commission. Regulation (EU) No 168/2013 of the European Parliament and of the Council of 15 January 2013 on the approval and market surveillance of two- or three-wheel vehicles and quadricycles (Text with EEA relevance). Off. J. Eur. Union 2013, L60, 52–128. [Google Scholar]
  29. Ellersdorfer, C.; Sevarin, A.; Tomasch, E.; Sinz, W.; Ebner, A.; Deitermann, N.; Forster, M. Evaluation method of the crash safety of traction batteries for electric driven motorcycles. In Tagungsband der 11. Internationalen Motorradkonferenz; Institut für Zweiradsicherheit e.V: Essen, Germany, 2016; ISBN 3923994222. [Google Scholar]
  30. Ellersdorfer, C.; Sevarin, A.; Tomasch, E.; Sinz, W.; Ebner, A.; Deitermann, N.; Forster, M. Battery Safety Evaluation of Electric Driven Motorcycles from the Perspective of Accident Research. In Proceedings of the 30th International Electric Vehicle Symposium (EVS30), Stuttgart, Germany, 9–11 October 2017. [Google Scholar]
  31. Doughty, D.H. SAE J2464 “EV & HEV Rechargeable Energy Storage System (RESS) Safety and Abuse Testing Procedure”. In Proceedings of the SAE 2010 World Congress & Exhibition, Detroit, MI, USA, 12–15 April 2010. [Google Scholar]
  32. Raffler, M.; Sevarin, A.; Ellersdorfer, C.; Heindl, S.F.; Breitfuß, C.; Sinz, W. Finite element model approach of a cylindrical lithium ion battery cell with a focus on minimization of the computational effort and short circuit prediction. J. Power Sources 2017, 360, 605–617. [Google Scholar] [CrossRef]
  33. Sevarin, A.; Fasching, M.; Ellersdorfer, C. Crash safety optimisation method for the integration of the traction batteries into electric powered-two-wheelers. In Tagungsband der 13. Internationalen Motorradkonferenz; Institut für Zweiradsicherheit e.V: Cologne, Germany, 2020. [Google Scholar]
  34. Nasdala, L. FEM-Formelsammlung Statik und Dynamik; Vieweg+Teubner: Wiesbaden, Germany, 2010; ISBN 978-3-8348-0980-3. [Google Scholar]
  35. Hallquist, J.O. LS-DYNA Theory Manual; Livermore, CA, USA, 2006. [Google Scholar]
  36. Plaimer, M.; Breitfuß, C.; Sinz, W.; Heindl, S.F.; Ellersdorfer, C.; Steffan, H.; Wilkening, M.; Hennige, V.; Tatschl, R.; Geier, A.; et al. Evaluating the trade-off between mechanical and electrochemical performance of separators for lithium-ion batteries: Methodology and application: Methodology and application. J. Power Sources 2016, 306, 702–710. [Google Scholar] [CrossRef]
  37. Jantscher, K.; Breitfuß, C.; Miklau, M.; Ismail, K.; Dobusch, P. Virtual Detection of Mechanically Induced Short Circuits in a Cylindrical Lithium-Ion Battery Cell Based on Finite Element Simulation. Batteries 2021, 7, 79. [Google Scholar] [CrossRef]
  38. Gehre, C.; Gades, H.; Wernicke, P. Objective Rating of Signals Using Test and Simulation Responses. In The 21st ESV Conference Proceedings. International Technical Conference on the Enhanced Safety of Vehicles, Stuttgart, Germany, 15–18 June 2009; NHTSA: Washington, DC, USA, 2009; pp. 1–8. [Google Scholar]
  39. Barbat, S.; Fu, Y.; Zhan, Z.; Yang, R.-J.; Gehre, C. Objective Rating Metric for Dynamic Systems. In The 23rd ESV Conference Proceedings. International Technical Conference on the Enhanced Safety of Vehicles, Seoul, Republic of Korea, 27–30 May 2013; NHTSA: Washington, DC, USA, 2013; pp. 1–10. [Google Scholar]
  40. Fasching, M.; Sevarin, A.; Ellersdorfer, C. Investigate the elastoplastic deformation behaviour of a motorcycle frame under different mechanical laod configurations. J. Crashworthiness, 2023; in press. [Google Scholar]
  41. Giordano, C.; Kleiven, S. Development of an Unbiased Validation Protocol to Assess the Biofidelity of Finite Element Head Models used in Prediction of Traumatic Brain Injury. Stapp Car Crash J. 2016, 60, 363–471. [Google Scholar]
  42. Zhan, Z.; Fu, Y.; Yang, R.-J. Enhanced Error Assessment of Response Time Histories (EEARTH) Metric and Calibration Process. In SAE Technical Paper Series; SAE International: Warrendale, PA, USA, 2011. [Google Scholar]
  43. Donnelly, B.R.; Morgan, R.M.; Eppinger, R.H. Durability, Repeatability and Reproducibility of the NHTSA Side Impact Dummy. In SAE Technical Paper Series; SAE International: Warrendale, PA, USA, 1983. [Google Scholar]
  44. Murmann, R.; Harzheim, L.; Dominico, S.; Immel, R. CoSi: Correlation of signals—A new measure to assess the correlation of history response curves. Mech. Syst. Signal Process. 2016, 80, 482–502. [Google Scholar] [CrossRef]
  45. Peres, J.; Bastien, C.; Christensen, J.; Asgharpour, Z. A minimum area discrepancy method (MADM) for force displacement response correlation. Comput. Methods Biomech. Biomed. Engin. 2019, 22, 981–996. [Google Scholar] [CrossRef] [PubMed]
  46. Vavalle, N.A.; Jelen, B.C.; Moreno, D.P.; Stitzel, J.D.; Gayzik, F.S. An evaluation of objective rating methods for full-body finite element model comparison to PMHS tests. Traffic Inj. Prev. 2013, 14, S87–S94. [Google Scholar] [CrossRef] [PubMed] [Green Version]
  47. Carsten Thunert. CORAplus Release 4.0.4: User’s Manual; Braunschweig, Germany, 2017. [Google Scholar]
  48. Gehre, C. CORAplus Release 4.0.4; pdb—Partnership for Dummy Technology and Biomechanics: Gaimersheim, Germany, 2017. [Google Scholar]
  49. Stander, N.; Basudhar, A.; Roux, W.; Witowski, K.; Eggleston, T.; Goel, T.; Craig, K. LS-OPT User´s Manual: A Design Optimization and Probabilistic Analysis Tool for the Engineering Analyst, Version 6.0; Livermore, CA, USA, 2019. [Google Scholar]
  50. Wang, G.G.; Shan, S. Review of Metamodeling Techniques in Support of Engineering Design Optimization. Struct. Multidisc. Optim. 2007, 129, 370–380. [Google Scholar] [CrossRef]
  51. Kleijnen, J.P.C. Response Surface Methodology. SSRN J. 2014, 60, 735. [Google Scholar] [CrossRef] [Green Version]
  52. Christensen, J.; Bastien, C. Nonlinear Optimization of Vehicle Safety Structures: Modeling of Structures Subjected to Large Deformations; Elsevier; Oxford, UK, 2016; ISBN 9780124173095. [Google Scholar]
  53. Aydar, A.Y. Utilization of Response Surface Methodology in Optimization of Extraction of Plant Materials. In Statistical Approaches With Emphasis on Design of Experiments Applied to Chemical Processes; Silva, V., Ed.; InTech: London, UK, 2018; ISBN 978-953-51-3877-8. [Google Scholar]
  54. Misra, R.K.; Kumar, S. Multiquadric Radial Basis Function Method for Boundary Value and Free Vibration Problems. Indian J. Industr. Appl. Math. 2013, 4, 138. [Google Scholar] [CrossRef]
  55. Zhou, M.; Hu, L.; Chen, S.; Zhao, X. Different mechanical-electrochemical coupled failure mechanism and safety evaluation of lithium-ion pouch cells under dynamic and quasi-static mechanical abuse. J. Power Sources 2021, 497, 229897. [Google Scholar] [CrossRef]
  56. Bulla, M.; Schmandt, C.; Kolling, S.; Kisters, T.; Sahraei, E. An Experimental and Numerical Study on Charged 21700 Lithium-Ion Battery Cells under Dynamic and High Mechanical Loads. Energies 2023, 16, 211. [Google Scholar] [CrossRef]
Figure 1. CAD models of the E-PTW with traction battery: (a) Concepts Y and (b) Concept Z.
Batteries 09 00195 g001
Figure 2. Schematic top view representation of the collision configuration (a) and simplified FE E-PTW model with traction battery: (b) Concepts Y and (c) Concept Z.
Batteries 09 00195 g002
Figure 3. Schematic sketch of the traction battery of Concept Y with its components. The external plates are semi-transparent to show the inner components of the traction battery [33].
Batteries 09 00195 g003
Figure 4. Mechanical load configurations for data acquisition: (a) global radial crush, (b) global axial crush and (c) indentation. The blue arrow indicates the acting force.
Batteries 09 00195 g004
Figure 5. Response surfaces of the maximal ISCR in relation to the two traction battery housing variables for Concept Y with cell B.
Batteries 09 00195 g005
Figure 6. Traction battery deformation for Concept Y with cell B at 6.5 ms after impact for: (a) EPs’ thickness of 3 mm and LPs’ thickness of 3 mm, (b) EPs’ thickness of 3 mm and LPs’ thickness of 20 mm, and (c) EPs’ thickness of 20 mm and LPs’ thickness of 3 mm. Note that the EPs are semi-transparent.
Batteries 09 00195 g006
Figure 7. Response surfaces of the maximal ISCR in relation to the thickness of EPs and LPs for (a) Concept Z with cell A and (b) Concept Z with cell B.
Batteries 09 00195 g007
Figure 8. Comparison of ISCR and mass trends for Concepts Y and Z with cells A and B. The dotted lines represent the upper and lower limit of the TR for each metamodel.
Batteries 09 00195 g008
Table 1. Description of the acronyms for the ISCR at the cell level.
AcronymDescription
ε r Radial cell deformation. Calculated as proposed by Raffler et al. [32]
ε r   S C Radial cell deformation
at ISC onset.
ε p Pole cell deformation. Calculated as proposed by Raffler et al. [32]
ε p   S C Pole cell deformation
at ISC onset.
Table 2. Grades of the CORA method.
GradeScore Range
Excellent0.86 ≤ R < 1.00
Good0.65 ≤ R < 0.86
Fair0.44 ≤ R < 0.65
Marginal0.26 ≤ R < 0.44
Unacceptable0.00 ≤ R < 0.26
Table 3. Description of the acronyms for the approximation of the traction battery housing mass.
AcronymDescription and UnitsValue
T B H m Mass of the traction battery housing [kg]Output
ρ Density of the housing material [kg/mm3]2.7 × 10−6
T H L P Thickness of the longitudinal plates [mm]Variable
S L P Middle surface of the longitudinal plates [mm2]171,7831
T H E P Thickness of the external plates [mm]Variable
S E P Middle surface of the external plates [mm2]515,192
Table 4. Statistical analysis of the error distribution for Concept Y.
Cell
Integrated
MeanStandard
Deviation
Upper
Tolerance Range
Lower
Tolerance Range
A0000
B−0.21.22.2−2.6
Table 5. Comparison of the impactor displacement at ISCR onset for cell A and cell B in the three tested configurations at cell level.
CellImpactor Displacement at ISC Onset [mm]
Global Radial CrushGlobal Axial CrushIndentation
A5.53.54.5
B6.75.65.6
Table 6. Statistical analysis of the error distribution for Concept Z.
Cell
Integrated
MeanStandard
Deviation
Upper
Tolerance Range
Lower
Tolerance Range
A0.32.34.9−4.2
B0.00.91.8−1.9
Disclaimer/Publisher’s Note: The statements, opinions and data contained in all publications are solely those of the individual author(s) and contributor(s) and not of MDPI and/or the editor(s). MDPI and/or the editor(s) disclaim responsibility for any injury to people or property resulting from any ideas, methods, instructions or products referred to in the content.

