Contactless Resonant Cavity Dielectric Spectroscopic Studies of Recycled Office Papers †


1
Testing and Technical Services, Plant Operations, United States Government Publishing Office 732 North Capitol Street, Northwest, Washington, DC 20401, USA
2
Materials Measurement Laboratory, National Institute of Standards and Technology 100 Bureau Drive, Gaithersburg, MD 20899, USA
3
College of Pharmacy, University of South Florida, 12908 USF Health Drive, MDC 30, Tampa, FL 33612, USA
4
Nanoscale Device Characterization Division, Physical Measurement Laboratory, National Institute of Standards and Technology, 100 Bureau Drive, Gaithersburg, MD 20899, USA
*
Authors to whom correspondence should be addressed.
†
Contribution of the National Institute of Standards and Technology, not subject to copyright. Certain commercial equipment, instruments, or materials are identified in this report to specify the experimental procedure adequately. Such identification is not intended to imply recommendation or endorsement by the National Institute of Standards and Technology or the United States Government Publishing Office, nor is it intended to imply that the materials or equipment identified are necessarily the best available for the purpose.
Recycling 2019, 4(4), 43; https://0-doi-org.brum.beds.ac.uk/10.3390/recycling4040043
Submission received: 28 June 2019
/
Revised: 29 July 2019
/
Accepted: 21 August 2019
/
Published: 5 November 2019
Abstract
:Current product composition and quality test methods for the paper and pulp industries are rooted in wet-bench chemistry techniques which cannot be used to distinguish between virgin and secondary fibers. We have recently demonstrated the application of an in situ and nondestructive assessment method based on dielectric spectroscopy (DS), which can address this deficiency in the testing of paper. The DS technique, which employs a resonant microwave cavity, could be applicable to quality assurance techniques such as gauge capability studies and real-time statistical process control (SPC), and may have inherent forensic capabilities. In this paper, we show how this DS technique can be used to distinguish between office copier paper products which may contain recycled fibers. We show a reasonable correlation between the dielectric characteristics (e.g., dielectric loss) and the atomistic level chemical changes that result from the paper recycling process.
1. Introduction
TAPPI Method T 401, “Fiber analysis of paper and paperboard”, is the state-of-the-art method for characterizing the fiber types and their ratios in paper samples [1]. Unfortunately, this method does not provide for a means to determine the presence or amount of secondary (i.e., recycled) fiber in paper samples, as virgin and recycled fibers are indistinguishable to the human eye. Indirect techniques, such as the use of Simons’ Stain, to examine the pore capillary structure of sheets and pulps by a size exclusion mechanism may suggest, but not definitively identify, the presence of secondary fiber in a test sample [2,3]. To the best of our knowledge, currently, there are no reported scientific methods in the public domain for discerning between papers of virgin and secondary fiber content or for determining the amount or type of recycled fiber in paper products [4]. Currently, the paper and pulp industries rely on third-party auditing organizations, such as Green Seal (in the United States) and Der Blaue Engel (in Europe) to certify recycled fiber content of paper products through forensic accounting analysis of the purchases of recycled pulp by paper mills [5,6]. Thus, there is a need for an analytical method for the identification and quantification of secondary fiber in paper. An analytical method with an accuracy of ±50% of the advertised secondary fiber content claim has been proposed. However, the method has not been widely adopted because its accuracy and reproducibility were too low [7,8].
Paper is a multiphase, multicomponent system consisting primarily of plant-derived cellulose fibers, which are embedded in a matrix comprising essentially of sizing agents, inorganic filler materials, colorants, optical brighteners, air, and water. Depending upon their species of origin and processing, the cellulose fibers will also be associated with varying amounts of water, natural extractives and carbohydrate derivatives such as lignins and hemicelluloses [9]. The water molecules are mostly adsorbed on the cellulose polymer via hydrogen bonding, which influences the level of cross-linking within the cellulose structure and the level of polarizability of the water molecules [3]. The hydrogen bonding of water to cellulose depends on the supramolecular structure of the cellulose, which is distinctly different in virgin and recycled paper products [10]. The dielectric characterization technique described in this article leverages the relaxation dynamics of dipoles and mobile charge carriers in response to the rapidly changing electric and magnetic fields of microwaves. This provides information on the fluctuations of dipoles and rotational reorientations within a matrix. Thus, the dielectric characteristics should be able to distinguish different molecular units of a polymeric system, such as cellulose, on the basis of their orientational dynamics [11]. The DS technique takes advantage of the changes in the net electrical characteristics of the paper product due to compositional changes with increasing post-consumer waste (PCW) recycled fiber content. The technique also provides additional information, such as information about the microstructure of the analyte, beyond what can be learned from other characterization techniques such as electron microscopy and thermal analysis techniques (e.g., dynamic mechanical analysis) [12,13].
In this article we discuss the dielectric properties of the analytes in terms of dielectric loss, which is an indication of how much heat is dissipated by a dielectric material when an electric field is applied across it; more conductive materials will have a higher dielectric loss value (ε″) than less conductive materials. The dielectric characterization of the paper analytes was performed using a non-contact microwave cavity that operates at the resonant frequency of 7.435 GHz. At such a high frequency (i.e., time scale of about 0.5 ns), only the electronic polarization and relaxation of the water molecules contribute to the overall dielectric response. Relaxation processes associated with molecular dipoles and ionic impurities typically contribute in the MHz frequency range, and, thus, they do not contribute appreciably to the dielectric permittivity measurements at microwave frequencies. Previous work has demonstrated that the measurement uncertainty of our resonant cavity device is exceptionally small; the dielectric loss (ε″) uncertainty is in the range of ± 5 × 10⁻⁴ [14,15,16]. The low uncertainty of this measurement method and insensitivity to impurity effects in the frequency range in which we operate the instrument make the method highly suitable for detecting small changes in the dielectric loss arising from the compositional alterations in the recycled paper specimens.
2. Results
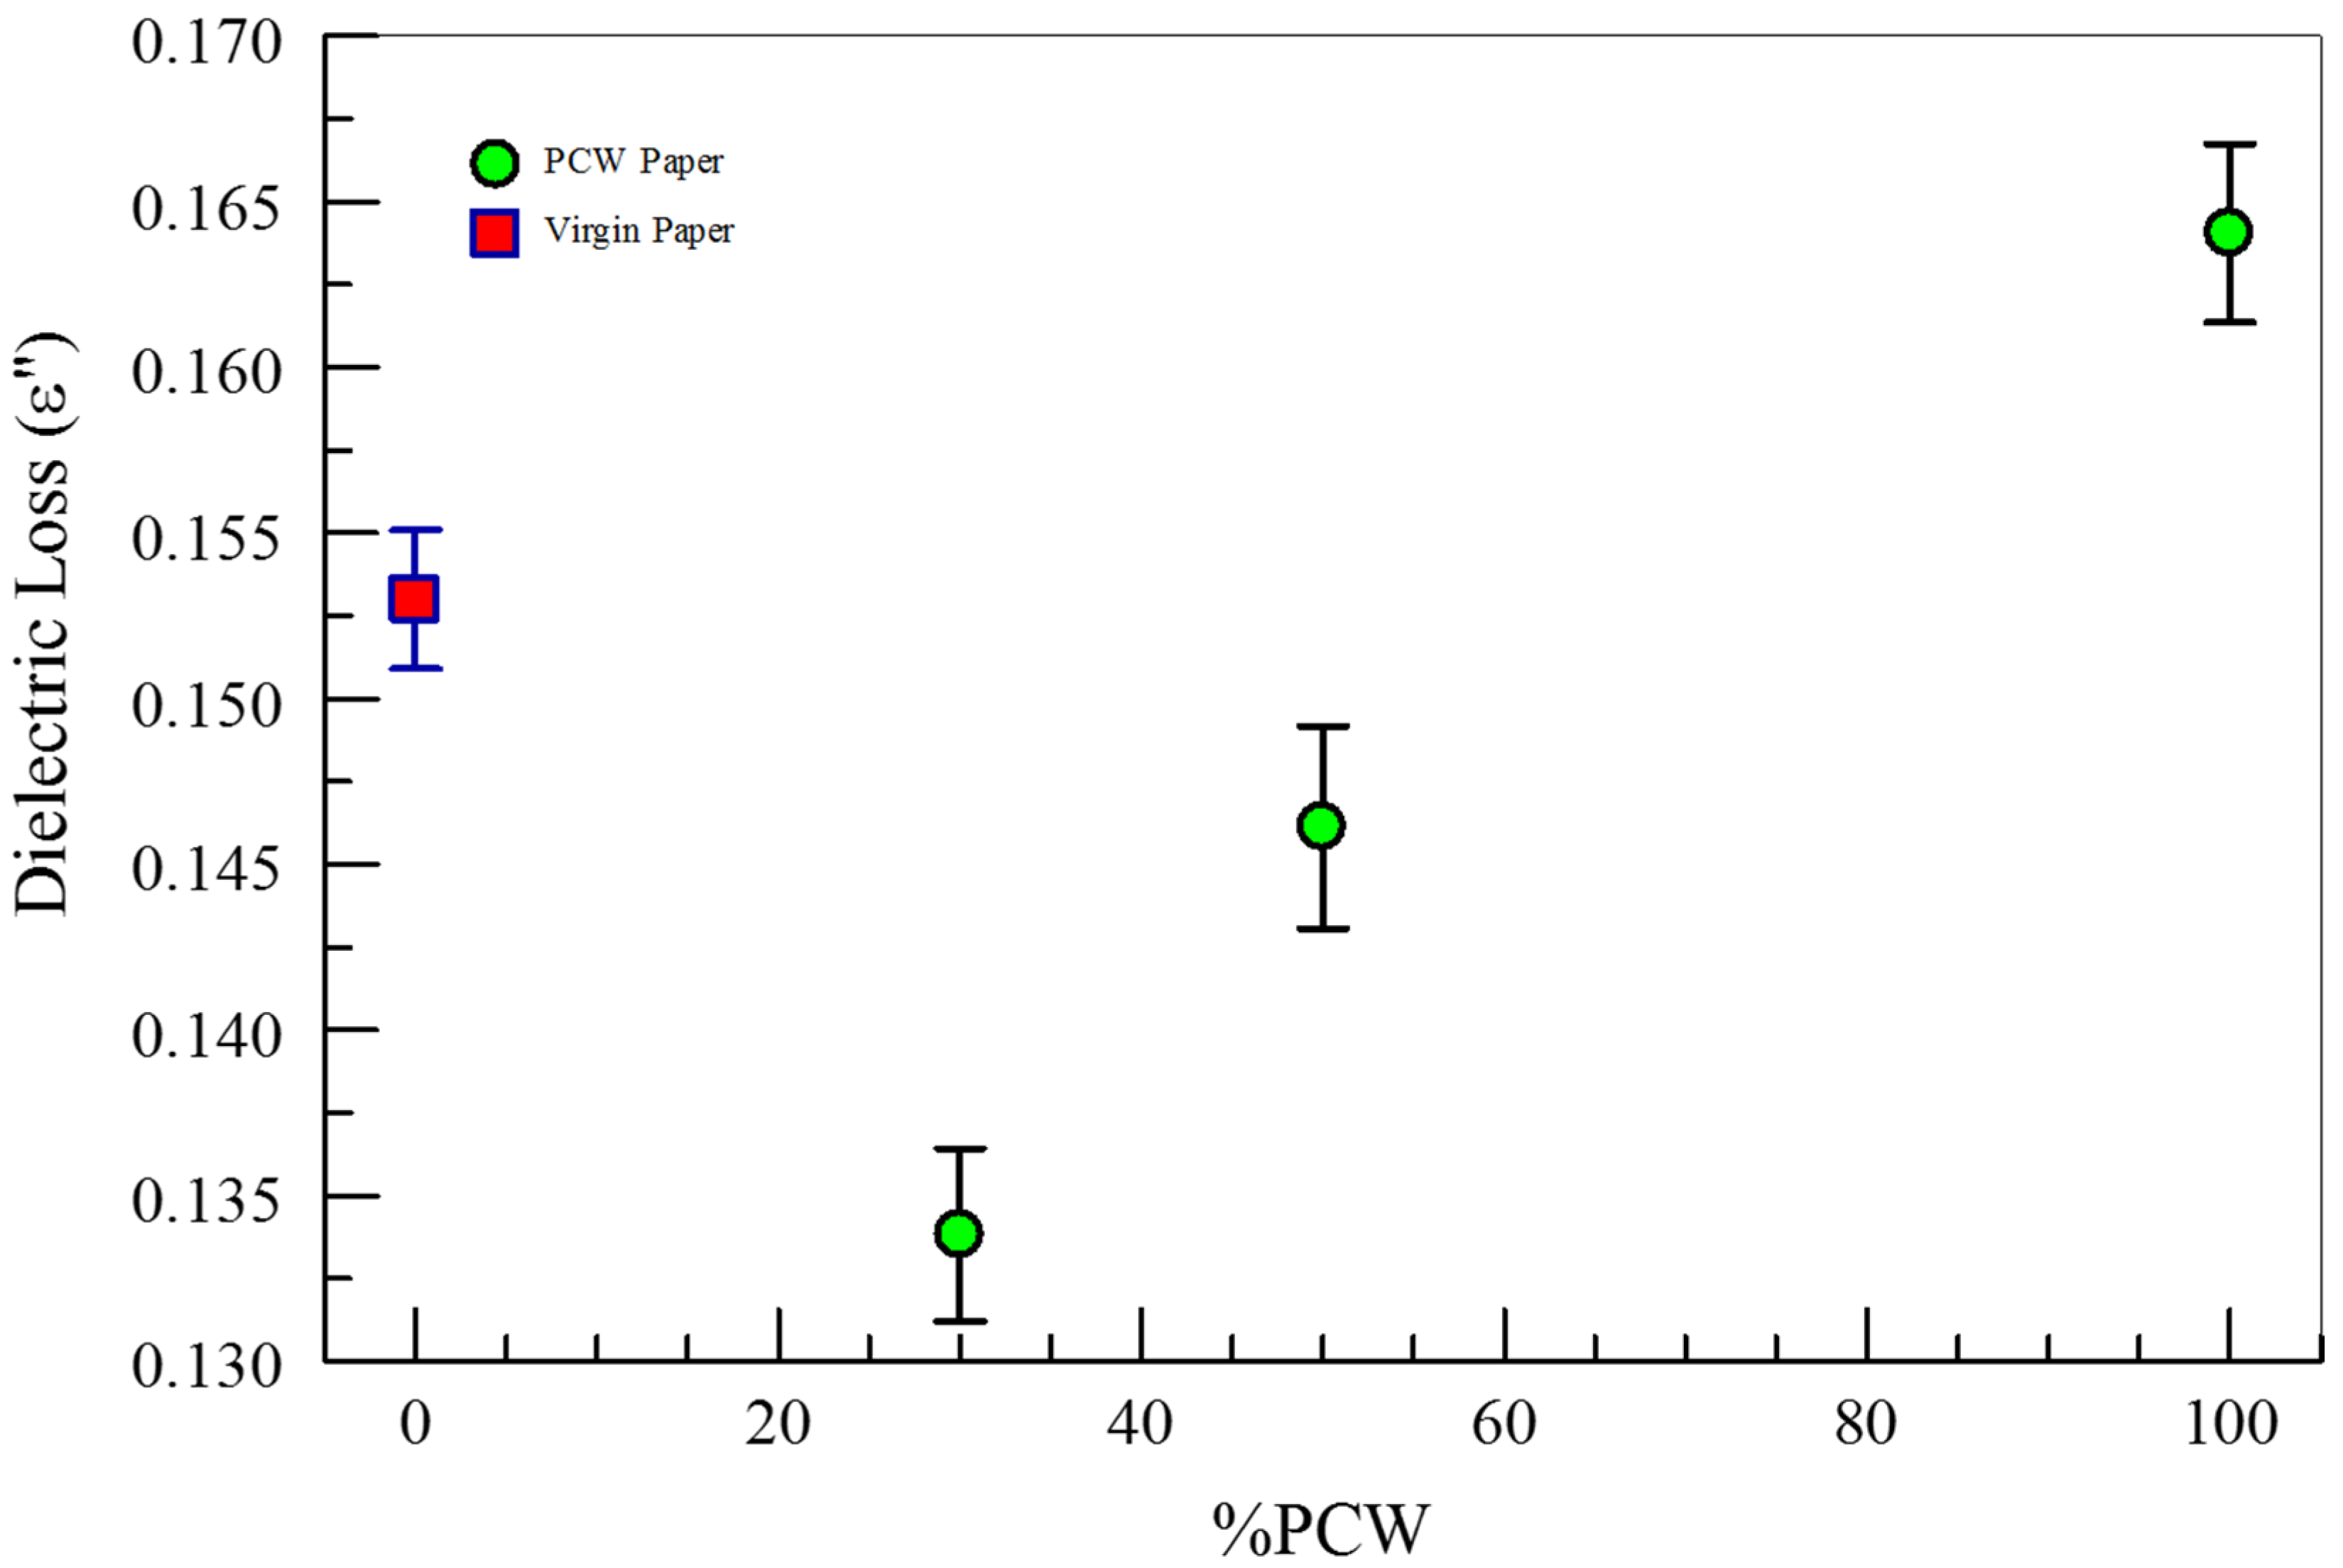
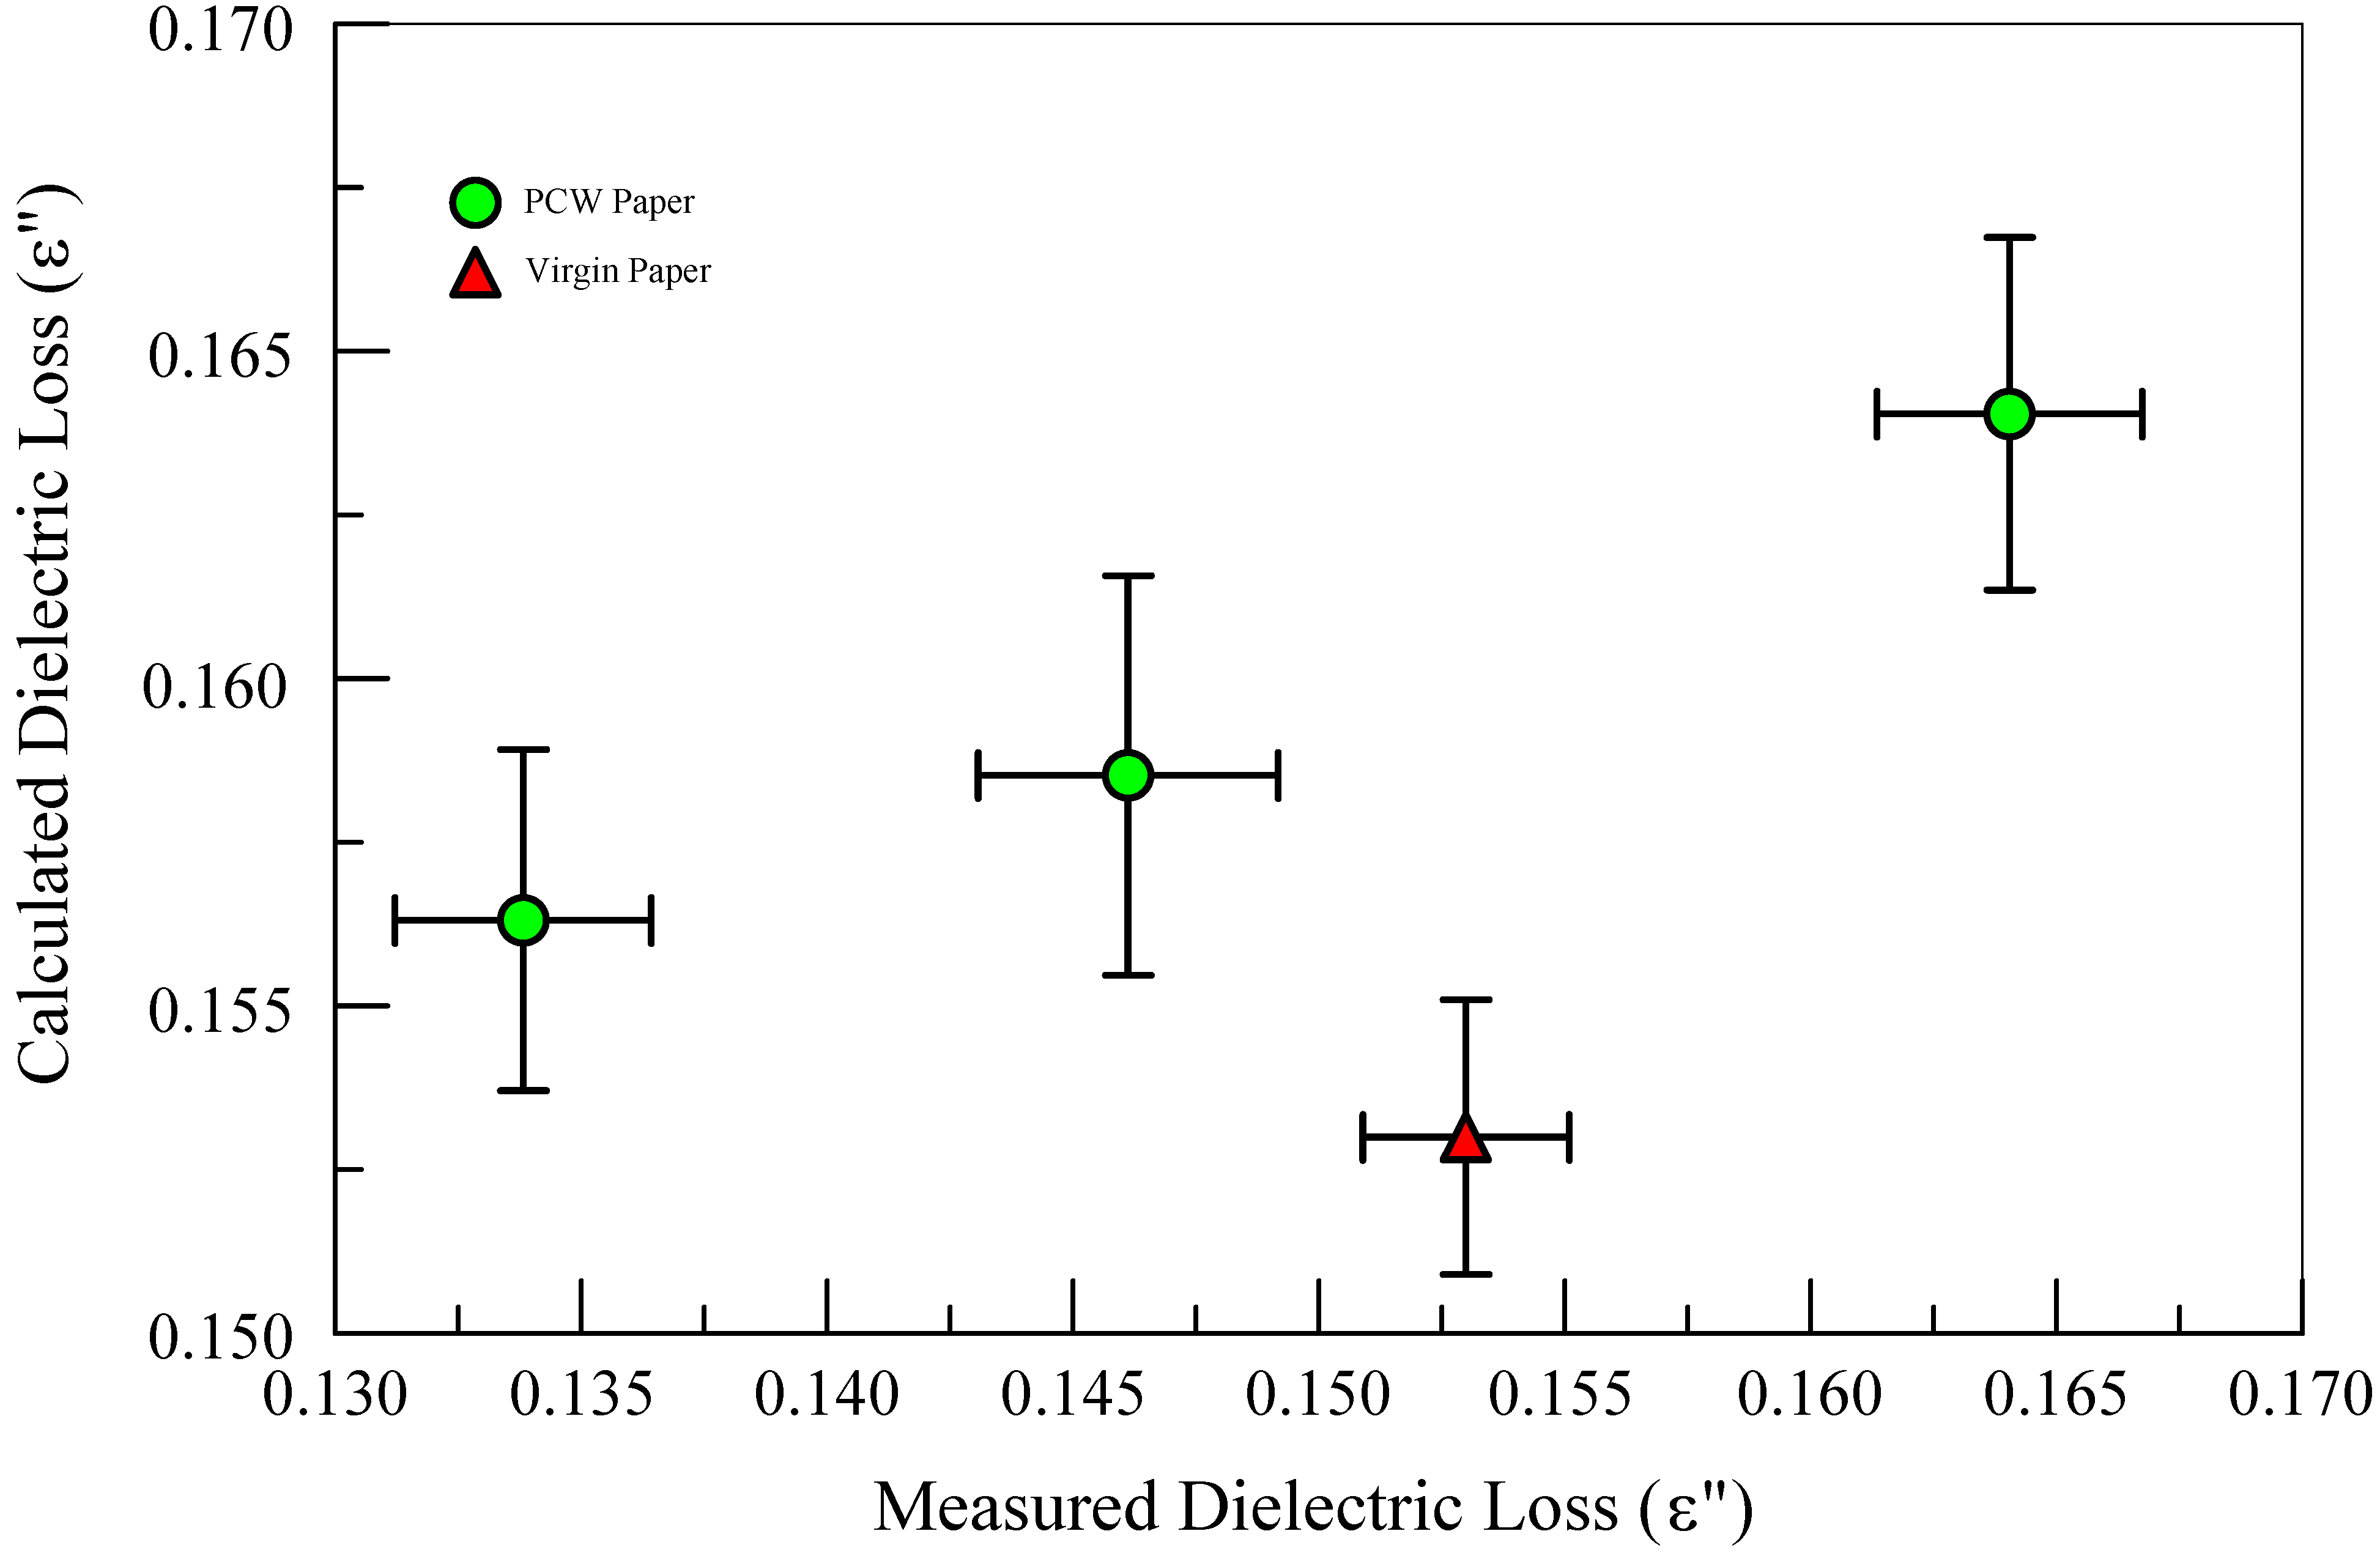
Figure 1 compares the dielectric loss of a range of office copier papers produced by a single US- based manufacturer, manufacturer B, as a function of the recycled fiber content in the samples [17]. The dielectric loss appears to increase with increasing secondary fiber content of the paper. The iterative cycles of cleaning and repulping of the reclaimed fibers change the physicochemical nature of the recycled paper product compared to a virgin fiber paper product. The heating steps during the recycling and papermaking processes render the cellulosic fibers to become more crystalline. This results in decreased hydrogen bonding between the surface carbohydrate macromolecules of neighboring fibers and also results in reduced water retention as fibrils become more compact. The processing reduces the hemicellulosic and lignin concentrations in the recycled papers as well [18]. The dielectric properties of paper, in the aggregate, can estimate the relative fractions of each component; the electrical properties of the paper sample are determined by the ratio of virgin to recycled fibers [12,19]. Consequently, the extrinsic properties of the recycled papers can be phonologically approximated as a fraction-weighted linear combination of the virgin and 100% recycled pulps, as shown in Figure 2.
The observed dielectric loss depends on the exact composition of the paper, which could contain many additional constituents besides the cellulosic fibers depending on the intended use. In both Figure 1 and Figure 2, notice that virgin paper appears to be electrically distinct from the recycled papers. This is attributed to the fact that the virgin paper is comprised of different polymorphs of cellulose with distinctly different hydrogen bonding capabilities along with the types and concentrations of other components used in the papermaking process, such as sizing agents, colorants, and optical brightening agents (OBAs).
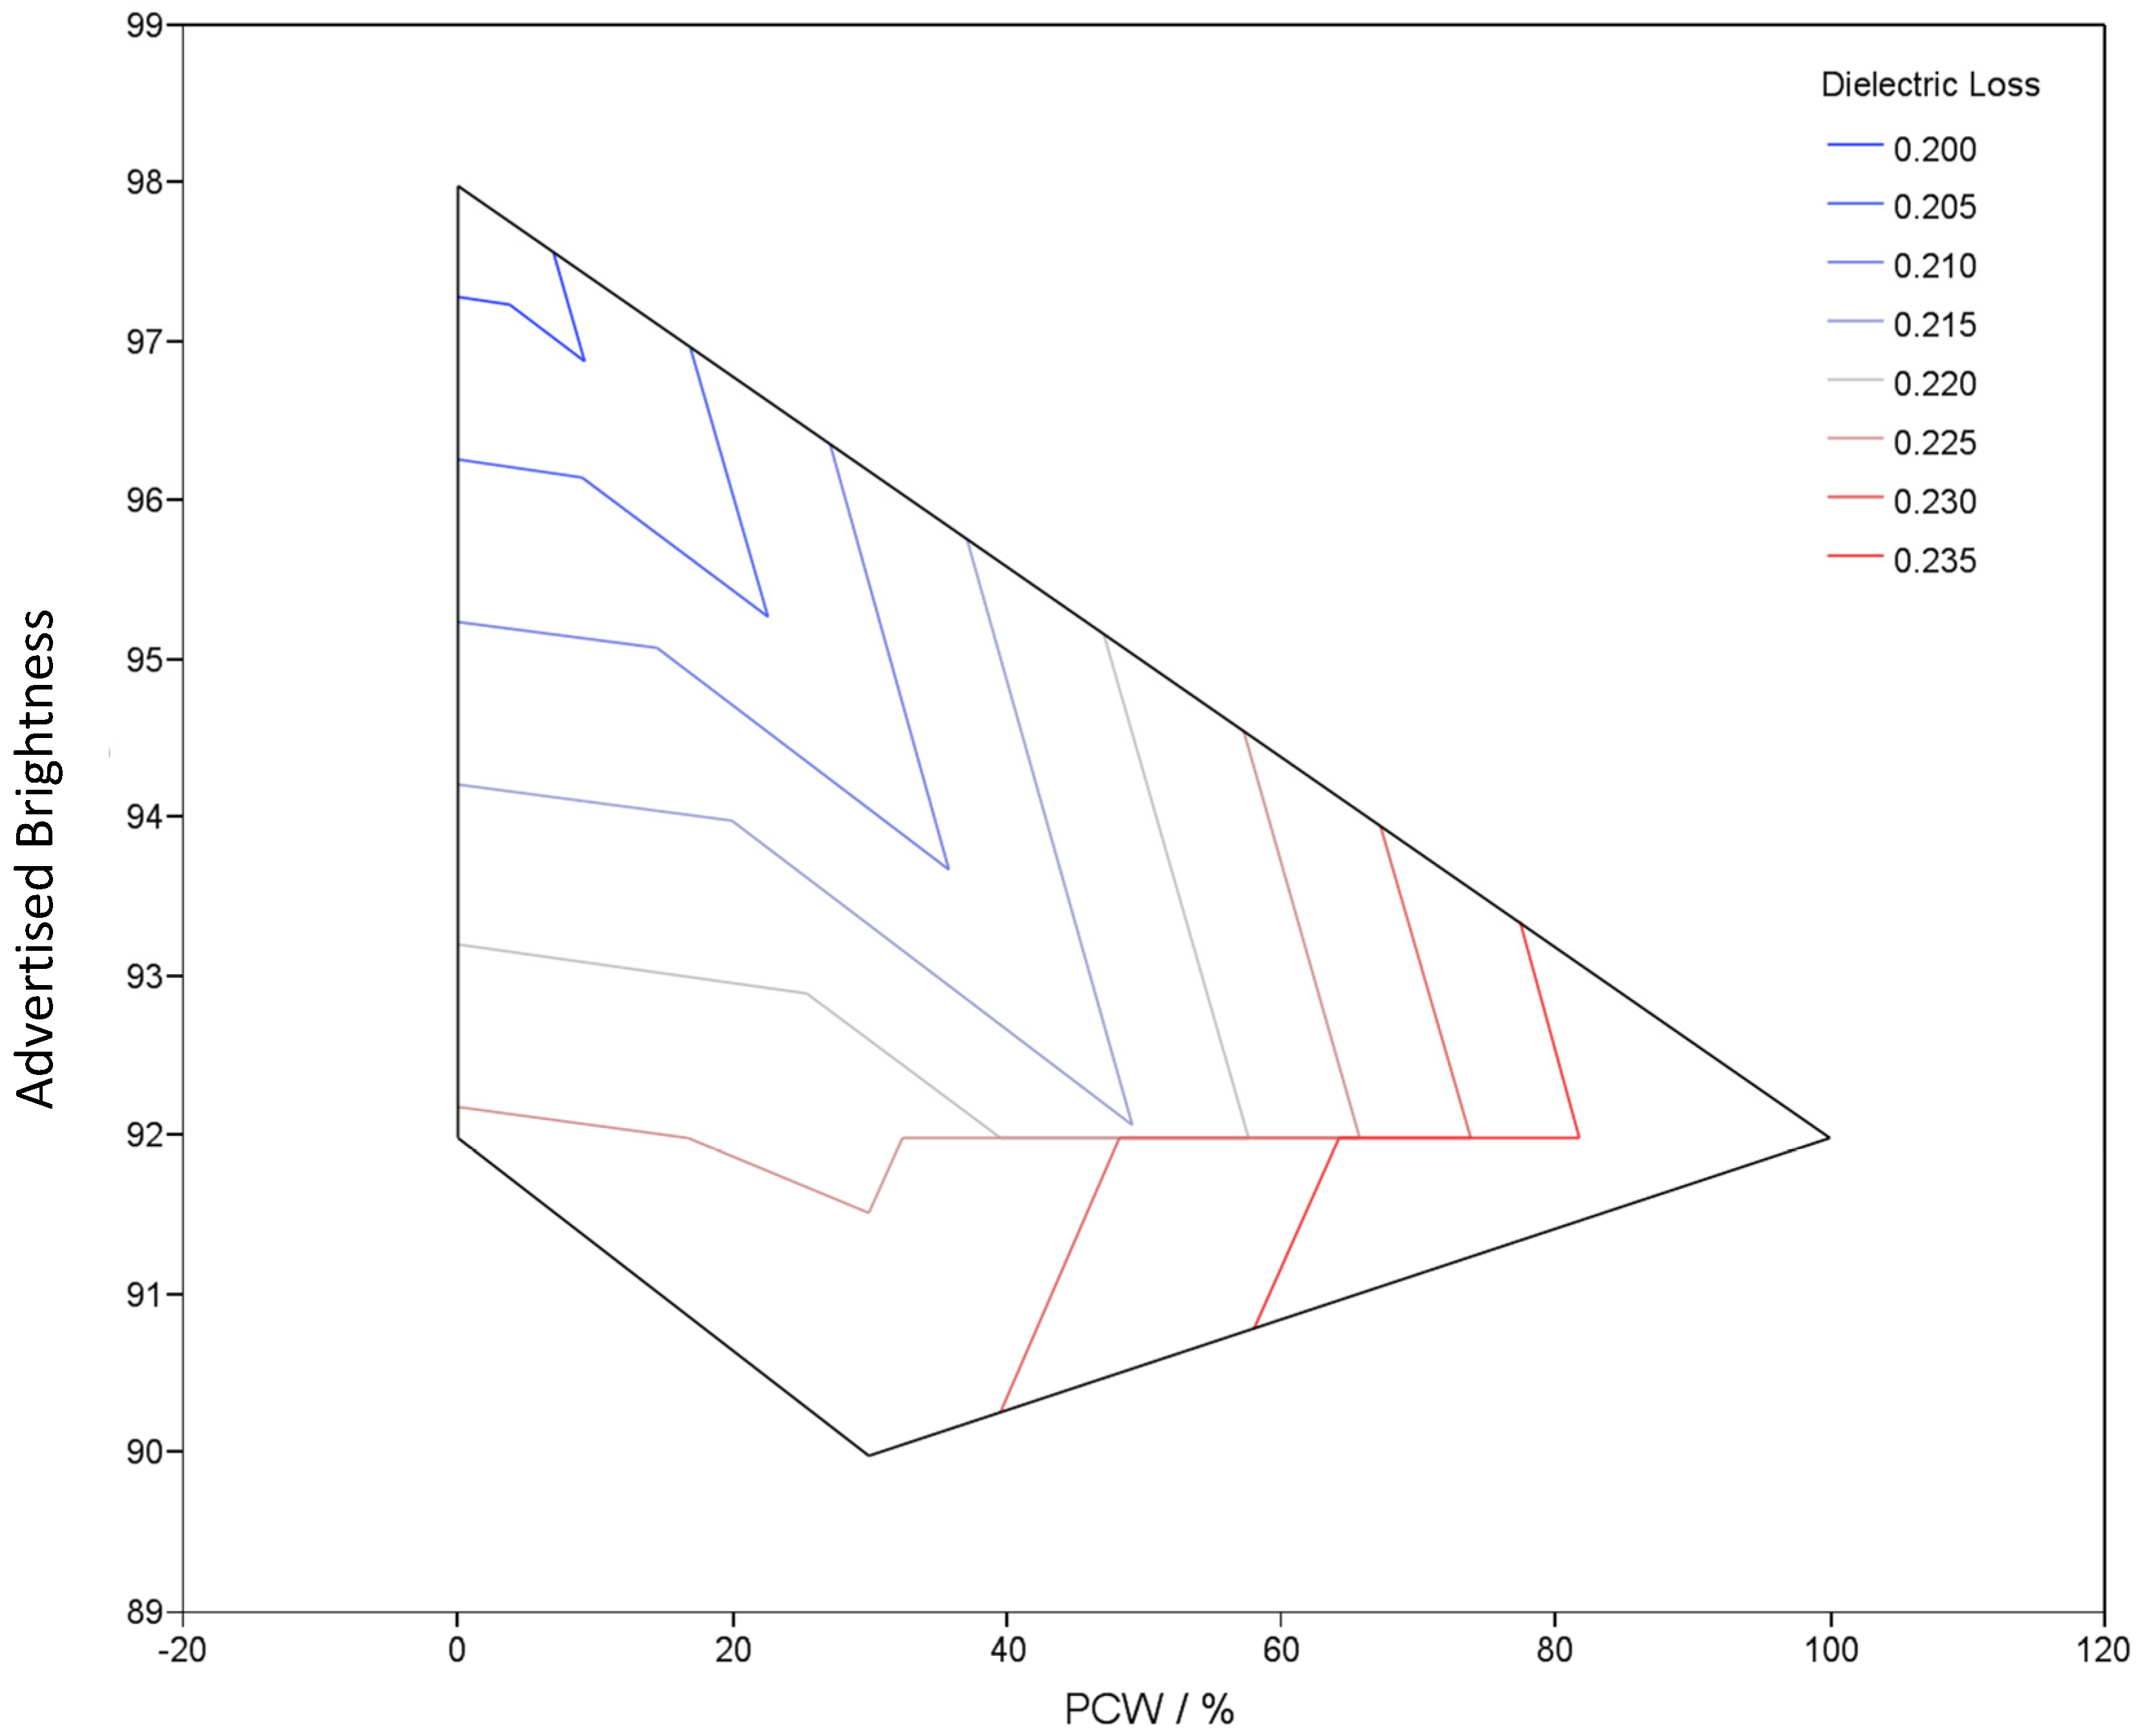
The nature and quantity of the additives used in the recycled pulp depend upon the quality and condition of the recycled fibers used in the papermaking process flow [20]. The brightness disparities in commercial grade PCW recycled papers suggest differences in the nature and quantity of the additives used to achieve the manufacturer’s advertised brightness for a particular paper product [21,22]. These additives also impact the dielectric loss characteristics of the final product since they tend to be polar and, depending on their molecular structures, can form hydrogen bonds with the adsorbed water [23]. Figure 3 is a contour plot showing the relationship between the observed dielectric loss as a function of the advertised brightness and the percentage of PCW recycled fiber content. Whereas we do not know the nature and quantity of the additives used to achieve the optical brightness, clearly, there are relationships between the paper composition and the dielectric loss (ε″). A larger body of data will be needed to parse out the contributions of the individual paper product components on the dielectric loss.
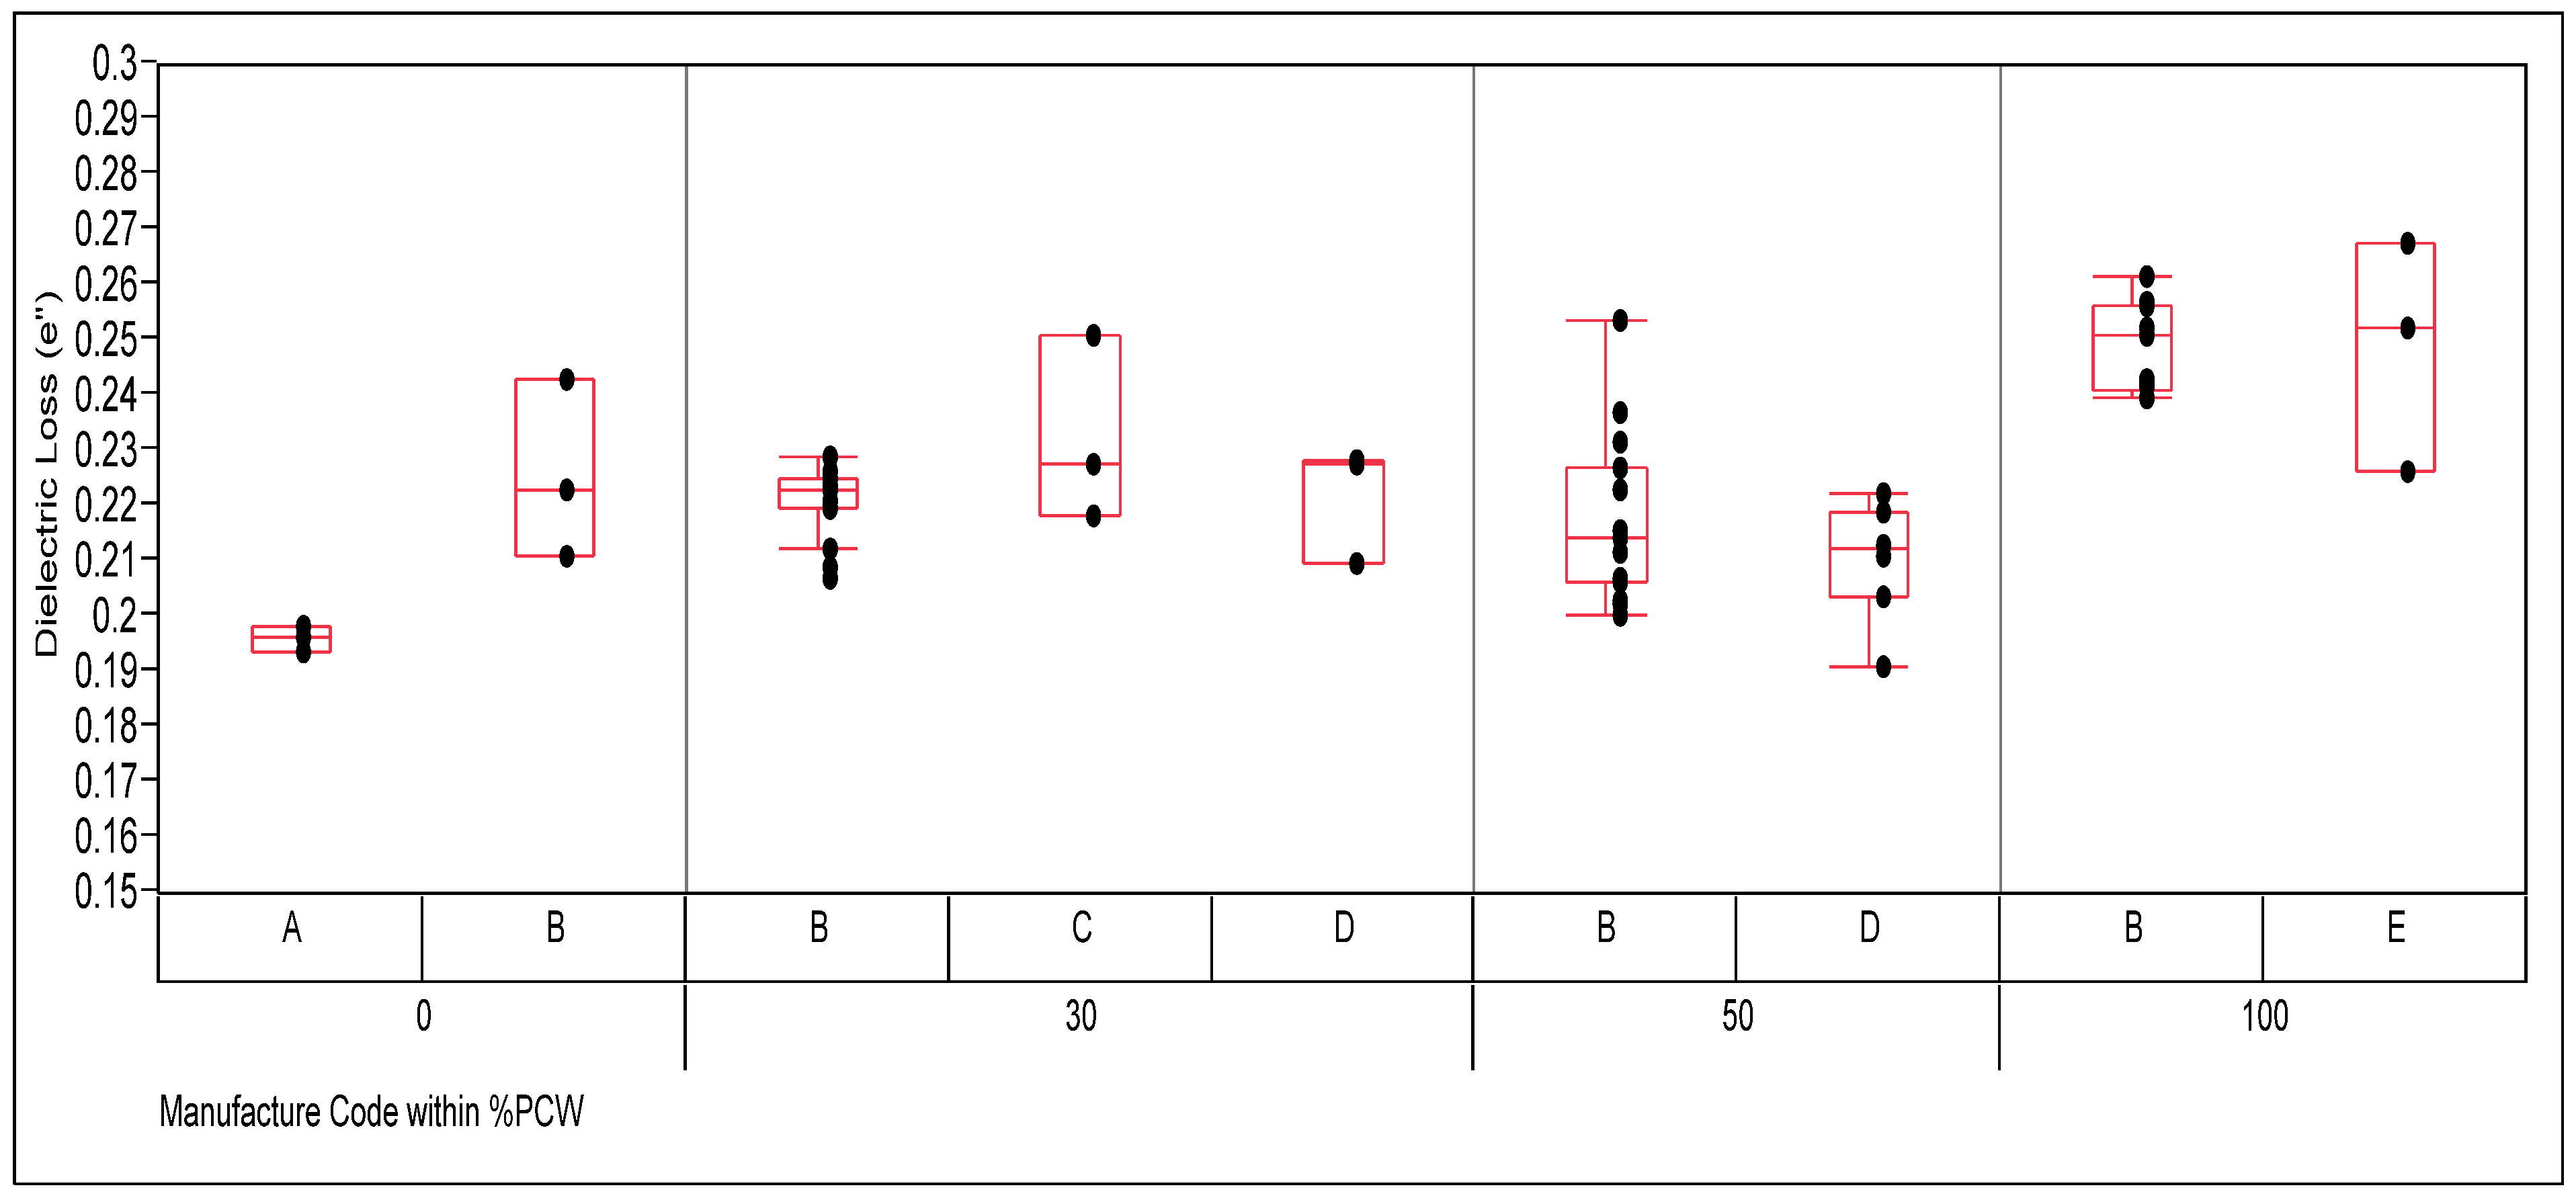
The advertised brightness of the samples analyzed was 92 brightness for all the 50% PCW and 100% PCW paper, while the brightness varied with manufacturer for the 30% PCW and 0% PCW papers. In the virgin (i.e., 0% PCW) paper samples, those from manufacturer A were listed as 98 brightness, and those from manufacturer B were advertised as 92 brightness. Thus, in the context of the virgin paper analytes, it is reasonable to surmise that the paper supplied from manufacturer A (with 98 brightness) had a higher concentration of OBA which created a sterically-hindered environment that limits the polarization and precession of water molecules. Consequently, the dielectric loss value is depressed as compared to the 92 brightness paper produced by manufacturer B. This trend can also be observed across the 30% PCW analytes, two of which (manufacturers C and D) are 90 brightness and the third (manufacturer B) is 92 brightness. Figure 4 compares the dielectric loss of specimens from selected manufacturers and the variability among “as-received” office papers of varying PCW recycled fiber content. For example, the measured dielectric loss of a 50% PCW recycled paper with an advertised brightness of 92 is 0.235, as shown in Figure 4.
3. Discussion
As a result of a US Federal Government mandate, white office copier paper with a minimum of 30% PCW recycled fiber is now one of the most ubiquitous grades of paper, with 30%, 50%, and 100% PCW recycled fiber content office paper products readily available [24]. However, there is a pressing need for a reliable, quantitative measure of the PCW recycled content in such paper as standard optical, physical, and chemical analyses have been unsuccessful at distinguishing between varying amounts of recycled fiber content in white office papers [4]. Elemental and isotopic analyses have also been unable to produce a correlation between fiber type among recycled and virgin white office papers [25,26,27]. The root cause of this metrology gap lies with the heterogenous chemistry of paper.
The adsorbed water in paper products is partitioned between the hydrogen-bonding capable constituents in the paper. This confined water has a lower dielectric constant than free water [13,28]. It is this water that is probed by dielectric spectroscopy in order to understand the physicochemical differences between virgin fibers, recycled fibers, and mixtures of the two per effective medium theory [12]. For example, previous work has shown that below 10% moisture content, the dielectric loss measured in paper is attributable to the dipolar mechanism of water bound to cellulose [29]. Other constituents, such as fillers, colorants, sizing agents, etc., can also affect the partitioning of bound water [13].
Virgin office copier papers are typically manufactured from an 80:20 mix of bleached hardwood Kraft pulp to bleached softwood Kraft pulp [4]. The bleached Kraft pulping process reduces the concentration of extractives associated with the cellulose fibers, including nearly all the lignin content and significant amounts of hemicellulose associated with the cellulose polymer; these trends are magnified with subsequent recycles [18]. The physical and dielectric properties of paper containing recycled fibers will vary substantially, within a sheet and from sheet to sheet, because of the additional processing involved (i.e., deinking and repulping of office waste papers) as compared to virgin fibers. The recycling process changes the physicochemical properties of the recycled pulp, with the greatest impact coming from the deinking and drying processes [30,31]. The drying step changes the crystalline nature and reduces the hydrogen bonding capacity of the cellulosic fibers. The presence of toner particles and other contaminants, like multivalent cations, in the recycled pulp further influences the hydrogen bonding behavior of the cellulose fibers and consequently the dielectric loss profile of the end products [31].
4. Materials and Methods
4.1. Sample Preparation
Commercially available white office copier papers of varying advertised brightness and PCW recycled content from five separate manufacturers (identified as manufacturer A through E in this article) were studied. To accommodate the dimensions of our resonant cavity apparatus, analyte samples were in the form of paper strips of width 0.5 cm and roughly to 8 cm in length were cut from 21.6 by 27.9 cm (i.e., 8-1/2″ by 11″) sheets with a rotary cutter. Strip angles were measured using a student’s protractor with the basis of the machine direction set to 90°, while the cross direction was set to 0°. The samples were dried at about 115 °C under nitrogen and were stored between glass microscope slides in a nitrogen-filled dry box. Moisture content at ambient conditions was assumed to be 5%, as mass-produced papers are manufactured for a target moisture content of 5% for optimal runnability and printability. The thickness of the paper specimen was determined through an average of ten caliper measurements and was typically 100 µm. A minimum of 5 replicates per sample were measured at the 60° orientation.
4.2. Dielectric Loss Measurement
The complex relative permittivity of the paper analytes is the sum of real and imaginary parts () and was measured at a frequency of 7.435 GHz using a non-contact cavity perturbation method. This method of precise dielectric measurement is nondestructive and is experimentally simple to implement since it does not require any electrical contacts that could influenced by water adsorption.
For a small specimen inside a rectangular cavity operating in the TE10 mode, the classical perturbation equation can be simplified to linear equations [14,15,16]:
where x, y′ and y″ are defined by the following relations:
x = Vs/V0, y′ = (f0/fs)/f0, and y″ = 1/Qs − 1/Q0
Here, f0 is the resonant frequency of the empty cavity, fs is the resonant frequency with the specimen present, V0 is the volume of the cavity, vs. is the volume of the specimen (V0 >> Vs). Q0 is the resonance quality factor of the empty cavity and Qs is the resonance quality factor of the cavity loaded with the specimen. The resonance quality factor is obtained from the resonant peak according to the conventional half power bandwidth formula as Qs = fs/wfs. where wfs is the bandwidth of the resonant peak. The real permittivity εr′ and the dielectric loss εr″ can be determined from the slope of Equations (1a) and (1b) respectively, where intercepts are the constants, b′ and b″. Our cavity test fixture employs a WR90 waveguide, operating in the microwave frequency range of 6.7 GHz to 13 GHz. The fixture is connected to a network analyzer (Agilent N5225A) with semi-rigid coaxial cables and near cross-polarized coaxial to WR90 coupling adapters. The network analyzer measures the transmission scattering parameter S21. The resonant frequency, fs, and the half power bandwidth, wfs, are determined for the TE103 resonant mode.
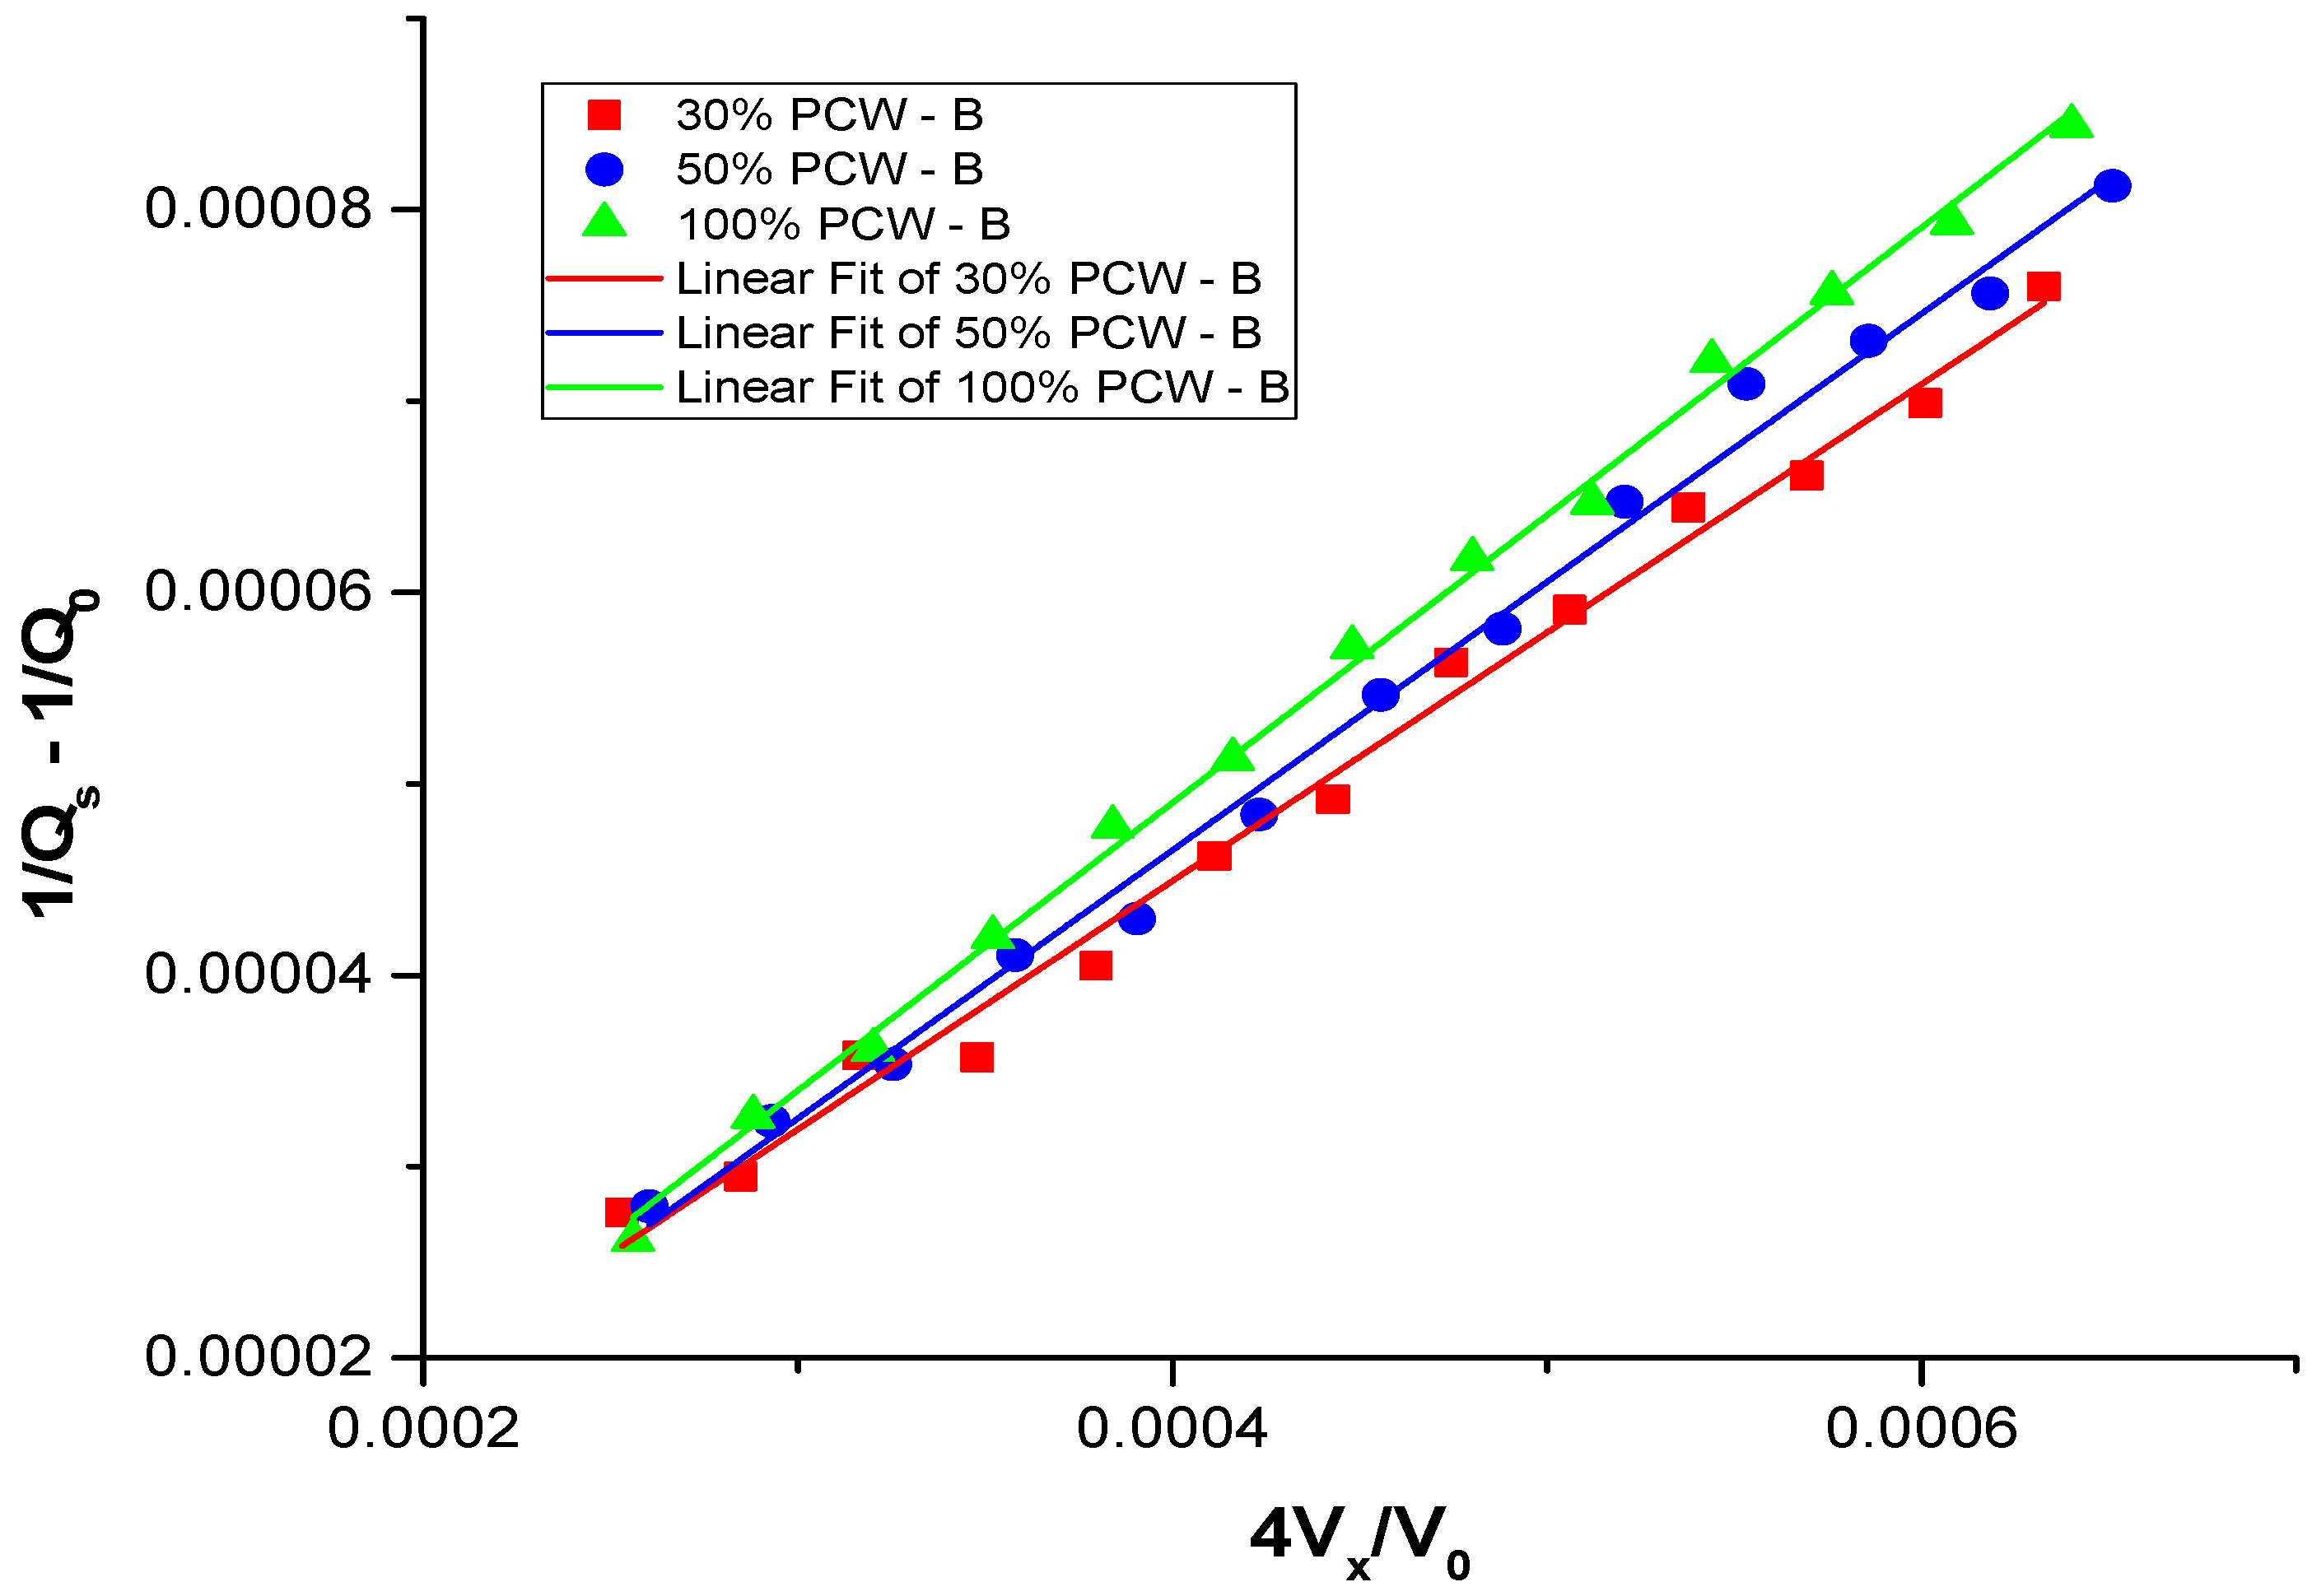
In these measurements, the cavity with V0 = 29.49672 cm3, was operated at the resonant frequency of 7.4355 GHz, which corresponds to the TE103 resonant mode. The specimen is inserted into the cavity through a slot in the center of the cavity, where the TE103 electric field attains a maximum value. The specimen insertion and the corresponding volume of the material in the cavity (Vs) are controlled by a stage. During the measurements, the specimen is partially inserted in small steps, ΔVs, while the magnitude of the scattering parameter, S21, is recorded. The measured frequency span is typically 2wfs, recorded with a resolution of ± 50 kHz. The dynamic range of the noise level in the |S21| magnitude is typically below −65 dB. The dielectric constant, εr′, is determined with the combined uncertainty of ± 2 × 10⁻³ and in the dielectric loss, εr″, the combined uncertainty is within ± 5 × 10 −4. The measurement data for Equation 1b are shown in Figure 5, where the slope of the plots equals to εr″. From the slope of the plots in Figure 5 we find εr″ ± 1 × 10⁻³.
5. Conclusions
We successfully applied resonant cavity dielectric spectroscopy to discriminate between the amount of post-consumer waste (PCW) recycled fiber across various manufacturers of office copier papers. In agreement with the literature, the dielectric loss increased with the increased recrystallization of the cellulosic fibers as a result of the recycling process in the paper samples studied. The dielectric behavior is influenced by manufacturing additives such as optical brighteners and also contaminants, like toner particles and multivalent cations. There is the potential to utilize this technique to evaluate the suitability of recycled pulps in the manufacture of food-grade paper products, which almost exclusively rely on virgin pulps out of an abundance of caution to avoid potential contamination, and recycled tissue grades. Further work is necessary to fully resolve all the contributions to the dielectric loss, such as those from recycled fiber contaminants and papermaking additives, to make the technique more manufacturing-friendly.
Author Contributions
Conceptualization, M.K., J.O. and Y.S.O.; methodology, J.O. and M.K.; software, J.O.; validation, M.K. and Y.S.O.; formal analysis, M.K. and Y.O.; investigation, M.K.; resources, Y.O., J.O., M.T.P. and D.L.P.; writing—original draft preparation, M.K. and Y.O.; writing—review and editing, M.K., Y.O., J.O., M.T.P. and D.L.P.; supervision, Y.O., J.O., M.T.P. and D.L.P.; project administration, D.P.
Funding
This research received no external funding.
Acknowledgments
We gratefully acknowledge United States Government Publishing Office for supplying paper samples, and the National Institute of Standards and Technology for technical support.
Conflicts of Interest
The authors declare no conflict of interest.
References
- Kombolias, M.; Obrzut, J.; Montgomery, K.; Postek, M.; Poster, D.; Obeng, Y. Dielectric Spectroscopic Studies of Biological Material Evolution and Application to Paper. Tappi. J. 2018, 17, 501–505. [Google Scholar] [CrossRef] [PubMed]
- Yu, X.; Minor, J.L.; Atalla, R.H. Mechanism of Action of Simons’ Stain. Tappi J. 1995, 78, 175–180. [Google Scholar]
- Sahin, H.T.; Arslan, M.B. A Study on Physical and Chemical Properties of Cellulose Paper Immersed in Various Solvent Mixtures. Int. J. Mol. Sci. 2008, 9, 78–88. [Google Scholar] [CrossRef] [PubMed]
- Recycled Paper Research at the Library of Congress; 2014 February 1; 2019. Available online: https://www.loc.gov/preservation/scientists/projects/rec_paper%20report_2015.pdf (accessed on 1 August 2019).
- Der Blaue Engel Environmental Label Jury. 6 January 2018. Available online: https://www.blauer-engel.de/en (accessed on 1 August 2019).
- Green Seal Certification. 6 January 2018. Available online: http://www.greenseal.org/GreenBusiness/Certification.aspx (accessed on 1 August 2019).
- Rantanen, W.J. Identificaiton of Secondary Fiber in Paper. Prog. Pap. Recycl. 1994, 3, 77–79. [Google Scholar]
- Recycled Content. 1 May 2017. Available online: https://ipstesting.com/our-services/fiber-science/recycled-content/ (accessed on 1 August 2019).
- Ververis, C.; Georghiou, K.; Christodoulakis, N.; Santas, P.; Santas, R. Fiber Dimensions, Lignin and Cellulose Content of Various Plant Materials and Their Suitability for Paper Production. Ind. Crops. Prod. 2004, 19, 245–254. [Google Scholar] [CrossRef]
- Wang, Y.; Lian, J.; Wan, J.; Ma, Y.; Zhang, Y. A Supramolecular Structure Insight for Conversion Property of Cellulose in Hot Compressed Water: Polymorphs and Hydrogen Bonds Changes. Carbohydr. Polym. 2015, 133, 94–103. [Google Scholar] [CrossRef]
- Einfeldt, J.; Kwasniewski, A. Characterization of Different Types of Cellulose by Dielectric Spectroscopy. Cellulose 2002, 9, 225–238. [Google Scholar] [CrossRef]
- Steeman, P.A.M.; Van, T.J. Dielectric Properties of Inhomogeneous Media. In Broadband Dielectric Spectroscopy; Kremer, F., Schonhals, A., Eds.; Springer: Berlin/Heidelberg, Germany, 2003; pp. 495–522. [Google Scholar]
- Saukkonen, E.; Lyytikainen, K.; Backfolk, K.; Maldzius, R.; Sidaravicius, J.; Lozovski, T.; Poskus, A. Effect of the carbohydrate composition of bleached kraft pulp on the dielectric and electrical properties of paper. Cellulose 2015, 22, 1003–1017. [Google Scholar] [CrossRef]
- Orloff, N.D.; Obrzut, J.; Long, C.J.; Lam, T.; Kabos, P.; Novotny, D.R.; Booth, J.C.; Liddle, J.A. Dielectric Characterization by Microwave Cavity Perturbation Corrected for Nonuniform Fields. IEEE Trans. Microw. Theory Tech. 2014, 62, 2149–2159. [Google Scholar] [CrossRef]
- Obrzut, J.; Emiroglu, C.; Kirilov, O.; Yang, Y.; Elmquist, R.E. Surface Conductance of Graphene from Non-Contact Resonant Cavity. Measurement 2016, 87, 146–151. [Google Scholar] [CrossRef]
- IEC. Nanomanufacturing—Key Control Characteristics—Part 6–4: Graphene—Surface Conductance Measurement Using Resonant Cavity; International Electrotechnical Commission: Geneva, Switzerland, 2016. [Google Scholar]
- Wu, B.; Taylor, C.M.; Knappe, D.R.U.; Nanny, M.A.; Barlaz, M.A. Factors Controlling Alkylbenzene Sorption to Municipal Solid Waste. Environ. Sci. Technol. 2001, 35, 4569–4576. [Google Scholar] [CrossRef] [PubMed]
- Bouchard, J.; Douek, M. The Effects of Recycling on the Chemical-Properties of Pulps. J. Pulp Pap. Sci. 1994, 20, J131–J136. [Google Scholar]
- Zhuromskyy, O. Applicability of Effective Medium Approximations to Modelling of Mesocrystal Optical Properties. Crystals 2017, 7, 1. [Google Scholar] [CrossRef]
- Lee, J.Y.K.; Chul, H.; Park, J.H.; Kim, E.H.; Sung, Y.J.; Heo, Y.J.; Kim, Y.H.; Kim, Y.O. Analysis of the Behavior of Fluorescent Whitening Agents in Recycling Process of White Ledger. J. Kor. TAPPI 2015, 47, 52–58. [Google Scholar]
- Kim, C.H.; Lee, J.Y. Effect of polyvinyl alcohol on fluorescent whitening agent in surface sizing. Appita J. 2012, 65, 51–56. [Google Scholar]
- Shadkami, F.; Helleur, R.; Sithole, B.B. The Analysis of Optical Brightening Agents in Paper Samples Using Liquid Chromatography with High-Resolution Mass Spectrometry. J. Wood Chem. Technol. 2011, 31, 42–57. [Google Scholar] [CrossRef]
- Kobayashi, H.; Urakawa, O.; Kaneko, F.; Inoue, T. Dynamics of polar aromatic molecules confined in a nanocavity of δ-phase of syndiotactic polystyrene as studied by dielectric spectroscopy. Chem. Phys. 2016, 479, 122–128. [Google Scholar] [CrossRef]
- Obama, B.H. Executive Order 13693—Planning for Federal Sustainability in the Next Decade; Columbia Law School: New York, NY, USA, 2015. [Google Scholar]
- Trejos, T.; Flores, A.; Almirall, J.R. Micro-spectrochemical Analysis of Document Paper and Gel Inks by Laser Ablation Inductively Coupled Plasma Mass Spectrometry and Laser Induced Breakdown Spectroscopy. Spectrochim. Acta Part B 2010, 65, 884–895. [Google Scholar] [CrossRef]
- Jones, K.; Benson, S.; Roux, C. The forensic analysis of office paper using carbon isotope ratio mass spectrometry - Part 1: Understanding the background population and homogeneity of paper for the comparison and discrimination of samples. Forensic Sci. Int. 2013, 231, 354–363. [Google Scholar] [CrossRef]
- Jones, K.; Benson, S.; Roux, C. The forensic analysis of office paper using oxygen isotope ratio mass spectrometry. Part 1: Understanding the background population and homogeneity of paper for the comparison and discrimination of samples. Forensic Sci. Int. 2016, 262, 97–107. [Google Scholar] [CrossRef]
- Ponni, R.; Vuorinen, T.; Kontturi, E. Proposed Nano-Scale Coalescence of Cellulose in Chemical Pulp Fibers during Technical Treatments. Bioresources 2012, 7, 6077–6108. [Google Scholar]
- Driscoll, J.L. The Dielectric Properties of Paper and Board and Moisture Profile Correction at Radio Frequency. Pap. Technol. Ind. 1976, 17, 71–75. [Google Scholar]
- Dexter, M.; Rickman, K.; Pan, C.; Chang, C.-H.; Malhotra, R. Intense Pulsed Light Unprinting for Reducing Life-Cycle Stages in Recycling of Coated Printing Paper. J. Clean. Prod. 2019, 232, 274–284. [Google Scholar] [CrossRef]
- Tsatsis, D.E.; Valta, K.A.; Vlyssides, A.G.; Economides, D.G. Assessment of the Impact of Toner Composition, Printing Processes and Pulping Conditions on the Deinking of Office Waste Paper. J. Environ. Chem. Eng. 2019, 7, 103258. [Google Scholar] [CrossRef]
Figure 1.
Comparison of the dielectric loss of office copier papers manufactured with varying concentrations of post-consumer waste (PCW) recycled fiber content to that of virgin paper (with 0% PCW) produced by manufacturer B. The error bars represent the standard deviation of the dielectric loss measurements of at least six samples.

Figure 2.
Comparison of the measured with the calculated expected dielectric loss of PCW recycled and virgin office copier papers produced by manufacturer B. The expected dielectric loss is based on a fraction-weighted linear combination of the properties of 100% PCW recycled and virgin (0% PCW) papers. The vertical error bars assume the same systematic errors as in the measured dielectric loss.

Figure 3.
Contour plot showing the relationship between advertised brightness, percent PCW recycled fiber, and the dielectric loss for all the papers (virgin and recycled) as received studied in this work.
Figure 3.
Contour plot showing the relationship between advertised brightness, percent PCW recycled fiber, and the dielectric loss for all the papers (virgin and recycled) as received studied in this work.

Figure 4.
Company-to-company variability in dielectric loss, a for various—percent PCW content in commercial white copier papers, due to manufacturing process and additives.
Figure 4.
Company-to-company variability in dielectric loss, a for various—percent PCW content in commercial white copier papers, due to manufacturing process and additives.

Figure 5.
Plots of Equation 1b for εr″ of three office papers of varying PCW recycled fiber content (30%, 50%, and 100%) produced by manufacturer B. Solid lines are linear fits through the data points.
Figure 5.
Plots of Equation 1b for εr″ of three office papers of varying PCW recycled fiber content (30%, 50%, and 100%) produced by manufacturer B. Solid lines are linear fits through the data points.

© 2019 by the authors. Licensee MDPI, Basel, Switzerland. This article is an open access article distributed under the terms and conditions of the Creative Commons Attribution (CC BY) license (http://creativecommons.org/licenses/by/4.0/).
Share and Cite
MDPI and ACS Style
Kombolias, M.; Obrzut, J.; Postek, M.T.; Poster, D.L.; Obeng, Y.S. Contactless Resonant Cavity Dielectric Spectroscopic Studies of Recycled Office Papers. Recycling 2019, 4, 43. https://0-doi-org.brum.beds.ac.uk/10.3390/recycling4040043
AMA Style
Kombolias M, Obrzut J, Postek MT, Poster DL, Obeng YS. Contactless Resonant Cavity Dielectric Spectroscopic Studies of Recycled Office Papers. Recycling. 2019; 4(4):43. https://0-doi-org.brum.beds.ac.uk/10.3390/recycling4040043
Chicago/Turabian StyleKombolias, Mary, Jan Obrzut, Michael T. Postek, Dianne L. Poster, and Yaw S. Obeng. 2019. "Contactless Resonant Cavity Dielectric Spectroscopic Studies of Recycled Office Papers" Recycling 4, no. 4: 43. https://0-doi-org.brum.beds.ac.uk/10.3390/recycling4040043