1. Introduction
Reusing and recycling discarded textiles are, in general, preferable waste management options to incineration and landfilling. In the environmental context, reusing products has been shown to be preferable to recycling textile materials [
1]. However, at some point in its lifecycle, a textile product will be worn out or get dirty so it is no longer suitable for reuse. In this case, recycling may offer the material a new lifecycle. To add value to the recycled material and to guarantee that it has adequate quality as an input material for the subsequent recycling processes, it is essential to be able to recognise and sort the item according to its material content [
2]. Manual sorting of textile waste based on the fibre material content listed on product labels is possible but slow and often unreliable, because the labels may have been removed, be worn out or have faulty information. According to a study by Circle Economy, up to 41% of labels on blended materials contain inaccurate information [
3]. There are methods available for the identification of textile materials, such as ISO standardised quantification methods based on different dissolution behaviour (ISO 1833-1, etc.), morphological differences detected by microscopy [
4], DNA recognition [
5] and differences in thermal behaviour detected by differential calorimetry, thermogravimethic analysis and gas chromatography [
6]. These are accurate, but require sample preparation and, as such, are too slow for automated recognition and sorting of textile materials needed for recycling. Therefore, to enhance the use of recycled material, there is a need for an economically viable and effective way to recognise and sort textile materials. In NIR spectrometry (NIRS), sample preparation is not required, and it is widely used in industry for a variety of operations. Additionally, NIRS has been used in textile identification, for example detection of cotton content in blend fabrics [
7], analysing material contents in cotton polyester blends [
8], identification of cashmere from other animal fibres [
9] and determining the contents of four different materials (wool, polyester, polyacrylonitrile, and nylon) at the same time [
10]. Hyperspectral near infrared imaging has also been used in identifying polyester content in blended textiles [
11].
Automated recognition and sorting lines provide a method for ensuring better quality of the fractions being recycled and thus enhance the availability of such recycled fractions with accurately known material content. The two best-known commercial or close to commercial automated recognition and sorting lines are FIBERSORT [
12] by Valvan in the Netherlands and SIPTex [
13] in Sweden which uses Tomra’s NIR technology. A requirement for mandatory EU-wide separate collection for textile waste by European Union starting from 2025 [
14] will no doubt accelerate a transition towards cost-effective textile sorting plants. However, to our knowledge, this is the first time that chemical structural modifications research of textiles has been carried out using NIRS at the automated sorting line.
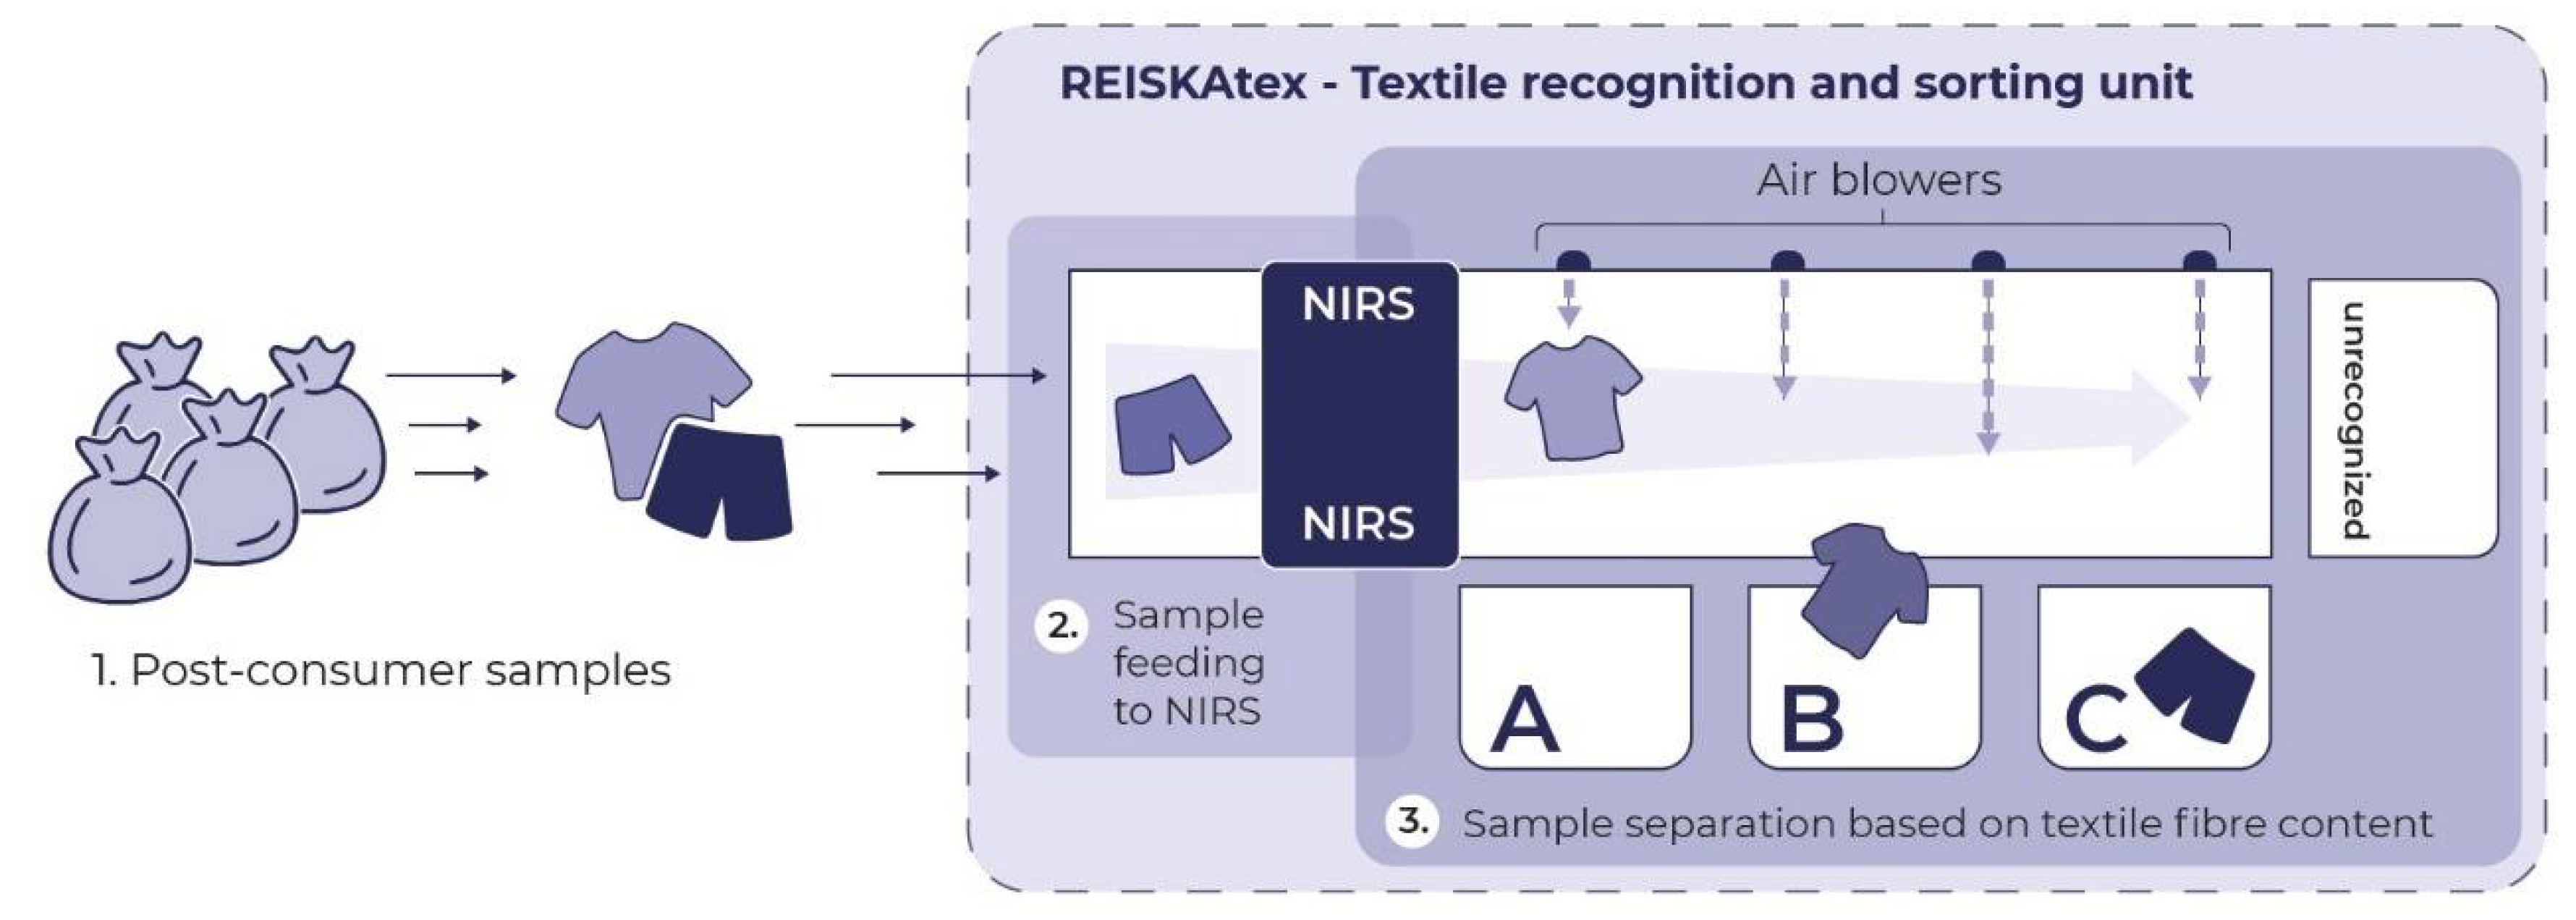
LAB University of Applied Sciences has developed a method and equipment for the recognition of textile fibre materials that can be used for research and development purposes for studying qualitative and quantitative textile fibre recognition. The recognition and sorting lab pilot (REISKAtex) identifies unknown textile fibres by comparing their near-infrared (NIR) spectrum, which has been mathematically processed (normalisation and second derivative), to a validated material spectral library and then sorting the identified samples using automated air blowers [
15]. A schematic picture of the lab pilot is depicted in
Scheme 1.
While NIRS offers benefits to material sorting, it has some limitations. For example, because the electromagnetic radiation of the used wavelengths does not penetrate the sample effectively, thick layers of other materials on the sample will affect recognition. The aim of this work was to gather understanding of NIR technology in the recognition of textile materials and especially identify reasons for non-matching recognition. The work was carried out by using over 250 fabrics, both pre- and pre-consumer samples, which were sorted using the lab pilot. Majority of the samples (73%) were recognised correctly. The identified properties of fabrics that led non-matching recognition, such as coating, finishing, thickness and material blends are discussed further. Additionally, ageing was found to cause such chemical changes especially in the spectra of cotton that hampered the recognition.
2. Results and Discussion
Using the lab pilot with its material recognition spectral libraries, a sample set of 253 pieces of fabrics was tested. The samples were measured at room temperature as they were, i.e., no washing or other pre-treatments were performed. It can be assumed that such conditions apply in a recycling centre where large quantities of discarded textiles will be sorted. In this set of samples, 74 pieces were collected from post-consumer and 179 pieces from pre-consumer textiles. The identity of the sample materials was confirmed and cross-checked twice, so that a material recognition method could be set up reliably. For reference, the fabric samples were analysed with a pre-commercial recognition line based on an NIR sensor, SIPTex [
8]. The samples were considered to be correctly identified if both our lab pilot and SIPTex lines agreed on the recognition. The samples that had deviating recognition result, i.e., material label and the sorting systems identified the samples differently, were studied further by optical microscope, and Fourier transform infra red (FT-IR) to confirm the material composition and to understand the reason for unrecognition.
The samples were recognised and categorised according to six libraries, aka Classes: cotton CO) 100%, CO ≥ 90% and CO ≥ 60%; polyester (PES) 100%, PES ≥ 90%; and viscose (CV) 100%. Fabrics with coatings and functional finishes were separated from the sample set and their results were studied separately later because they gave irregular results, for example, the front and back sides gave different results. The rest of the fabric samples were analysed, and 73% of the studied samples were correctly recognised to the library classes or to an Others class. For example, fabric consisting of 80% cotton and 20% PES was correctly recognised when it did not pass to CO 100% and CO ≥ 90% classes, but was passed to CO ≥ 60%. Of the correct recognitions, 53% were for monomaterial samples and the rest were different blends with a maximum of either 90% or 60% of cotton blended with other materials; and a maximum of 90% of polyester blended with other materials. The fabric samples that did not belong to any of the classes, for example, samples containing 80% polyester and 20% viscose (PES/CV 80/20), were identified as “Others”. All the samples that were made from such material blends, and which did not fit a recognition class (29 pieces), were correctly sorted into the Others class.
Samples which did not yield matching recognition results were designated into two categories: (1) False Positive (FP)/Category 1 in which the sample was misrecognised as too pure, e.g., 90% PES recognised as 100% PES, and (2) False Negative (FN)/Category 2 in which the sample was not recognised as pure enough, e.g., 100% PES recognised as ≥90% PES, see
Table 1. The percentage accuracy is the ratio of the correctly identified samples. False Positives (FP) were mainly caused by a small percentage of other material, for example, samples consisting 98% polyester and 2% elastane PES/EL 98/2) and samples consisting 95% cotton and 5% elastane (CO/EL 95/5) fabrics were recognised as monomaterials. False Negatives were mainly due to the structural characteristics of the fabrics, such as loose knits and thin fabrics, and changes in the chemical structure of polymers, such as ageing and mercerising of cotton. These are discussed in more detail in the following chapters.
The accuracy gets higher as the tolerance of the class is increased. This was clearly seen in the cotton and polyester samples in which there was more than one class. This indicates that the number of rejects in the recognition process can be controlled by adjusting the tolerance of the recognition class. In practice, this means that if a next user of the sorted material can tolerate some impurities then the yield can be improved by adjusting the tolerance to accept small percentages of blends. Further tests with our lab pilot have shown that the best throughput for sorted textiles was achieved when impurities of 1–5% were accepted for 100% recognition. This means that yields of acquired textile fibre streams were high even though some small impurities were allowed.
With the limitations of NIRS, samples with large prints, thin and loosely knitted fabrics, lace and coated fabrics proved difficult to recognise. Because fabrics with large prints are not usually wanted in the material flow, this was a positive result. In automated systems, folding samples reliably during automatic sorting may not be easy. This may result in thin samples being either misrecognised or rejected and discarded because the NIRS will penetrate through the fabric and measure the spectrum of the sorting line’s conveyer belt instead. To overcome this, loose and/or thin fabrics can be manually folded sufficiently to minimise belt exposure.
The classes in this study were not selected based on the suitability of the material for certain recycling process. The classes have been chosen to give an indication of how easily fabrics from blended materials can be recognised. Cotton, polyester and their blends are the most used materials in clothing. Viscose was selected to study if NIR was able to recognise different cellulose types.
All of the studied material fractions, including the Others class, are suitable for mechanical recycling. However, a user of the mechanically recycled fibres may have some material specifications that the sorting process should fulfill. Recycling processes for the textiles are evolving at the moment. For the dissolution methods developed for cotton, the purity of cotton fractions needs to be over 95%. However there are technologies in the development stage that can be used to separate cotton from polyester and for this sort of processes the share of the materials are not that important, but maybe the processes are better suited for fabrics closer to 50%/50% CO/PES. The depolymerisation processes require high-purity materials, but as the filtration steps are developing, different fibre materials can be separated more easily compared to other additives in materials such as dyes. Thus, the sorting line needs to have classes for blended materials as well in order to face evolving needs for recycling.
2.1. Effects of Coatings and Finishes
Coated textiles are generally not easy to recycle using the same process as for uncoated textiles. In order to prevent coated fabrics ending up in the same fraction than fabrics to be mechanically opened, automated sorting should identify them regardless of their base material. The coated fabrics in this study were polyester fabrics coated with polyurethane (29 samples). The amount of coating, if listed, varied between 13% and 25% and did not have an effect on the recognition. The samples were fed into the sorting line manually twice so that both sides were identified. Our lab pilot identified 61% in the reject category regardless of the side being measured. Of the samples which were not rejected, the side without coating was identified in the class ≥90% PES and the coated side in the reject category. In such cases, the side facing the sensor will determine the result of the recognition.
In this study, 28 samples of 100% cotton fabrics had functional finishing, such as anti-wrinkle, crease resistant and waterproof finishing treatments. The fabrics were pre-consumer, i.e., never washed. The fabric samples were fed twice through the recognition line so that both sides were measured. The recognition line was able to classify the material as cotton, but only two samples were identified as 100% cotton. Other fabric samples were identified as being in other cotton classes, and one side of the fabric gave a different result from the reverse side (e.g., one side was 100% CO and the other side was 90% CO). For other cotton samples without finishing, recognition usually gave the same result for both sides of the fabric. The fabric samples with finishings behaved more like the coated ones, and gave irregular results depending on the measurement side.
2.2. Effect of Blends/Elastane
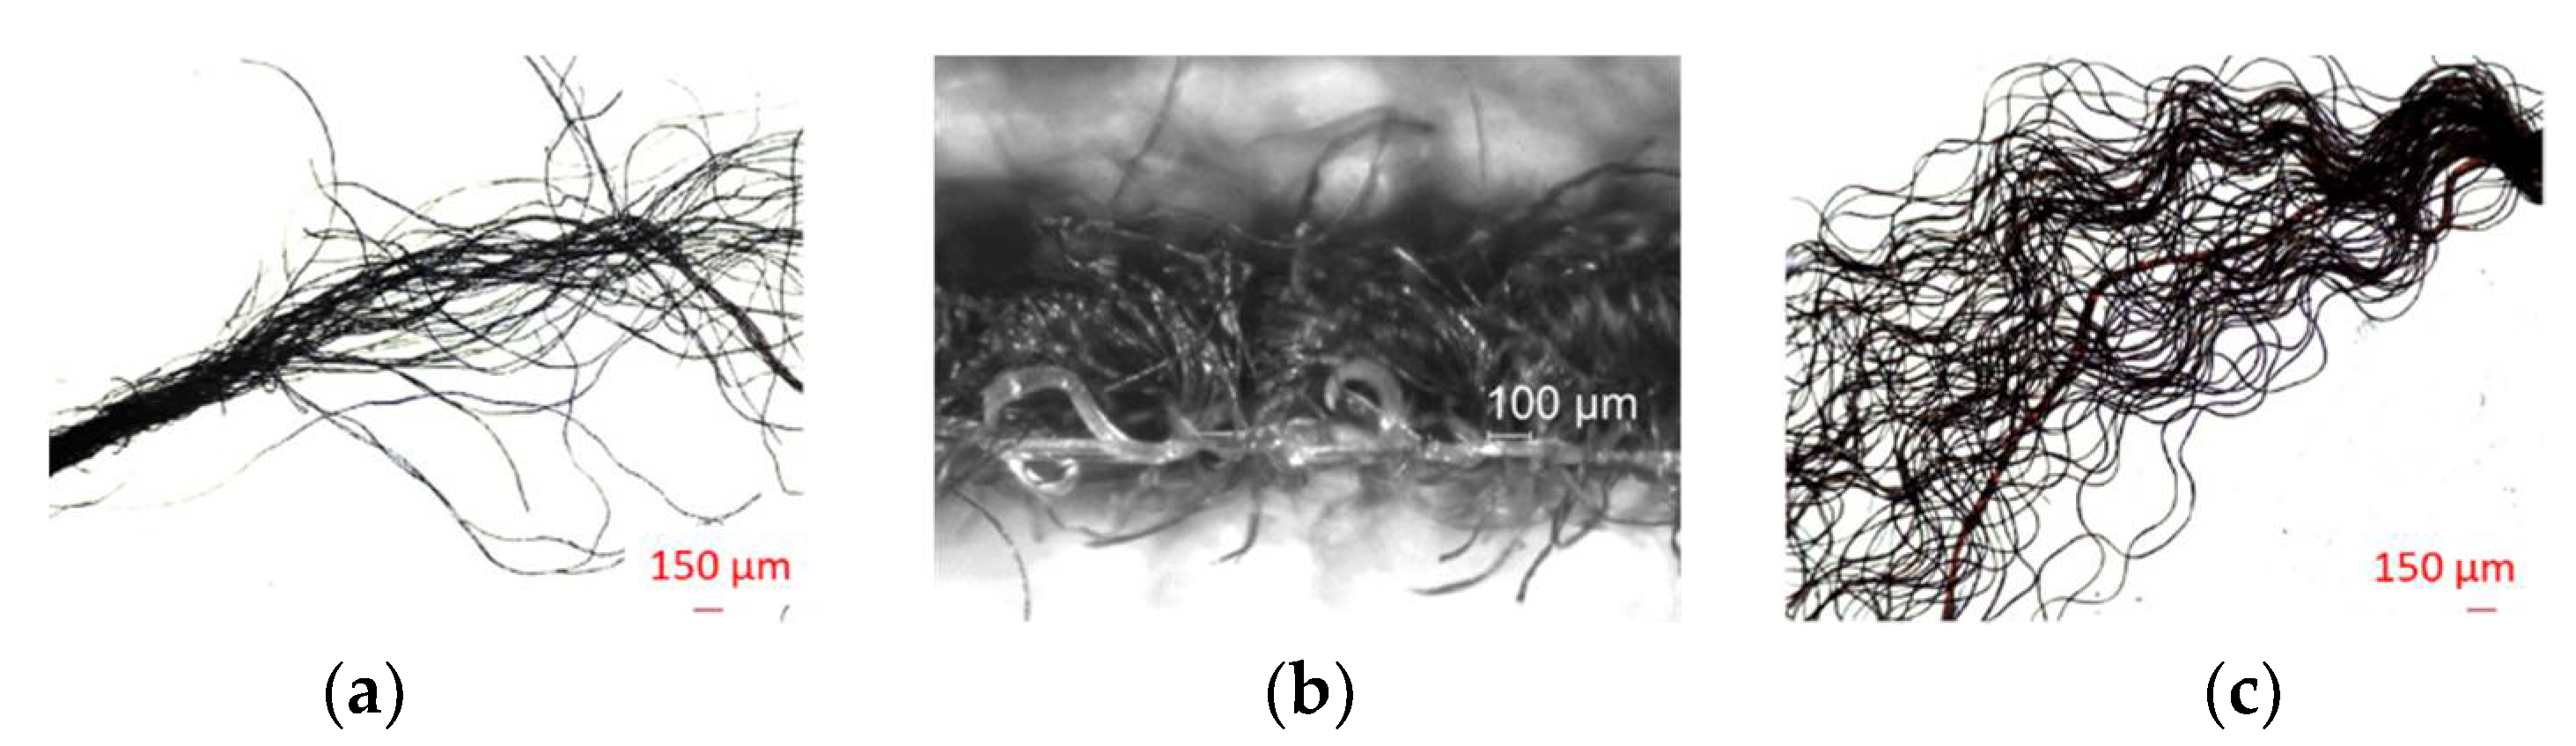
The presence of a low percentage of blended materials, such as elastane, may cause misrecognition. Low blended content generally becomes harder to identify as the material-specific spectrum of the low content material overlaps with the main material spectrum. In addition, most low-content blends are produced in a way where the blended material is partially hidden within the yarn. Most prominently, elastane is commonly incorporated within the core of the textile fibres (examples shown in
Figure 1) and so cannot be detected in low amounts with NIRS. A study with six elastane-containing cotton samples indicated that elastane content, rather than the location of it, would determine whether elastane would affect recognition, see
Table 2. A similar result was also obtained with other material blends where the amount of the second material was low, for example, fabric with 99% PES and 1% CV was identified as 100% PES.
While blended materials with low percentage content are difficult to recognise, decreasing the allowed variance in the algorithm increases the purity of the yielded monomaterials. The purer yields are the result of the system discarding samples with impurities rather than recognising and categorising them. Therefore, our lab pilot could theoretically be used to filter pure, 100% homogenous materials out of the heterogenous feed. As previously stated, the capabilities of NIR do not necessarily allow 100% pure fractions to be collected from a heterogenous sample set, but further studies with random sampling have indicated up to 99.2% accuracy when sampling post-consumer cotton. Therefore, our lab pilot could alternatively be used to gain greater yields of slightly impure (99–95%) heterogenous materials.
The recognition algorithm was set to allow <5% impurities within 100% categories, increasing the yields of the sorted materials. In larger-scale operations this should be permissible, as this kind of composition should not affect further processes much; a 5% source material impurity does not directly translate to an end-fraction with 5% impurities. Moreover, the purity of sorted material can be increased after recognition by feeding more monomaterial into it, either virgin or recycled.
2.3. Effects of Structures
Whether the samples are knitted or woven does not have an effect on recognition with monomaterial samples, as the texture has no effect on the chemometric analysis. However, very loosely knitted thick fabrics were not recognised because the NIR sensor acquired chemical data partially through the sample from the conveyor belt. The texture may have an effect depending on which material is facing the spectrometer, and this can therefore cause misrecognition with fabrics which have different materials on different sides or in the middle layers. Most of these difficulties are due to the fact that the NIR beam cannot penetrate the sample surface layers. The thicker the layer, the harder core textile material identification becomes. Folding dual layered samples so that both sides faced the NIR sensor caused the recognition algorithm to find both materials, but the material composition was then categorised based on how much of each layer was within the observed area; i.e., 33%/67% composition if 33% of second surface covers observed area. It can be concluded that, to date, there is no reliable way of categorising multi-layered samples with our lab pilot.
2.4. Effects of Ageing on Cotton Fabrics
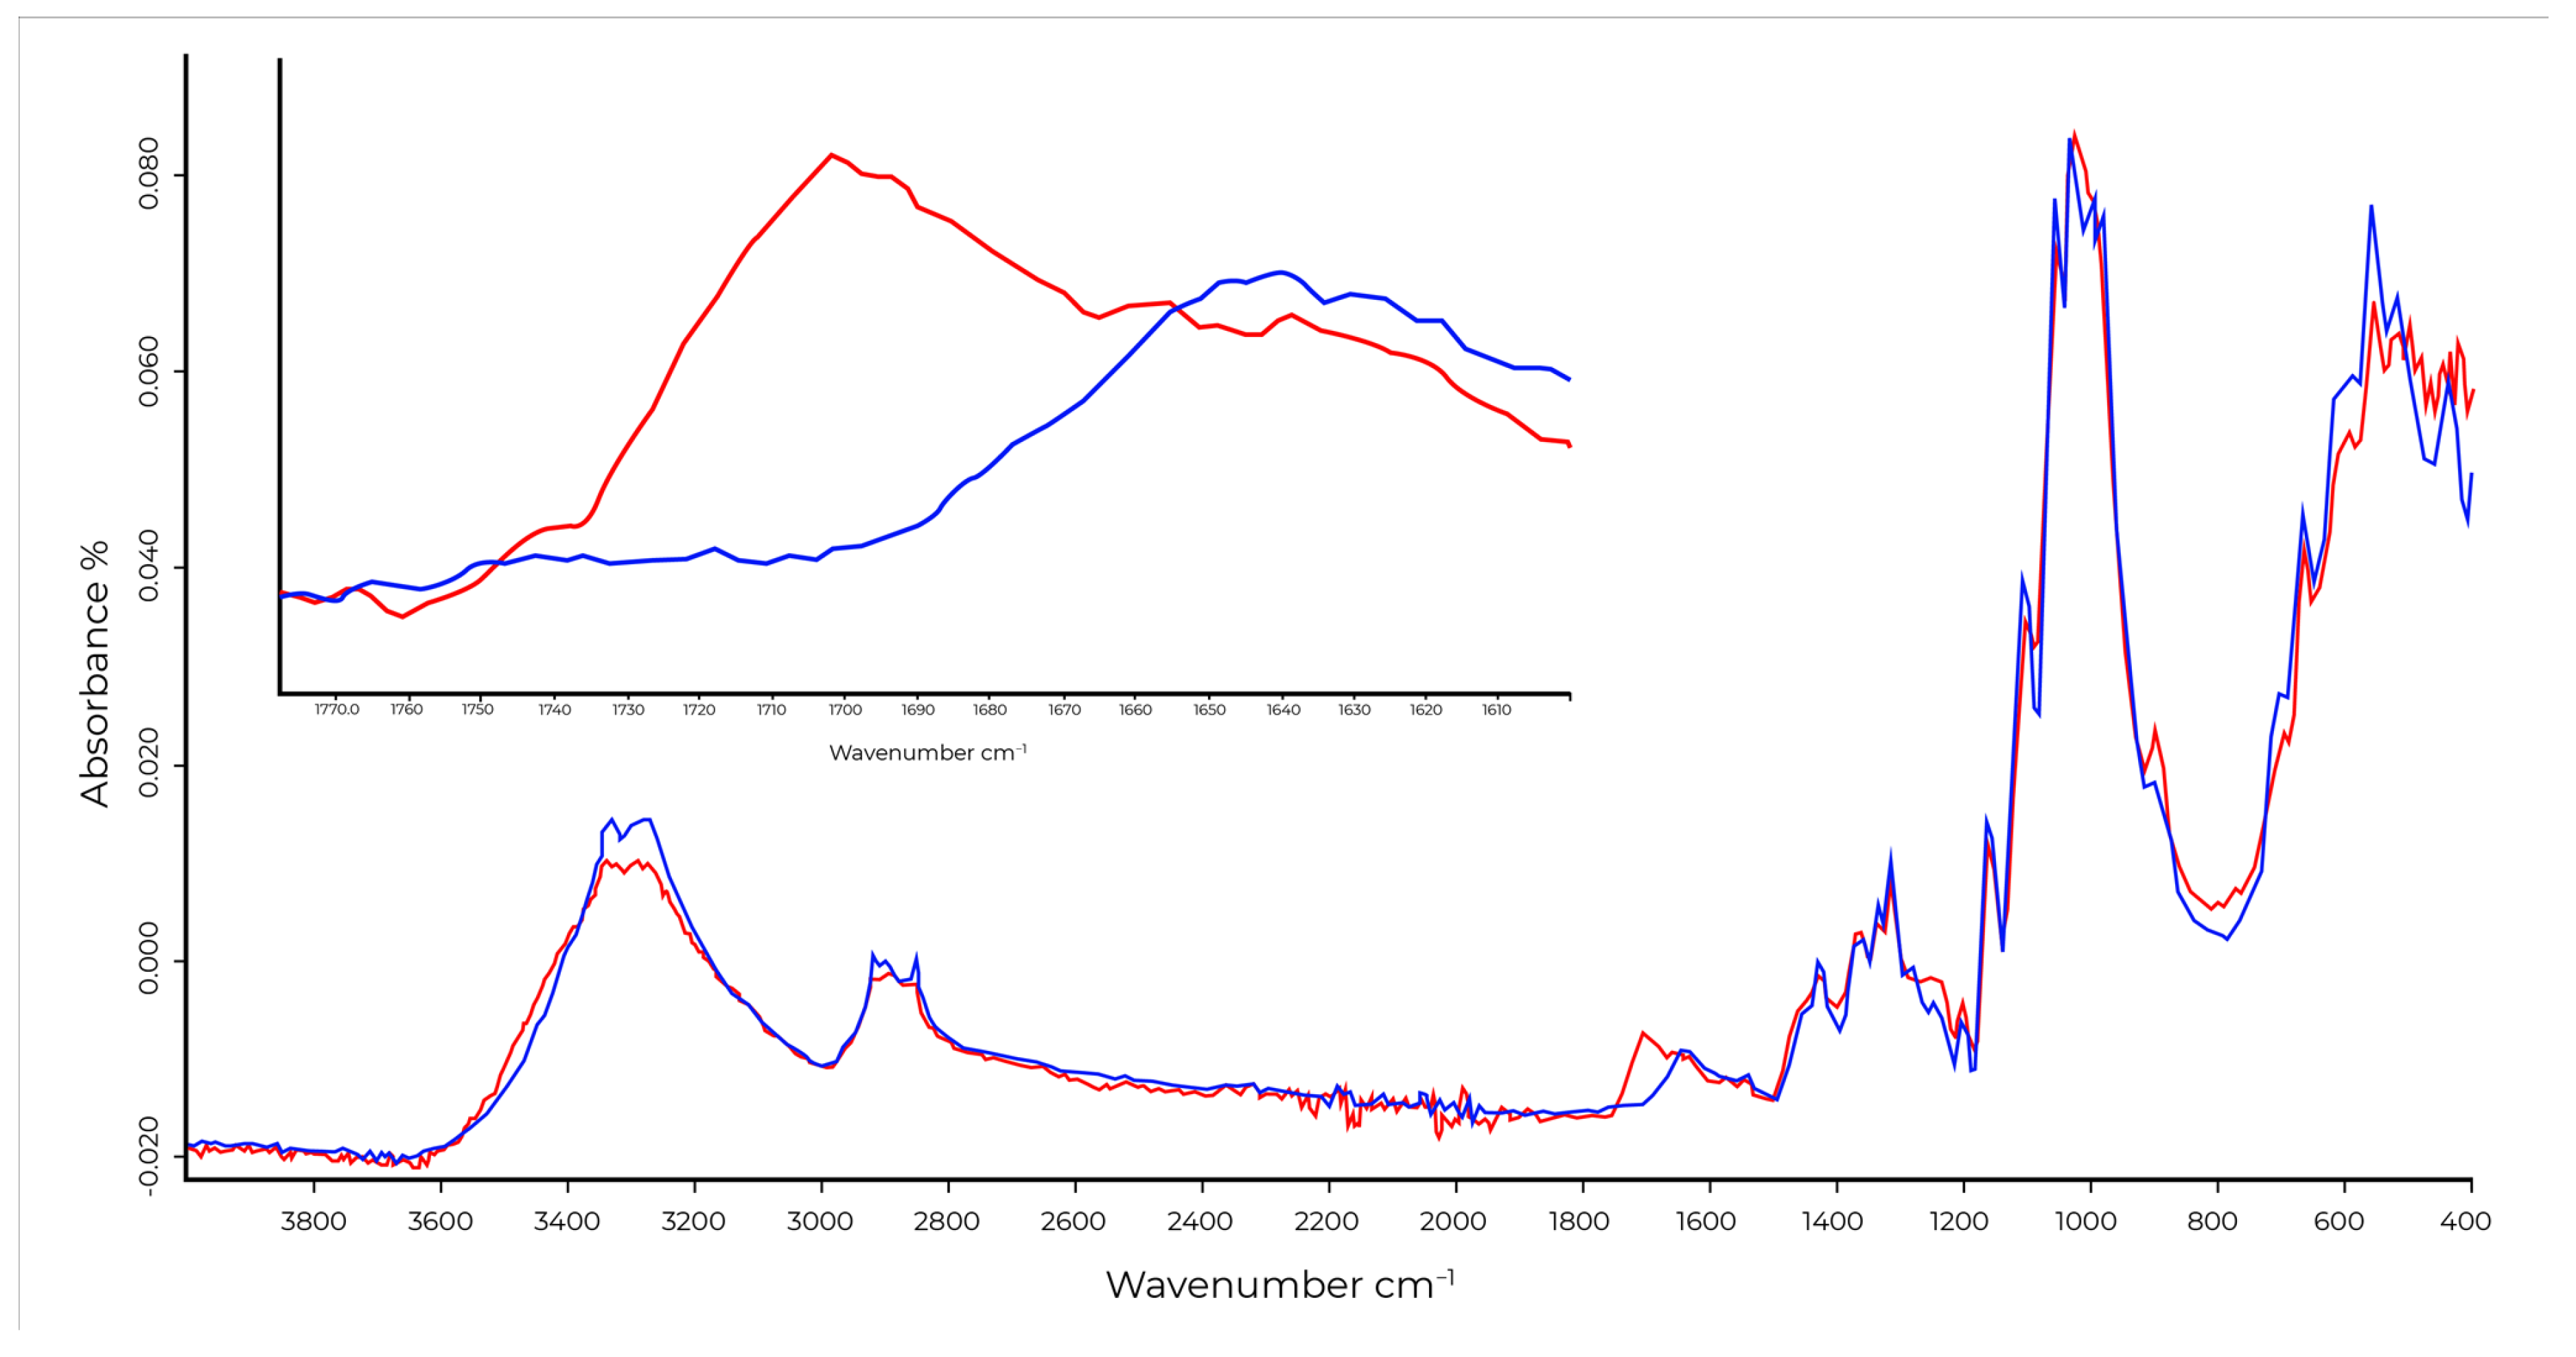
In the 100% cotton sample group, there were fabrics which gave False Negative results even though they did not any have special structural features. The samples were first studied using an optical microscope and as no other fibres than cotton fibres were visible under the microscope, they were studied further by FTIR-ATR. Interestingly, the unrecognised fabrics were all post-consumer fabrics. FTIR spectra showed them to be cotton, but there were spectral changes in the wavenumber range 1700–1730 cm
−1, see
Figure 2. where a pre-consumer cotton spectrum was compared to a post-consumer cotton spectrum.
It has been observed that during the oxidative ageing of cellulose, the degradation of the cellulose backbone leads to an increase in dialdehyde cellulose, which in turn is shown as a growing carbonyl peak at wavenumbers between 1700 and 1730 cm
−1 [
16,
17,
18]. This also seemed to be a plausible explanation in our case, because the fabric samples with these spectral changes were post-consumer samples and it is likely that they have been exposed to ageing. Oxidation of cellulose causes formation of dialdehyde, visible in spectral region from 1700–1730 cm
−1 [
16].
Our lab pilot identified aged cotton samples to CO ≥ 90% class, not to 100% class. Further investigation of the aged cotton samples with an optical microscope confirmed that there were only cotton fibres in the sample. With the help of FTIR, dialdehyde fingerprint was detected. As aged cotton samples was not passed to CO 100% class with our lab pilot, this suggested that it may be able to find similar markers even though the wavelength areas of NIR and FTIR are different, 1100–1650 nm and 2500, respectively. However, more research is needed to find out how the effects of ageing could be recognised with our lab pilot.
2.5. Effects of Mercerisation on Cotton Fabrics
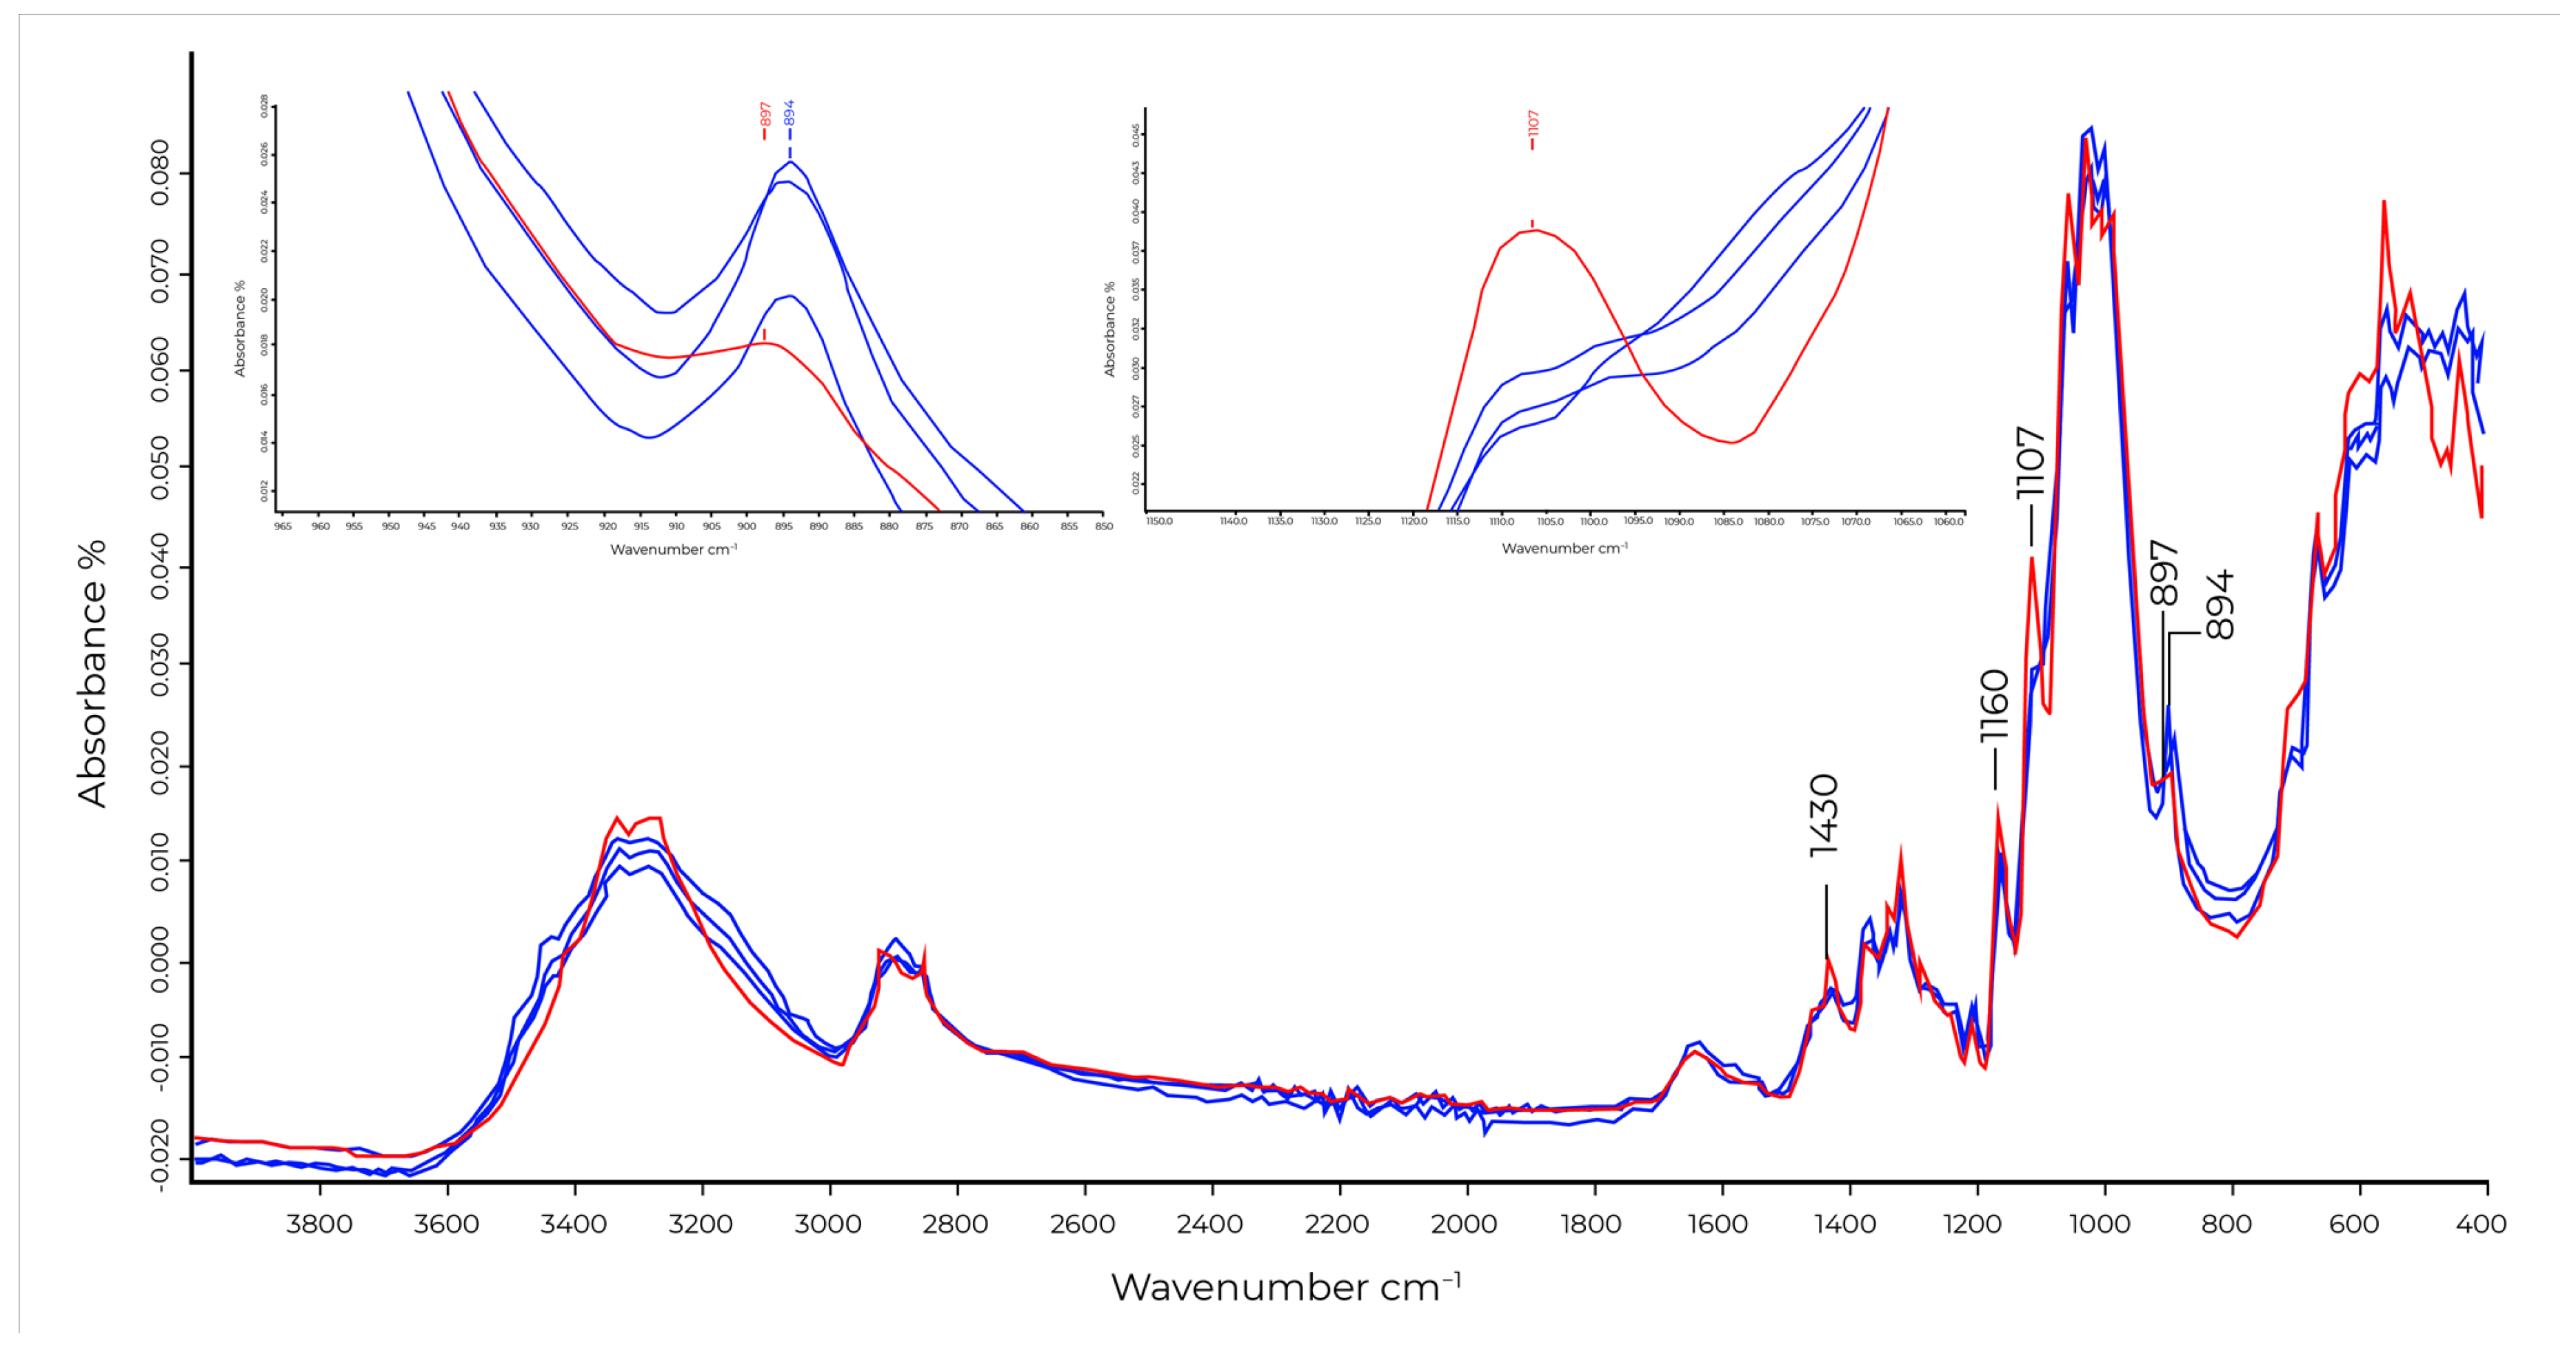
When studying the unrecognised fabrics in the 100% cotton sample group with an optical microscope, a few samples were confirmed as cotton, but some also included smooth fibre segments without the characteristic convolutions of cotton. Further studies with FTIR confirmed that the samples either contained viscose fibres or, more likely, the surface of the fabric had been mercerised. The FTIR spectra of the studied fabrics and reference cotton are shown in
Figure 3.
Mercerisation of cotton partially changes the crystal structure of cotton from cellulose I to cellulose II. Notable spectral changes due to this are known to occur at 1430, 1160, 1111 and 897 cm
−1 [
18,
19,
20], resulting in the cotton FTIR spectrum resembling that of viscose. In our case, the spectra of reference cotton and studied samples had clear differences (cutting and shifting of peaks at 1108 and 897 cm
−1), but certain similarities (clear peaks at 1160 and 1430 cm
−1), as well. Mercerisation cut the peak at 1107 cm
−1 from the mercerised samples, but it was still present in the reference cotton (
Figure 3) and shifted the β-glucosidic linkage peak from 897 cm
−1 (cotton sample) to 894 cm
−1 (mercerised samples) (
Figure 3). However, the broad O–H stretching bands at 3600–3100 cm
−1 and C–H stretching band at 2900 cm
−1 of the mercerised fabrics resembled cotton more, and the peaks at 1430 and 1160 cm
−1 of mercerised cotton samples were identified as CH
2 scissoring of cotton and anti-symmetrical bridge C–O–C stretching of cotton, respectively. These findings suggested that the mercerised samples still had partially crystal structure of cellulose I confirming that they were cotton. Additionally, this indicates that the mercerisation had only caused partial conversion of crystal structure from cellulose I to cellulose II.
2.6. Recognition of Polyester Samples
In the polyester sample group, the accuracy of recognition was at the same level as in the cotton group, despite the fact that the chemical structure of polyester and thus its spectral characteristics can have more variations than cotton. Polyester fibre is defined as fibres that are formed from linear chain macromolecules containing at least 85% esters of a diol and terephthalic acid [
21]. Most common polyester used in textile fibres is polyethylene terephthalate (PET), but polyester fibres can also be made from, for example, polybutylene terephthalate (PBT) or polytrimethylene terephthalate (PTT). The difference of the molecular structures between PET, PBT and PTT is the number of the CH
2 groups in the polymer backbone. It is possible to distinguish PET, PBT and PPT using FTIR [
22]. In this study, a spectral library for recognising polyester has been built using different polyester samples in general, i.e., no special attention was paid to distinguish PET, PBT and PTT. Therefore, the spectral library consists of different polyester types. Their NIR spectra have been chemometrically manipulated to form a class PES consisting a combination of different polyesters’ spectra. No obvious differences in NIR spectra were observed when making the spectral library of polyester. With textiles, unlike with plastics, it is common to label different polyester types to one type of textile fibre. In future, it may be beneficial to separate different polyesters as more precise recycling methods require more precise information of the feedstock. This is a topic of further study.
It is known that degradation of polyester, induced for example by water, UV light and alkaline conditions at elevated temperatures, changes the spectral characteristics of fibre-grade PET pellets and PET films [
23]. On the other hand, alkaline hydrolysis can be used to modify the surface of polyester fabrics to improve their moisture absorption [
24]. By definition, polyester contains at least 85% (by weight) esters of diol and terephtalic acid. This means that the pre-consumer polyester samples in our study may have some spectral characteristics coming from maximum 15 wt% unknown chemical compounds, which made them difficult to recognise, but the ageing and treatment history of post-consumer samples may result in even broader spectral changes which cause misrecognition. All of these known treatments and features could explain why our accuracy for PES100% Class was 76%, and 88% for PES90% Class. As a conclusion, polyesters as one type of textile fibre is actually a mixture of various chemical compounds. More research is needed to understand how important it is to distinguish different polyester types in order to obtain sufficient quality feedstock for recyclers of different needs.
2.7. Effect of Colours
Depending on the wavelength range of a used NIR equipment, black and dark colours may interfere with the measurement. Most textiles contain such colourants that do not cause issues with black and dark materials. This is in contrast with black plastic materials which cause issues in NIR identification. With plastics the issue rises from carbon black which is commonly used colourant to achieve black plastic. Carbon black in the plastic increases energy absorption to the material leading to not detecting sufficient absorbance in the NIR measurement. With textiles such issues can be present, and from our experience, they are mostly limited to black wool, polyamide and very old textiles. Each of these types have been found to contain the type of colourant that increases the absorption and noise gain. It has been proven that the effect of black materials could be able to overcome or be diminished by altering the evaluation algorithm which cuts off wavelengths below 1350 nm. This may affect the accuracy of a used method, which is built on the 1100–1650 nm range [
25]. This is a topic of further study.
3. Materials and Methods
The fabric sample set was composed of 253 different fabric pieces. From the sample set, 74 pieces were from post-consumer textiles and 179 pieces from pre-consumers textiles. Of the samples, 59% were monomaterials in the following categories: 100% Cotton (CO), 100% Polyester (PES) and 100% Viscose (CV), and the rest were blended materials such as Cotton/Polyester CO/PES and Cotton/Elastane (CO/EL), other blends such as Wool/Cashmere (WO/WS) and Wool/Polyamide/Elastane (WO/PA/EL), or coated fabrics or fabrics with functional finishes (
Table 3). The fabric samples were cut into about 20 cm × 30 cm pieces. Both sides of the fabrics were analysed with the automated sorting lines so that the front side was always measured first and then the sample was turned over and the back side was measured.
Our lab pilot unit was used to recognise the materials. The unit consists of an NIRS Analyzer PRO Window Reflectance analyser from Metrohm Nordic Oy, a conveyor belt and pressurised air deflectors to sort the recognised textile materials into the designated bins. Sampling speed was 0.5 items/second and belt speed was 0.35 m/second. The unit has been designed and built by LAB University of Applied Sciences. The recognition model was developed by using ProFOSS NIR process analyser with Metrohm Vision™ software for spectral data management. Samples were measured once from both sides at room temperature, consisting of 24 scans, as this process is supposed to model an industrial sorting line. The absorbance spectrum was collected between the wavelengths 1100–1650 nm with 0.5 nm intervals. The material composition was determined by comparing the 2nd order derivate absorbance spectrum with 10 nm segments to a spectral library. The recognition algorithm is based on measuring NIR spectra of large amounts of verified reference samples for each recognition class. The samples are filtered with a maximum average distance from each other in order to take variations of spectra of the same materials into account. The amount of variation allowed can be mathematically defined, so that the recognition accuracy can be adjusted [
26].
A sample spectrum was compared against the spectral library of the lab pilot. The selected library categories, aka Classes, for this study were cotton 100%, ≥90% and ≥60%; polyester 100% and ≥90%; and viscose 100%.
Selected samples were further characterised with an FTIR spectrometer and optical microscopy.
3.1. Fourier Transformed Infrared Spectrometry
Fourier transform infrared (FT-IR)-attenuated total reflection (ATR) spectra of the selected samples were recorded on FT-IR-ATR spectrometer (Bruker Alpha) at 4 cm−1 resolution with 32 scans per sample from wavelength range 400–4000 nm. The samples were mounted directly on the sample holder.
3.2. Optical Microscopy
Optical microscopy images of the fabric samples were taken with an optical stereo microscope (MeijiTechno RXT-LED) with a Photonic PL3000 light source, and fibre images were taken with an optical microscope (Leitz Diaplan). To enable recognition of the natural fibres and for the analysis of elastane, the fabrics were manually unravelled via yarns to their constituent fibres.
4. Conclusions
Near infrared spectrometry can be used to categorise textile waste streams into different material fractions easily and efficiently. Overall improvements to automated identification lines could help to sort more material from waste streams for reuse.
General problems with automated material identification are related to the limitations of NIRS and the fact that it only analyses the surfaces of textiles. This is clearly seen when studying samples with coatings and with multi-layered materials, as well as with some functional finishes. The thicker the layer facing the NIR sensor, the harder it is to recognise the material. Multi-layered samples may hide other materials at their core or under the visible surface, causing false positives, diminishing the yields.
The fabric samples studied were from both pre- and post-consumer clothing. They were pre-sorted for the study, meaning that fabrics were cut into pieces with the same dimensions. Multi-layered clothing (i.e., quilted jackets with filling and lining and similar) were not included in the study. In addition, very thin and loose fabrics caused problems with recognition because the NIR sensor measured the spectrum of the background material through the sample. Folding thin samples could be used to counteract this, but it would be laborious because this would have to be done manually. It was proven that our lab’s pilot can differentiate between blended materials with large enough increments of fibre composition, and therefore it can theoretically sort high-purity monomaterial streams of raw material from heterogeneous sources for reuse. However, our results suggested that if the ratio of one material is low (under 10%) it hampers recognition. In addition, if the materials are blended at the fibre level, accurate recognition becomes difficult. The amount of rejects in the recognition process can be controlled by adjusting the tolerance of the recognition class and the yield can be improved if a small percentage of blended materials is acceptable. It must be emphasised that textiles that were not recognised in our study, however, could potentially be down-cycled, depending on the requirements for subsequent use.
Interestingly, the age of the textile materials caused such strong chemical changes in the materials that it hampered their recognition. Further study is required to determine whether ageing will somehow restrict further use of the sorted materials. If the end user of the recycled material specifies that aged cotton with aldehyde degradation products are not wanted, it will be possible to create a recognition class for aged cotton. For the polyester fraction, more studies are needed to identify chemical changes in the NIR spectra which can be used to recognise aged polyester fractions. In addition, it is worth paying attention to different polyester types and not treating polyester as one type of textile fibre recognition class.


