
Avoidable Household Food Waste: Diagnosing the Links between Causes and Composition


School of Geography and Environmental Science, University of Southampton, Highfield, Southampton SO17 1BJ, UK
Recycling 2021, 6(4), 80; https://0-doi-org.brum.beds.ac.uk/10.3390/recycling6040080
Submission received: 21 July 2021
/
Revised: 19 November 2021
/
Accepted: 1 December 2021
/
Published: 4 December 2021
(This article belongs to the Special Issue Exclusive Papers of the Editorial Board Members (EBMs) of Recycling)
Abstract
:Problems associated with the wastage of food intended for human consumption are well known and the discarding of edible but unconsumed food—avoidable food waste—is clearly undesirable. Interventions to reduce avoidable food waste need to be suitably informed: understanding the causes and consequences of avoidable food waste is instructive in this regard. One hitherto unexplored approach to understand better the causes of food waste is to elucidate associations between the composition of avoidable food waste and the reasons why it is generated. If such associations can be established, data relating to the composition of avoidable food waste can contribute evidence to underpin interventions intended to prevent or reduce avoidable food waste. The aim of this study was therefore to explore links between the causes of avoidable food waste and its composition, and thereby contribute to the development of management measures. Information relating the commonly reported causes of avoidable food waste and its composition (part-consumed, whole-unused and leftovers) was gathered via a series of participatory workshops involving university students. Outcomes of the workshops indicated that individual causes of avoidable food waste rarely lead exclusively to a single type of avoidable food waste, but some relationships were evident. Five of the 13 causal factors explored were considered to lead to all three types of avoidable food waste; a further five were considered to lead mainly to part-consumed and whole-unused food waste. Potential interventions to effect positive change are explored; the value of classifying avoidable food waste to guide interventions was evident, although approaches would need to be aligned with the observed composition of avoidable food waste and the method(s) of intervention considered. Applications of the approach and outcomes of this study are also considered in a policy context.
1. Introduction
It is well known that the production and provision of food for human consumption demand high levels of resources across the whole supply chain [1] including land, water and nutrients [2]. The consumption of water resources and emissions of greenhouse gases are particularly notable; the agriculture sector alone accounts for 25% of global CO2 and greenhouse gas emissions [2]. The failure to consume food produced for human consumption represents a failure to make full use of the resources and impacts associated with its provision; estimates suggest that between one-third [3] and one-half [4] of food produced globally does not fulfil its intended use. Factors and behaviours leading to this waste are multiple and complex [5]. Broadly, food intended for human consumption that is not eaten falls into two categories. Although definitions vary, “food waste” can be considered to occur at the retail and final consumption stage, whereas “food loss” occurs earlier in the supply chain (production, post-harvest and processing) [3,6]. Evidence suggests that wastage of food at the consumption stage is of particular concern. In the UK, for example, food waste at the consumption stage accounts for an estimated 46% of all food waste across the whole supply chain [7]; households produced 61% of the 931 million tonnes generated on a global scale in 2019 [8]. Of the food wasted at household level, almost half can be associated with fresh fruits and vegetables, of which around 40% comprises food that could have been consumed [9].
The management of wasted food also incurs impacts: landfilled food waste leads to the generation of methane [10], a potent greenhouse gas, and accounts for an estimated 6% of global greenhouse gas emissions [2]. In view of global inequities in food security [11], risks of water scarcity impact on food production [12] and extensive famine [13], incomplete consumption and wastage of food fit for and intended for human consumption also has an important ethical facet [14].
There is clearly considerable merit in seeking and implementing means to reduce the wasting of food intended for human consumption. Indeed, the UN has set targets to reduce both food waste (at retail and consumer levels) and food losses (within production and supply) by 50% by the year 2030 as part of its Sustainable Development Goals initiative (Target 12.3) [15]. The ambition of the SDGs relating to food is, in essence, to ensure that the global food supply is both sustainable and sufficient as part of a framework seeking to achieve social justice [16]. If such wastage is to be reduced or eliminated, initiatives and interventions are most likely to lead to desirable outcomes if based on evidence. In this regard, the connections between the causes and effects of this waste are instructive.
With regard to the causes of household food waste, factors recognised and reported in the literature as generators of household food waste include: attitudes, knowledge and awareness; purchasing decisions; meal planning; food storage; use of leftovers; adherence to and understanding of advisory dates; lifestyle pressures; and portion control (Table 1). In this instance, “portioning” refers to the quantities of food (e.g., rice and pasta) that are prepared for a meal but without due consideration of appropriate measures that match appetite [5] and are often aligned with nutritional and dietary needs [17]. The list presented (Table 1) illustrates relevant factors; behaviours and practices are considered complex [18] and may interact at different scales [19].
With regard to food waste generated by domestic households, it is important to recognise and differentiate between those parts of food items and products that are considered edible and those that are considered inedible. The term “avoidable food waste” describes food or products that could be eaten but have been discarded uneaten; “unavoidable food waste” describes discarded parts of food or food products that would not customarily be consumed, such as egg shells [20]. In addition, there may be cultural or behavioural factors that influence whether food is considered edible; choosing to peel a potato rather than to wash it, for example, leads to generation of preparation residues (peel) that would be avoided by washing alone. The notion of “potentially avoidable” food waste [30] is pertinent in this regard: consumers’ individual choices, preferences and behaviours can influence the quantity and type of food waste they generate. Notwithstanding some uncertainties and inconsistencies regarding what is edible and what is not, the collection, treatment and valorisation of truly unavoidable food waste has merit in providing a feedstock for the creation of a viable product such as composting [31] or fuel derived via anaerobic digestion [32], for example.
Avoidable food waste can be further classified into subgroups on the basis of life cycle stage (Table 2) [20]. Importantly, this approach [20] recognises that potentially edible food can be discarded by the householder at various stages after a product has been purchased. “Leftovers” are, in essence, items of food or parts thereof that have been prepared for consumption but have been incompletely consumed; the term “plate waste” [33] is considered synonymous. In contrast, “whole unused” describes food products that have been discarded without being at all consumed [20], whereas “part consumed” describes products that have been partially but not wholly consumed. A whole cake discarded uneaten would constitute whole unused food waste; discarding one uneaten small cake from a pack of four would constitute part-consumed food waste; part-consumed and whole-unused products exclude items prepared for consumption but not eaten (i.e., leftovers).
In addition to recognising the notions of avoidable and unavoidable food waste, the subdivision of avoidable food waste on the basis of life cycle stage also recognises the potential for links between what householders do and the food waste that they discard. It may be conjectured, for example, that the generation of food waste in the form of leftovers may well differ from whole unused food waste in terms of its causes: incomplete consumption of a prepared and plated meal is likely influenced by somewhat different factors than a product that travels from a shop to a refuse bin via a householder’s refrigerator.
If progress is to be made with regard to reduction or elimination of avoidable household food waste [23], interventions intended to exploit opportunities to effect positive change [34,35] should ideally be informed and guided by relevant and meaningful understanding of householders’ actions [22,23,25]. The aims of this study were, therefore, to (1) explore how factors leading to avoidable food waste are linked to the type(s) of avoidable food waste they generate, and (2) to consider the applications of such knowledge for the purposes of avoidable food waste prevention.
2. Materials and Methods
2.1. Overview
In order to explore and elucidate the links between causes of avoidable food waste and the types of food waste generated, a series of workshops was held (Section 2.2). The intention of these workshops was to prompt structured discussion of these links within small groups, leading to an agreed, consensus view amongst replicate groups, i.e., a measure of the perceived links. Outcomes of the series of workshops were then analysed to determine patterns and relationships (Section 2.3).
2.2. Workshops
A series of 4 workshops was conducted annually in November (2016, 2017, 2019 and 2020). Participants were university students in either the final year of an undergraduate degree programme or undertaking postgraduate (Masters) study in environment-related subjects and formally registered on a module focusing on sustainable resource management. The participant group was not intended to represent the broader public and differed markedly. Students in higher education (HE) in the UK typically comprise mainly adults less than 30 years of age (80%) with a relatively high proportion (ca. 70%) from 18 to 25 years old [36]; in the UK in 2011 more than ca. 60% of the national population were 30 years or older [37]. By virtue of past education, participants were familiar with the broad environmental context of human activities; through recent study they had acquired knowledge and understanding in relation to concepts and issues in resource management (e.g., the waste hierarchy and circular economy). It is also noted that the level of education an individual has may also affect the food waste that they produce, education level often co-varying with income [18]. The purpose of this study, however, was to draw upon the insight and experience of participants rather than to elucidate their own actions per se.
Student participants certainly cannot be considered to represent broader society, but their contributions to the workshop capitalised on two facets of their situation and experience with regard to issues associated with food waste. First, as independently-living young adults, each had personal and contemporary experience of managing their own food provision, and of storing, preparing and consuming meals. In addition, the tendency for HE students to share accommodation with others provides insight into the attitudes and actions of others. Through sharing communal facilities for food storage and preparation, sometimes with shared food shopping and meal preparation, students in HE settings gain first-hand familiarity with co-inhabitants’ interactions with food and food waste.
Approximately 70 students participated in the four workshops, mostly in groups of 3–4 individuals. Prior to each workshop, a seminar was delivered to all participants to provide background and context; the seminar focused on (1) general aspects and issues relating to food waste on a global scale, and (2) a detailed local-scale case study with focus on the life cycle stage and product composition of avoidable food waste [15]. At the commencement of the workshop, participants were thus familiar with the context and nature of household food waste but not the literature appertaining to its causes. The aims and activities of the workshop were then set out, i.e., an overview and reminder of factors reported to lead to avoidable food waste (Table 1) and avoidable food waste classification, including life cycle stage (Table 2). Examples were provided verbally to ensure clear and consistent understanding of food waste classification (Table 2) and participants were encouraged to request clarification if needed.
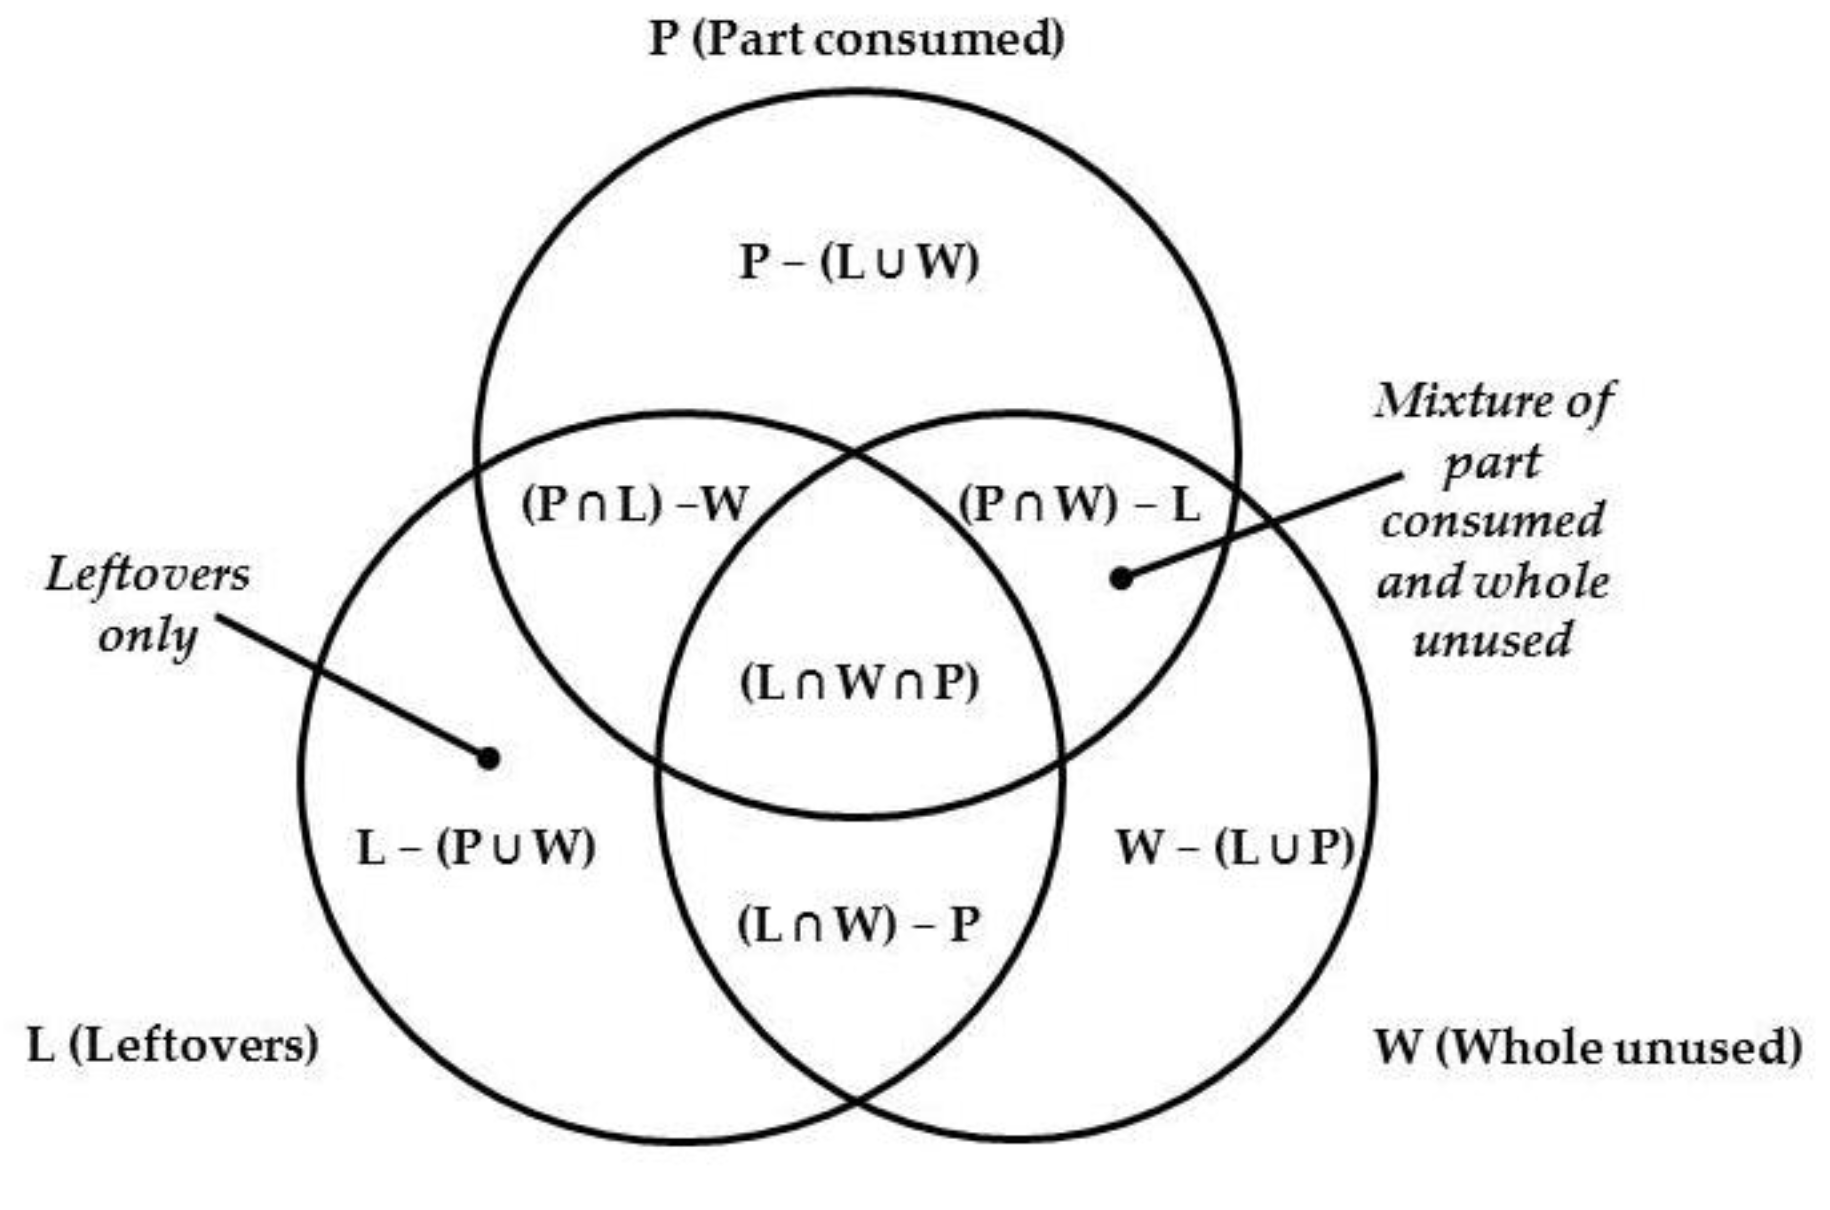
In the workshops, participants were asked to consider a range of factors that can lead to avoidable food waste (Table 1) and to discuss the category or categories of avoidable food waste that each factor was likely to generate. Discussions were based on individuals’ personal experience and perceptions, incorporating facets drawn from living in shared accommodation as appropriate. Individuals first considered these links independently and then discussed their perceptions as a group. Agreed outcomes were recorded on a Venn diagram (Figure 1) representing a consensus view.
2.3. Quantitative Analsyses of Workshop Outcomes
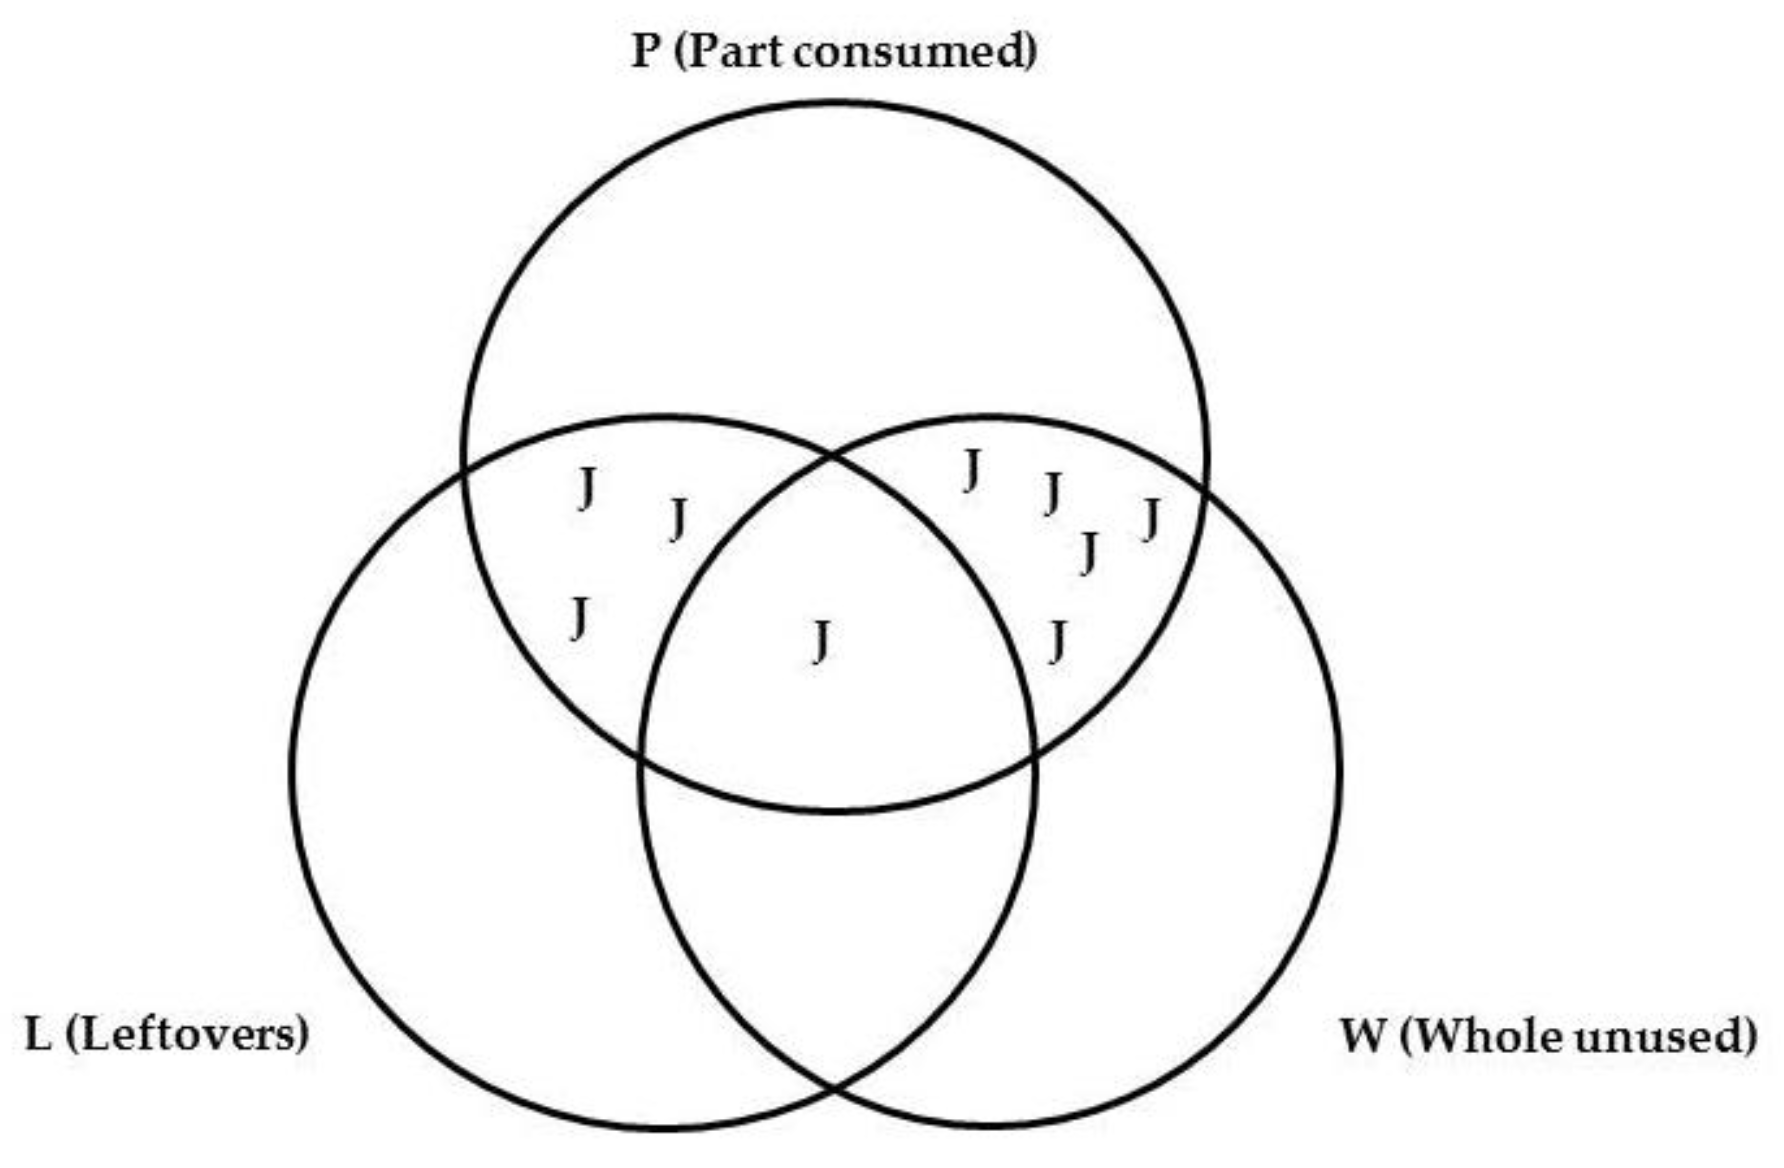
The observations recorded by workshop participants using the Venn diagram (Figure 1) were analysed to derive parameters indicating the extent to which each causal factor (Table 1) leads to which type of avoidable food waste (Table 2). For each factor leading to avoidable food waste (Table 1), a descriptive parameter was derived. “Food Waste Outcomes” (FWO) were calculated (Equation (1)) to indicate the perceived influence of each causal factor (Table 1) on each of the three categories of avoidable food waste (Table 2). The weighting (Equation (1)) reflects whether causal factors were perceived to lead to a single type of avoidable food waste or combinations thereof. Causal factors leading to only one type of avoidable food waste, or a mixture of two or three types, were weighted by factors of 1, ½ and ⅓, respectively (Equation (1)). FWO parameters derived thus reflect the distribution of causal factors in relation to the types of avoidable food waste they are perceived to generate, as illustrated (Figure 2); in this illustration the values of FWO parameters indicate a tendency of factor J to lead more strongly to part consumed avoidable food waste than to leftovers or whole unused. The sum of the three FWO parameters (FWOL + FWOP + FWOW) is 1; descriptive statistics for FWO were calculated in the form of mean values with associated standard deviations (SD) using MS Excel.
where: Figure 1 shows terms relating to the position of causal factors (A–M; Table 1); N indicates the total number of responses. FWOL, FWOP and FWOW are food waste outcomes for leftovers (L), part consumed (P) and whole unused (W) food avoidable waste, respectively.
FWOL = {[L − (P∩W)] + ½[(L∩P) − W] + ½[(L∩W) − P] + ⅓[L∩P∩W]}/N
FWOP = {[P − (L∩W)] + ½[(P∩L) − W] + ½[(P∩W) − L] + ⅓[L∩P∩W]}/N
FWOW = {[W − (P∩L)] + ½[(W∩P) − L] + ½[(W∩L) − P] + ⅓[L∩P∩W]}/N
FWOP = {[P − (L∩W)] + ½[(P∩L) − W] + ½[(P∩W) − L] + ⅓[L∩P∩W]}/N
FWOW = {[W − (P∩L)] + ½[(W∩P) − L] + ½[(W∩L) − P] + ⅓[L∩P∩W]}/N
3. Results
The four workshops (Section 2.2) were regarded as replicate evaluations of the links between the causes of avoidable food waste (Table 1) and the types of food waste generated (Table 2), as expressed by participants via the Venn diagrams (Figure 1). Average values for the food waste outcomes (FWO; Equation (1)) and standard deviations were calculated (Table 3) to examine the variation of outcomes across the four workshops. In general, the SD was relatively low compared with the mean (<33%), but there were notable instances with relatively high levels of variation. Higher SD tended to be associated with low values of FWO, e.g., for FWOL associated with causal factors G, H, J and M (Table 1), and FWOW associated with causal factors C, E and H (Table 1). In one instance, relatively high SD was observed at a slightly higher value: the mean FWOP associated with causal factor H (Table 1) was 0.230 ± 0.176, i.e., 70% of the mean. The inference is that, in general, the variation of FWO values is higher when they are less important as drivers of specific types of avoidable food waste (Table 2).
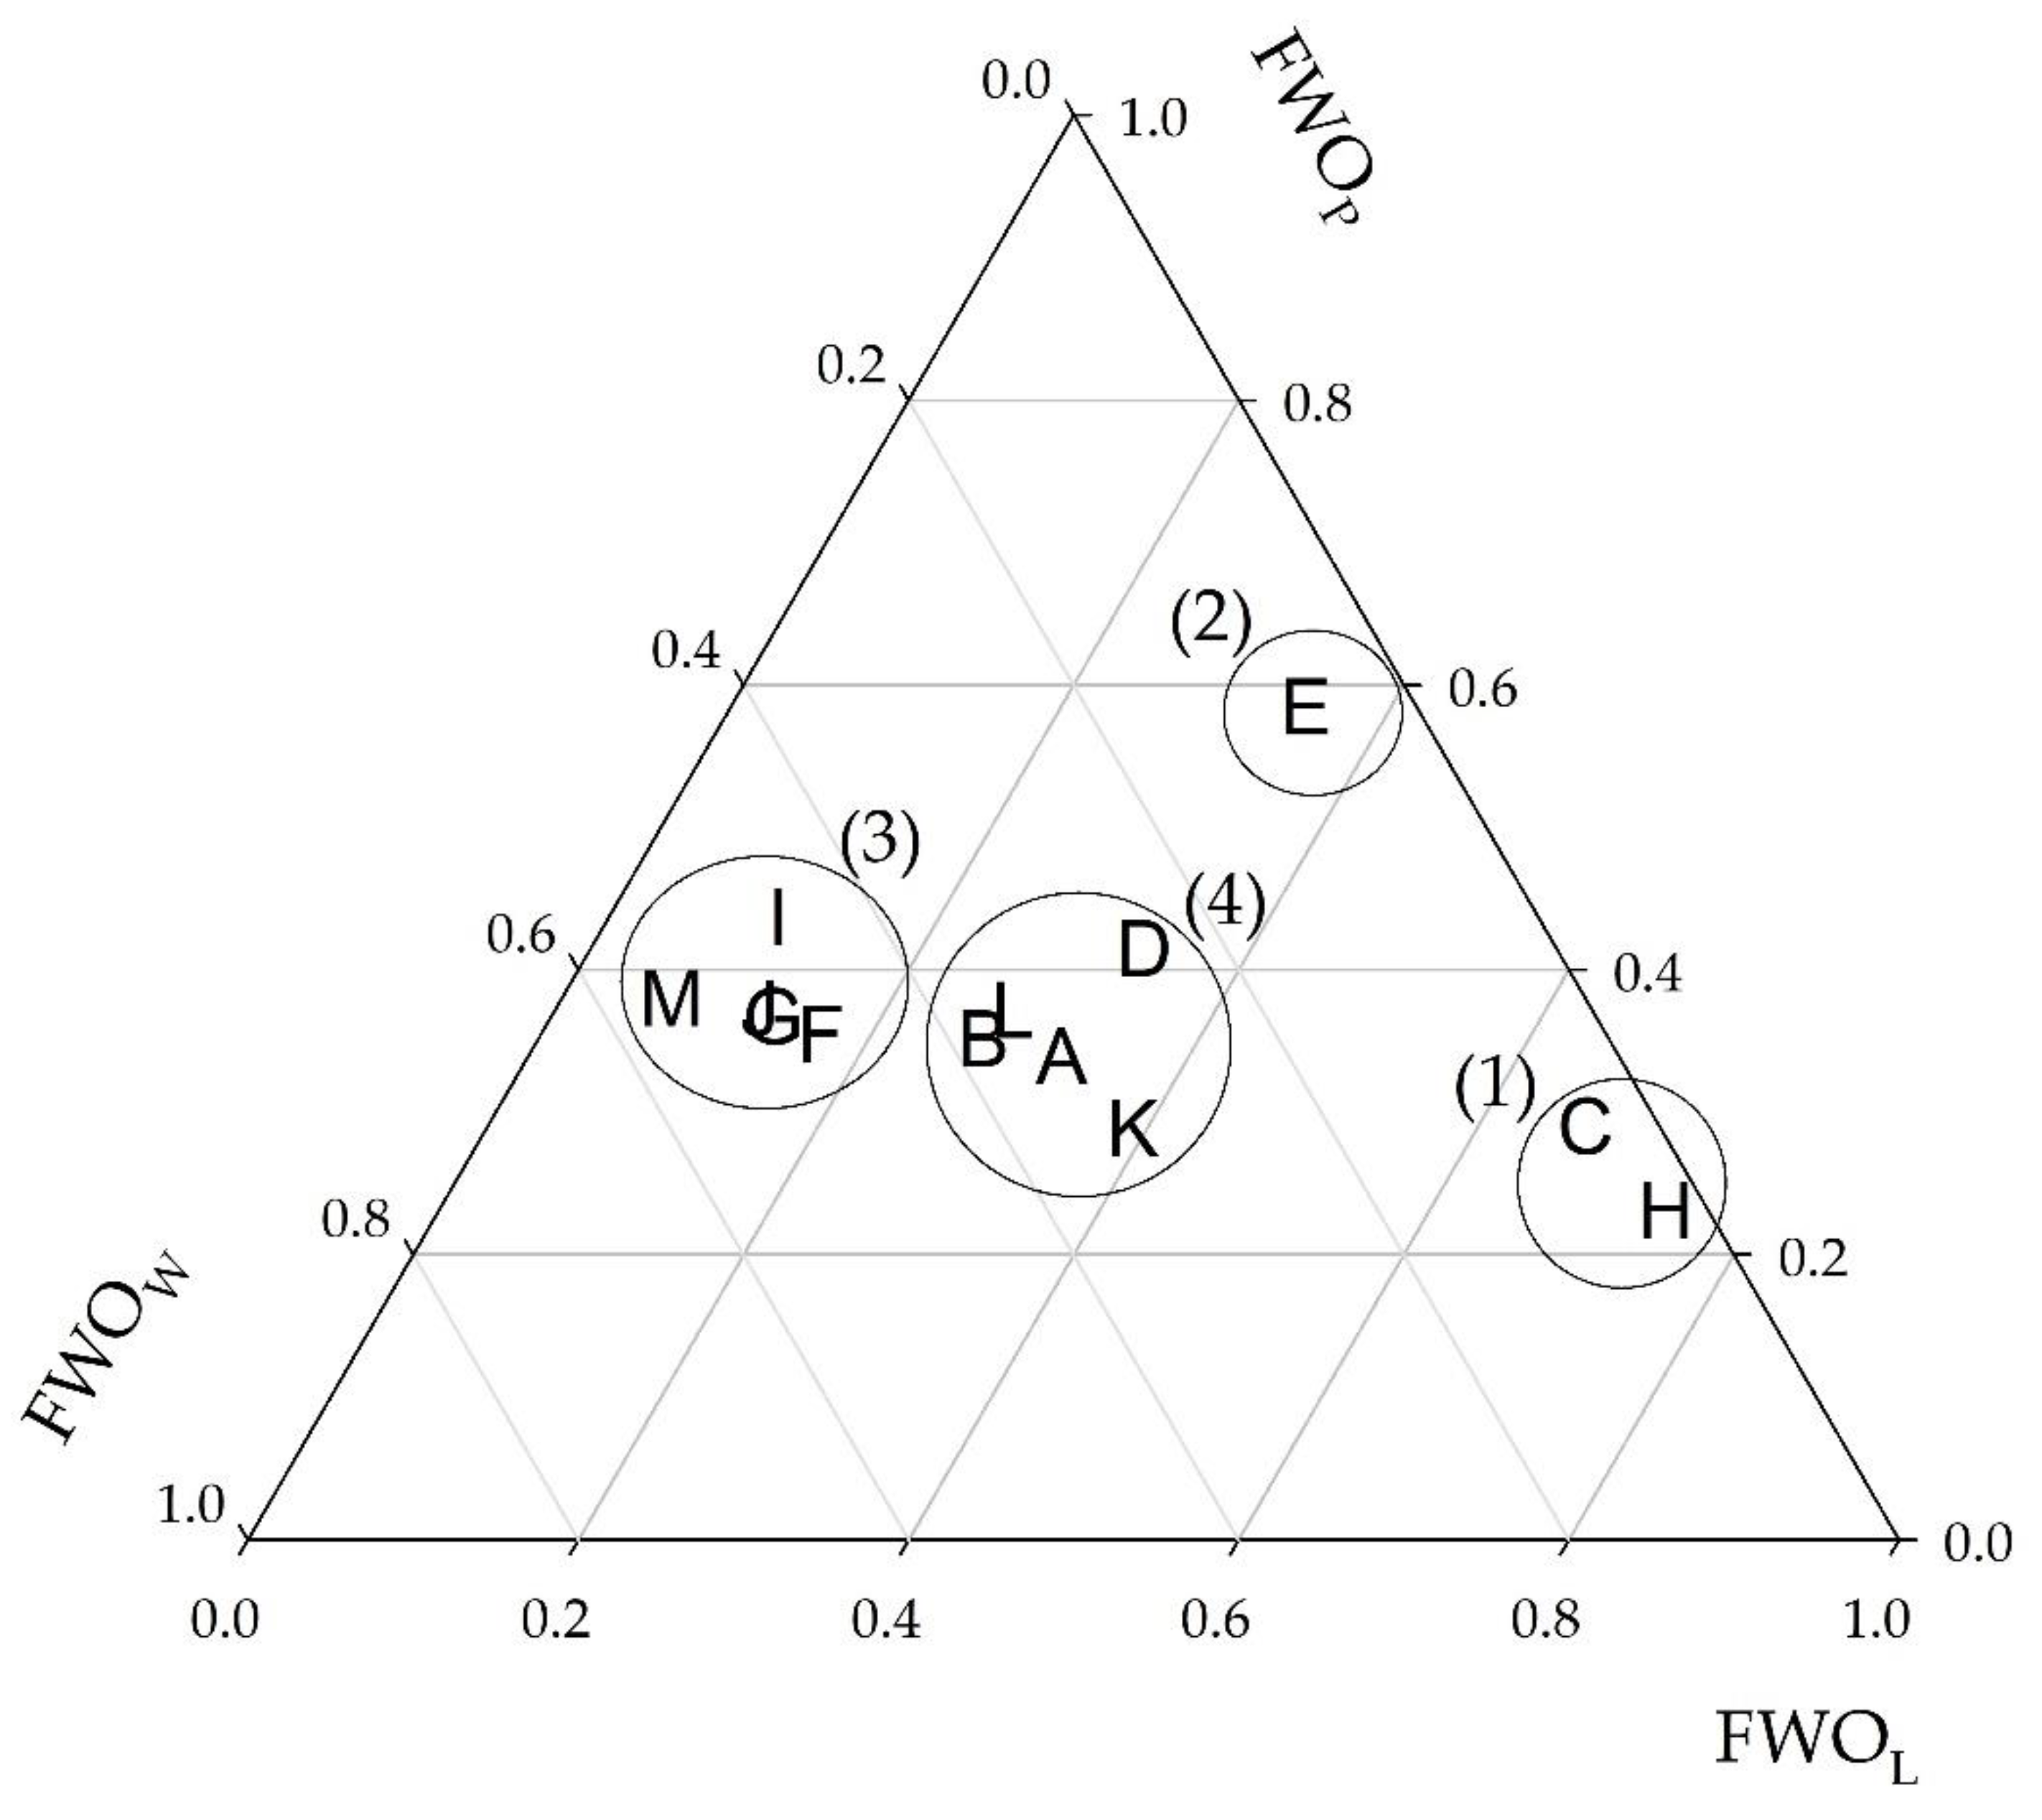
As a means to visualise the relative perceived contributions of causal factors (Table 1) to avoidable food waste types (Table 2), FWO parameters were shown on a ternary plot (Figure 3). Visualisation of the FWO data in this manner revealed that the causal factors (Table 1) fell within four discrete clusters comprising factors leading to (1) mainly leftovers, (2) mainly part consumed, (3) mainly part consumed and whole unused, and (4) all three types of avoidable food waste (Figure 3). The clusters of causal factors (Figure 3) and the types of avoidable food waste with which they are associated are shown in Table 4.
The clustering of causal factors in relation to the type(s) of avoidable food waste generated indicates that rather few factors are considered to lead primarily to a single type of food waste (Table 4). Excessively high portion sizes and lack of cooking knowledge were considered to lead mainly to leftovers (Figure 3; Table 4). Similarly, consumer preferences in relation to parts of food products were considered to lead mainly to the partial consumption of food products (Figure 3; Table 4). In all other cases, the causes of avoidable food waste considered in this study (Table 1) were believed to lead to more than one type of food waste (Figure 3; Table 4).
4. Discussion
4.1. Associations between the Causal Factors and Composition of Avoidable Food Waste
Perceptions of the association between causal factors and the types of avoidable food waste they lead to (Table 3) were, in general, similar across the four workshops (Section 2.2) through which data were acquired. The generally low levels of variance relative to mean values of FWO parameters (Table 3) indicated that workshop participants’ perceptions reflect that the associations as determined are largely consistent.
On the basis of the workshop outcomes and data analysis, the key findings of this study are, in broad terms, that (1) links between the causes of avoidable food waste and the composition of resultant food waste, expressed in terms of life cycle stage (Table 2), were established, and (2) the links identified provide a basis for the development of strategies to ameliorate the wasting of potentially edible food.
With regard to associations between causal factors and the avoidable food waste generated, clustering of factors in relation to FWO parameters (Figure 3) identified that relatively few factors are perceived to lead to a single life cycle stage (Table 2). Some observations have relatively simple explanations: the association of leftovers with inappropriate portion size [25,26,27,28] and lack of knowledge about how to use leftovers [24,25] is a given that is confirmed by the outcomes of the present study (Table 4). Consumers using leftovers may do so for reasons of waste prevention, health or provision of meals [38], but observations of the present study indicate that wastage of leftovers follows lack of relevant cooking knowledge or skills [24,25]. In this regard, the notion of “potentially avoidable food waste” is pertinent [30]; personal preferences may be influenced by, for example, cultural factors, habits, or dietary needs and concerns [24]. Bread crusts, for example, are edible and intended to be consumed, but are often discarded without being prepared for consumption due to personal preference.
A further cluster of causal factors was considered to lead to mainly part consumed and whole unused products but was not strongly associated with leftovers (Table 4). It was notable that factors included within this cluster alluded to storage [24,25], planning [24,25] and food safety labelling [25,27,29]. In simple terms, inadequate or unsuitable storage can reduce the shelf life or food products [7,25]. The shelf life of food products, whether partially consumed or not, may be reduced if items are inappropriately stored [24,25]. Once opened, the shelf life of partially consumed items may reduce more rapidly as they are preserved less well once packing has been opened, which may lead to product wastage [23]. Similarly, failure to plan food purchases can lead to a mismatch between what is purchased and what is consumed [23,25]. The perception that this leads to part consumed and/or whole unused avoidable food waste (Table 4) highlights the role of meal and food planning as means to align better purchasing with consumption [23,25]. Food that has been discarded without having been prepared for consumption is symptomatic in this respect. Evidence in this regard is equivocal; meal planning and “unplanned shopping” have in some instances been reported to exert no impact on food waste [39].
Workshop participants also identified a strong link between food labelling and the generation of part consumed or whole unused food waste (Table 4). Lack of understanding of food safety labelling is known to lead to confusion amongst consumers [5,23]; it is noted that, in the absence of full and accurate understanding, disposal of unconsumed (partially or wholly) food may, to many, be considered the safest option.
A cluster of causal factors leading to all three types of avoidable food waste was also identified (Figure 3). The factors included aspects relating to quite general facets of food waste behaviour, notably awareness [19,22,23,24] and attitudes [26], which are well established as influences on pro-environmental behaviour, and waste- and resource-related behaviour, in addition to behaviour relating to food waste [23]. The association of attitudes and awareness with all three life cycle stages of avoidable food waste (Table 2) highlights their widespread influences. It can be envisaged that, without a desire to reduce avoidable food waste, an individual would be unlikely to engage in food waste prevention activities or behaviours and, consequently, would act in such a way that avoidable food waste would be generated [23] indiscriminately and at all life cycle stages (Table 2). Similarly, a lack of awareness of the impacts of food waste generation might be expected to lead to the indiscriminate generation of all life cycle stages of avoidable food waste; without a knowledge of the impacts and a desire to take actions to ameliorate them [23], wastage will likely occur at all stages of purchase, storage and consumption [25].
An association was also seen between concerns regarding food hygiene [24,25] and the generation of all three life cycle stages of avoidable food waste (Table 4). It is notable that, although lack of understanding regarding food labelling [5,25,27,29,40] also aligns with issues of food safety, this was considered to lead mainly to part consumed and whole unused products (Table 4). As noted, labels appertaining to “best-before” and related dates underpin the perception of food as an edible entity or as waste [40]. The association of food hygiene concerns with leftovers, in addition to part consumed and whole unused products (Table 4), indicates that food hygiene concerns extend beyond the edibility of products before preparation. This observation infers that consumers consider food hygiene in regard to “plated” food prepared for consumption.
4.2. Implications and Applications
Knowledge of the associations between causal factors and composition (in terms of life cycle stage) of avoidable food waste provide, in principle, evidence to inform and underpin measures to reduce avoidable food waste in the household sector.
The associations established in this study (Table 4) show that in some instances relatively simple problems may be solved by relatively simple means. If it were to be determined that avoidable food waste from households comprised mainly leftovers, for example, the aims of interventions to precipitate behaviour change should be to address (1) householders’ skills in using leftovers [24,25] for positive outcomes [40], and/or (2) householders’ ability to match better portion sizes [25,26,27,28] to their appetite and dietary needs. Preparation of portions that exceed appetite(s) do not necessarily lead to avoidable food waste, but specific aspects may exert influence on householders’ behaviour in this regard. Arguably, “plate waste” has less appeal for consumption at a later occasion than uneaten food that has been prepared but not yet served at the table.
Similarly, if leftovers are absent or under-represented in householders’ avoidable food waste, interventions to effect positive behaviour change might best aim to address those causal factors leading to part consumed and whole unused food waste (Table 4). It is notable that these factors relate to processes preceding preparation of food for consumption, i.e., failure to plan food purchases and meals, inappropriate storage [24,25] and misunderstanding of food safety labelling [5,23,25,27,29].
In actuality, circumstances when households’ avoidable food waste is dominated by only one or two life cycle stages are unlikely to arise. Where households’ avoidable food waste has been analysed in relation to life cycle stage [20,22], part consumed, whole unused and leftover products are all likely to be present in appreciable measure.
Faced with a likely mix of leftovers, part consumed and whole unused avoidable food waste, the outcomes of the present study indicate that a subset of causal factors should be of concern (Table 4). Specifically, the key factors in this regard relate to: a lack of awareness of impacts [7,22,23,24], attitudes to food and food waste [19], lack of time to eat [24], and facets of food hygiene [24,25]. How might causal factors such as these inform and guide policy or programmes of measures to reduce avoidable food waste?
If positive change is to be made, frameworks describing and classifying householders are instructive as a means to guide interventions [41]. Mapping the processes leading to food waste, for example, identifies the principal steps: planning, in-store behaviour and actions, food storage, preparation of food for consumption, consumption, and uneaten food [25]. Similarly, consideration of scales allows factors influencing food waste generation to be considered in terms of their effects on individuals, at household level and external to the household [19]. Established causes of avoidable food waste (Table 1) may be readily mapped onto the stages of this “journey” [25]. At the same time, insight to householders’ behaviour is instructive [19,23]; although there are complexities [19], some simplifications may be made. Three common behavioural types have been proposed, comprising consumers who are: (1) unaware of food waste issues and waste food, (2) unaware of food waste issues but do not waste food, or (3) aware of issues and align their behaviour with food waste avoidance [23].
The importance of awareness of food waste issues is notable. Although awareness can be a key facet aligned with behavioural types [23] and is associated with the generation of all three life cycle stages of avoidable food waste (Table 4), altering householders’ behaviour to positive effect is by no means a given. Delivery of information intended to alert householders to the broad environmental impacts of food waste or the impacts on personal finances, for example, led to no determinable change in the generation of avoidable food waste in a study in southern England [22].
This outcome raises a number of issues. First, household spending on food in the UK accounts for, on average, between 10% and 12% of income [42]. The opportunity to save money by wasting less food likely results in little actual gain for the household on a week-by-week basis. Secondly, the means by which materials intended to inform householders are delivered is critical. Delivery of leaflets, for example, appears to have little effect on householders’ waste management behaviour [22,43]. Where contrasting methods to raise householders’ awareness of food waste issues have been compared directly, outcomes using handouts, community engagement and gamification approaches vary [34]; community engagement led to the lowest impact of these three methods. This outcome is notable in that food waste reduction campaigns elsewhere have employed community engagement to positive effect [35]. The UK’s Waste and Resources Action Programme (WRAP), for example, provided instruction on cookery skills to engage better householders with the processes of food preparation and, by association, enhance planning capabilities; “cascade training” has also been applied by WRAP with the same intention [35]. It is notable that initiatives by WRAP [35] have been delivered at a variety of scales: intensive campaigns at local level used roadshows, for example, reach individuals who form part of households, whereas campaigns using broadcast media were less directly connected to individuals.
It is also pertinent to address “macro-scale” influences [19] outside the household. Factors influencing the generation of avoidable food waste in the present study (Table 1) focused specifically on factors operating at the individual and/or household scale [19]. Householders’ behaviour is susceptible to external influences, notably with regard to their interactions with the retail domain. Examples include “buy-one-get-one-free” offers and pre-packaged fruit and vegetables of fixed quantities [27], both of which affect the quantities of food purchased such that there is potential for a mismatch between what is needed and what is purchased. Although retail price promotions can contribute to the generation of food waste [44], such outcomes cannot be assumed; links between retail price promotions and food waste are themselves influenced by a range of factors operating at individual and/or household level [44].
More generally, macro-scale influences may potentially be altered by policy intervention. Governments have shown willingness to influence consumers’ behaviour with regard to the consumption of sugar in food products [45]; the “sugar tax” in the UK (a levy on soft drinks containing added sugar), for example, has resulted in favourable health outcomes [46]. Similarly, requirements for food product labelling to provide nutritional information [47] can help consumers to choose more healthy products, if labels are readily understood, e.g., using interpretive “traffic light” labels [48]. There is an opportunity for governments to impose measures and policies upon the retail sector as a means to reduce avoidable food waste.
If policy interventions are to be designed and implemented on the basis of evidence, the approach outlined in the study may be applied to good effect. The mapping of causal factors to food waste outcomes can in principle identify alignment(s) of causes and consequences of avoidable food waste, as demonstrated (Figure 3, Table 4). For fuller application in a policy context, there are two key areas for consideration.
First, generalisation of observations based on HE student participants should be consider in terms of the robustness of the outcomes and the representativeness of the participant group. Arguably, the participants in the present study have relevant experience and insight (Section 2.2), but adjustment may be needed in different circumstances. Variation in the meaning of “avoidable” and unavoidable” food waste may be subject to cultural or geographic influences, for example. Moreover, the list of causal factors for avoidable food waste referred to in the present study is not exhaustive and should not be fixed. The presence of food safety labelling, for example, varies considerably and may be absent. Similarly, situational aspects could be considered. Impacts and influences of the ongoing COVID-19 pandemic upon food and food waste behaviours have been reported [16,49]. Under these adverse circumstances, it may be anticipated that food waste behaviours will be influenced by other factors in addition to those considered herein (Table 1). Inclusion of additional factors may well indicate their influence(s) on the relationship between the causes and consequences of avoidable food waste and make for more meaningful and robust outcomes.
Secondly, broader application of the approach set out in the present study requires information relating to the composition of avoidable food waste in terms of leftovers, part-consumed and whole-unused food items. The effort and resources required to obtain such information should not be underestimated. Where undertaken, analyses can provide detailed information not only on the type of avoidable food waste, but also on the composition with respect to food groups [15,21]; however, focus on detail may reduce the potential for the number of samples analysed. Such information has identified instances where the contributions of fresh fruit and vegetables to avoidable food waste have been quantified [9,21], which provides additional insight into nutritional loss associated with unconsumed food [50]. Alternatives to direct observation may be instructive in this regard; self-reports of food waste, however, may lack reliability and suitable alternatives may be needed for broad-scale application [21].
5. Conclusions
It is clear that householders’ behaviour with regard to avoidable food waste is influenced by an array of factors; it is unlikely that a “one-size-fits-all” solution to the problem of wasted edible food exists or will be identified. In order to achieve positive results from measures and initiatives intended to reduce avoidable food waste, knowledge and understanding of what householders do and what influences their behaviour are essential. In this regard, the composition of avoidable food waste, in terms of life cycle stage, can be instructive in that causative factors may be identified on the basis of compositional data. If positive change is to ensue, it is required that (1) data appertaining to the composition of avoidable food waste are available for the householder population of concern, and (2) suitable means to achieve desired outcomes of interventions or initiatives can be identified and implemented. It is recommended that participants selected to assess the relationship between the causes and the consequent composition of avoidable food waste are aligned with the specific location or situation so that outcomes are generated with suitable context. The causes of avoidable food waste considered should also be flexible. These should be adjusted to take into account both prevailing and episodic influences such as the COVID-19 pandemic and attendant constraints. In order to test whether and how knowledge of the composition of avoidable food waste can be applied to effect positive change through targeted interventions to address specific causal factors, empirical evidence is needed.
Funding
This research received no external funding.
Institutional Review Board Statement
Not applicable.
Informed Consent Statement
Not applicable.
Data Availability Statement
Data are contained within the article.
Acknowledgments
P.J.S. would like to thank all the students who have participated in the workshops for their commitment and enthusiasm. He would also like to thank Dianna Smith for constructive criticism on the work presented.
Conflicts of Interest
The author declares no conflict of interest.
References
- Schneider, F.; Lebersorger, S. The challenges of food wastage to European society. In Proceedings of the 15th European Roundtable on Sustainable Consumption and Production, Bregenz, Austria, 2–4 May 2012. [Google Scholar]
- Ritchie, H.; Roser, M. Environmental Impacts of Food Production. Available online: https://ourworldindata.org/environmental-impacts-of-food?utm_source=jeremycherfas&utm_medium=email&utm_campaign=eat-this-newsletter-132-underserved (accessed on 9 July 2021).
- Food and Agriculture Organization of the United Nations: Food Loss and Waste Database. Available online: http://www.fao.org/platform-food-loss-waste/flw-data/en/ (accessed on 6 July 2021).
- Institution of Mechanical Engineers: Global Food: Waste Not, Want Not. Available online: http://www.campaignforrealfarming.org/wp-content/uploads/2013/01/IME-Global-Food-Report.pdf/ (accessed on 6 July 2021).
- Quested, T.E.; Marsh, E.; Stunell, D.; Parry, A.D. Spaghetti soup: The complex world of food waste behaviours. Resour. Conserv. Recycl. 2013, 79, 43–51. [Google Scholar] [CrossRef]
- Parfitt, J.; Barthel, M.; Macnaughton, S. Food waste within food supply chains: Quantification and potential for change to 2050. Philos. Trans. R. Soc. B 2010, 365, 3065–3081. [Google Scholar] [CrossRef] [PubMed] [Green Version]
- Jeswani, H.K.; Figueroa-Torres, H.G.; Azapagic, A. The extent of food waste generation in the UK and its environmental impacts. Sustain. Prod. Consum. 2021, 26, 532–547. [Google Scholar] [CrossRef]
- European Commission: Food Waste. Available online: https://ec.europa.eu/food/safety/food-waste_en (accessed on 18 November 2021).
- De Laurentiis, V.; Corrado, S.; Sala, S. Quantifying household waste of fresh fruit and vegetables in the EU. Waste Manag. 2018, 77, 238–251. [Google Scholar] [CrossRef] [PubMed]
- Lopez, V.M.; De la Cruz, F.B.; Barlaz, M.A. Chemical composition and methane potential of commercial food wastes. Waste Manag. 2016, 56, 477–490. [Google Scholar] [CrossRef] [PubMed]
- Baer-Nawrocka, A.; Sadowski, A. Food security and food self-sufficiency around the world: A typology of countries. PLoS ONE 2019, 14, e0213448. [Google Scholar] [CrossRef] [Green Version]
- Fitton, N.; Alexander, P.; Arnell, N.; Bajzelj, B.; Calvin, K.; Doelman, J.; Gerber, J.S.; Havlik, P.; Hasegawa, T.; Herrero, M.; et al. The vulnerabilities of agricultural land and food production to future water scarcity. Glob. Environ. Chang. 2019, 58, 101944. [Google Scholar] [CrossRef]
- Maxwell, D.; Khalif, A.; Hailey, P.; Checchi, F. Viewpoint: Determining famine: Multi-dimensional analysis for the twenty-first century. Food Policy 2020, 92, 101832. [Google Scholar] [CrossRef]
- Koivupuro, H.-K.; Hartikainen, H.; Silvennoinen, K.; Katajajuuri, J.-H.; Heikintalo, N.; Reinikainen, A.; Jalkanen, L. Influence of social-demographical, behavioural and attitudinal factors on the amount of avoidable food waste generated in Finnish households. Int. J. Consum. Stud. 2012, 36, 183–191. [Google Scholar] [CrossRef]
- UN Environment Programme: SDG 12.3 Food Waste Index. Available online: https://www.unep.org/thinkeatsave/about/sdg-123-food-waste-index (accessed on 6 July 2021).
- Fleetwood, J. Social justice, food loss, and the Sustainable Development Goals in the era of COIVD-19. Sustainability 2020, 12, 5027. [Google Scholar] [CrossRef]
- UK Government: Guidance: Portion Sizes and Food Groups. Available online: https://www.gov.uk/government/publications/school-food-standards-resources-for-schools/portion-sizes-and-food-groups (accessed on 18 November 2021).
- Secondi, L.; Principato, L.; Laureti, T. Household food waste behaviour in EU-27 countries: A multilevel analysis. Food Policy 2015, 56, 25–40. [Google Scholar] [CrossRef]
- Boulet, M.; Hoek, A.C.; Raven, R. Towards a multi-level framework of household food waste and consumer behaviour: Untangling spaghetti soup. Appetite 2021, 156, 104856. [Google Scholar] [CrossRef] [PubMed]
- Lebersorger, S.; Schneider, F. Discussion on the methodology for determining food waste in household waste composition studies. Waste Manage. 2011, 31, 1924–1933. [Google Scholar] [CrossRef]
- Elimelech, E.; Ayalon, O.; Ert, E. What gets measured gets managed: A new method of measuring household food waste. Waste Manag. 2018, 76, 68–81. [Google Scholar] [CrossRef]
- Shaw, P.J.; Smith, M.; Williams, I.D. On the prevention of avoidable food waste from domestic households. Recycling 2018, 3, 24. [Google Scholar] [CrossRef] [Green Version]
- Di Talia, E.; Simeone, M.; Scarpato, D. Consumer behaviour types in household food waste. J. Clean. Prod. 2019, 214, 166–172. [Google Scholar] [CrossRef]
- Waste and Resources Action Programme (WRAP): Food Behaviour Consumer Research: Quantitative Phase. Available online: https://wrap.org.uk/resources/report/food-behaviour-consumer-research-quantitative-phase (accessed on 21 July 2021).
- Principato, L.; Mattia, G.; Di Leo, A.; Alberto Pratesi, C. The household wasteful behaviour framework: A systematic review of consumer food waste. Ind. Mark. Manag. 2021, 93, 641–649. [Google Scholar] [CrossRef]
- Williams, I.D.; Schneider, F.; Syversen, F. The "food waste challenge" can be solved. Waste Manag. 2015, 41, 1–2. [Google Scholar] [CrossRef]
- Wilson, N.L.W.; Rickard, B.J.; Saputo, R.; Ho, S.-T. Food waste: The role of date labels, package size, and product category. Food Qual. Prefer. 2017, 55, 35–44. [Google Scholar] [CrossRef] [Green Version]
- WRAP: Synthesis of Household Food Waste Compositional Data 2018. Available online: https://wrap.org.uk/resources/report/synthesis-household-food-waste-compositional-data-2018 (accessed on 21 July 2021).
- Toma, L.; Font, M.S.; Thompson, B. Impact of consumers’ understanding of date labelling on food waste behaviour. Int. J. Oper. Res. 2020, 20, 543–560. [Google Scholar] [CrossRef] [Green Version]
- Withanage, S.V.; Dias, G.M.; Habib, K. Review of household food waste quantification methods: Focus on composition analysis. J. Clean. Prod. 2021, 279, 123722. [Google Scholar] [CrossRef]
- Adhikari, B.K.; Barrington, S.; Martinez, J.; King, S. Effectiveness of three bulking agents for food waste composting. Waste Manage. 2009, 29, 197–203. [Google Scholar] [CrossRef] [Green Version]
- Gómez, X.; Cuetos, M.J.; Tartarkovsky, B.; Martínez-Núñez, M.F.; Morán, A. A comparison of analytical techniques for evaluating food waste degradation by anaerobic digestion. Bioprocess. Biosyst. Eng. 2010, 33, 427–438. [Google Scholar] [CrossRef]
- Thorsen, A.; Lassen, A.; Andersen, E.; Christensen, L.; Biltoft-Jensen, A.; Andersen, R.; Damsgaard, C.T.; Michaelsen, K.F.; Tetens, I. Plate waste and intake of school lunch based on the new Nordic diet and on packed lunches: A randomised controlled trial in 8- to 11-year-old Danish children. J. Nutr. Sci. 2015, 4, E20. [Google Scholar] [CrossRef] [PubMed] [Green Version]
- Soma, T.; Li, B.; Maclaren, V. Food waste reduction: A test of three consumer awareness interventions. Sustainability 2020, 12, 907. [Google Scholar] [CrossRef] [Green Version]
- Yamakawa, H.; Williams, I.D.; Shaw, P.J.; Watanabe, K. Food waste prevention: Lessons from the Love Food, Hate Waste campaign in the UK. In Proceedings of the 16th International Waste Management and Landfill Symposium, S. Margherita di Pula, Sardinia, Italy, 2–6 October 2017. [Google Scholar]
- Higher Education Statistics Agency (UK Government). Higher Education Student Statistics: UK, 2019/20—Student Numbers and Characteristics. Available online: https://www.hesa.ac.uk/news/27-01-2021/sb258-higher-education-student-statistics/numbersESA (accessed on 17 November 2021).
- Office for National Statistics (UK Government): 2011 Census: Population Estimates for the United Kingdom, March 2011. Available online: https://www.ons.gov.uk/peoplepopulationandcommunity/populationandmigration/populationestimates/bulletins/2011censuspopulationestimatesfortheunitedkingdom/2012-12-17 (accessed on 18 November 2021).
- Gojard, S.; Masson, M.; Blumenthal, D.; Véron, B. To keep or not to keep? Sorting out leftovers from a refrigerator. Appetite 2021, 165, 105312. [Google Scholar] [CrossRef] [PubMed]
- Elimelech, E.; Ert, E.; Ayalon, O. Exploring the drivers behind self-reported and measured food wastage. Sustainability 2019, 11, 5677. [Google Scholar] [CrossRef] [Green Version]
- Van Bemmel, A.; Parizeau, K. Is it food or is it waste? The materiality and relational agency of food waste across the value chain. J. Cult. Econ. 2020, 13, 207–220. [Google Scholar] [CrossRef] [Green Version]
- Shaw, P.J.; Lyas, J.K.; Maynard, S.J.; van Vugt, M. On the relationship between set-out rates and participation ratios as a tool for enhancement of kerbside household waste recycling. J. Environ. Manag. 2007, 83, 34–43. [Google Scholar] [CrossRef] [PubMed]
- UK Government, National Statistics. Food Statistics in Your Pocket: Prices and Expenditure. Available online: https://www.gov.uk/government/statistics/food-statistics-pocketbook/food-statistics-in-your-pocket-prices-and-expenditure#trend-in-share-of-spend-going-on-food-and-non-alcoholic-beverages-in-low-income-and-all-uk-households-2005-06-to-2017-18 (accessed on 13 July 2021).
- Lyas, J.K.; Shaw, P.J.; van Vugt, M. Provision of feedback to promote householders’ use of a kerbside recycling scheme: A social dilemma perspective. J. Solid Waste Technol. Manag. 2004, 30, 7–18. [Google Scholar]
- Tsalis, G.; Jensen, B.B.; Wakeman, S.W.; Aschemann-Witzel, J. Promoting food for the trash bin? A review of the literature on retail price promotions and household-level food waste. Sustainability 2021, 13, 4018. [Google Scholar] [CrossRef]
- UK Government, Legislation. The Soft Drinks Industry Levy Regulations 2018. Available online: https://www.legislation.gov.uk/uksi/2018/41/contents/made (accessed on 21 July 2021).
- Jones, A.; Wu, J.H.Y.; Buse, K. UK’s sugar tax hits the sweet spot. Br. Med. J. 2021, 372. [Google Scholar] [CrossRef] [PubMed]
- UK Food Standards Agency: Nutrition Labelling. Available online: https://www.food.gov.uk/business-guidance/nutrition-labelling (accessed on 21 July 2021).
- Cecchini, M.; Warin, L. Impact of food labelling systems on food choices and eating behaviours: A systematic review and meta-analysis of randomized studies. Obes. Rev. 2016, 17, 201–210. [Google Scholar] [CrossRef]
- Schmitt, V.G.H.; Marvel Cequea, M.; Vásquez Neyra, J.M. Consumption behaviour and residential food waste during the COVID-19 pandemic outbreak in Brazil. Sustainability 2021, 13, 3702. [Google Scholar] [CrossRef]
- Neff, R.A.; Kanter, R.; Vandevijvere, S. Reducing Food Loss and Waste While Improving The Public’s Health. Health Aff. 2015, 34, 1821–1829. [Google Scholar] [CrossRef] [PubMed] [Green Version]
Figure 1.
Schematic illustration of the Venn diagram used by workshops participants to associate the category of avoidable food waste (Table 2) with causal factors (Table 1). Letters relating to each causal factor (A to M; Table 1) were placed on the Venn diagram according to the perceived type(s) of avoidable food waste generated; examples are shown.

Figure 2.
Illustration of the use of a Venn diagram to quantify the responses of participants in the workshops. The outcome is shown for nine groups participating in the November 2019 workshop, concerning the types of avoidable food waste associated with factor J (Lack of time to plan meals; Table 1). For factor J in this illustration: FWOL = 0.204, FWOP = 0.481, FWOW = 0.315 (see Equation (1)).

Figure 3.
The relative perceived contributions of causal factors (Table 1) to avoidable food waste as indicated by food waste outcome parameters (Equation (1)). Circled clusters indicate groups of factors leading to similar types of avoidable food waste or combinations thereof. Clusters comprise factors leading to (1) mainly leftovers (C and H; FWOL > 0.650), (2) mainly part consumed products (E; FWOP = 0.590), (3) mainly part consumed and whole unused products (F, G, I, J and M; FWOL < 0.180), (4) all three avoidable types of avoidable food waste (A, B, D, K and L; all FWO range from 0.256 to 0.385).


Table 1.
Common causes of avoidable food waste (edible food that is discarded without being consumed [20,21]) reported in the literature. References indicated are illustrative examples, not an exhaustive list. Letters in the left-hand column are used to refer to causes hereinafter.
| Cause (Example) | References | |
|---|---|---|
| A | Lack of awareness of the possible impact(s) food waste on the environment | [7,22,23,24] |
| B | Lack of awareness of the possible impact(s) of food waste on personal finances | [22,23,24] |
| C | Lack of knowledge about cooking/making the most of food (e.g., using leftovers) | [24,25] |
| D | Attitudes (e.g., food is undervalued; lack of desire to use food efficiently) | [26] |
| E | Consumer preferences for particular parts of food products leading to them being discarded, despite their nutritional value | [24] |
| F | Inadequate food storage conditions (e.g., lack of space in refrigerators or freezers) | [24,25] |
| G | Unsuitable food storage conditions (e.g., refrigerators too warm; cool, dark storage absent) | [24,25] |
| H | Portion sizes too big | [25,26,27,28] |
| I | Lack of planning and forethought before food shopping | [24,25] |
| J | Fluid work and/or social life: lack of time to plan meals | [24] |
| K | Fluid work and/or social life: lack of time to eat | [24] |
| L | Sensitivity to and/or concerns related to food hygiene | [24,25] |
| M | Lack of understanding regarding food safety labelling (e.g., use-by, sell-by, and best before dates) | [25,27,29] |
Table 2.
The food waste classification system applied in the present study [20,21]. N/A indicates not applicable.
| Category | Life Cycle Stage | Packaging |
|---|---|---|
| Unavoidable | Preparation residues; inedible leftovers (e.g., bones) | N/A |
| Avoidable | Leftovers | N/A |
| Whole unused | In original, unopened sales packaging | |
| Not in original packaging | ||
| Part consumed | In original, opened sales packaging | |
| Not in original packaging | ||
| Unclassifiable remainder | ||
Table 3.
Food waste outcomes (FWO; Equation (1)) for causal factors (Table 1) in relation to leftovers, part consumed and whole unused avoidable food waste (Table 2). Data shown are mean values ± standard deviation (N = 4). Instances with relatively high SD (SD > ⅓ of the mean) are shown in italics.
| Causal Factor | Food Waste Outcomes: | |||||
|---|---|---|---|---|---|---|
| Leftovers: FWOL | Part Consumed: FWOP | Whole Unused: FWOW | ||||
| A Lack of awareness of the possible impact(s) food waste on the environment | 0.324 | ±0.019 | 0.338 | ±0.009 | 0.338 | ±0.009 |
| B Lack of awareness of the possible impact(s) of food waste on personal finances | 0.270 | ±0.082 | 0.351 | ±0.025 | 0.379 | ±0.088 |
| C Lack of knowledge about cooking/making the most of food | 0.666 | ±0.136 | 0.289 | ±0.150 | 0.045 | ±0.031 |
| D Attitudes | 0.336 | ±0.065 | 0.414 | ±0.037 | 0.250 | ±0.041 |
| E Consumer preferences for particular parts of food products | 0.349 | ±0.087 | 0.584 | ±0.103 | 0.067 | ±0.133 |
| F Inadequate food storage conditions | 0.170 | ±0.070 | 0.354 | ±0.092 | 0.476 | ±0.067 |
| G Unsuitable food storage conditions | 0.135 | ±0.090 | 0.366 | ±0.074 | 0.499 | ±0.138 |
| H Portion sizes too big | 0.744 | ±0.189 | 0.230 | ±0.176 | 0.026 | ±0.032 |
| I Lack of planning and forethought before food shopping | 0.103 | ±0.075 | 0.436 | ±0.056 | 0.461 | ±0.031 |
| J Fluid work and/or social life: lack of time to plan meals | 0.124 | ±0.094 | 0.372 | ±0.120 | 0.505 | ±0.211 |
| K Fluid work and/or social life: lack of time to eat | 0.392 | ±0.100 | 0.288 | ±0.089 | 0.320 | ±0.167 |
| L Sensitivity to and/or concerns related to food hygiene | 0.278 | ±0.086 | 0.371 | ±0.007 | 0.351 | ±0.089 |
| M Lack of understanding regarding food safety labelling | 0.067 | ±0.046 | 0.379 | ±0.187 | 0.554 | ±0.165 |
Table 4.
Associations identified between type(s) of avoidable food waste and their causal factors, as indicated by FWO parameters (Equation (1)). Clusters of factors leading to similar food waste outcomes are derived from FWO values (Table 3) on the basis of their distribution on Figure 3.
| Avoidable Food Waste Type(s) Generated | Causal Factors |
|---|---|
| (1) Mainly leftovers | C Lack of knowledge about cooking/making the most of food |
| H Portion sizes too big | |
| (2) Mainly part consumed | E Consumer preferences for particular parts of food products |
| (3) Mainly part consumed and whole unused | F Inadequate food storage conditions |
| G Unsuitable food storage conditions | |
| I Lack of planning and forethought before food shopping | |
| J Fluid work and/or social life: lack of time to plan meals | |
| M Lack of understanding regarding food safety labelling | |
| (4) Similar contributions to leftovers, part consumed and whole unused | A Lack of awareness of the possible impact(s) food waste on the environment |
| B Lack of awareness of the possible impact(s) of food waste on personal finances | |
| D Attitudes | |
| K Fluid work and/or social life: lack of time to eat | |
| L Sensitivity to and/or concerns related to food hygiene |
Publisher’s Note: MDPI stays neutral with regard to jurisdictional claims in published maps and institutional affiliations. |
© 2021 by the author. Licensee MDPI, Basel, Switzerland. This article is an open access article distributed under the terms and conditions of the Creative Commons Attribution (CC BY) license (https://creativecommons.org/licenses/by/4.0/).
Share and Cite
MDPI and ACS Style
Shaw, P.J. Avoidable Household Food Waste: Diagnosing the Links between Causes and Composition. Recycling 2021, 6, 80. https://0-doi-org.brum.beds.ac.uk/10.3390/recycling6040080
AMA Style
Shaw PJ. Avoidable Household Food Waste: Diagnosing the Links between Causes and Composition. Recycling. 2021; 6(4):80. https://0-doi-org.brum.beds.ac.uk/10.3390/recycling6040080
Chicago/Turabian StyleShaw, Peter J. 2021. "Avoidable Household Food Waste: Diagnosing the Links between Causes and Composition" Recycling 6, no. 4: 80. https://0-doi-org.brum.beds.ac.uk/10.3390/recycling6040080