Article

Life Cycle Assessment of Existing and Alternative Options for Municipal Solid Waste Management in Saint Petersburg and the Leningrad Region, Russia

Department of Sustainability Science, Lappeenranta-Lahti University of Technology LUT, P.O. Box 20, FI-53851 Lappeenranta, Finland
*
Author to whom correspondence should be addressed.
Submission received: 27 January 2022 / Revised: 9 March 2022 / Accepted: 10 March 2022 / Published: 14 March 2022
(This article belongs to the Topic Solid Waste Management)

Abstract

:
A waste reform was recently introduced in Russia to divert waste from landfills. To help advance the reform, this paper presents a life cycle assessment of the municipal solid waste management system in Russia’s second largest city—Saint Petersburg—and its neighboring Leningrad region. Five scenarios were evaluated: the current state of the system (S0), its expected post-reform state in 2024 (S1), and its state improved by increased landfill gas collection (S2), by increased waste incineration (S3), and by separate collection of waste (S4). The environmental impact was assessed in terms of climate change, acidification, eutrophication, and abiotic resource depletion (fossil fuels). The results showed an overall reduction in the environmental impact of the waste management system across all impact categories and all scenarios studied. The largest reduction in all impact categories (except abiotic resource depletion) was achieved through source separation of municipal solid waste. Particularly, global warming potential was reduced from 0.328 kg CO2-eq./kg waste generated in S0 to 0.010 kg CO2-eq./kg waste in S4. Regarding abiotic resource depletion potential (fossil fuels), the incineration scenario is the most beneficial, since it reduces the impact by 573%.

1. Introduction

As the global population grows and increases its consumption of resources, municipal solid waste (MSW) management poses a challenge worldwide. The main goal of MSW management is the disposal of waste under techno-economic constraints in order to avoid harmful effects to humans and the environment. Additionally, present-day challenges in MSW management are not limited to preserving public health and protecting the environment, but also include efficient resource management and further reduction of environmental impact. The MSW management sector is associated with 3% of global greenhouse gas emissions [1]. It is also a sink of secondary resources that can be recovered [2]. Therefore, there is significant potential to improve MSW management towards achieving sustainability and circularity [1,3].
While some countries have already made significant progress in tackling waste management issues, others are only starting their development towards sustainable waste management. The latter situation applies to Russia, where the current state of waste management is in pressing need of improvement. The existing MSW management system in Russia fails to effectively handle rapidly growing amounts of waste. Landfilling remains the primary means of MSW treatment in Russia [4], available landfill capacities are approaching their limits in many regions [5], and the extent of unauthorized landfilling has become alarming.
An especially demanding situation has emerged in Saint Petersburg, the second-largest city in Russia, and in the surrounding Leningrad region. Most of the MSW generated in Saint Petersburg is transported to the Leningrad region for disposal. In 2018, the cumulative annual generation of MSW in the city and surrounding region reached 3076 Gg [6,7]; this was for a combined population of 7.1 million permanent residents [8,9]. However, ongoing waste management reform in the area aims to build a more sustainable waste management system for the city and surrounding region.
Reduction of environmental impact from waste management system is one of the most important goals in waste system development. From previous studies [10,11,12,13,14], it is evident that the application of a life cycle assessment (LCA) helps to identify local solutions for waste management, which can reduce the environmental impact. Generally, LCA has several applications in the waste sector, which include understanding existing waste management and how it can be improved [15]. In essence, the LCA method allows environmental impact to be examined for different impact categories, taking into account all stages of the waste life cycle. The effects of various waste treatment methods can be assessed and compared through the building of scenarios. Since the 1990s, LCA studies on waste management have been conducted in many parts of the world, with the most intensive use of this methodology being in Western Europe and the USA [16].
A considerable number of LCA studies have been dedicated to the MSW management systems of an entire city or region from the perspective of system improvement [17,18,19,20]. In 2020, Banias et al. [10] compared several MSW management options in the region of Central Macedonia, Greece. Here, the researchers analyzed the MSW system with regards to global warming potential (GWP), acidification (AP), eutrophication (EP), and abiotic depletion potential (ADP), among other impact categories. The environmental performances of landfilling, incineration, and recycling processes were compared to identify an optimal solution for the region. Similarly, the MSW management system of the Cluj County of Romania was studied to assess its impact on GWP, AP, EP, energy net, and other indicators [21]. The study in Cluj County aimed to identify which waste treatment scenarios are the most favorable for the environment, and the landfilling-based scenario was improved by adding composting, recycling, and incineration processes step-by-step. In this case, the last and most improved waste management scenario showed the best performance and proved the benefit of an integrated waste management system from an environmental perspective. In another study, the MSW management system in Delhi, India, was analyzed concerning GWP only [22]. The authors compared the baseline scenario to various alternatives in which waste was diverted from landfills via composting, biomethanation, pelletization, mass incineration, and combustion of refuse-derived fuel. They found that the scenario of maximum diversion from landfills showed the largest benefit for the environment.
Thus far, the environmental assessment of the MSW management system in Saint Petersburg and the surrounding Leningrad region has been limited. For example, the mathematical modeling of the MSW management system in Saint Petersburg and the Leningrad region was used by Shmelev [23] to optimize waste management from environmental and economic perspectives. In their study, the overall impact of the system was described through equivalents of CO2 emissions following the methodology for determining prevented environmental damage developed by Vershkova et al. [24]. Based on the obtained results, Shmelev [23] made recommendations for the system reform. In another article, the environmental performance of the waste management system in Saint Petersburg, alongside economical and energy performance, was studied by Rodionov and Nakata [25] using mathematical modeling. Only CO2 emissions were considered in their analysis of environmental performance. Both Schmelev’s and Rodionov and Nakata’s studies use life cycle thinking in their environmental evaluation. However, no LCA has been conducted for Saint Petersburg and the Leningrad region. Given the sparse use of LCA methodology in Russia in general, LCA studies on waste management systems are rather limited. Nevertheless, a few LCAs have been published for other Russian cities [26,27,28,29] including a recent LCA study on Moscow [30].
Thus, until recently, there has been little quantitative analysis of the environmental impact of waste management in Russia, particularly in Saint Petersburg and the Leningrad region, where research has been limited to consideration of CO2 emissions and energy generation in the waste management system. To close this gap, this paper seeks to provide a thorough analysis of the MSW management system in Saint Petersburg and the Leningrad region from an environmental perspective using LCA.
First, this paper aims to assess the environmental impact of MSW management in Saint Petersburg and the Leningrad region. This paper also analyzes the efficiency of waste treatment practices in reducing the environmental burden of MSW management in the studied area. Furthermore, this study identifies waste fractions for which treatment should be prioritized to minimize the environmental impact of waste management. Finally, it provides important insights for further development of the system and may support the process of building a more sustainable MSW management system in the studied area. The results of this study can provide the insights to MSW management development options for other regions in Russia and abroad, where similar waste characteristics and MSW management practices are relevant.

2. Materials and Methods

2.1. Life Cycle Assessment

This study employs LCA to estimate the environmental impact of the waste management system in Saint Petersburg and the Leningrad region. The LCA method is widely used for such purposes [16]. This study follows ISO 14040 [31] and ISO 14044 [32] standards. The modeling was performed in GaBi software (database version 2020.2) (Sphera Solutions GmbH, Leinfelden-Echterdingen, Germany) with the integrated ecoinvent database (version 3.7) using the “allocation, cut-off by classification” system model provided by default with the software. The analysis is mostly based on secondary data obtained from scientific literature and life cycle inventory (LCI) databases; the use of primary data is limited. Where relevant, the treatment of inventory data is reported in Supplementary Materials. MSW generated in the area is regarded as zero-burden. To deal with the multifunctionality of the studied system (i.e., its multiple product outputs), the avoided burden approach is applied. However, this study cannot be regarded as being a fully consequential LCA study, as it is limited to consideration of average effects rather than marginal effects.

2.2. Goal and Scope

The functional unit used in this study is the mass of MSW generated in Saint Petersburg and the Leningrad region annually, which was 3076 Gg of MSW in 2018 [6,7]. Geographically, the analysis covers the MSW management of two federal subjects of Russia: the Leningrad region and the federal city of Saint Petersburg. The studied system boundaries include processes which reflect the situation in the studied area, however, the infrastructure can be different depending on various factors, such as the level of investment available. Regarding the period covered, unless stated otherwise, the data used to represent the current state of the system relates to the year 2018, which was chosen because it is the year for which the most detailed statistics were available. The first alternative scenario considers changes planned for 2024, while the other scenarios are assumed to take place in the more distant future. The MSW management system is assessed in terms of GWP over a 100-year time horizon (also referred to as “Climate change” as a midpoint impact category), AP, EP, and abiotic resource depletion potential (fossil fuels) (ADPf). CML 2001 [33] is used as an impact assessment method.

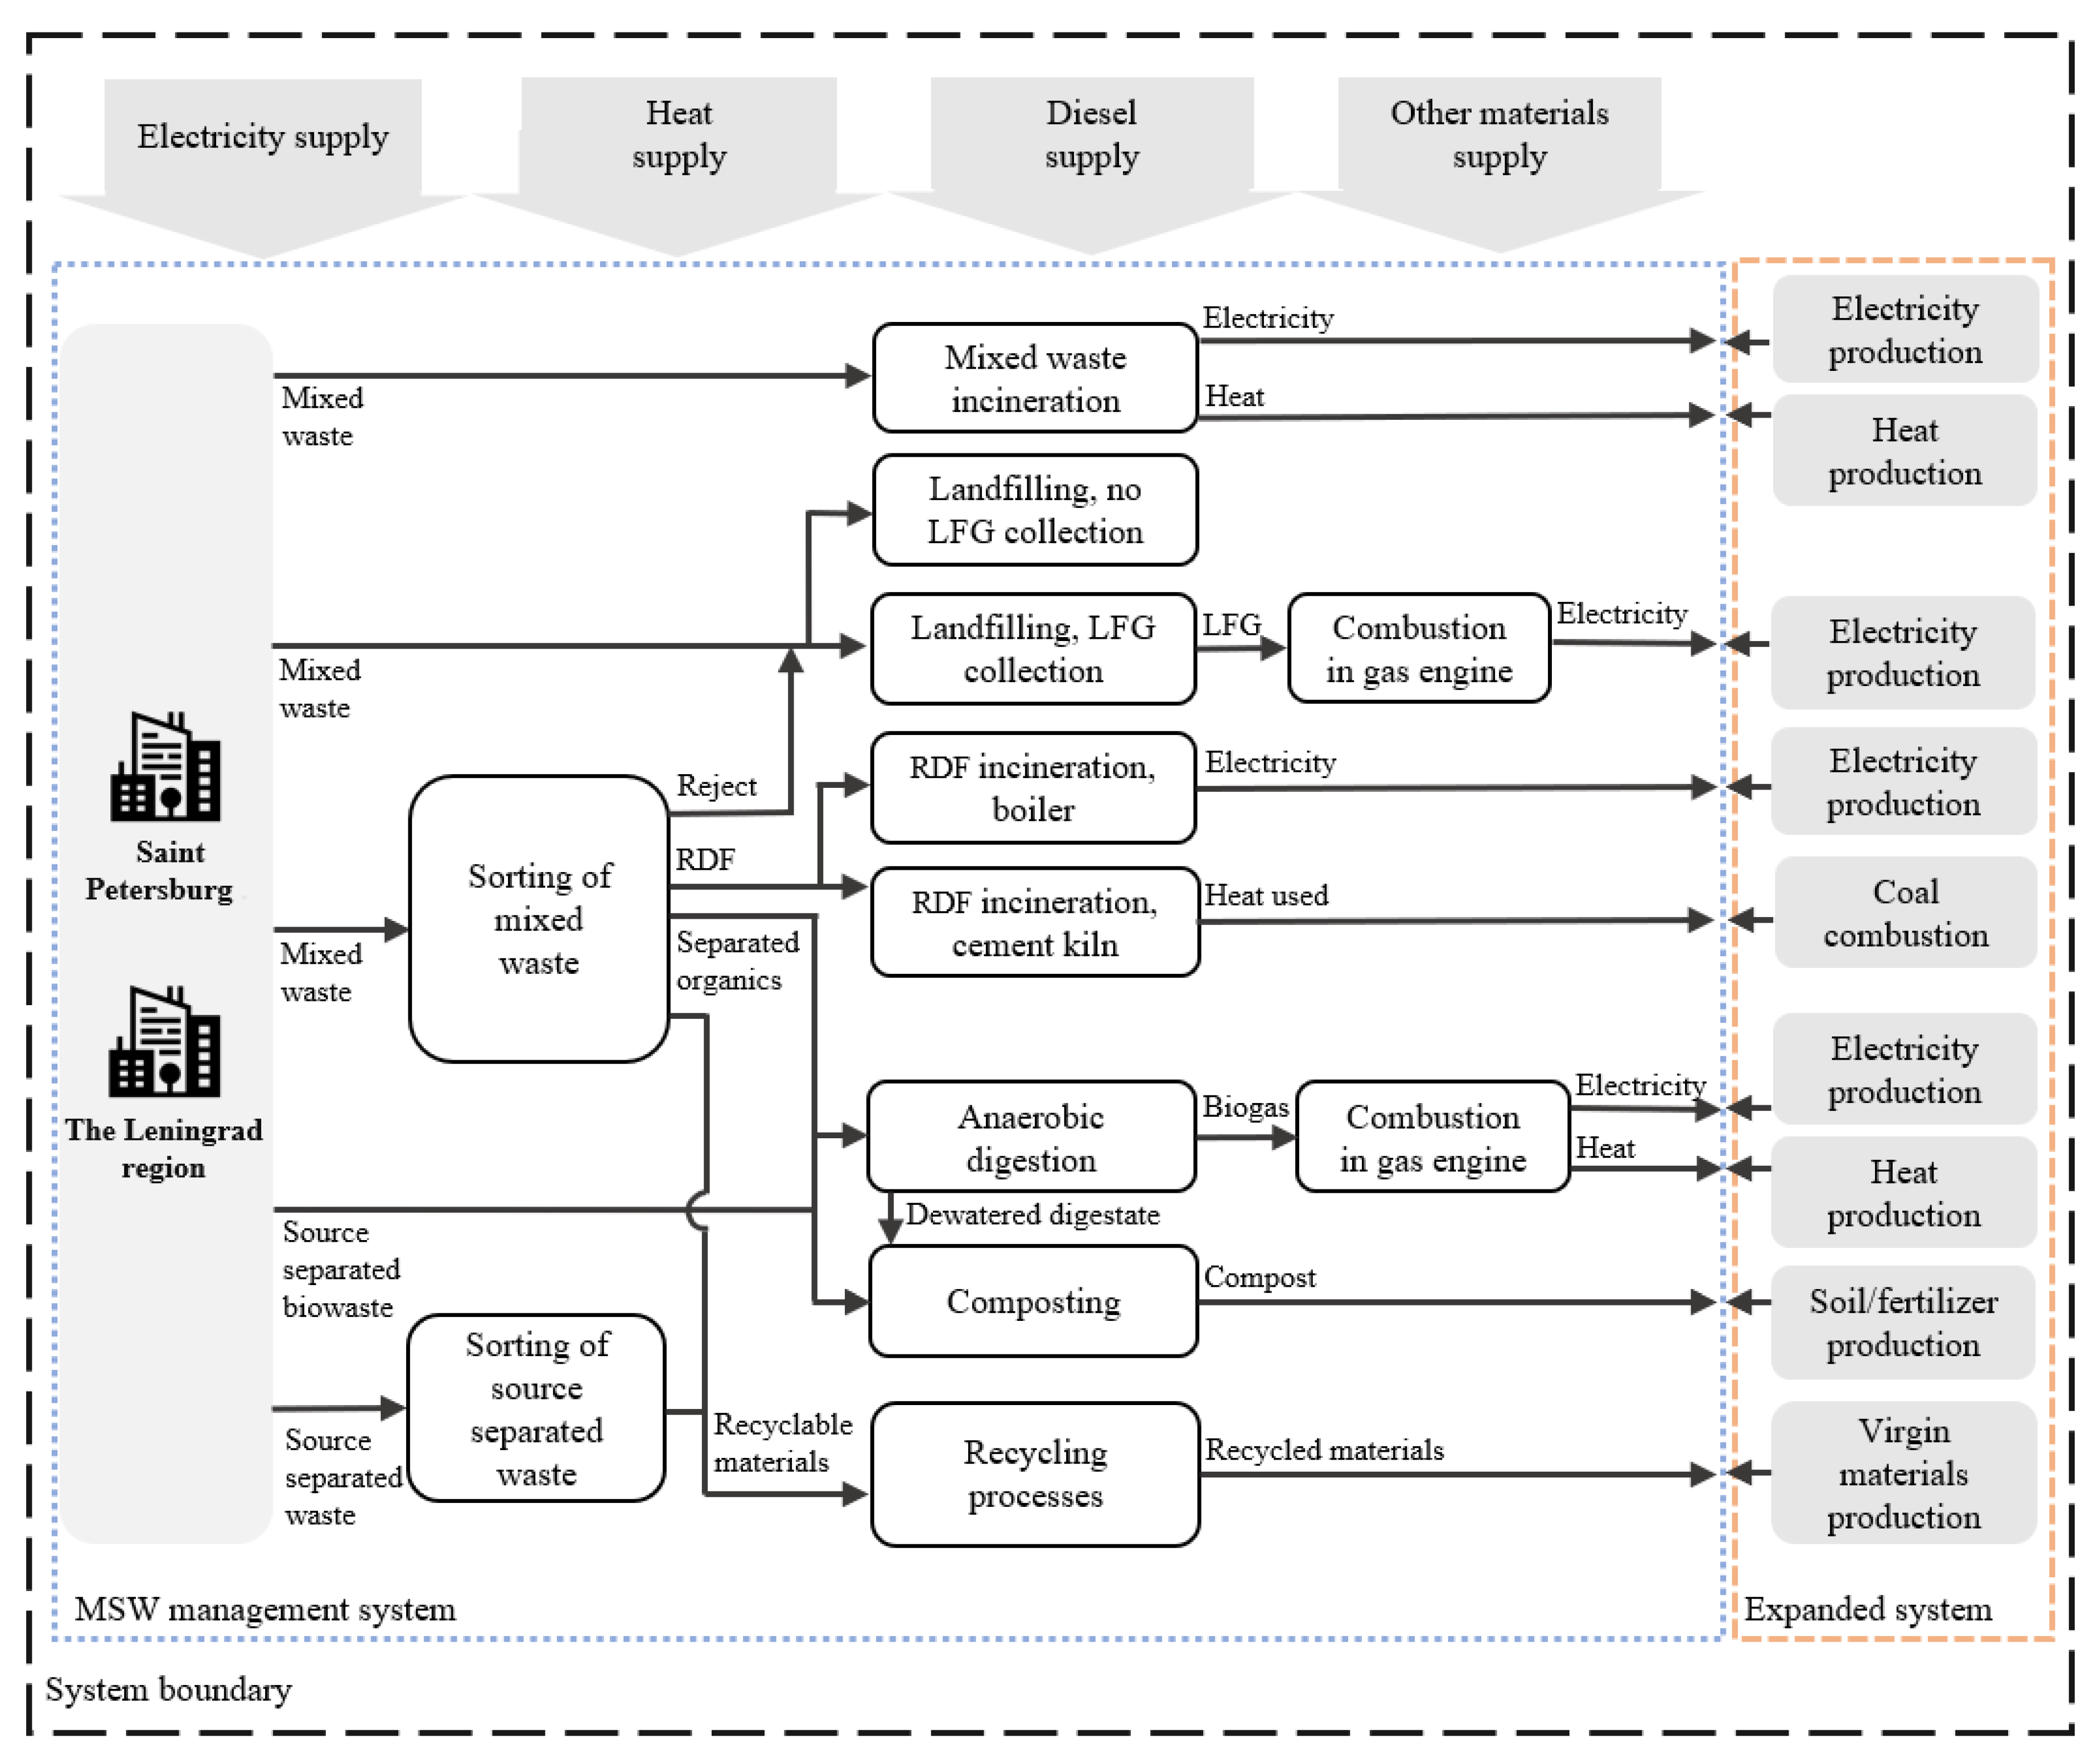
2.3. System Boundary
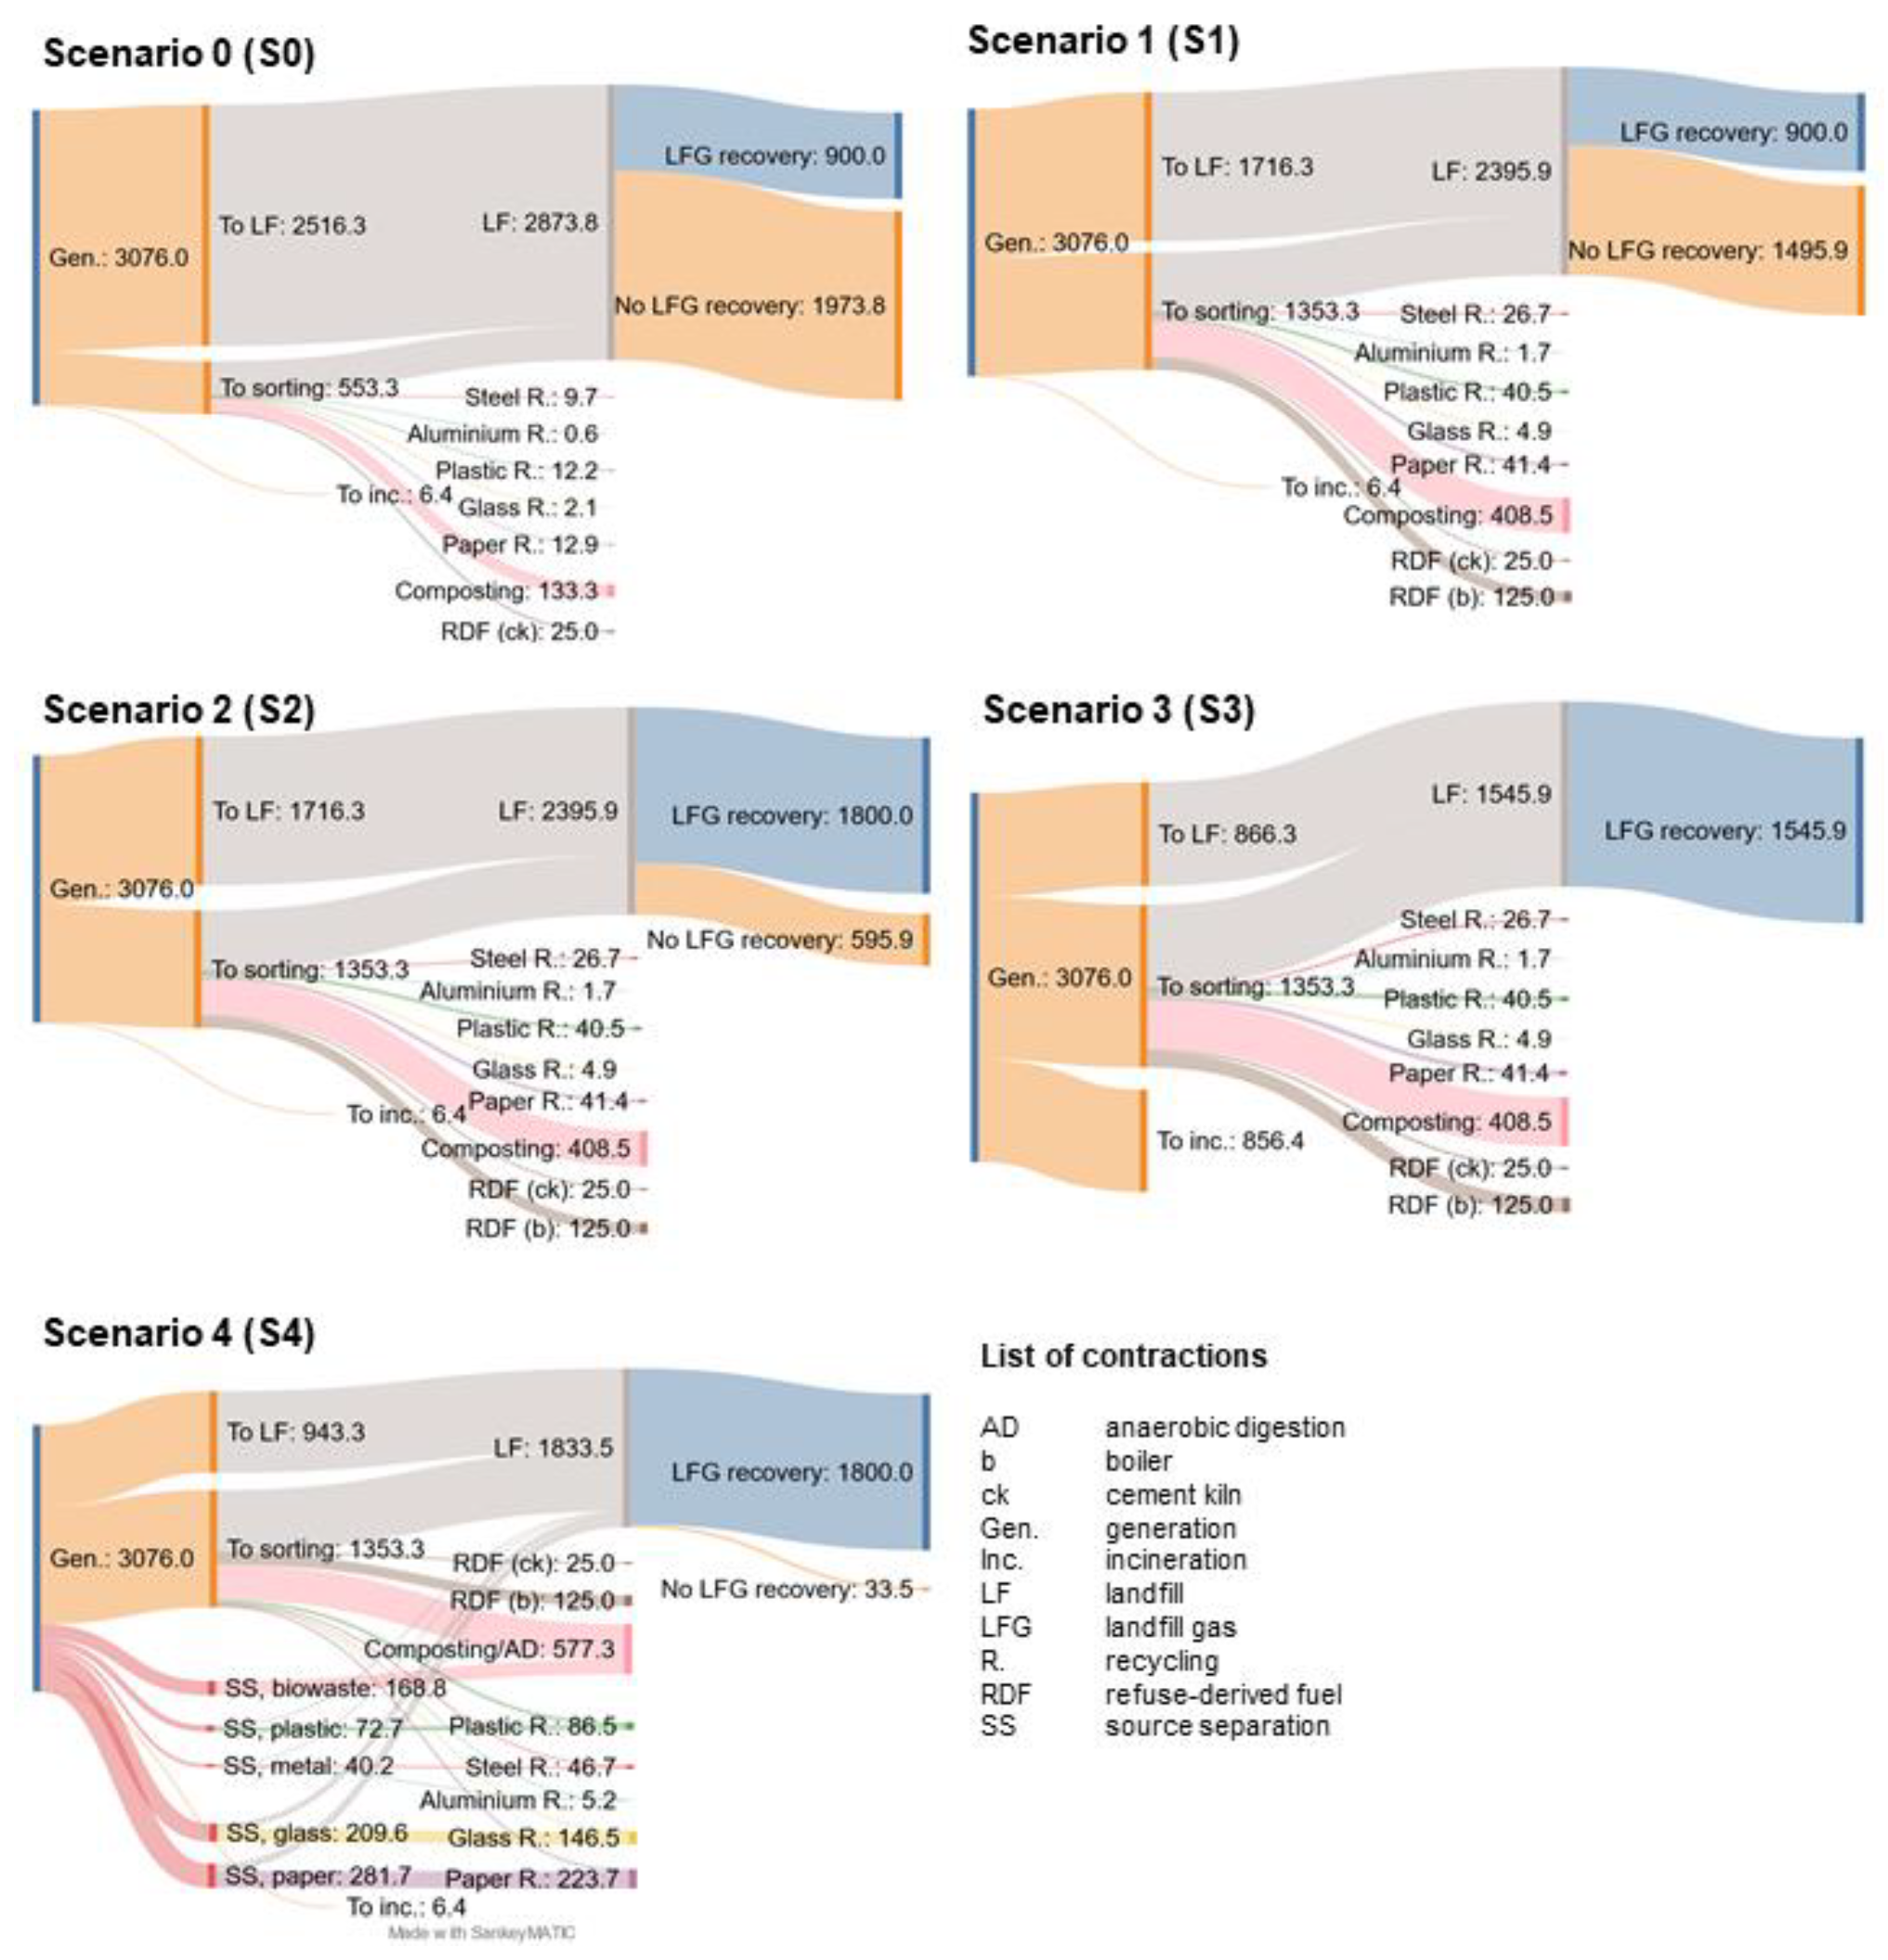
This study’s analysis covers the entire life cycle of waste, i.e., bin-to-grave. Therefore, the system boundary includes processes for waste handling (i.e., collection and transportation, sorting, composting, anaerobic digestion (AD), refuse-derived fuel (RDF) combustion, mixed MSW combustion, recycling, and landfilling) and avoided processes (primary production of energy and materials) as a part of the system expansion approach. An illustration of the system boundary for this study can be found in Figure 1.

2.4. Scenarios

2.4.1. Scenario 0 (S0)—Baseline Scenario

The baseline scenario represents the current state of MSW management in the area and uses waste quantity and infrastructure data from 2018. In the baseline scenario, no separate collection of recyclable waste fractions of MSW is considered because MSW is normally collected using a one-bin system. However, 18% of MSW (553 Gg) undergoes separation at sorting stations [6,7]. Recyclables separated from the mixed waste (38.3 Gg) are sent to recycling, and an organic fraction (133.3 Gg) is composted. RDF production (25 Gg) occurs at one of the sorting facilities [34], and incineration is used for 0.2% of generated MSW (6.4 Gg/year) [35]. Meanwhile, MSW that is not separated for recycling or treated thermally is disposed of in landfills (93.4% of MSW). A landfill gas (LFG) collection system is implemented at one of the operating landfills, where 900 Gg of the MSW generated in the studied system is landfilled [36]. The rest of the MSW is landfilled without LFG collection. A waste flow diagram for this scenario and the other studied scenarios is presented in Figure 2.

2.4.2. Scenario 1 (S1)—Development Facilitated by the Reform

S1 represents MSW management in 2024 following current plans for waste reform in the area. The development of the system is represented by additional sorting capacity planned in the Leningrad region. More detailed information about the reform can be found in Section 1 of the Supplementary Materials. The new sorting facilities, the Gatchina plant and the Kingisepp plant, will have capacities of 500 Gg/year (at the first construction stage) and 300 Gg/year, respectively [35]. According to the available information, mechanical sorting, which includes separation of organic waste for composting and separation of other materials for recycling, followed by RDF production, is planned at the Gatchina plant [37]. At the Kingisepp plant, the mechanical separation of organic waste for composting and manual separation of other recyclable fractions are planned [38].

2.4.3. Scenario 2 (S2)—Extended Landfill Gas Collection

Scenario 2 doubles the amount of waste landfilled with LFG collection (to 1800 Gg of MSW) compared to the baseline scenario (S0) and Scenario 1 (S1). No other changes to the studied system were modeled.

2.4.4. Scenario 3 (S3)—Increased Incineration

Mass incineration of MSW is modelled in addition to the increased LFG collection. The additional amount of MSW sent to incineration is 850 Gg/year (200 Gg/year generated in the Leningrad region and 650 Gg/year generated in Saint Petersburg). Using these values, the total amount of incinerated MSW approaches the 2015 European average [39], which is equal to 27% of MSW. Incineration is applied to the MSW stream, which, in other scenarios, is sent directly to landfills; it includes all waste that does not undergo LFG recovery and part of the waste that does. In S3, recycling of metals is also increased due to metals recovery from incineration.

2.4.5. Scenarios 4.1 (S4.1) and 4.2 (S4.2)—Source Separation Scenarios

In Scenarios 4.1 and 4.2, increased waste incineration is replaced by source separation of paper and cardboard, metal, plastic, glass, and biowaste. Certain shares of the source-separated materials end up in landfills (Figure 2), as additional separation at sorting plants is considered to remove contaminants. In S4.1, all separated biowaste is composted. However, in S4.2, AD is used to treat a part of the biowaste instead of composting it. AD is only applied to organic waste that is separated at new sorting plants introduces in S1 and to separately collected biowaste, leaving the baseline state of biowaste treatment intact.

2.5. Inventory Data

2.5.1. Waste Data

The MSW generation values used in the study are 2235 Gg/year in Saint Peterburg and 841 Gg/year in the Leningrad region, as reported for the two areas in 2018 [6,7]. The latest available MSW composition data from Saint Petersburg and the Leningrad region (Table 1) were used [34,40]. Changes in waste generation and composition over time are not considered in the study.
In this study, the non-ferrous metal fraction is assumed to be comprised of aluminum, while the ferrous metal fraction is comprised of steel. It is assumed that the stream of recovered plastic waste is composed of polyethylene terephthalate (PET) and high-density polyethylene (HDPE). Based on the content of PET and HDPE in the waste composition of Saint Petersburg [34], PET is assumed to constitute 75% of the flow, with the rest being HDPE.

2.5.2. Waste Collection and Transportation

Waste collection and transportation are modeled based on information from regional waste management plans [35,41]. Since regional waste management plans do not contain information on transfer stations, reloading of MSW onto larger vehicles is assumed to be done next to sorting facilities. Approximate distances are calculated based on location of waste treatment and disposal sites operating in 2018 and planned for 2024. It was assumed that AD plants (S4.2) are located next to sorting facilities. Incineration of additional amounts of MSW (S3) is assumed to happen at the same site where waste is incinerated in the baseline scenario (S0). MSW collection in Saint Petersburg is modeled using trucks with a small payload capacity, while larger trucks are assumed to be used for further waste transportation from transfer stations in the city as well as waste collection and transportation in the Leningrad region. More detailed information on processes used in modeling and distances can be seen from the Supplementary Materials, Section 2.1.

2.5.3. Landfilling

To assess the impact of waste decomposition in landfills on climate change, methane emissions are calculated. Methane generation potential is calculated based on the IPCC default model [42] for paper, wood, food, and textile fractions. The parameters of the LFG generation model are assumed based on data from Lee et al. [43] and IPCC [42]. Diesel uses for landfill operations and emissions from diesel combustion are also considered. The estimation of leaching process parameters is challenging mainly due to limited site-specific data. Therefore, leaching is modeled based on studies conducted by Liikanen et al. [44] and Havukainen et al. [45]. According to the available design documentation for landfills in the studied region, no treatment of leachate takes place [46,47]. LFG collection occurs for a part of the disposed MSW, which is defined by the scenarios. In this study, the LFG collection rate is assumed to reach 53% [48], while emissions from LFG combustion and flaring are assumed to be identical to those presented by Bacchi et al. [49]. According to data from the Novyy Svet EKO landfill in the Leningrad region, energy recovered from LFG combustion displaces primary electricity production. The landfilling processes were modeled by authors because the existing databases unit processes were not available for the specific waste composition and the landfill technology. A detailed inventory of the landfilling process can be found in the Supplementary Materials, Section 2.2.

2.5.4. Mixed Waste Sorting

Waste sorting plants are modeled using data from regional waste management plans and Rospotrebnadzor databases [35,41,50]. In the model, the sorting of mixed MSW is performed in two ways. The first option for the sorting process is the use of manual sorting to recover paper and cardboard, glass, plastic, and aluminum, which is combined with mechanical separation of ferrous metals and, possibly, the sorting of organic waste via a screen. Recovery rates for manual sorting of recyclables are adopted from data gathered by Il’inykh et al. [51]. The overall recovery rate for recyclables, excluding separated organics, is estimated to be as low as 3% of MSW input flow. This low value is dictated by the generally low recovery rates found in manual sorting [52] and is particularly relevant for manual separation in the MPBO-2 plant [53]. The second option for the sorting of mixed MSW is mechanical sorting (with some additional manual sorting), which is implemented to separate ferrous metal, aluminum, plastic, paper and cardboard, and the organic fraction. RDF is produced after recyclables are recovered. The mass balance of this process is based on data presented in the design documentation of a mechanical sorting plant in Saint Petersburg [46]. Based on information from OOO “KOSMOS” [46], the glass fraction is rejected in this case. Sorting facilities, their capacities, and recovered fractions are listed in detail in the Supplementary Materials, Section 2.3, while the inventory of sorting processes is given in Supplementary Materials, Section 2.4.

2.5.5. Composting of the Organic Fraction

Windrow composting is applied to screening reject (in all scenarios) and separately collected biowaste (only in S4). The composition of the screening reject is based on data from design documentation of a mechanical sorting plant in Saint Petersburg [46]. Process parameters are modeled based on data from Boldrin et al. [54], Grzesik and Malinowski [55], Lima et al. [56], AO “DAR/VODGEO” [40], and LIPASTO [57]. Leachate is assumed to be collected for moisturizing the waste in windrows so no leachate enters the environment. Additionally, for the MPBO-2 sorting plant in Saint Petersburg, composting in a rotating drum is modeled prior to further maturation in windrows. Direct emissions from waste treated in this way are assumed to be identical to those used for windrow composting. Due to the low quality of the compost produced from screening reject, it is used as a landfill cover, and it is therefore assumed to substitute soil. Soil excavation is modeled via the GaBi unit process “EU-28: Excavated soil with digger (EN15804 A5)”. Compost which is produced from separately collected biowaste is assumed to be of good quality and to substitute mineral fertilizers on the market. Detailed data on modeling can be found in the Supplementary Materials, Section 2.5.

2.5.6. Anaerobic Digestion of Organic Fraction

Emissions from AD are modeled based on the data for thermophile single stage digestion process from the ecoinvent database (3.7). The unit process applied in modeling is “RoW: treatment of biowaste by anaerobic digestion”. Power and heat production are modeled as a result of biogas combustion using unit process “RoW: heat and power co-generation, biogas, gas engine”, from ecoinvent. Efficiencies of heat and electricity production used in this process are 53% and 43%, respectively. The AD process used in the model includes dewatering of digestate for subsequent composting of the dried fraction. The composting of dewatered digestate is modeled by authors using the data for windrow composting from Section 2.5 in the Supplementary Materials. More details about modeling of AD are given in the Supplementary Materials, Section 2.6.

2.5.7. Recycling Processes

In all scenarios, recycling processes for HDPE, PET, steel, aluminum, glass, and paper and cardboard waste are modeled. For PET, HDPE, and paper, unit processes from the ecoinvent 3.7 database are used in the modeling of recycled and virgin production. It is assumed that the most probable use of waste paper is the production of tissue paper [58]. The impact of steel and aluminum recycling is estimated using processes from the GaBi database (version 2020.2). The glass recycling process is modeled based on the data for container glass obtained from Greene [59] and Landi et al. [60], while avoided production is based on data from ecoinvent 3.7. All data taken from the ecoinvent database refer to the “allocation, cut-off by classification” system model. The impact of fossil fuel consumption was modeled using the cumulative energy demand (CED) impact category for processes, which was retrieved from ecoinvent. Substitution ratios and other more detailed information on modeling are given in the Supplementary Materials, Section 2.7.

2.5.8. Incineration of Mixed MSW and RDF

Incineration is modeled using unit processes from the GaBi database that correspond to specific waste fractions. In all scenarios, incineration is assumed to occur with both electricity and heat recovery. Additionally, according to Bushikhin et al. [61], RDF produced in Saint Petersburg (S0) is utilized in a cement kiln and replaces the use of coal. It is assumed that additional RDF produced after the reform (S1) is combusted via a mono-combustion process in a boiler, resulting in electricity production. In this case, the efficiency of electricity production equals 22%, which is the average efficiency for mono-combustion of RDF in Europe [62]. No heat is recovered. The lower heating value of RDF amounts to 15.9 MJ/kg of RDF as received [61]. Detailed data on the modeling of mixed waste and RDF incineration is given in the Supplementary Materials, Sections 2.8 and 2.9.

2.5.9. Source Separation of MSW

In S4, the average EU-28 capture rates are used for source separation of MSW (i.e., 16% for biowaste, 44% for glass, 16% for metal, 12% for plastic, and 36% for paper and cardboard) [63]. The contamination rate is assumed to reach 30% of the source-separated waste flow. As described by Pressley et al. [64], negative manual sorting is applied to source-separated waste streams to remove contaminants. The inventory of this process is given in the Supplementary Materials, Section 2.4.

2.5.10. Energy Generation

In this study, current average data is used to model energy supply. Russian electricity generation is largely based on the use of natural gas as an energy source, with some electricity supplied by nuclear, hydro, and coal-fired units. In 2018, the share of natural gas in electricity generation amounted to 47%, while the total share of fossil energy sources equaled 64% [65]. Heat production in Saint Petersburg and the Leningrad region mostly relies on natural gas [66]. Natural gas is therefore assumed to be the source of thermal energy. GaBi unit processes “RU: Electricity grid mix 1 kV–60 kV” and “RU: Process steam from natural gas 90%” are applied to model the energy supply for processes and to avoid energy production. Diesel supplies for processes are modeled using the unit process “RU: Diesel mix at filling station (100% fossil)”.

2.6. Sensitivity Analysis
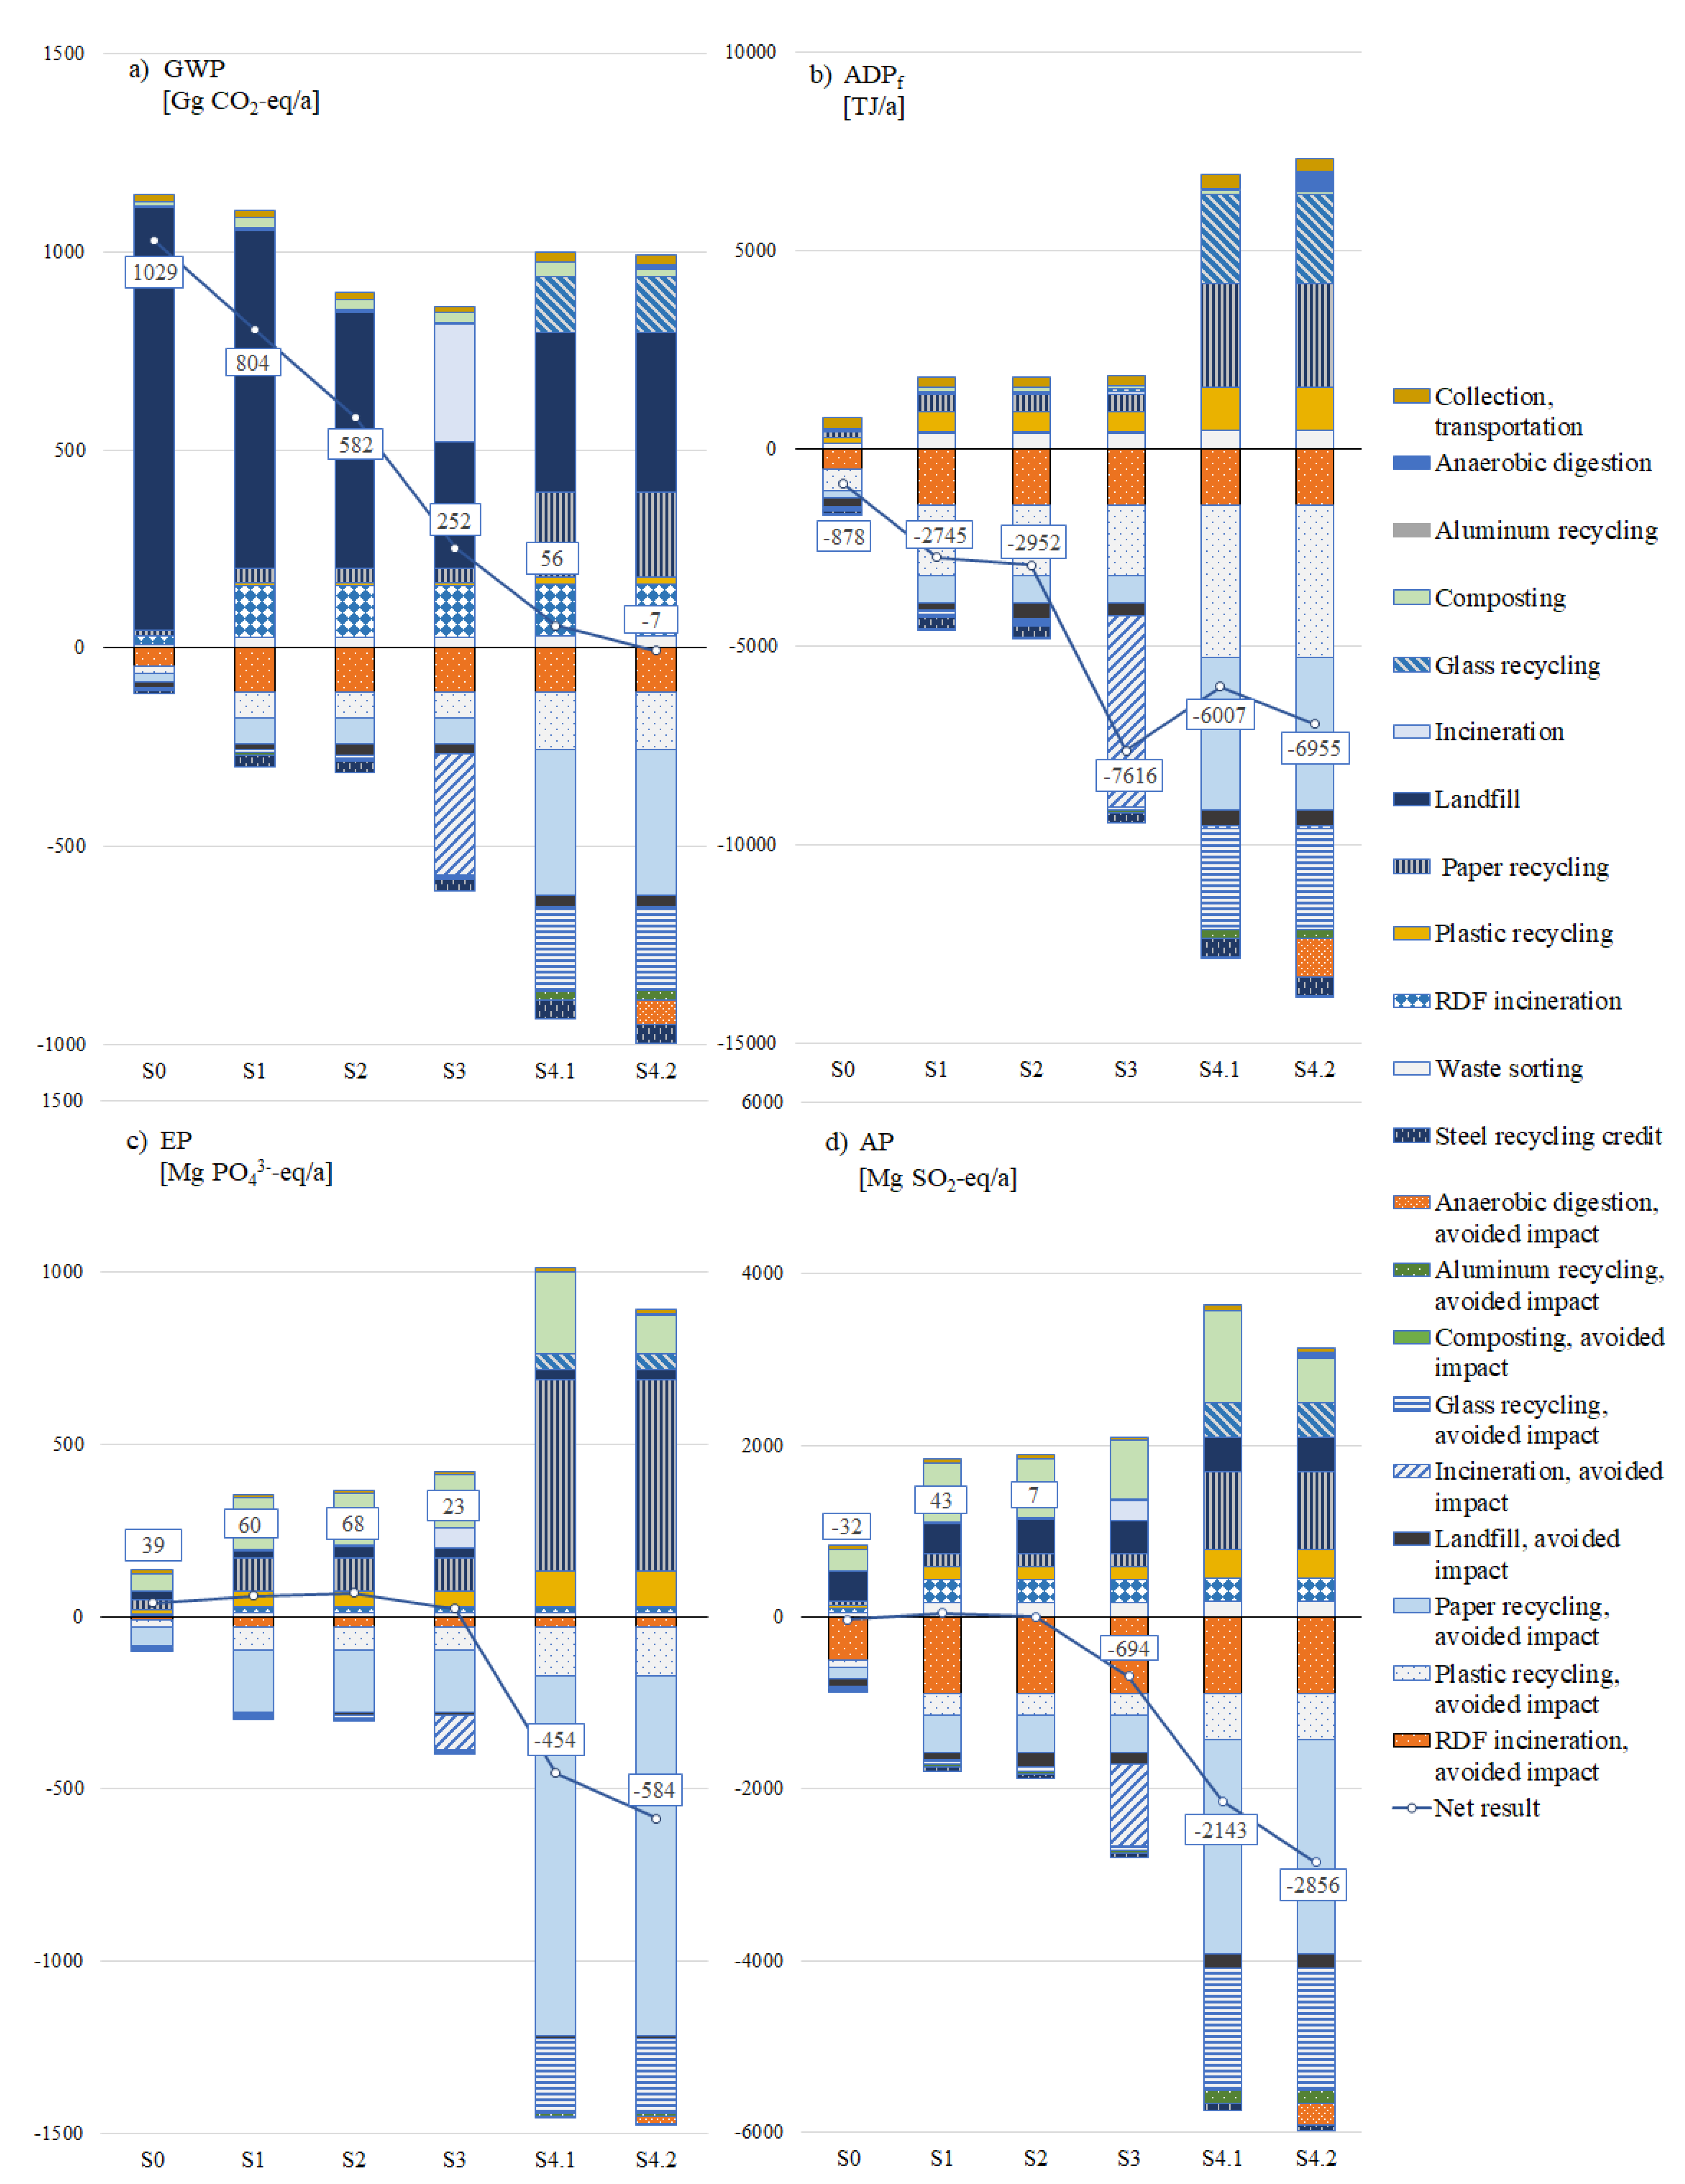
Sensitivity analysis is performed in three parts. The first step is a contribution analysis in which the overall result is subdivided into processes to identify those that have the greatest impact. Then, process parameters are studied in a perturbation analysis to find parameters, changes of which influence the results of this study the most. The impact of modeling choices is also studied to test the robustness of the results of the choices made.
In the perturbation analysis, sensitivity ratios (SR) are calculated according to Clavreul et al. [67]. The value of each parameter is changed by 10%, and SR is derived using the equation:
S R = Δ   r e s u l t i n i t i a l   r e s u l t Δ   p a r a m e t e r i n i t i a l   p a r a m e t e r
When an SR value equals 2, the result is increased by 20% due to a 10% change in the parameter value. To avoid situations where the changes in a result with small absolute values produce high SR scores (due to large relative changes in the result), normalization of SRs is applied. Further details on perturbation analysis are found in the Supplementary Materials, Section 3.1.

3. Results

Figure 3 presents the impact assessment results for GWP, EP, AP, and ADPf of the studied scenarios. All impact categories show an overall decrease across the scenarios. GWP is reduced from 0.334 kg CO2-eq./kg MSW generated in S0 to −0.002 kg CO2-eq./kg MSW in S4.2. Meanwhile, ADPf is negative across all scenarios (demonstrating that impact has been avoided), which was achieved through the substitution of conventional products and energy. Similarly, due to the emissions avoided by the utilization of RDF, the AP of the studied system in the baseline scenario, S0, is negative (−0.01 g SO2 eq./kg MSW). EP of MSW management system equals 0.01 g PO43− eq./kg MSW in S0.
According to the results of this study, the increase of mixed waste sorting with RDF production that is planned to be achieved by 2024 (S1) can reduce GWP by 22% (to 0.261 kg CO2-eq./kg MSW generated) and ADPf by 213% (from −0.285 MJ/kg MSW generated to −0.892 MJ/kg MSW), while also slightly increasing EP and AP due to increased composting. Doubling of the amount of waste disposed of in landfills with LFG collection (S2) is estimated to cut GWP by 43% (to 0.189 kg CO2-eq./kg MSW generated) compared to the baseline scenario; other impact categories do not change significantly with this advancement. When mixed MSW incineration is added (S3), GWP can be expected to drop by 76% (to 0.082 kg CO2-eq./kg MSW) compared to S0. In this scenario, a sharp reduction of ADPf occurs due to the substitution of conventional energy production (by 768% (or to −2.476 MJ/kg MSW generated) from S0), and AP declines substantially. Waste separation at source (S4.1) is estimated to approach nearly zero GWP and to reduce EP and AP sharply, though a smaller reduction of ADPf is achieved (by only 584% (to −1.953 MJ/kg MSW generated) from S0). In this scenario, GWP could be further reduced if biowaste were treated in AD (S4.2); the overall reduction of GWP would then reach 101% instead of 95% (to −0.002 kg CO2-eq. instead of 0.018 kg CO2-eq. per each kg of generated MSW).

3.1. Contribution Analysis

Figure 3 also shows the environmental impact of individual processes of the MSW management system for each impact category. The categories in the results represent the processes as described in the LCI section of this study in the corresponding amounts of waste, as reported in Figure 2. The impact from steel recycling is the only one shown without subdivision into direct and avoided impacts; this is due to the use of a single unit process in the modeling of steel recycling, which includes avoided impacts. The graph shows that landfilling, paper and cardboard recycling, and incineration of mixed MSW and RDF make the largest contribution to direct and avoided environmental impact of the system. To further explore these results, specific net impact potentials were calculated for the studied processes. For of the baseline scenario (S0), the results are given in Table 2 (GWP and ADPf). Specific net impact potentials of the processes in each scenario and all impact categories can be found from the Supplementary Materials, Section 4.3.
Landfill disposal makes a considerable contribution to GWP when applied to a corresponding amount of MSW. In the baseline scenario, landfilling results in 0.37 kg CO2-eq emitted per kg of MSW landfilled. Then, when all waste is landfilled with LFG collection (S3), 0.19 kg CO2-eq are emitted per kg of MSW (see the Supplementary Materials, Section 4.3). In other studies, landfilling with the collection of LFG has been found to emit from −0.07 to 0.16 kg of CO2-eq/kg [68] and 0.25–0.45 kg CO2-eq/kg [56]. The differences in the results are explained by variations in the parameters of LFG collection used in modeling and the different shares of organic waste in disposed MSW. Particularly, the LFG collection rate ranges from 50% to 80% in the study by Manfredi et al. [68] and 45% to 95% in the study by Lima et al. [56], while it reaches only 53% in this LCA for Saint Petersburg and the Leningrad region. Additionally, the share of biowaste was almost twice in the study conducted by Lima et al. [56] compared to this LCA; it constituted 55% and 27%, respectively.
The recycling of paper and cardboard makes a rather large contribution to both direct and avoided impacts in all impact categories, but especially in GWP. In this study, the emission factor of the paper recycling process equals 1.90 kg CO2-eq/kg recycled paper produced. In turn, virgin paper production has a GWP of 3.90 kg CO2-eq/kg paper produced. Both values are significantly larger than those reported in other studies on tissue paper production. For example, Gemechu et al. [69] report that the GWP of tissue paper production in Spain is 1.31 and 1.88 kg CO2-eq per kg of recycled and virgin paper, respectively. Ta Thi and Thi Anh [70] estimated that the GWP of recycled and virgin tissue paper in Vietnam is 0.75 and 1.06 kg CO2-eq per kg of tissue paper [70]. Several environmental product declarations (EPD) [71,72,73,74,75] indicate that the GWP of virgin tissue production is at the level of 1.28–1.86 kg CO2-eq/kg. However, the technology and energy sources used for paper production were found to be crucial to LCA results [76]. As global and rest-of-world data on paper production were used in this study to model production in Russia, high emission factors are at least partly caused by higher energy consumption and a more greenhouse gas-intensive energy mix. Merrild et al. [76] estimated that the GWP of paper recycling ranges from 0.5 to 1.5 kg CO2-eq per kg of waste paper when the substitution of virgin paper is not considered and from −1.3 to 0.4 kg CO2-eq per kg of waste paper with virgin replacement. In this study, the net emission factor of paper recycling amounts to −1.14 kg CO2-eq/kg of wastepaper. Furthermore, tissue paper production processes contribute crucially to EP and AP. In the case of primary production, the net emission factors used in this study are 0.03 kg SO2-eq and 0.01 kg PO43−-eq per kg of paper. The values are close to or are in the range of values reported in EPDs on tissue paper of 0.1–0.2 kg SO2-eq and 0.002–0.011 kg PO43-eq [71,72,73,74,75].
Incineration of mixed MSW has a significant impact on the total result in S3. Replacement of electricity from the national grid and natural gas-based heat results in considerable savings in the ADPf impact category: each kilogram of waste incinerated results in avoided extraction of 5.56 MJ of fossil fuels in S3 (see the Supplementary Materials, Section 4.3). The total ADPf reduction is substantially larger in the incineration scenario compared to the recycling-focused scenario (S4). Firstly, this is because there is almost no energy consumption during incineration, unlike in recycling processes. Secondly, this is because the ADPf category only accounts for fuels and not resources, so the benefits of recycling are not fully represented. Due to the higher energy content of RDF, even higher net specific savings of fossil resources are obtained by RDF incineration. When RDF is utilized in a cement kiln only (S0), the savings are 20.7 MJ/kg of RDF (Table 2). In other scenarios, the additional RDF combustion in boilers results in resource savings in overall RDF utilization that are roughly half of those found in S0. This is because a major part of the RDF is used to produce electricity, which has 22% energy conversion efficiency. Similar to ADPf, the GWP drops when RDF utilization in boilers is added. Calculated for each specific technology, the GWP of 1 kg of RDF equals −0.92 kg CO2-eq when RDF is used instead of coal in cement kilns, and 0.36 kg CO2-eq when it is incinerated in boilers. Incineration of both mixed MSW and RDF also contributes significantly to the reduction of AP. RDF utilization causes low AP primarily due to the avoided combustion of coal, while the considerable reduction in AP is explained by the large quantity of MSW in mass incineration.

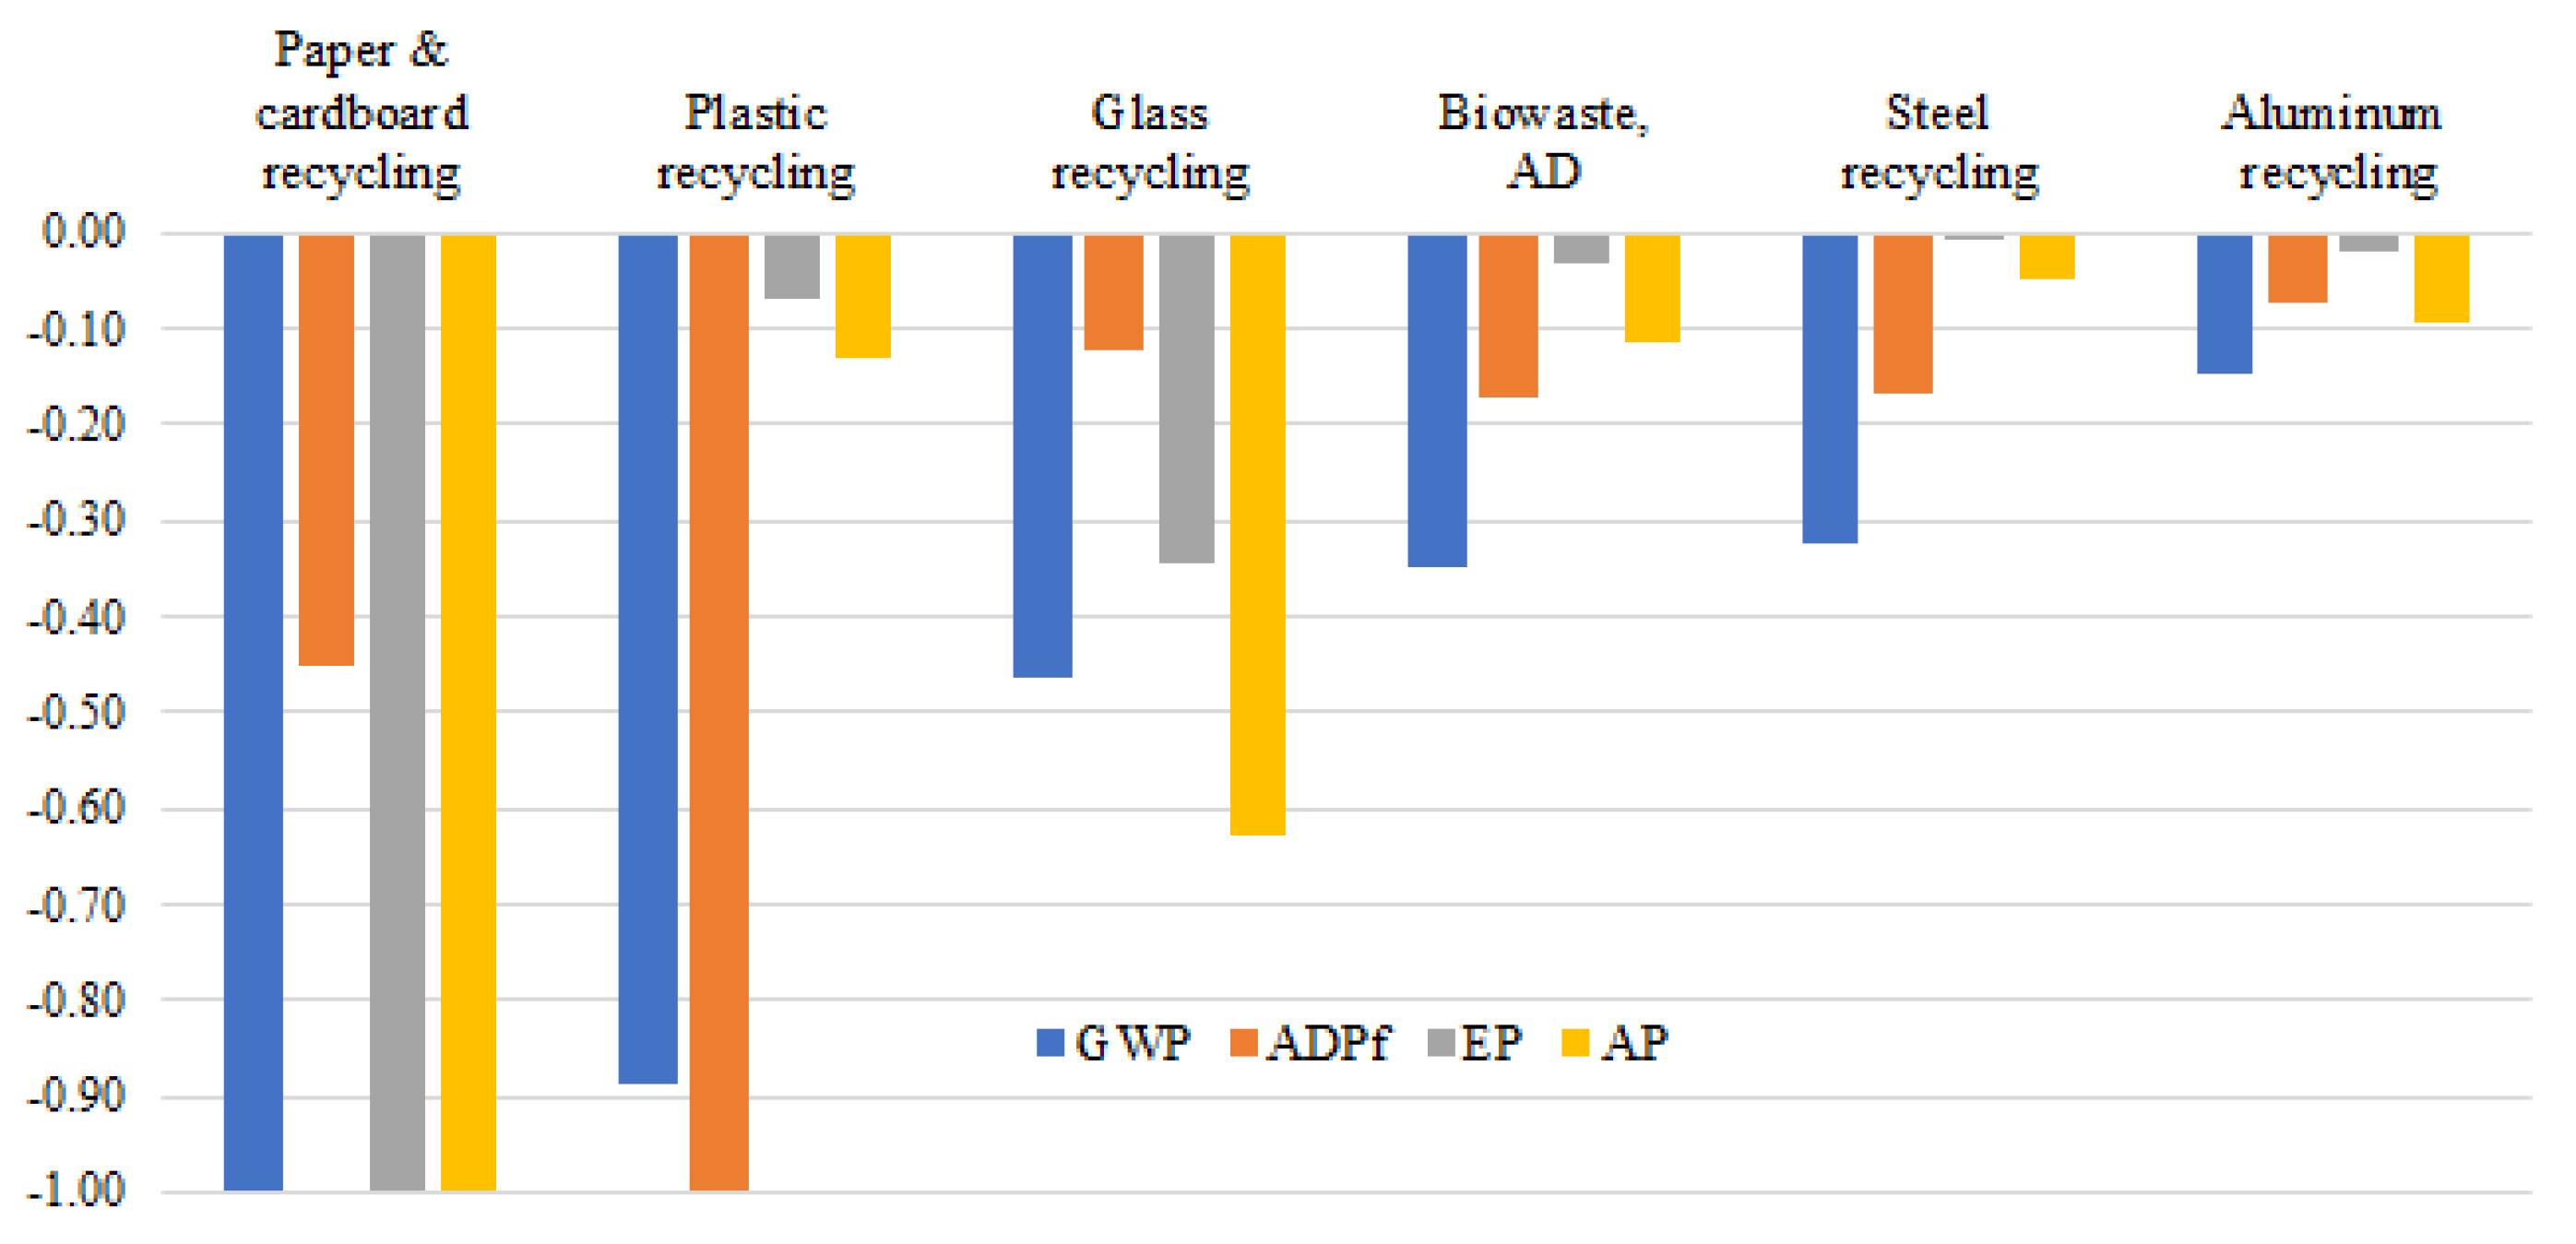
3.2. Enviromental Impact of Recycling of Different Waste Fractions

Among the different waste fractions, the recycling of paper and cardboard waste achieves the most significant reduction in environmental impact, particularly in GWP, EP, and AP; this can be seen from Figure 4, which shows normalized values (0–1 range) of impact scores for recycling and biowaste treatment processes in each impact category. An important reason for this significant reduction in environmental impact is the relatively large share of paper and cardboard contained in MSW, combined with its high potential for source separation and consequent recycling. Coupled with relatively low net specific impact potentials (Table 2, Section 4.3 of the Supplementary Materials), these parameters make recycling of paper and cardboard fraction the most beneficial for environmental impact reduction. Plastic recycling, on the contrary, reduces ADPf the most, which is due to its fossil origin. Plastic recycling also substantially contributes to the mitigation of climate change. Glass recycling appeared to be the second-best option to reduce the EP and AP of the system. Although net specific impact potentials of aluminum recycling are by far the most favorable for reducing the environmental impact than those of other waste fractions, the insignificant amount of aluminum recovered makes the total impact of the process the least noticeable for MSW management system. It is important to understand that MSW composition, sorting efficiencies, and capture rates of recyclables affect the potential to reduce the environmental impact in a given area. Therefore, the conclusions of this study are particularly dependent on the assumptions for recovery efficiencies of recyclable fractions.
In comparison to other waste fractions, and despite the high share of organics in MSW, treatment of organics is found to have relatively low importance for minimization of GWP, ADPf, EP, AP. However, in all impact categories, AD results in a negative impact, while the impact of composting is positive (see the results in Sections 4.3 and 4.4 of Supplementary Materials). The better performance of AD compared to composting is also demonstrated in other studies with regards to GWP, AP, and energy use [77,78]. It should also be noted that the net impact of composting is lower when the compost is used to substitute fertilizers, but not soil. Thus, achieving a higher quality of compost through the use of separately collected biowaste could improve the benefits of composting.

3.3. Sensitivity Analysis

In this study, perturbation analysis was performed, and the results are presented in the Supplementary Materials in Sections 4.1 and 4.2. Then, the impact on the results of modeling choices made in this study were investigated, which is depicted in Figure 5. The modeling choices considered are the composition of MSW, source-separation efficiency, and the source of heat in energy generation.

3.3.1. MSW Composition Change

Alternative data have been considered only for the Leningrad region. In the initial data, almost 30% of the MSW is referred to as “other waste”, and the share of biowaste is exceptionally low. Although the “other waste” fraction could contain more biodegradable material than usual, it was considered inert waste in modeling landfills. MSW composition with a lower share of “other waste” used in this analysis is given in Supplementary Materials, Section 3.2. As a result of the change in MSW composition, a substantial increase in GWP occurs. This change in GWP is due to higher shares of food, paper, and cardboard waste in the alternative data, which increased from 15% to 28% for food waste and from 8% to 20% for paper and cardboard. Generally, changes originating from MSW composition can be multidirectional, as the share of recyclable materials also influences total results through the impact of recycling. Even though the direction of these changes is largely uncertain, the results are quite sensitive to waste composition. However, the ranking of scenarios does not change when the alternative MSW composition is used.

3.3.2. Efficiency of Source Separation

Capture rates in source separation can be expected to be lower during the first years of the separate collection of recyclable material. To assess the environmental impact of the MSW management system on the earlier stages of source separation implementation, capture rates two times lower are assumed: 8% for organic fraction, 8% for metals, 6% for plastics, 18% for paper and cardboard, and 22% for glass. The performance of the MSW management system changes significantly as EP, AP, and ADPf increases by 56%, 49%, and 25%, respectively (S4.1). The ranking of the scenarios for GWP changes, and the waste incineration scenario (S3) becomes the most favorable.

3.3.3. Choice of the Source of Heat Production

Instead of natural gas, heat produced from MSW can displace coal-based heat, as coal is a minor energy source that is currently being superseded. This assumption is tested using the GaBi unit process “RU: Process steam from hard coal 90%”. The change is applied to the heat supply in glass recycling, heat substitution by mixed MSW incineration, and biogas combustion. The largest changes are observed in S3, in which GWP and AP change drastically. Due to the difference in the sulfur content of the fuels, the AP of the MSW management system drops by 423%. When coal-based thermal energy is displaced, S3 becomes the most beneficial in terms of AP.

4. Discussion

The results of this study generally indicate that diverting waste from landfills to be recycled and incinerated decreases the environmental impact of MSW management. At first, the reduction is achieved due to avoided impact from landfilling; this is seen by the large reduction in the direct emissions of greenhouse gases when moving away from S0. Second, the reduction is achieved through substitution of production of primary materials and energy by utilization of waste; this is mostly seen in the ADPf category, which has a negative value across all scenarios, and the benefits increase further as more waste is sent to incineration and recycling. A similar trend is also seen for the EP and AP.
This study further supports the claim that the diversion of waste from landfills benefits the environment, which is a finding similar to the results of other studies, e.g., Bohra et al. [22], Kaazke et al. [28], and Starostina et al. [27]. Furthermore, this study indicates that systematic changes aimed at the implementation of MSW source separation (including their consequent recycling) and incineration have greater potential for the reduction of environmental impact compared to incremental improvements of existing MSW management systems through increased sorting of mixed waste and introduction of LFG collection. As shown by Song et al. [79], source separation and incineration of MSW are also considered more environmentally benign than other treatment methods. Furthermore, scenarios focused on source separation are seen as an optimal way to improve the environmental performance of the MSW sector, which is shown in case studies conducted by Özeler et al. [80], Zhao et al. [81], and Banias et al. [10]. In general, when compared to the incineration of MSW with energy recovery, the recycling of source-separated waste has smaller impacts on GWP, EP, AP, and other impact categories [82]. Yet, in some studies, increased MSW incineration has shown better results than recycling focused MSW management systems. Emery et al. [18] found that total incineration of MSW causes a larger reduction of GWP and EP than a scenario of increased recycling. Finally, the literature suggests that hybrid scenarios in which significant waste amounts are sent to both recycling and incineration facilities are the most favorable for the environment [12,21]. It should also be noted that, due to the various approaches to scenario building and different underlying data in other LCAs, an accurate comparison of our results with other cases is challenging.
As the results of this study reveal, in the case of Saint Petersburg and the Leningrad region, source separation of MSW could provide the largest reduction in the environmental impact if capture rates reach the average EU levels. In this scenario, all four impact categories considered in this study exhibit a significant reduction. When compared to the recycling-focused scenario, the benefits of waste incineration appear to be smaller in magnitude for GWP, EP, and AP. However, one advantage that the incineration of mixed waste has over the recycling of source-separated waste is that it can be implanted relatively quickly; it can take approximately 5–8 years from planning to operation of the plant. Due to the substitution of fossil-based energy production in the studied area, this option can still substantially reduce GWP, EP, AP, and ADPf—even in a short-term perspective. However, due to the significant cost of incineration plants, their construction leads to a lock-in in which MSW would need to be supplied there for several decades to ensure the plants’ economic profitability. This will, however, undermine the development of the MSW system towards recycling. On the other hand, though it takes longer to implement than incineration, the recycling of source-separated waste can be more favorable in the long term. For example, despite being well-known for a rapid increase in recycling rates, the Slovenian city of Ljubljana only managed to collect 16% of biowaste after 9 years of system development [63]. If the MSW management situation requires a quick response, a combination of source separation and thermal treatment can be used in ways similar to many cases in Europe. However, there is debate over the coexistence of waste incineration and recycling in the development of MSW management [83,84]. Because of this, the path to more environmentally sustainable MSW management should be planned carefully.

5. Conclusions

This LCA study contributes to research on the most environmentally sustainable diversion of MSW from landfill using the case of Saint Petersburg and the Leningrad region, Russia, where this challenge is currently being addressed. The results of the study show that the current MSW management system has significant potential to improve and even fully compensate for its environmental impact. The landfilling of MSW is especially detrimental to climate change. However, each of the modeled scenarios results in a substantial reduction in GWP. At the baseline situation (S0), MSW management is estimated to produce a little over 1 Tg (1 × 10⁹ kg) of CO2-eq (or 0.334 kg CO2-eq per 1 kg of MSW generated), while AP and ADPf are negative. If the average EU capture rates of recyclables are achieved, enhanced recycling practices provide the largest potential for reduction in overall environmental impact. MSW incineration can also reduce environmental impact significantly, especially if coal is replaced as an energy source. Among the waste fractions, paper and cardboard recycling is estimated to have the largest potential to decrease environmental impact. However, it is important to remember that the separation efficiencies (including capture rates) used in this LCA may influence the results significantly.
Although detailed data on local waste flows were applied to the model, the limitations of this study include the use of secondary data for modeling the disposal, recycling, and incineration processes. More accurate results could be obtained through the application of data specific to local technologies wherever possible. Besides, since the model built in GaBi software had to be complemented by ecoinvent data, the study would benefit from higher consistency of LCI data. The sensitivity analysis identified changes in scenario ranking for certain impact categories only, which do not change the conclusion drawn from the results. The results give a clear direction for future actions to reduce the environmental impact of MSW management in Saint Petersburg and the Leningrad region. With due caution, some of the results can be useful for regions with similar waste composition, MSW management practices, and energy mix, including other regions of Russia and countries in the east and south-east of Europe.

Supplementary Materials

The following supporting information can be downloaded at: https://0-www-mdpi-com.brum.beds.ac.uk/article/10.3390/recycling7020019/s1. Table S1: LCI data on waste collection and transportation in Saint Petersburg, Table S2: LCI data on waste collection and transportation in the Leningrad region, Table S3: LCI data on transportation of recyclable materials, Table S4: LCI data on landfilling, Table S5: Initial data for calculation of the methane generation potential, Table S6: Additional LCI data on landfilling with LFG collection, Table S7: Sorting facilities/processes modelled, Table S8: LCI data on mechanical sorting of mixed waste, Table S9: LCI data on a sorting line with manual separation of recyclable materials from mixed waste, Table S10: LCI data on a sorting line for source-separated waste fractions, Table S11: LCI data on windrow composting, Table S12: Composition of screening reject subject to composting, Table S13: Data used in modelling of recycling processes, Table S14: Processes from GaBi (version 2020.2) used in modelling of mixed MSW incineration, Table S15: Composition of RDF and characteristics of RDF fractions, Table S16: LCI data on RDF incineration, Table S17: LCI data on flue gases treatment process, Table S18: Weighting rules for NSR in perturbation analysis, Table S19: Parameters checked in perturbation analysis, Table S20: Alternative data on MSW composition in Leningrad region, Table S21: Sensitivity ratios of parameters in each scenario, GWP impact category, Table S22: Sensitivity ratios of parameters in each scenario, EP impact category, Table S23: Sensitivity ratios of parameters in each scenario, AP impact category, Table S24: Sensitivity ratios of parameters in each scenario, ADPf impact category, Table S25: Normalized sensitivity ratios of parameters in each scenario, GWP impact category, Table S26: Normalized sensitivity ratios of parameters in each scenario, EP impact category, Table S27: Normalized sensitivity ratios of parameters in each scenario, AP impact category, Table S28: Normalized sensitivity ratios of parameters in each scenario, ADPf impact category, Table S29: Aggregated weighted results of perturbation analysis over all impact categories [85,86,87,88,89,90,91,92,93,94,95,96,97,98,99,100,101].

Author Contributions

Conceptualization, A.Z.; Investigation, A.Z.; Data Curation, A.Z.; Writing—Original Draft, A.Z.; Visualization, A.Z., I.D.; Methodology, A.Z., N.V.; Writing—Review and Editing, I.D., J.H., M.H., Supervision, I.D., J.H., M.H.; Project administration, M.H. All authors have read and agreed to the published version of the manuscript.

Funding

The study was conducted as a part of AWARE (Against Waste: Activate Research and Education for increased environmental awareness) project (KS1913) financed through the South-East Finland—Russia CBC Program. Funding for the project was provided by the European Union, the Russian Federation, and the Republic of Finland. The APC was funded by the funded project and the Department of Sustainability Science.

Institutional Review Board Statement

Not applicable.

Informed Consent Statement

Not applicable.

Data Availability Statement

All relevant data are reported in the manuscript and the supplementary material.

Conflicts of Interest

The authors declare no conflict of interest.

References

  1. Bogner, J.; Pipatti, R.; Hashimoto, S.; Diaz, C.; Mareckova, K.; Diaz, L.; Kjeldsen, P.; Monni, S.; Faaij, A.; Qingxian, G.; et al. Mitigation of global greenhouse gas emissions from waste: Conclusions and strategies from the Intergovernmental Panel on Climate Change (IPCC) Fourth Assessment Report. Working Group III (Mitigation). Waste Manag. Res. 2008, 26, 11–32. [Google Scholar] [CrossRef] [PubMed]
  2. Vergara, S.E.; Tchobanoglous, G. Municipal Solid Waste and the Environment: A Global Perspective. Annu. Rev. Environ. Resour. 2012, 37, 277–309. [Google Scholar] [CrossRef]
  3. Elsheekh, K.M.; Kamel, R.R.; Elsherif, D.M.; Shalaby, A.M. Achieving sustainable development goals from the perspective of solid waste management plans. J. Eng. Appl. Sci. 2021, 68, 1–15. [Google Scholar] [CrossRef]
  4. IFC Waste in Russia: Garbage or Valuable Resource? Available online: http://www.ifc.org/wps/wcm/connect/6895a9004392026fb0dbb8869243d457/IFC+Waste+in+Russia+Report_rus.pdf?MOD=AJPERES (accessed on 7 July 2020).
  5. Accounts Chamber of the Russian Federation Accounts Chamber of the Russian Federation Bulletin. Waste Reform [Бюллетень Счетнoй палаты РФ. Мусoрная рефoрма]. Available online: https://ach.gov.ru/upload/iblock/462/46234b3e3624fcccbb8bace5c892f2f4.pdf (accessed on 8 December 2020).
  6. Government of Saint Petersburg Saint Petersburg Environmental Report 2018 [Doklad ob Ekologicheskoy Situatsii v Sankt-Peterburge v 2018 Godu]. Available online: https://www.gov.spb.ru/static/writable/ckeditor/uploads/2019/08/12/42/doklad_za_2018_EKOLOGIA2019.pdf (accessed on 5 July 2020).
  7. Federal Department of State Statistics Database of Indicators of Municipalities [Baza Dannykh Pokazateley Munutsipalnykh Obrazavaniy]. Available online: https://rosstat.gov.ru/dbscripts/munst/munst41/DBInet.cgi (accessed on 14 June 2020).
  8. Department of the Federal State Statistics Service for St. Petersburg and the Leningrad Region Permanent Population of St. Petersburg in the Context of Municipalities as of 1 January 2020 [Chislennost Postoyannogo Naselenia Sankt-Peterburga v razreze Munitsipalnih Obrazovaniy po Sostoyaniyu na 1 Yanvarya 2020]. Available online: http://petrostat.old.gks.ru/wps/wcm/connect/rosstat_ts/petrostat/ru/statistics/Sant_Petersburg/population/ (accessed on 4 July 2020).
  9. Department of the Federal State Statistics Service for St. Petersburg and the Leningrad Region Population [Naselenie]. Available online: https://petrostat.gks.ru/folder/27595# (accessed on 3 November 2020).
  10. Banias, G.; Batsioula, M.; Achillas, C.; Patsios, S.I.; Kontogiannopoulos, K.N.; Bochtis, D.; Moussiopoulos, N. A Life Cycle Analysis Approach for the Evaluation of Municipal Solid Waste Management Practices: The Case Study of the Region of Central Macedonia, Greece. Sustainability 2020, 12, 8221. [Google Scholar] [CrossRef]
  11. Silva, V.; Contreras, F.; Bortoleto, A.P. Life-cycle assessment of municipal solid waste management options: A case study of refuse derived fuel production in the city of Brasilia, Brazil. J. Clean. Prod. 2021, 279, 123696. [Google Scholar] [CrossRef]
  12. Hadzic, A.; Voca, N.; Golubic, S. Life-cycle assessment of solid-waste management in city of Zagreb, Croatia. J. Mater. Cycles Waste Manag. 2018, 20, 1286–1298. [Google Scholar] [CrossRef]
  13. Mendes, M.R.; Aramaki, T.; Hanaki, K. Comparison of the environmental impact of incineration and landfilling in São Paulo City as determined by LCA. Resour. Conserv. Recycl. 2004, 41, 47–63. [Google Scholar] [CrossRef]
  14. Chaya, W.; Gheewala, S.H. Life cycle assessment of MSW-to-energy schemes in Thailand. J. Clean. Prod. 2007, 15, 1463–1468. [Google Scholar] [CrossRef]
  15. Christensen, T.H.; Damgaard, A.; Levis, J.; Zhao, Y.; Björklund, A.; Arena, U.; Barlaz, M.A.; Starostina, V.; Boldrin, A.; Astrup, T.F.; et al. Application of LCA modelling in integrated waste management. Waste Manag. 2020, 118, 313–322. [Google Scholar] [CrossRef]
  16. Laurent, A.; Bakas, I.; Clavreul, J.; Bernstad, A.; Niero, M.; Gentil, E.; Hauschild, M.Z.; Christensen, T.H. Review of LCA studies of solid waste management systems—Part I: Lessons learned and perspectives. Waste Manag. 2014, 34, 573–588. [Google Scholar] [CrossRef] [PubMed]
  17. Bovea, M.D.; Ibáñez-Forés, V.; Gallardo, A.; Colomer-Mendoza, F.J. Environmental assessment of alternative municipal solid waste management strategies. A Spanish case study. Waste Manag. 2010, 30, 2383–2395. [Google Scholar] [CrossRef] [PubMed]
  18. Emery, A.; Davies, A.; Griffiths, A.; Williams, K. Environmental and economic modelling: A case study of municipal solid waste management scenarios in Wales. Resour. Conserv. Recycl. 2007, 49, 244–263. [Google Scholar] [CrossRef]
  19. Gilardino, A.; Rojas, J.; Mattos, H.; Larrea-Gallegos, G.; Vázquez-Rowe, I. Combining operational research and Life Cycle Assessment to optimize municipal solid waste collection in a district in Lima (Peru). J. Clean. Prod. 2017, 156, 589–603. [Google Scholar] [CrossRef]
  20. Wang, Z.; Lv, J.; Gu, F.; Yang, J.; Guo, J. Environmental and economic performance of an integrated municipal solid waste treatment: A Chinese case study. Sci. Total Environ. 2020, 709, 136096. [Google Scholar] [CrossRef] [PubMed]
  21. Popita, G.-E.; Rédey, Á.; Frunzeti, N.; Ionescu, A.; Yuzhakova, T.; Popovici, A. Life Cycle Assessment (Lca) of Municipal Solid Waste Management Systems In Cluj County, Romania. Environ. Eng. Manag. J. 2018, 79, 815–827. [Google Scholar]
  22. Bohra, A.; Nema, A.K.; Ahluwalia, P. Global warming potential of waste management options: Case study of Delhi. Int. J. Environ. Technol. Manag. 2012, 15, 346–362. [Google Scholar] [CrossRef]
  23. Shmelev, S.E. Ecological and Economic Modeling of Regional Waste Management Systems [Ekologo-Ekonomicheskoye Modelirovaniye Regional’nykh Sistem Upravleniya Otkhodami]. Available online: https://rusneb.ru/catalog/000199_000009_002651821/ (accessed on 12 June 2020).
  24. Vershkova, L.V.; Grosheva, V.L.; Gavrilova, V.V.; Burtseva, N.N. Temporary Methodology for Determining of Prevented Environmental Damage, State Committee of the Russian Federation for Environmental Protection: Moscow, Russia, 1999.
  25. Rodionov, M.; Nakata, T. Design of an optimal waste utilization system: A case study in St. Petersburg, Russia. Sustainability 2011, 3, 1486–1509. [Google Scholar] [CrossRef] [Green Version]
  26. Starostina, V.; Damgaard, A.; Rechberger, H.; Christensen, T.H. Waste management in the Irkutsk Region, Siberia, Russia: Environmental assessment of current practice focusing on landfilling. Waste Manag. Res. 2014, 32, 389–396. [Google Scholar] [CrossRef] [PubMed] [Green Version]
  27. Starostina, V.; Damgaard, A.; Eriksen, M.K.; Christensen, T.H. Waste management in the Irkutsk region, Siberia, Russia: An environmental assessment of alternative development scenarios. Waste Manag. Res. 2018, 36, 373–385. [Google Scholar] [CrossRef] [PubMed]
  28. Kaazke, J.; Meneses, M.; Wilke, B.-M.; Rotter, V.S. Environmental evaluation of waste treatment scenarios for the towns Khanty-Mansiysk and Surgut, Russia. Waste Manag. Res. 2013, 31, 315–326. [Google Scholar] [CrossRef] [PubMed] [Green Version]
  29. Tulokhonova, A.; Ulanova, O. Assessment of municipal solid waste management scenarios in Irkutsk (Russia) using a life cycle assessment-integrated waste management model. Waste Manag. Res. 2013, 31, 475–484. [Google Scholar] [CrossRef] [PubMed]
  30. Vinitskaia, N.; Zaikova, A.; Deviatkin, I.; Bachina, O.; Horttanainen, M. Life cycle assessment of the existing and proposed municipal solid waste management system in Moscow, Russia. J. Clean. Prod. 2021, 328, 129407. [Google Scholar] [CrossRef]
  31. ISO 14040 Environmental Management. Life Cycle Assessment. Principles and Frame-Work. (ISO 14040:2006); ISO: Geneva, Switzerland, 2018.
  32. ISO 14044 Environmental Management. Life Cycle Assessment. Requirements and Guidelines. (ISO 14044:2006 + A1:2018); ISO: Geneva, Switzerland, 2018.
  33. Guinèe, J.B.; Gorrée, M.; Heijungs, R.; Huppes, G.; Kleijn, R.; de Koning, A.; van Oers, L.; Wegener Sleeswijk, A.; Suh, S.; Udo de Haes, H.A.; et al. Life Cycle Assessment; An Operational Guide to the ISO Standard; Ministry of Housing, Spatial Planning and Environment (VROM) and Centre of Environmental Science (CML): Den Haag, The Netherlands; Leiden, The Netherlands, 2001; ISBN 0306480557. [Google Scholar]
  34. AO Avtopark No.1 Spetstrans. Interview data and data received afterwards on 21.09.2021. Department of Sustainability Science, Lappeenranta-Lahti University of Technology LUT, 2021; Unpublished.
  35. Waste Management Committee of the Leningrad Region Territorial Scheme for Waste Managament, Including Municipal Solid Waste Management [Territorial’naya Skhema Obrashcheniya s Otkhodami, v tom Chisle s Tverdymi Kommunal’nymi Otkhodami]. Available online: https://waste.lenobl.ru/ru/deiatelnost/tershema/ (accessed on 2 July 2020).
  36. MSW Landfill Novyy Svet-EKO/The Main Page. Available online: http://www.ns-eco.ru/ (accessed on 12 January 2021).
  37. Letyukhina, M. Reduce Tailings: Waste Management Reform Starts in Leningrad Region. Available online: https://spb.plus.rbc.ru/issue/5cf4f7cd7a8aa9317bf57242 (accessed on 13 July 2020).
  38. OOO Stroitelnaya Kompaniya Gidrokor. Complex for Processing (Sorting), Stabilization and Disposal of Waste at the Address: Leningrad Region, Kingiseppsky District, Industrial Zone Phosphorite. Environmental Impact Assessment. [Kompleks po obrabotke (sortirovke), Obezvrezhivaniyu i Razmeshc]. Available online: https://uko-lenobl.ru/o-kompanii/proektnaya-dokumentatsiya-po-obektam-infrastruktury (accessed on 1 November 2020).
  39. Scarlat, N.; Fahl, F.; Dallemand, J.F. Status and Opportunities for Energy Recovery from Municipal Solid Waste in Europe. Waste Biomass Valorizat. 2019, 10, 2425–2444. [Google Scholar] [CrossRef] [Green Version]
  40. AO DAR/VODGEO. Construction of a Complex for the Processing and Disposal of St. Petersburg Waste in the Lyubanskoye Forestry of the Tosnensky Municipal District of the Leningrad Region. Project Documentation. Environmental Impact Assessment. Available online: http://www.infoeco.ru/assets/images/poligon/233-ОВОС.pdf (accessed on 13 June 2020).
  41. Committee for the Improvement of Saint Petersburg. Territorial Production and Consumption Waste Management Scheme [Territorialnaya Skhema Obrashchenya s Othodami Proizvodstva i Potrebleniya]. Available online: https://www.gov.spb.ru/gov/otrasl/blago/documents/new_npa/ (accessed on 25 June 2020).
  42. CH4 Emissions from Solid Waste Disposal. IPCC Good Practice Guidance and Uncertainty Management in National Greenhouse Gas Inventories; IPCC: Geneva, Switzerland, 2006; pp. 419–439. [Google Scholar]
  43. Lee, U.; Han, J.; Wang, M. Evaluation of landfill gas emissions from municipal solid waste landfills for the life-cycle analysis of waste-to-energy pathways. J. Clean. Prod. 2017, 166, 335–342. [Google Scholar] [CrossRef]
  44. Liikanen, M.; Havukainen, J.; Viana, E.; Horttanainen, M. Steps towards more environmentally sustainable municipal solid waste management—A life cycle assessment study of São Paulo, Brazil. J. Clean. Prod. 2018, 196, 150–162. [Google Scholar] [CrossRef]
  45. Havukainen, J.; Zhan, M.; Dong, J.; Liikanen, M.; Deviatkin, I.; Li, X.; Horttanainen, M. Environmental impact assessment of municipal solid waste management incorporating mechanical treatment of waste and incineration in Hangzhou, China. J. Clean. Prod. 2017, 141, 453–461. [Google Scholar] [CrossRef]
  46. OOO KOSMOS. Correction of the Project “Landfill for Solid Household and Construction Waste in the Village of M. Zamostye, Gatchina District Leningrad Region” [Korrektirovka proyekta "Poligon tverdykh bytovykh i stroitel’nykh otkhodov v d. M.Zamostje Gatchinskogo rai. Available online: https://www.google.com/url?sa=t&rct=j&q=&esrc=s&source=web&cd=&ved=2ahUKEwi85MyftbrtAhXBAxAIHYitCx8QFjAAegQIAxAC&url=http%3A%2F%2Fradm.gtn.ru%2F_file%2Fnews%2F323abe34eba78b10333e3bac779180c2.doc&usg=AOvVaw2drnFzsr9QsJAsc6TZKGDu (accessed on 12 July 2020).
  47. OOO Stroitelnaya Kompaniya Gidrokor. Reconstruction of the Solid Waste Landfill, City of Ivangorod. Environmental Impact Assessment. [Rekonstruktsiya Poligona Khraneniya Tverdykh Bytovykh Otkhodov, g.Ivangorod. Otsenka Vozdeystviya na Okruzhayushchuyu Sredu]. Available online: http://cdn.sbor.ru/Files/file/!08_08-18p_-_ovos.pdf (accessed on 5 August 2020).
  48. Doka, G. Landfills. Underground Deposits. Landfarming. Available online: https://www.doka.ch/13_III_Landfills.pdf (accessed on 5 November 2020).
  49. Bacchi, D.; Bacci, R.; Ferrara, G.; Lombardi, L.; Pecorini, I.; Rossi, E. Life Cycle Assessment (LCA) of landfill gas management: Comparison between conventional technologies and microbial oxidation systems. Energy Procedia 2018, 148, 1066–1073. [Google Scholar] [CrossRef]
  50. Rospotrebnadzor The Register of Sanitary and Epidemiological Conclusions on the Compliance (Non-Compliance) of Activities (Works, Services) with the Requirements of State Sanitary and Epidemiological Rules and Regulations [Reyestr Sanitarno-Epidemiologicheskikh Zaklyuche. Available online: http://fp.crc.ru/service/?oper=s&uinz=%29F%29%28%2CJNc4fM&pdk=on&pril=on (accessed on 9 March 2020).
  51. Il’inykh, G.V.; Ustyantsev, E.A.; Vaisman, Y.I. Construction of the material balance of the line for manual sorting of solid household waste [Postroyeniye material’nogo balansa linii ruchnoy sortirovki tverdykh bytovykh otkhodov]. Physics 2013, 22–25. [Google Scholar] [CrossRef]
  52. Il’inykh, G.V. The Percentage of Selection of Secondary Raw Materials when Sorting Municipal Solid Waste: Calculated and Actual [Protsent Otbora Vtorichnogo Syr’ya Pri Sortirovke Tverdykh Bytovykh Otkhodov: Raschetnyy i Fakticheskiy]. Available online: https://www.waste.ru/modules/section/item.php?itemid=373 (accessed on 9 August 2020).
  53. MPBO-2 Investment Program of the St. Petersburg State Unitary Enterprise Plant for Mechanized Processing of Household Waste in the Field of Solid Waste Management for 2019–2023 [Investitsionnaya programma Sankt-Peterburgskogo Gosudarstvennogo Unitarnogo Predpr]. Available online: https://mpbo2.ru/standarty-raskrytiya-informacii-dok/ (accessed on 23 September 2020).
  54. Boldrin, A.; Andersen, J.K.; Møller, J.; Christensen, T.H.; Favoino, E. Composting and compost utilization: Accounting of greenhouse gases and global warming contributions. Waste Manag. Res. 2009, 27, 800–812. [Google Scholar] [CrossRef] [PubMed] [Green Version]
  55. Grzesik, K.; Malinowski, M. Life Cycle Assessment of Mechanical-Biological Treatment of Mixed Municipal Waste. Environ. Eng. Sci. 2017, 34, 207–220. [Google Scholar] [CrossRef]
  56. Lima, P.D.M.; Colvero, D.A.; Gomes, A.P.; Wenzel, H.; Schalch, V.; Cimpan, C. Environmental assessment of existing and alternative options for management of municipal solid waste in Brazil. Waste Manag. 2018, 78, 857–870. [Google Scholar] [CrossRef] [PubMed]
  57. LIPASTO Average Emissions and Energy Use of Working Machines per Fuel in Finland in 2016. Available online: http://lipasto.vtt.fi/yksikkopaastot/indexe.htm (accessed on 21 July 2020).
  58. Research. Techart Waste Paper Market Overview. [Obzor rynka makulatury]. Munic. Solid Waste 2010, 7, 134–142. [Google Scholar]
  59. Greene, J. Energy implications of glass-container recycling. Hosp. Health Netw. 2007, 81, 65–69. [Google Scholar] [CrossRef] [PubMed]
  60. Landi, D.; Germani, M.; Marconi, M. Analyzing the environmental sustainability of glass bottles reuse in an Italian wine consortium. Procedia CIRP 2019, 80, 399–404. [Google Scholar] [CrossRef]
  61. Bushikhin, V.V.; Lomtev, A.Y.; Budko, A.G.; Pakhtinov, V. Alternative Fuel from Solid Household Waste [Alternativnoe Toplivo iz Tverdikh Bitovikh Otkhodov]. Available online: http://www.atr-sz.ru/files/visual/2015_04_29/alt_fuel.pdf (accessed on 2 October 2020).
  62. Kourkoumpas, D.S.; Karellas, S.; Kouloumoundras, S.; Koufodimos, G.; Grammelis, P.; Kakaras, E. Comparison of waste-to-energy processes by means of life cycle analysis principles regarding the global warming potential impact: Applied case studies in greece, france and germany. Waste Biomass Valorizat. 2015, 6, 605–621. [Google Scholar] [CrossRef]
  63. BiPRO/CRI Assessment of Separate Collection Schemes in the 28 Capitals of the EU Final Report CLIENT European Commission Directorate-General Environment Report title Final Report. Available online: https://publications.europa.eu/resource/cellar/2c93de42-a2fa-11e5-b528-01aa75ed71a1.0001.01/DOC_1 (accessed on 14 August 2020).
  64. Pressley, P.N.; Levis, J.W.; Damgaard, A.; Barlaz, M.A.; DeCarolis, J.F. Analysis of material recovery facilities for use in life-cycle assessment. Waste Manag. 2015, 35, 307–317. [Google Scholar] [CrossRef] [Green Version]
  65. BP BP Statistical Review 2019—Russia. Available online: https://www.bp.com/content/dam/bp/business-sites/en/global/corporate/pdfs/energy-economics/statistical-review/bp-stats-review-2019-russia-insights.pdf (accessed on 6 November 2020).
  66. Government of Saint Petersburg The Current Heat Supply Scheme for St. Petersburg for 2020 [Deystvuyushchaya skhema teplosnabzheniya Sankt-Peterburga na 2020 god]. Available online: https://www.gov.spb.ru/gov/otrasl/ingen/shemy-razvitiya-inzhenerno-energeticheskogo-kompleksa/aktualizaciya-shemy-teplosnabzheniya-sankt-peterburga-na-2020-god/ (accessed on 5 November 2020).
  67. Clavreul, J.; Guyonnet, D.; Christensen, T.H. Quantifying uncertainty in LCA-modelling of waste management systems. Waste Manag. 2012, 32, 2482–2495. [Google Scholar] [CrossRef] [Green Version]
  68. Manfredi, S.; Tonini, D.; Christensen, T.H.; Scharff, H. Landfilling of waste: Accounting of greenhouse gases and global warming contributions. Waste Manag. Res. 2009, 27, 825–836. [Google Scholar] [CrossRef] [PubMed]
  69. Gemechu, E.D.; Butnar, I.; Gomà-Camps, J.; Pons, A.; Castells, F. A comparison of the GHG emissions caused by manufacturing tissue paper from virgin pulp or recycled waste paper. Int. J. Life Cycle Assess. 2013, 18, 1618–1628. [Google Scholar] [CrossRef]
  70. Ta Thi, Y.; Thi Anh, T.N. Determination of life cycle GHG emission factor for paper products of Vietnam. Green Process. Synth. 2020, 9, 586–594. [Google Scholar] [CrossRef]
  71. Cartiera Ariete srl EPD S-P-02079—Tissue Paper. Available online: https://portal.environdec.com/api/api/v1/EPDLibrary/Files/969cac03-0cf4-4945-0b98-08d9a5a517d4/Data (accessed on 18 February 2021).
  72. Rossmann Environmental Product Declaration. Available online: https://portal.environdec.com/api/api/v1/EPDLibrary/Files/4eb67ce0-3efa-4ded-3d78-08d91ff9d553/Data (accessed on 18 February 2021).
  73. Asaleo Care Environmental Product Declaration for Tork®, Purex® and Sorbent® Toilet Tissue. Available online: https://portal.environdec.com/api/api/v1/EPDLibrary/Files/f0ab6240-90ca-4ac3-ab8b-a99144103fdd/Data (accessed on 18 February 2021).
  74. Asaleo Care Environmental Product Declaration for Tork® Hand Towels and Handee Paper Towels. Available online: https://portal.environdec.com/api/api/v1/EPDLibrary/Files/e1f859d9-8e56-4d62-ba55-868c5e568ca7/Data (accessed on 18 February 2021).
  75. Asaleo Care Environmental Product Declaration for Tork Xpressnap® Napkins. Available online: https://portal.environdec.com/api/api/v1/EPDLibrary/Files/cd285016-4ade-405b-9e41-44ed1bba2f6d/Data (accessed on 18 February 2021).
  76. Merrild, H.; Damgaard, A.; Christensen, T.H. Life cycle assessment of waste paper management: The importance of technology data and system boundaries in assessing recycling and incineration. Resour. Conserv. Recycl. 2008, 52, 1391–1398. [Google Scholar] [CrossRef]
  77. Dong, J.; Ni, M.; Chi, Y.; Zou, D.; Fu, C. Life cycle and economic assessment of source-separated MSW collection with regard to greenhouse gas emissions: A case study in China. Environ. Sci. Pollut. Res. 2013, 20, 5512–5524. [Google Scholar] [CrossRef] [PubMed]
  78. Morris, J.; Scott Matthews, H.; Morawski, C. Review and meta-analysis of 82 studies on end-of-life management methods for source separated organics. Waste Manag. 2013, 33, 545–551. [Google Scholar] [CrossRef]
  79. Song, Q.; Wang, Z.; Li, J. Environmental performance of municipal solid waste strategies based on LCA method: A case study of Macau. J. Clean. Prod. 2013, 57, 92–100. [Google Scholar] [CrossRef]
  80. Özeler, D.; Yetiş, Ü.; Demirer, G.N. Life cycle assesment of municipal solid waste management methods: Ankara case study. Environ. Int. 2006, 32, 405–411. [Google Scholar] [CrossRef]
  81. Zhao, Y.; Christensen, T.H.; Lu, W.; Wu, H.; Wang, H. Environmental impact assessment of solid waste management in Beijing City, China. Waste Manag. 2011, 31, 793–799. [Google Scholar] [CrossRef] [PubMed]
  82. Morris, J. InLCA: Case Studies Curbside Recycling 273 InLCA: Case Studies-Using LCA to Compare Alternatives Comparative LCAs for Curbside Recycling Versus Either Landfilling or Incineration with Energy Recovery. Environ. Sci. 2005, 10, 273–284. [Google Scholar] [CrossRef]
  83. Schneider, D.R.; Ragossnig, A.M. Recycling and incineration, contradiction or coexistence? Waste Manag. Res. 2015, 33, 693–695. [Google Scholar]
  84. Levaggi, L.; Levaggi, R.; Marchiori, C.; Trecroci, C. Waste-to-energy in the EU: The effects of plant ownership, waste mobility, and decentralization on environmental outcomes and welfare. Sustainability 2020, 12, 5743. [Google Scholar] [CrossRef]
  85. Ministry of Natural Resources and the Environment of the Russian Federation Passport of the National Project “Ecology” [Pasport Natsional’nogo Proyekta «Ekologiya»]. Available online: http://www.mnr.gov.ru/activity/directions/natsionalnyy_proekt_ekologiya/ (accessed on 1 July 2020).
  86. Administration of St. Petersburg Conclusion dated 17.02.2020 No. 01-12-6 20-0-0 [Заключение oт 17.02.2020 № 01-12-6 20-0-0]. Available online: https://www.gov.spb.ru/gov/otrasl/blago/documents/obshestvennoe-obsuzhdenie-proektov-normativnyh-pravovyh-aktov/zaklyuchenie-ot-17022020-01-12-6-20-0-0/ (accessed on 17 February 2021).
  87. IPCC Guidelines for National Greenhouse Gas Inventories. Volume 5: Waste. Available online: https://www.ipcc-nggip.iges.or.jp/public/2006gl/vol5.html (accessed on 5 November 2020).
  88. Nasrullah, M.; Vainikka, P.; Hannula, J.; Hurme, M.; Kärki, J. Mass, energy and material balances of SRF production process. Part 3: Solid recovered fuel produced from municipal solid waste. Waste Manag. Res. 2015, 33, 146–156. [Google Scholar] [CrossRef]
  89. Ham, R.K.; Komilis, D. A Laboratory Study to Investigate Gaseous Emissions and Solids Decomposition during Composting of Municipal Solid Waste; US Environmental Protection Agency: Washington, DC, USA, 2003; p. 149.
  90. Di Lonardo, M.C.; Lombardi, F.; Gavasci, R. Characterization of MBT plants input and outputs: A review. Rev. Environ. Sci. Biotechnol. 2012, 11, 353–363. [Google Scholar] [CrossRef]
  91. Gala, A.B.; Raugei, M.; Fullana-i-Palmer, P. Introducing a new method for calculating the environmental credits of end-of-life material recovery in attributional LCA. Int. J. Life Cycle Assess. 2015, 20, 645–654. [Google Scholar] [CrossRef]
  92. Rigamonti, L.; Grosso, M.; Giugliano, M. Life cycle assessment of sub-units composing a MSW management system. J. Clean. Prod. 2010, 18, 1652–1662. [Google Scholar] [CrossRef]
  93. Finnveden, G.; Johansson, J.; Lind, P.; Moberg, Å. Life Cycle Assessments of Energy from Solid Waste. Available online: http://citeseerx.ist.psu.edu/viewdoc/download?doi=10.1.1.197.4254&rep=rep1&type=pdf (accessed on 26 November 2020).
  94. Bjarnadóttir, H.J.; Friðriksson, G.B.; Johnsen, T.; Sletsen, H. Guidelines for the Use of LCA in the Waste Management Sector. Available online: http://www.nordtest.org/register/techn/tlibrary/tec517/tec517.pdf (accessed on 6 November 2020).
  95. Larionov, K.B.; Tsibulskiy, S.A.; Slyusarskiz, K.V.; Tolokolnikov, A.A.; Gubin, V.E. Study of the physical-chemical characteristics of non-food solid waste combustion. J. Phys. Conf. Ser. 2019, 1359, 012065. [Google Scholar] [CrossRef] [Green Version]
  96. EkoSPES Waste Incineration Plants and Incinerators in the Russian Federation [Musoroszhigatel’nyye Zavody i Insineratory v Rossiyskoy Federatsii]. Available online: http://www.ecoaccord.org/news2020/Обзoр15.06.2020.pdf (accessed on 24 August 2020).
  97. Consonni, S.; Giugliano, M.; Grosso, M. Alternative strategies for energy recovery from municipal solid waste: Part A: Mass and energy balances. Waste Manag. 2005, 25, 123–135. [Google Scholar] [CrossRef] [PubMed]
  98. Małkowski, P. The quality of coal in Poland, Russia and Ukraine and its effect on dust emission into the atmosphere during combustion. Czas. Tech. 2018, 9, 141–161. [Google Scholar] [CrossRef]
  99. Astrup, T.; Møller, J.; Fruergaard, T. Incineration and co-combustion of waste: Accounting of greenhouse gases and global warming contributions. Waste Manag. Res. 2009, 27, 789–799. [Google Scholar] [CrossRef] [PubMed]
  100. Zandaryaa, S.; Gavasci, R.; Lombardi, F.; Fiore, A. Nitrogen oxides from waste incineration: Control by selective non-catalytic reduction. Chemosphere 2001, 42, 491–497. [Google Scholar] [CrossRef]
  101. Liu, Z.S. Advanced experimental analysis of the reaction of Ca(OH)2 with HCl and SO2 during the spray dry scrubbing process. Fuel 2005, 84, 5–11. [Google Scholar] [CrossRef]
Figure 1. System boundaries of the study.
Recycling 07 00019 g001
Figure 2. MSW flows in scenarios. Numbers indicate flow masses in Gg.
Recycling 07 00019 g002
Figure 3. Global Warming Potential (GWP) (a), Abiotic Depletion Potential (ADPf), (b), Eutrophication Potential (EP) (c), and Acidification Potential (AP) (d) of the MSW management system for the scenarios studied: S0—the current situation, S1—planned development by 2024, S2—LFG collection doubled, S3—incineration of mixed MSW added, S4—source separation added (S4.1—composting of organic waste, S4.2—anaerobic digestion of organic waste).
Recycling 07 00019 g003
Figure 4. Relative impact reduction (0–1 range) by recycling processes and anaerobic treatment of biowaste.
Recycling 07 00019 g004
Figure 5. Impact of modeling choices on life cycle impact assessment results.
Recycling 07 00019 g005
Table 1. MSW composition in Saint Petersburg and the Leningrad region.
Waste FractionComposition (%)
Saint PetersburgLeningrad Region
Biowaste31.115.5
Plastics13.710.0
Paper and cardboard11.68.0
Glass11.116.0
Textile6.12.0
Inert materials3.71.5
Wood3.20.5
Ferrous metals1.38.0
Leather and rubber0.88.0
Non-ferrous metals0.20.7
Other materials17.229.8
Total100.0100.0
Source: [34,40].
Table 2. Specific net GWP and ADPf of different processes in the baseline scenario S0 (a sum of direct and, if relevant, avoided emissions divided by the amount of waste handled or treated in a referenced process).
ProcessesGWP,
kg CO2-eq/
kg Waste Treated
ADPf,
MJ/
kg Waste Treated
Collection, transportation0.010.09
Waste sorting0.010.21
Landfilling0.37−0.07
Steel recycling−1.62−15.5
Aluminum recycling−10.4−97.1
Plastic recycling−1.69−35.0
Glass recycling−0.42−2.00
Paper and cardboard recycling−1.14−9.46
Composting0.060.31
Anaerobic digestion--
RDF combustion−0.92−20.7
Incineration−0.09−6.71
Publisher’s Note: MDPI stays neutral with regard to jurisdictional claims in published maps and institutional affiliations.

