
Enzymatic Glucose and Xylose Production from Paper Mill Rejects

Department of Bioproducts and Biosystems Engineering, College of Food, Agriculture and Natural Resource Sciences, University of Minnesota, Saint Paul, MN 55108, USA
*
Author to whom correspondence should be addressed.
Recycling 2022, 7(2), 24; https://0-doi-org.brum.beds.ac.uk/10.3390/recycling7020024
Submission received: 12 March 2022
/
Revised: 1 April 2022
/
Accepted: 11 April 2022
/
Published: 13 April 2022
Abstract
:Recycled paper fiber rejects have shown potential as a source of waste-to-resource carbohydrates for renewable chemicals production. This study examined three classes of recycled paper fines (old corrugated containers, old newspaper, and mixed office waste) and two industrial papermaking rejects streams from different recycling mills (one mill processes linerboard and the other old corrugated cardboard). The effect of chemical pretreatment using dilute sodium hydroxide, hot water and dilute sulfuric acid on enzymatic glucose and xylose yields was evaluated. Enzymatic hydrolysis results indicated that recycled fiber streams with more old corrugated cardboard have higher potential to produce carbohydrates. The recycled cardboard rejects produced more glucose and xylose per kilogram of rejects than the linerboard rejects under all untreated and pretreated conditions. The highest producing rejects sample was sodium hydroxide pretreated cardboard rejects with 373 g glucose and 61 g xylose produced per kilogram of rejects. However, a simple hot water pretreatment showed similar results, with 335 g glucose and 58 g xylose produced per kilogram of rejects. The hot water pretreatment is recommended due to its comparable yield and lower chemical addition.
Keywords:
paper; cellulosic biofuels; bio-based products; recycling; biomass; waste-derived products1. Introduction
As the challenges of climate change worsen and fossil fuel prices rise, countries have begun to seriously examine more environmentally compatible renewable fuels and products such as cellulosic ethanol, butanol and biodegradable plastics [1,2]. Currently, sugar-based production of renewable chemicals and fuels commonly uses dextrose harvested from corn starch and sucrose from sugar beets and sugar cane [3,4]. However, cellulosic glucose production has been gaining attention in recent years as it can [5,6]:
- Reuse and reduce lignocellulosic waste;
- Avoid impacts on food supply;
- Help slow the rapid conversion of land for farm use by using waste streams like paper mill waste or marginal lands for energy crops like switchgrass.
The main challenge in recovering carbohydrates from second-generation cellulosic sources involves breaking down lignocellulosic biomass to allow access by chemicals or enzymes to the polysaccharides that yield fermentable sugar, most commonly glucose from cellulose [4]. Biomass consists of a complex, three-dimensional matrix consisting mostly of cellulose, hemicellulose, and lignin that provides structure and protection [4,7]. The process of disrupting this lignocellulosic matrix to access the carbohydrates generally includes the mechanical break-down of the biomass to smaller particles and fibers. It often also utilizes chemical pretreatment to aid in lignin degradation and removal [4,7]. These processes can be costly and are a significant barrier to widespread carbohydrate production from lignocellulosic sources [8]. Once the carbohydrate polymers are broken down to monomers, these simple sugars can be used for biofuel production or other products like biodegradable and compostable plastics [4,9].
Recycled paper fibers have already undergone mechanical and/or chemical treatment, making them a good candidate for lignocellulosic carbohydrate production. When paper is recycled, approximately 15–20% of the feedstock is rejected either as fillers and fines from white water or as screen rejects after repulping [10,11]. This mixture of rejected recycled material often ends up in a landfill. Landfilling can be costly and leads to land use issues and methane emissions as the organic material anaerobically decomposes [10,12,13,14].
Alternatively, these paper mill rejects, deemed unusable for recycled paper production, could be redirected to producing valuable cellulosic carbohydrates like glucose. This would reduce waste from the paper mills, save money on landfilling costs, and produce a value-added product from a waste stream that could generate new revenue. The combined production of rejects from the two recycled paper mills examined in this study is about 20,000 dry tons per year at a moisture content of 40–45%; landfilling these rejects can cost paper companies USD 25–80/wet ton [14,15]. Using mill rejects as a feedstock for cellulosic carbohydrate production would also decrease the need for processing new timber, switchgrass, or other lignocellulosic sources, reducing a major cost of potential second-generation chemicals manufacture.
However, using wood fiber from paper mill rejects poses unique challenges. There is not one uniform type of reject; rejects are produced during the recycling of all types of fiber with different compositions and characteristics. Rejects can also contain several contaminants including inks, inorganic fillers, plastics, and more that could complicate the saccharification and fermentation process [11,13,14,16].
Valorization of different paper mill wastes is a widely researched topic. Some examples of previous research in this field include bio-based chemical production from paper sludge [13,14] and specific applications of paper fines and rejects [10,11,15]. This study aimed to fill a gap by differentiating between different recycled fiber rejects and specific fines types. This was accomplished by comparing the composition and carbohydrate recovery of two paper mill rejects streams with manually collected fiber fines from three major recycled fiber categories: old corrugated containers (OCC); old newspaper (ONP), and mixed office waste (MOW). Fines were used as a comparison as white water rejects contain a larger fines fraction than unrejected fiber [10,15]. The first rejects stream was obtained from a mixed paper (OCC, MOW and ONP) recycling facility that produces linerboard (R1) and the second from a primarily OCC recycling facility (R2).
For both fines and rejects, the effect of a sodium hydroxide pretreatment on glucose and xylose yields was examined. Rejects were also treated with hot water and dilute sulfuric acid to compare the effects of both high and low pH pretreatments on sugar yields. It was expected that greater glucose and xylose yields would be achieved with the MOW samples that had undergone more chemical pulping and bleaching to remove lignin and hemicelluloses. Additionally, it was predicted that the fines sample with the highest sugar yield would indicate the best type of recycled fiber rejects stream for sugar production.
2. Materials and Methods
2.1. Collection of Fines Samples
OCC, ONP, and MOW fines samples were collected manually. Samples were soaked in tap water overnight and disintegrated in an Adirondak Hydropulper and a TMI British Disintegrator. Following disintegration, the fibers were separated using a Bauer McNett fiber classifier. Following passage through the final 150-mesh sieve, the fines were collected in five-gallon buckets. After allowing the fines to settle overnight, the fines were isolated by decanting and filtering. Industrial recycled fiber rejects (fines, screen rejects, and other rejects) were supplied by a folding carton recycling mill (R1; mixed recycled media) and a linerboard recycling mill (R2; mainly recycled OCC). Two consistency measurements were taken for each sample and averaged to determine the solid content.
2.2. Pretreatments
Pretreatments selected for this study included hot water, 0.1 M NaOH, and 0.5% (w/w) and 1.0% (w/w) sulfuric acid pretreatments. These pretreatment methods are commonly considered for biomass conversion [8]. Each of the five fines and two rejects samples were pretreated using 0.1 M NaOH at 80 °C and a liquid to solids ratio of 12:1 in a water bath for two hours. Samples were treated in 600 mL beakers covered in aluminum foil and stirred every 30 min during treatment. The rejects samples (R1 and R2) were also subjected to three high pressure and temperature pretreatments: water; 0.5% (w/w) sulfuric acid; and 1.0% (w/w) sulfuric acid. These samples were treated in 600 mL beakers covered in aluminum foil with a liquid-to-solids ratio of 10:1. Samples were autoclaved for one hour at a temperature of 121 °C. Following pretreatment, all samples were neutralized to pH 5 using dilute sulfuric acid and allowed to stand at 5 °C overnight. The following day, pH of the samples was checked again to ensure that it had remained neutral (pH < 7). Neutral samples were vacuum filtered and their consistency was measured, while the samples with a pH that had increased or decreased from the pH 5–7 window were re-neutralized and allowed to sit overnight again before filtration. Pretreated samples are denoted with an additional -S for sodium hydroxide, -W for hot water, -A5 for 0.5% sulfuric acid, and -A1 for 1.0% sulfuric acid.
2.3. Analysis of Carbohydrates and Klason Lignin Content by Acid Hydrolysis
The carbohydrates and Klason lignin were measured based on the method of NREL/TP-510-42618.
Untreated and pretreated fines samples were analyzed in duplicate for carbohydrates and Klason lignin contents. For the untreated and sodium hydroxide pretreated ONP, MOW, and R1, 6 mL of 72% H2SO4 (aq) was used instead of the 3 mL described in NREL/TP-510-42618 due to the buffer capacity of the alkaline fillers (presumably carbonates [10]) collected with the fines. All recovered lignin samples were ashed at 550 °C for five hours to determine the ash content of the lignin. The ash content was subtracted from the dry mass obtained for the final Klason lignin mass.
For analysis of the carbohydrates, a Waters HPLC system was employed with Waters 1525 Binary Pump, a Waters 717 plus Autosampler, a Waters 2414 Refractive Index Detector and Breeze software for operation control and data processing. The HPLC column was equipped with BIO-RAD De-Ashing Refill Cartridges, 30 × 4.6 mm (guard column), in line with a BIO-RAD Aminex HPX-87P Column. Ultrapure water at a flowrate of 0.3 mL/min was used as the mobile phase.
2.4. Ash Content
The Ash content of the fines samples was measured (in duplicate) based on the method of NREL/TP-510-42622.
2.5. Fiber Length Assessment
Fiber length measurements of each sample were taken using an Optest® Fiber Quality Analyzer. A total of 10,000 fibers were counted in a dilute DI water suspension.
2.6. Enzymatic Saccharification
For the enzymatic hydrolysis of the fiber samples, a Novozymes® Cellic® Ctec2 cellulase enzyme blend (Lot #SLBZ9767) was used [17]. This enzyme mixture contains both cellulase and xylanase.
For each sample, the amount of biomass needed for 0.1 g of cellulose was calculated based on the carbohydrate analysis. Three trials of each biomass sample were completed in 20 mL scintillation vials: two with enzyme, and one without enzyme as a control. To each vial, 5.0 mL 0.1 M sodium citrate buffer (16.96 g sodium citrate, 8.127 g citric acid, 800 mL water, adjusted to pH 5 using HCl and NaOH) was added to regulate pH during hydrolysis. Then, 10 mg (0.7 FPU, determined based on NREL/TP-510-42628) of enzyme was added to each test sample. An enzyme blank was included with no substrate and the same enzyme dose. Deionized water was added to each vial to reach a total volume of 10 mL; this assumed a biomass density of 1 g/mL and subtracted the moisture content of the fines samples. For the ONP samples an additional 2.5 mL of buffer and water was added and for the ONP-S samples an additional 5 mL of buffer and water were added to decrease the solids content and facilitate mixing. Samples were placed in an incubator at 50 °C, a 15° angle, and 60 rpm rotation for 7 days.
Next, 1 mL of each sample was filtered into HPLC vials for analysis of glucose and xylose release using the HPLC system described previously. Total glucose recovery was calculated using Equation (1), as shown below, where ms is the free glucose in the sample, mc is the original cellulose mass in the sample, and the conversion factor of converts the mass of cellulose to the corresponding mass of hydrolyzed glucose:
Xylose recovery used the same equation, however, ms represented free xylose in the sample, mc represented the original xylan mass in the sample, and the conversion from xylan to hydrolyzed xylose was .
3. Results
3.1. Fiber Length Characterization
The fiber length characterization was used to evaluate whether the paper mill rejects examined contained a large fines fraction comparable to the manually collected fines. Analysis of the samples’ fiber characteristics (Table 1) showed the expected results; manually collected fines samples (OCC, ONP, and MOW) contained mostly fines by both arithmetic and length weighted percent fines calculations. The rejects also had a high arithmetic fines fraction around 45–50% for the untreated samples, supporting the collection of fines in paper mill rejects filters [10,15]. However, the rejects contained longer fibers as well, indicated most clearly by the length weighted fines percent—while the manually collected fines samples were all above 77% length weighted fines, the rejects were all below 12%.
3.2. Biomass Characterization of Fines Samples
Characterization of the fines samples (Table 2) showed only small changes in composition with NaOH pretreatment. One exception was noted: ONP lignin content was slightly increased, most likely caused by the reduction in overall polysaccharide content. In the rejects samples, the sodium hydroxide pretreatment appeared more effective at preserving cellulose content than hot water and acid pretreatments. This trend supported the greater stability of cellulose chains under alkaline conditions [18,19].
Ash content in all samples was much higher than the typical 0–1% in wood fiber samples [20]. In particular, untreated R1 had ash content above 30% and MOW had around 70%. Fillers, ink, and plastic contamination were not removed prior to biomass characterization or enzymatic hydrolysis. ONP was visibly dyed black by ink, MOW was chalky-white with small black spots indicating filler and ink, and the rejects samples (especially R1) had visible plastic and Styrofoam bits distributed in the fiber. The ash and cellulose content of the R2 sample was very similar to the OCC fines’ supporting its majority OCC fiber content.
3.3. Glucose and Xylose Yield from Enzymatic Saccharification
Of the three fines samples, OCC had the highest yields of both glucose and xylose in untreated and sodium hydroxide pretreated fines (Table 3). Glucose yield increased with pretreatment from 83 to 90%, and xylose yield was close to 100% with and without pretreatment. The xylose yield over 100% for OCC was most likely due to the high variability in substrate xylan content (±1.0% for samples with an average of only 9.0% xylan content) in the OCC biomass characterization. ONP had the next highest yield, yet was still significantly lower than the OCC with only 28% glucose recovery at best in the untreated fines. MOW showed almost no glucose yield and minimal xylose release in both untreated and pretreated fines. After hydrolysis, the pH of all samples remained close to pH 5 set by the buffer except for MOW and MOW-S; the pH for these samples was seven or above, well outside the ideal range of the enzymes (at pH 7, the relative performance of Cellic Ctec2 is about 20% of that at pH 5) [17].
For the rejects, R1 had higher glucose and xylose yields with hot water and dilute sulfuric acid pretreatments than sodium hydroxide pretreatment. The highest percent yield was achieved in the 0.5% sulfuric acid pretreated sample for both glucose (69%) and xylose (75%). This was a significant increase from the 8% glucose and 42% xylose yield from the untreated sample. Untreated R2 performed better than untreated R1 despite their similar compositions, with 27% glucose and 57% xylose recovery. By percent yield, the hot water pretreated R2 had the highest average glucose yield of the rejects samples (70%). The higher standard deviations noted for the recovery of carbohydrates from the rejects may be due to variations in content caused by plastics and other non-uniform contaminations.
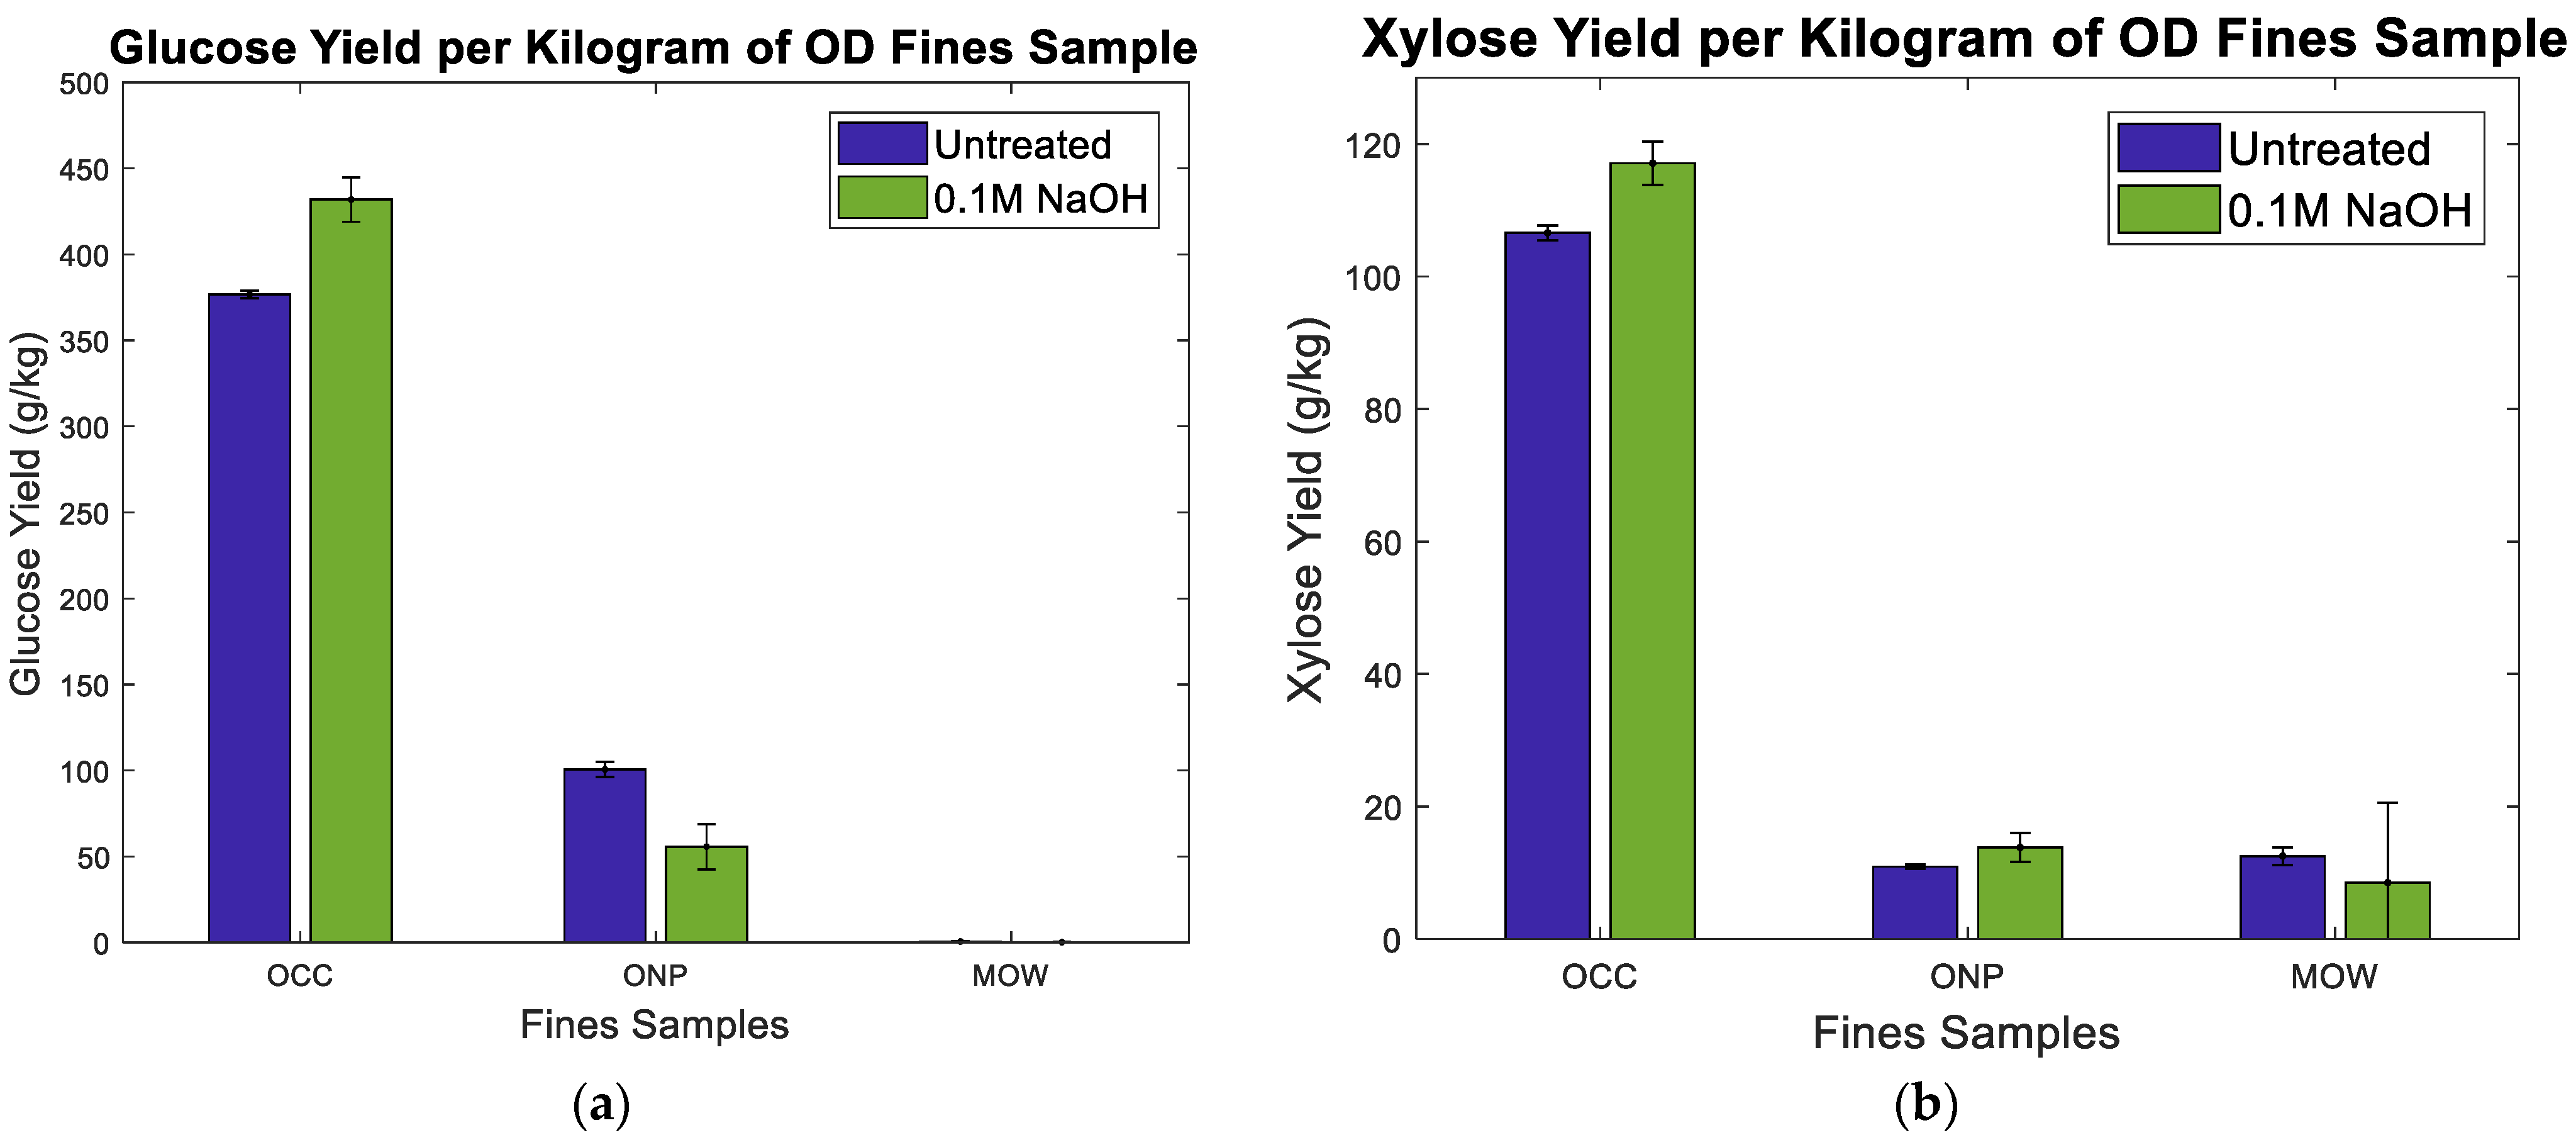
Figure 1a,b illustrate the glucose and xylose yield of the fines samples in grams of sugar per kilogram of oven dry (OD) fines input to the enzymatic hydrolysis. There was negligible loss of fines mass during pretreatment. OCC remained the highest producer of the fines samples in both glucose and xylose yield when adjusted for input mass. ONP xylose yield in both untreated and NaOH pretreated samples was comparable to that of MOW when adjusted for input mass.
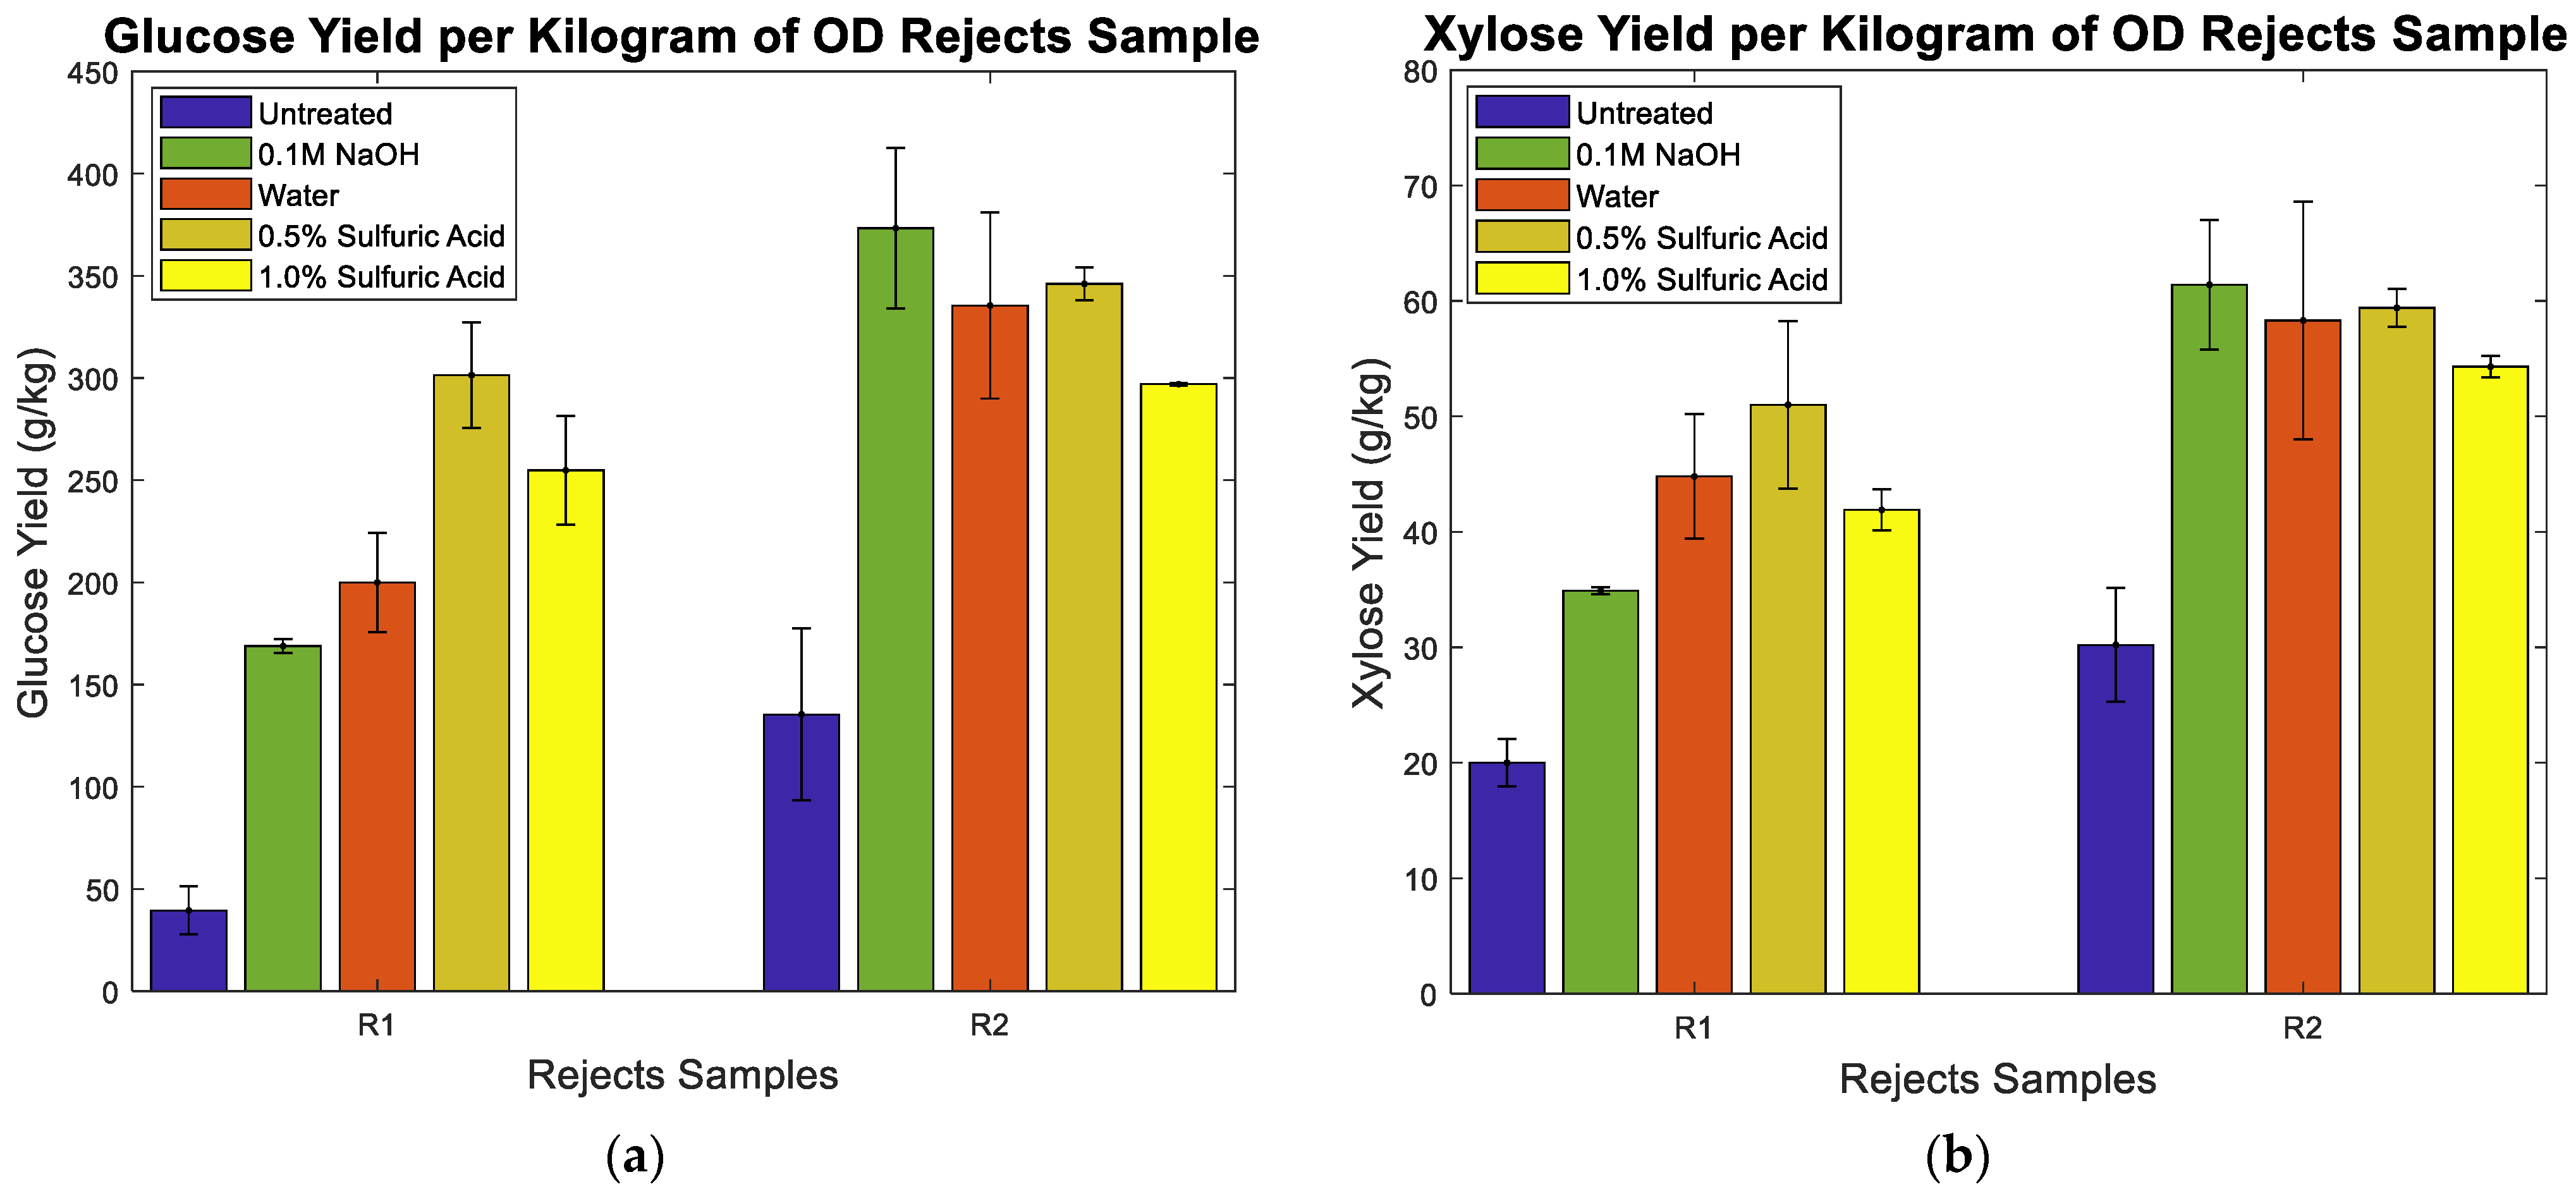
Figure 2a,b illustrate the enzymatic glucose and xylose yield of the mill rejects samples in grams of sugar per kilogram of OD rejects. There was negligible loss of rejects mass during pretreatment. For R1 rejects samples adjusted for sample input mass, 0.5% and 1.0% H2SO4 pretreated samples remained the highest producers of glucose with 301 and 255 g glucose/kg sample, respectively. However, when adjusted for input mass, the water pretreated sample had a similar xylose yield to the 0.5% and 1.0% acid samples. For both glucose and xylose yield, NaOH, 0.5% H2SO4 and 1.0% H2SO4 pretreated R2 samples showed similar results (~350 g glucose/kg sample and ~60 g xylose/kg sample). These R2 samples had the highest recoveries of all the rejects samples.
4. Discussion
As shown in Table 1, the manually collected OCC, ONP and MOW samples were classified as about 90% fines by arithmetic percent. Although the untreated rejects contained a lower arithmetic fines fraction of around 50%, this large fraction still supports the high collection of fines in rejects filters [10,15]. In addition to fines recovered from white water, a recycled fiber facility also collects screen rejects and other waste streams. Screen rejects include material that was not defibered effectively in the pulping system and includes longer, larger fibers in addition to fines. Overall, the fibers that were affected most by pretreatment appear to be the longer fibers. There is a common downward trend in weight-weighted fiber length with increasingly severe acid pretreatment from untreated to 1.0% sulfuric acid pretreated rejects samples. This reduction in the largest fibers indicates their susceptibility to chemical attack [21,22,23].
Of the three fines samples shown in Table 2, OCC had the highest carbohydrate and cellulose content by about 10% followed by ONP. This gap increased further with sodium hydroxide pretreatment, while the OCC lignin content decreased by about 1% and ash by 3.5%. Lignin content for ONP increased by 2.5%, indicating a slightly larger loss of polysaccharides during NaOH pretreatment for the ONP samples. Each of these trends indicates the potential in OCC fines for enzymatic saccharification: the increase in carbohydrate and cellulose content indicates the carbohydrates were not extensively damaged during pretreatment; the small reduction in lignin content signifies a disruption of the lignocellulosic protective matrix; and the reduction in ash shows that fewer compounds are present to alter the pH during subsequent enzymatic saccharification [19,24].
Both ONP and MOW lost carbohydrates during pretreatment while their ash content increased slightly, potentially indicating minor degradation of amorphous carbohydrates while filler and other contaminant content of the fines remained unchanged [18]. As mentioned, the ONP lignin content increased slightly during pretreatment, while the MOW sample experienced a slight decrease in lignin content. MOW samples already started with minimal lignin content due to extensive lignin removal during the chemical pulping process [25]. The high overall lignin content in ONP and ash fraction in MOW most likely contributed to the poor enzymatic saccharification of the ONP and MOW samples [19].
The promising trends in the OCC composition changes with pretreatment were supported in the enzymatic hydrolysis results shown in Table 3 and Figure 1a,b. Even without pretreatment, OCC fines already showed positive results with 83% glucose yield (377 g/kg fines). The xylose yield was around 100%. The glucose results improved to 91% glucose yield (432 g/kg fines) with NaOH pretreatment. At first glance, it seems surprising that OCC had such a high glucose yield given that cardboard fiber is generally produced using a semi-chemical pulping process and still contains a significant amount of lignin compared to chemically pulped fiber like MOW (~25% for OCC and OCC-S). However, there have been examples of mechanically treated fiber responding well to enzymatic hydrolysis despite having high lignin content; mechanically treated fiber has been shown to achieve enzymatic glucose yields up to 90% and xylose yields as high as 79% [26].
The glucose and xylose yields for OCC were much higher than ONP; the highest glucose yield was only 28.3% (101 g/kg fines) in the untreated sample, and the highest xylose yield was 31.1% (13.8 g/kg fines) in the sodium hydroxide pretreated sample. These poor results for ONP were due in part to its very high lignin (>36%, much higher than the OCC samples) and lower carbohydrate content; lignin inhibits access of the enzymes, and the low carbohydrate content results in less yield per unit of fines supplied to the hydrolysis [19]. Furthermore, during enzymatic hydrolysis ONP required additional buffer and water addition due to extensive absorption of the moisture by the fines sample, creating a sludge that did not mix with rotation of the samples. This sludging caused more of an issue in the ONP-S. The lack of proper mixing could have contributed to the drop in glucose yield from 28.3 to 15.9% for ONP and ONP-S.
MOW samples showed almost no glucose yield. Chemical treatment of fiber tends to reduce amorphous cellulose content in fiber due to the susceptibility of these regions to hydrolysis. The remaining crystalline regions are extremely difficult for enzymes to access, which may have contributed to low sugar yields [21,22,27]. The high pH of these samples caused by the larger filler content (most likely carbonates) also caused process issues due to the low activity of the enzyme blend at higher pH [10,17]. Hemicellulose does not have crystalline regions due to the heterogeneity of these biomass polymers; this may have allowed the enzymes to degrade the xylan polymer in MOW samples at a comparable level to the ONP samples, even at the low activity caused by increased pH [28]. Overall, these ONP and MOW samples are not viable in the form used in this study due to their low polysaccharide content and high ink and filler content, which resulted in low carbohydrate yields per kilogram of biomass input.
The two untreated rejects samples had very similar cellulose content (~43%) prior to pretreatment (see Table 2). However, R1 had lower overall carbohydrate and xylose content and higher lignin and ash content than R2. Recycle mill R1 utilizes mixed recycled fiber material (OCC, ONP, and MOW), while R2 uses OCC only. Despite having higher lignin content than R2, R1 did not maintain its cellulose content with pretreatment as well as R2. Although R1 increased in cellulose content with sodium hydroxide pretreatment to 48%, R2 increased further to 51%. Additionally, the cellulose in R1 appeared much more susceptible to hydrolysis during pretreatment with increasing sulfuric acid pretreatment than R2; the cellulose contents of the water, 0.5%, and 1.0% acid pretreated R1 samples were all lower than the untreated sample, while R2 had either the same or higher cellulose content than the untreated sample. Xylan content for R1 increased for all samples after pretreatment, while R2 xylan content remained approximately constant, although still higher than that of R1. In both R1 and R2, hot water and acid pretreatments appeared to be more effective at reducing the lignin content and thereby increasing the cellulose accessibility by the enzymes [7,19]. For R1 and R2, the final pH’s after pretreatment ranged from about pH 8 for hot water to pH 4.5 for 1.0% sulfuric acid.
Overall, R2 performed better than R1 in glucose and xylose yield, both by percent yield and yield per kilogram of biomass as shown by Table 3 and Figure 2a,b. R2 had the highest percent glucose yield of 70% with water pretreatment, and the highest percent xylose yield of 88% with NaOH pretreatment. However, when these results were adjusted for input rejects mass, R2-S had both the highest glucose (373 g/kg rejects) and xylose (61.4 g/kg rejects) yield of the rejects due to its high cellulose content (51%). R1 had both its highest percent and mass yield of glucose and xylose after pretreatment with 0.5% sulfuric acid, possibly due to the higher filler (ash) content of the R1 samples, which required more neutralization in order for the acid pretreatment to have an effect on the pH [24]. For both R1 and R2 acid pretreated samples, lower acid concentration (0–0.5%) appeared to be better for both glucose and xylose yields, both by percent yield and yield per kilogram of rejects most likely due to extensive polysaccharide degradation and loss at lower pH [4].
The best average glucose and xylose yield per kilogram of rejects occurred in the R2-S samples. However, due to the large variation in the results, hot water pretreatment appears to have very similar potential for R2 recovery of carbohydrates. The variation in the hydrolysis results was most likely caused by the non-uniformity of the rejects caused by contaminants like plastics, filler and inks. Hot water has a similar effect to dilute acid pretreatment by releasing acetyl groups from the hemicellulose in the biomass, effectively reducing the pH and furthering the pretreatment effect on the carbohydrates and lignin [4]. This effect is realized without the further addition of chemicals to the solution, saving on costs and toxicity of the process. As the hot water process more than doubled the glucose and xylose yields of the untreated R2 sample (with 335 and 58.3 g/kg rejects, respectively), and had comparative results with the other pretreated samples, the hot water process appears to be the best method for recovering carbohydrates from high OCC rejects like R2. Water and dilute acid pretreatments also had the benefit of partially or fully neutralizing the alkaline filler in the rejects, reducing or eliminating the need for chemical addition to adjust the pH following pretreatment.
Based on the results of this study, the OCC (both fiber and fines) content of paper rejects is a good indicator for high carbohydrate production potential. The OCC fines had much higher glucose and xylose yields than ONP and MOW in both untreated and pretreated samples. R2 is an OCC recycling mill, while R1 processes a mixed fiber recycling stream. As R2 showed better carbohydrate yields per kilogram of rejects in all untreated and pretreated samples, it is apparent that in this experimental design, higher OCC content in the rejects stream led to better glucose and xylose yields from enzymatic saccharification. However, this may also be due to the R1 rejects having a higher contamination content than R2, which influences the yield per kilogram of rejects; R1 had higher ash and lignin content than R2, indicating higher filler and ink content. Higher contamination content results in lower cellulose content, causing lower yield per kilogram of reject. By percent yield, R1 performs comparably to R2 after 0.5 and 1.0% sulfuric acid pretreatment. Therefore, if the contamination content of a linerboard recycled fiber rejects stream like R1 could be efficiently reduced, both rejects streams could show similar potential with regard to the recovery of carbohydrates.
5. Conclusions
Recycled paper rejects show significant potential as a feedstock for lignocellulosic sugar production. However, as this research has shown, different rejects streams will have different sugar production potential based on the type of paper being recycled. Analysis of collected OCC, ONP, and MOW fines fractions showed that OCC fines have the highest cellulose and the least contaminant content. With these advantages, sodium hydroxide pretreated OCC was the highest glucose and xylose producer of the fines, with 432 g glucose and 117 g xylose/kg fines—more than five times higher than the second highest producer, ONP. These results suggest that rejects from mills with high OCC content would have the best carbohydrate production potential.
Enzymatic hydrolysis of a mixed recycled fiber rejects stream (R1) and a high OCC content rejects stream (R2) supported this conclusion. Although R1 and R2 both had 43% cellulose content, the high OCC content R2 rejects showed better enzymatic glucose and xylose yields under all untreated and pretreated conditions examined. Sodium hydroxide pretreated R2 was the highest producing rejects sample with 373 g glucose and 61 g xylose produced per kilogram of rejects. However, the hot water pretreated R2 was not far behind with 335 g glucose and 58 g xylose produced per kilogram of rejects. Therefore, hot water pretreatment is recommended for sugar production from paper mill rejects to minimize chemical addition.
Author Contributions
Conceptualization, J.R. and U.T.; methodology, U.T.; software, J.R.; validation, J.R. and U.T.; formal analysis, J.R.; investigation, J.R.; resources, J.R. and U.T.; data curation, J.R.; writing—original draft preparation, J.R.; writing—review and editing, J.R. and U.T.; visualization, J.R.; supervision, U.T.; project administration, U.T.; funding acquisition, U.T. All authors have read and agreed to the published version of the manuscript.
Funding
This research was funded by the Department of Bioproducts and Biosystems Engineering at the University of Minnesota and the Baker Foundation.
Institutional Review Board Statement
Not applicable.
Informed Consent Statement
Not applicable.
Data Availability Statement
Please contact Joseph Rauzi at [email protected] if you would like access to any data related to this study.
Conflicts of Interest
The authors declare no conflict of interest.
References
- Marinas, M.-C.; Dinu, M.; Socal, A.-G.; Socol, C. Renewable energy consumption and economic growth. Causality relationship in Central and Eastern European countries. PLoS ONE 2018, 13, e0202951. [Google Scholar] [CrossRef] [Green Version]
- Ciriminna, R.; Pagliaro, M. Biodegradable and Compostable Plastics: A Critical Perspective on the Dawn of their Global Adoption. ChemistryOpen 2020, 9, 8–13. [Google Scholar] [CrossRef] [PubMed]
- Chirat, C. Use of vegetal biomass for biofuels and bioenergy: Competition with the production of bioproducts and materials. Comptes Rendus Phys. 2017, 18, 462–468. [Google Scholar] [CrossRef]
- Brodin, M.; Vallejos, M.; Opedal, M.T.; Area, M.; Chinga-Carrasco, G. Lignocellulosics as sustainable resources for production of bioplastics—A review. J. Clean. Prod. 2017, 162, 646–664. [Google Scholar] [CrossRef]
- Hill, J.; Nelson, E.; Tilman, D.; Polasky, S.; Tiffany, D. Environmental, economic, and energetic costs and benefits of biodiesel and ethanol biofuels. Proc. Natl. Acad. Sci. USA 2006, 13, 11206–11210. [Google Scholar] [CrossRef] [Green Version]
- Schmer, M.R.; Vogel, P.; Mitchell, R.B.; Perrin, R.K. Net energy of cellulosic ethanol from switchgrass. Proc. Natl. Acad. Sci. USA 2008, 105, 464–469. [Google Scholar] [CrossRef] [Green Version]
- Chen, H. Process Development and Fundamental Study on Enzymatic Hydrolysis of Cellulosic Biomass to Fermentable Sugars for Ethanol Production. Ph.D. Thesis, North Carolina State University, Raleigh, NC, USA, 2014. [Google Scholar]
- Yang, B.; Wyman, C.E. Pretreatment: The key to unlocking low-cost cellulosic ethanol. Biofuels Bioprod. Biorefining 2007, 2, 26–40. [Google Scholar] [CrossRef]
- Mostafa, Y.S.; Alrumman, S.A.; Otaif, K.A.; Alamri, S.A.; Mostafa, M.S.; Sahlabji, T. Production and Characterization of Bioplastic by Polyhydroxybutyrate Accumulating Erythrobacter Aquimaris Isolated from Mangrove Rhizosphere. Molecules 2020, 25, 179. [Google Scholar] [CrossRef] [Green Version]
- Jeffries, T.W.; Schartman, R. Bioconversion of secondary fiber fines to ethanol using counter-current enzymatic saccharification and Co-fermentation. Appl. Biochem. Biotechnol. 1999, 78, 435–444. [Google Scholar] [CrossRef]
- Shie, J.-L.; Yang, W.-S.; Liau, Y.-R.; Liau, T.-H.; Yang, H.-R. Subcritical Hydrothermal Co-Liquefaction of Process Rejects at a Wastepaper-Based Paper Mill with Waste Soybean Oil. Energies 2021, 14, 2442. [Google Scholar] [CrossRef]
- Pan, J.; Voulvoulis, N. The Role of Mechanical and Biological Treatment in Reducing Methane Emissions from Landfill Disposal of Municipal Solid Waste in the United Kingdom. J. Air Waste Manag. Assoc. 2007, 57, 155–163. [Google Scholar] [CrossRef] [PubMed] [Green Version]
- Zambare, V.P.; Christopher, L.P. Integrated biorefinery approach to utilization of pulp and paper mill sludge for value-added products. J. Clean. Prod. 2020, 274, 122791. [Google Scholar] [CrossRef]
- Duncan, S.M.; Alkasrawi, M.; Gurram, R.; Almomoani, F.; Wiberley-Bradford, A.E.; Signsaas, E. Paper Mill Sludge as a Source of Sugars for Use in the Production of Bioethanol and Isoprene. Energies 2020, 13, 4662. [Google Scholar] [CrossRef]
- Min, B.C.; Bhayani, B.V.; Jampana, V.S.; Ramarao, B.V. Enhancement of the enzymatic hydrolysis of fines from recycled paper mill waste rejects. Bioresour. Bioprocess. 2015, 2, 40. [Google Scholar] [CrossRef] [Green Version]
- Bergeron, P.W.; Riley, C.J. Wastepaper as a Feedstock for Ethanol Production; National Renewable Energy Laboratory Technical Report NREL/TP-232-4237; National Renewable Energy Lab.: Golden, CO, USA, 1991.
- Cellic® CTec2 and HTec2—Enzymes for Hydrolysis of Lignocellulosic Materials, Novozymes®, Application Sheet. Available online: https://www.yumpu.com/en/document/read/35286682/novozymes-cellicar-ctec2-and-htec2-enzymes-for-hydrolysis-of- (accessed on 8 March 2022).
- Hon, D.N.-S.; Shiraishi, N.; Lai, Y.Z. Chemical Degradation. In Wood and Cellulosic Chemistry, 2nd ed.; CRC Press: New York, NY, USA, 2019. [Google Scholar]
- Kucharska, K.; Rybarczyk, P.; Holowacz, I.; Lukajtis, R.; Glinka, M.; Kaminski, M. Pretreatment of Lignocellulosic Materials as Substrates for Fermentation Processes. Molecules 2018, 23, 2937. [Google Scholar] [CrossRef] [Green Version]
- T 211 om-02; Ash in Wood, Pulp, Paper and Paperboard: Combustion at 525 °C. Technical Association of the Pulp and Paper Industry: Atlanta, GA, USA, 2002.
- Wistara, N.; Zhang, X.; Young, R.A. Properties and treatments of pulps from recycled paper. Part II. Surface properties and crystallinity of fibers and fines. Cellulose 1999, 6, 325–348. [Google Scholar] [CrossRef]
- Hall, M.; Bansal, P.; Lee, J.H.; Realff, M.J.; Bommarius, A.S. Cellulose crystallinity—A key predictor of the enzymatic hydrolysis rate. FEBS J. 2010, 277, 1571–1582. [Google Scholar] [CrossRef]
- Arantes, V.; Fourlay, K.; Saddler, J.N. The enzymatic hydrolysis of pretreated pulp fibers predominantly involves “peeling/erosion” modes of action. Biotechnol. Biofuels 2014, 7, 87–97. [Google Scholar] [CrossRef] [Green Version]
- Hubbe, M.A.; Gill, R.A. Fillers for papermaking: A review of their properties, usage practices, and their mechanistic role. Bioresources 2016, 11, 2886–2963. [Google Scholar] [CrossRef] [Green Version]
- Ioelovich, M. Waste Paper as Promising Feedstock for Production of Biofuel. J. Sci. Res. Rep. 2014, 3, 905–916. [Google Scholar] [CrossRef] [PubMed]
- Chen, X.; Wang, W.; Ciesielski, P.; Trass, O.; Park, S.; Tao, L.; Tucker, M.P. Improving Sugar Yields and Reducing Enzyme Loadings in the Deacetylation and Mechanical Refining (DMR) Process through Multistage Disk and Szego Refining and Corresponding Techno-Economic Analysis. ACS Sustain. Chem. Eng. 2016, 4, 324–333. [Google Scholar] [CrossRef]
- Bensah, E.C.; Mensah, M. Chemical Pretreatment Methods for the Production of Cellulosic Ethanol: Technologies and Innovations. J. Chem. Eng. 2013, 2013, 719607. [Google Scholar] [CrossRef]
- Sorieul, M.; Dickson, A.; Hill, S.J.; Pearson, H.; Labidi, J. Plant Fibre: Molecular Structure and Biomechanical Properties, of a Complex Living Material, Influencing Its Deconstruction towards a Biobased Composite. Materials 2016, 9, 618. [Google Scholar] [CrossRef] [PubMed]
Figure 1.
Carbohydrate yield from paper fines in grams of sugar produced per kilogram of oven dry fines starting material: (a) glucose yield; (b) xylose yield. The error bars indicate ± one standard deviation from the mean. The legend entries (top to bottom) correspond to the bars in each category (left to right).

Figure 2.
Carbohydrate yield from paper rejects in grams of sugar produced per kilogram of oven dry rejects starting material: (a) glucose yield; (b) xylose yield. The error bars indicate ± one standard deviation from the mean. The legend entries (top to bottom) correspond to the bars in each category (left to right).


Table 1.
Fines content and length characterization of fines samples.
| Sample | Arithmetic Fines (%) | Length Weighted Fines (%) | Arithmetic Mean Length (mm) | Length Weighted Mean Length (mm) | Weight Weighted Mean Length (mm) |
|---|---|---|---|---|---|
| OCC | 91.49 | 79.92 | 0.124 | 0.188 | 0.765 |
| OCC-S | 91.63 | 81.74 | 0.123 | 0.158 | 0.334 |
| ONP | 89.51 | 77.39 | 0.130 | 0.177 | 0.396 |
| ONP-S | 89.94 | 77.57 | 0.131 | 0.212 | 1.033 |
| MOW | 93.80 | 84.03 | 0.117 | 0.153 | 0.273 |
| MOW-S | 92.44 | 82.29 | 0.119 | 0.152 | 0.254 |
| R1 | 49.11 | 11.13 | 0.497 | 1.455 | 2.538 |
| R1-S | 45.33 | 9.11 | 0.552 | 1.519 | 2.519 |
| R1-W | 49.48 | 11.30 | 0.491 | 1.432 | 2.532 |
| R1-A5 | 48.87 | 11.48 | 0.475 | 1.349 | 2.431 |
| R1-A1 | 47.27 | 11.07 | 0.483 | 1.317 | 2.300 |
| R2 | 44.21 | 8.53 | 0.576 | 1.577 | 2.632 |
| R2-S | 34.51 | 5.84 | 0.688 | 1.624 | 2.531 |
| R2-W | 37.23 | 6.36 | 0.663 | 1.627 | 2.526 |
| R2-A5 | 36.34 | 6.17 | 0.670 | 1.617 | 2.533 |
| R2-A1 | 41.26 | 8.50 | 0.557 | 1.405 | 2.407 |
Table 2.
Biomass characterization of fiber samples: carbohydrate, ash, and lignin content.
| Sample | Total Carbohydrates (%) 1 | Cellulose (%) 1 | Xylan (%) 1 | Glucomannan (%) 1 | Ash (%) 1 | Klason Lignin (%) 1 |
|---|---|---|---|---|---|---|
| OCC | 53.2 ± 4.4 | 40.8 ± 2.1 | 9.0 ± 1.0 | 2.5 ± 0.2 | 17.4 ± 0.1 | 25.8 ± 2.8 |
| OCC-S | 57.5 ± 4.9 | 43.0 ± 1.7 | 10.6 ± 1.0 | 2.9 ± 0.7 | 14.9 ± 0.0 | 24.7 ± 3.7 |
| ONP | 46.3 ± 3.7 | 32.0 ± 2.5 | 4.5 ± 0.6 | 7.8 ± 0.5 | 2.8 ± 0.0 | 36.4 ± 0.4 |
| ONP-S | 45.6 ± 3.7 | 31.4 ± 2.5 | 3.9 ± 0.3 | 7.3 ± 0.2 | 4.5 ± 0.2 | 38.9 ± 0.9 |
| MOW | 29.7 ± 0.8 | 19.3 ± 0.6 | 9.7 ± 0.2 | N/A | 68.9 ± 1.2 | 4.9 ± 0.3 |
| MOW-S | 27.9 ± 1.1 | 17.6 ± 0.9 | 10.3 ± 0.2 | N/A | 71.5 ± 0.2 | 3.4 ± 0.6 |
| R1 | 52.0 ± 2.4 | 43.5 ± 1.8 | 4.2 ± 0.0 | 3.9 ± 0.3 | 30.4 ± 1.2 | 19.9 ± 0.5 |
| R1-S | 58.3 ± 0.1 | 48.3 ± 0.3 | 5.9 ± 0.1 | 3.7 ± 0.2 | 24.8 ± 0.2 | 19.0 ± 0.8 |
| R1-W | 53.1 ± 2.5 | 40.8 ± 1.4 | 6.2 ± 0.3 | 4.8 ± 0.3 | 22.3 ± 0.1 | 17.3 ± 0.3 |
| R1-A5 | 51.4 ± 0.9 | 38.4 ± 0.7 | 6.0 ± 0.0 | 4.6 ± 0.2 | 24.5 ± 0.5 | 16.2 ± 1.2 |
| R1-A1 | 47.9 ± 0.3 | 39.0 ± 0.2 | 5.7 ± 0.1 | 2.2 ± 0.1 | 25.0 ± 0.6 | 15.9 ± 1.8 |
| R2 | 56.2 ± 1.5 | 43.1 ± 0.6 | 7.2 ± 0.1 | 4.5 ± 0.2 | 18.5 ± 0.0 | 17.9 ± 1.1 |
| R2-S | 65.0 ± 1.4 | 51.1 ± 1.5 | 7.9 ± 0.2 | 5.1 ± 0.1 | 11.5 ± 1.1 | 19.4 ± 1.8 |
| R2-W | 54.8 ± 2.4 | 43.1 ± 1.9 | 7.1 ± 0.2 | 3.8 ± 0.3 | 16.7 ± 3.0 | 17.0 ± 1.0 |
| R2-A5 | 62.8 ± 0.3 | 48.7 ± 0.3 | 7.7 ± 0.0 | 5.0 ± 0.0 | 15.2 ± 0.1 | 16.9 ± 0.3 |
| R2-A1 | 59.6 ± 3.7 | 46.4 ± 1.7 | 6.9 ± 0.6 | 4.7 ± 0.5 | 17.3 ± 0.6 | 16.7 ± 0.5 |
1 The indicated error is ± one standard deviation from the mean.
Table 3.
Average adjusted glucose and xylose yield from enzymatic hydrolysis.
| Sample | Average Glucose Yield (%) 1 | Average Xylose Yield (%) 1 |
|---|---|---|
| OCC | 83.2 ± 0.5 | 104.2 ± 1.1 |
| OCC-S | 90.5 ± 2.7 | 97.5 ± 2.7 |
| ONP | 28.3 ± 1.2 | 21.3 ± 0.7 |
| ONP-S | 15.9 ± 3.7 | 31.1 ± 4.9 |
| MOW | 0.3 ± 0.1 | 11.4 ± 1.2 |
| MOW-S | 0.1 ± 0.2 | 7.3 ± 10.3 |
| R1 | 8.2 ± 2.4 | 41.9 ± 4.3 |
| R1-S | 31.5 ± 0.6 | 51.9 ± 0.5 |
| R1-W | 44.2 ± 5.4 | 64.0 ± 7.7 |
| R1-A5 | 68.9 ± 5.9 | 74.7 ± 10.6 |
| R1-A1 | 58.9 ± 6.1 | 65.2 ± 2.8 |
| R2 | 27.3 ± 8.5 | 56.9 ± 9.3 |
| R2-S | 63.5 ± 6.7 | 87.5 ± 7.9 |
| R2-W | 70.1 ± 9.5 | 72.5 ± 12.8 |
| R2-A5 | 64.0 ± 1.5 | 68.3 ± 1.9 |
| R2-A1 | 57.6 ± 0.1 | 69.1 ± 1.2 |
1 The indicated error is ± one standard deviation from the mean.
Publisher’s Note: MDPI stays neutral with regard to jurisdictional claims in published maps and institutional affiliations. |
© 2022 by the authors. Licensee MDPI, Basel, Switzerland. This article is an open access article distributed under the terms and conditions of the Creative Commons Attribution (CC BY) license (https://creativecommons.org/licenses/by/4.0/).
Share and Cite
MDPI and ACS Style
Rauzi, J.; Tschirner, U. Enzymatic Glucose and Xylose Production from Paper Mill Rejects. Recycling 2022, 7, 24. https://0-doi-org.brum.beds.ac.uk/10.3390/recycling7020024
AMA Style
Rauzi J, Tschirner U. Enzymatic Glucose and Xylose Production from Paper Mill Rejects. Recycling. 2022; 7(2):24. https://0-doi-org.brum.beds.ac.uk/10.3390/recycling7020024
Chicago/Turabian StyleRauzi, Joseph, and Ulrike Tschirner. 2022. "Enzymatic Glucose and Xylose Production from Paper Mill Rejects" Recycling 7, no. 2: 24. https://0-doi-org.brum.beds.ac.uk/10.3390/recycling7020024