
Tree Crowns Segmentation and Classification in Overlapping Orchards Based on Satellite Images and Unsupervised Learning Algorithms

Abstract
:1. Introduction
2. Materials and Methods
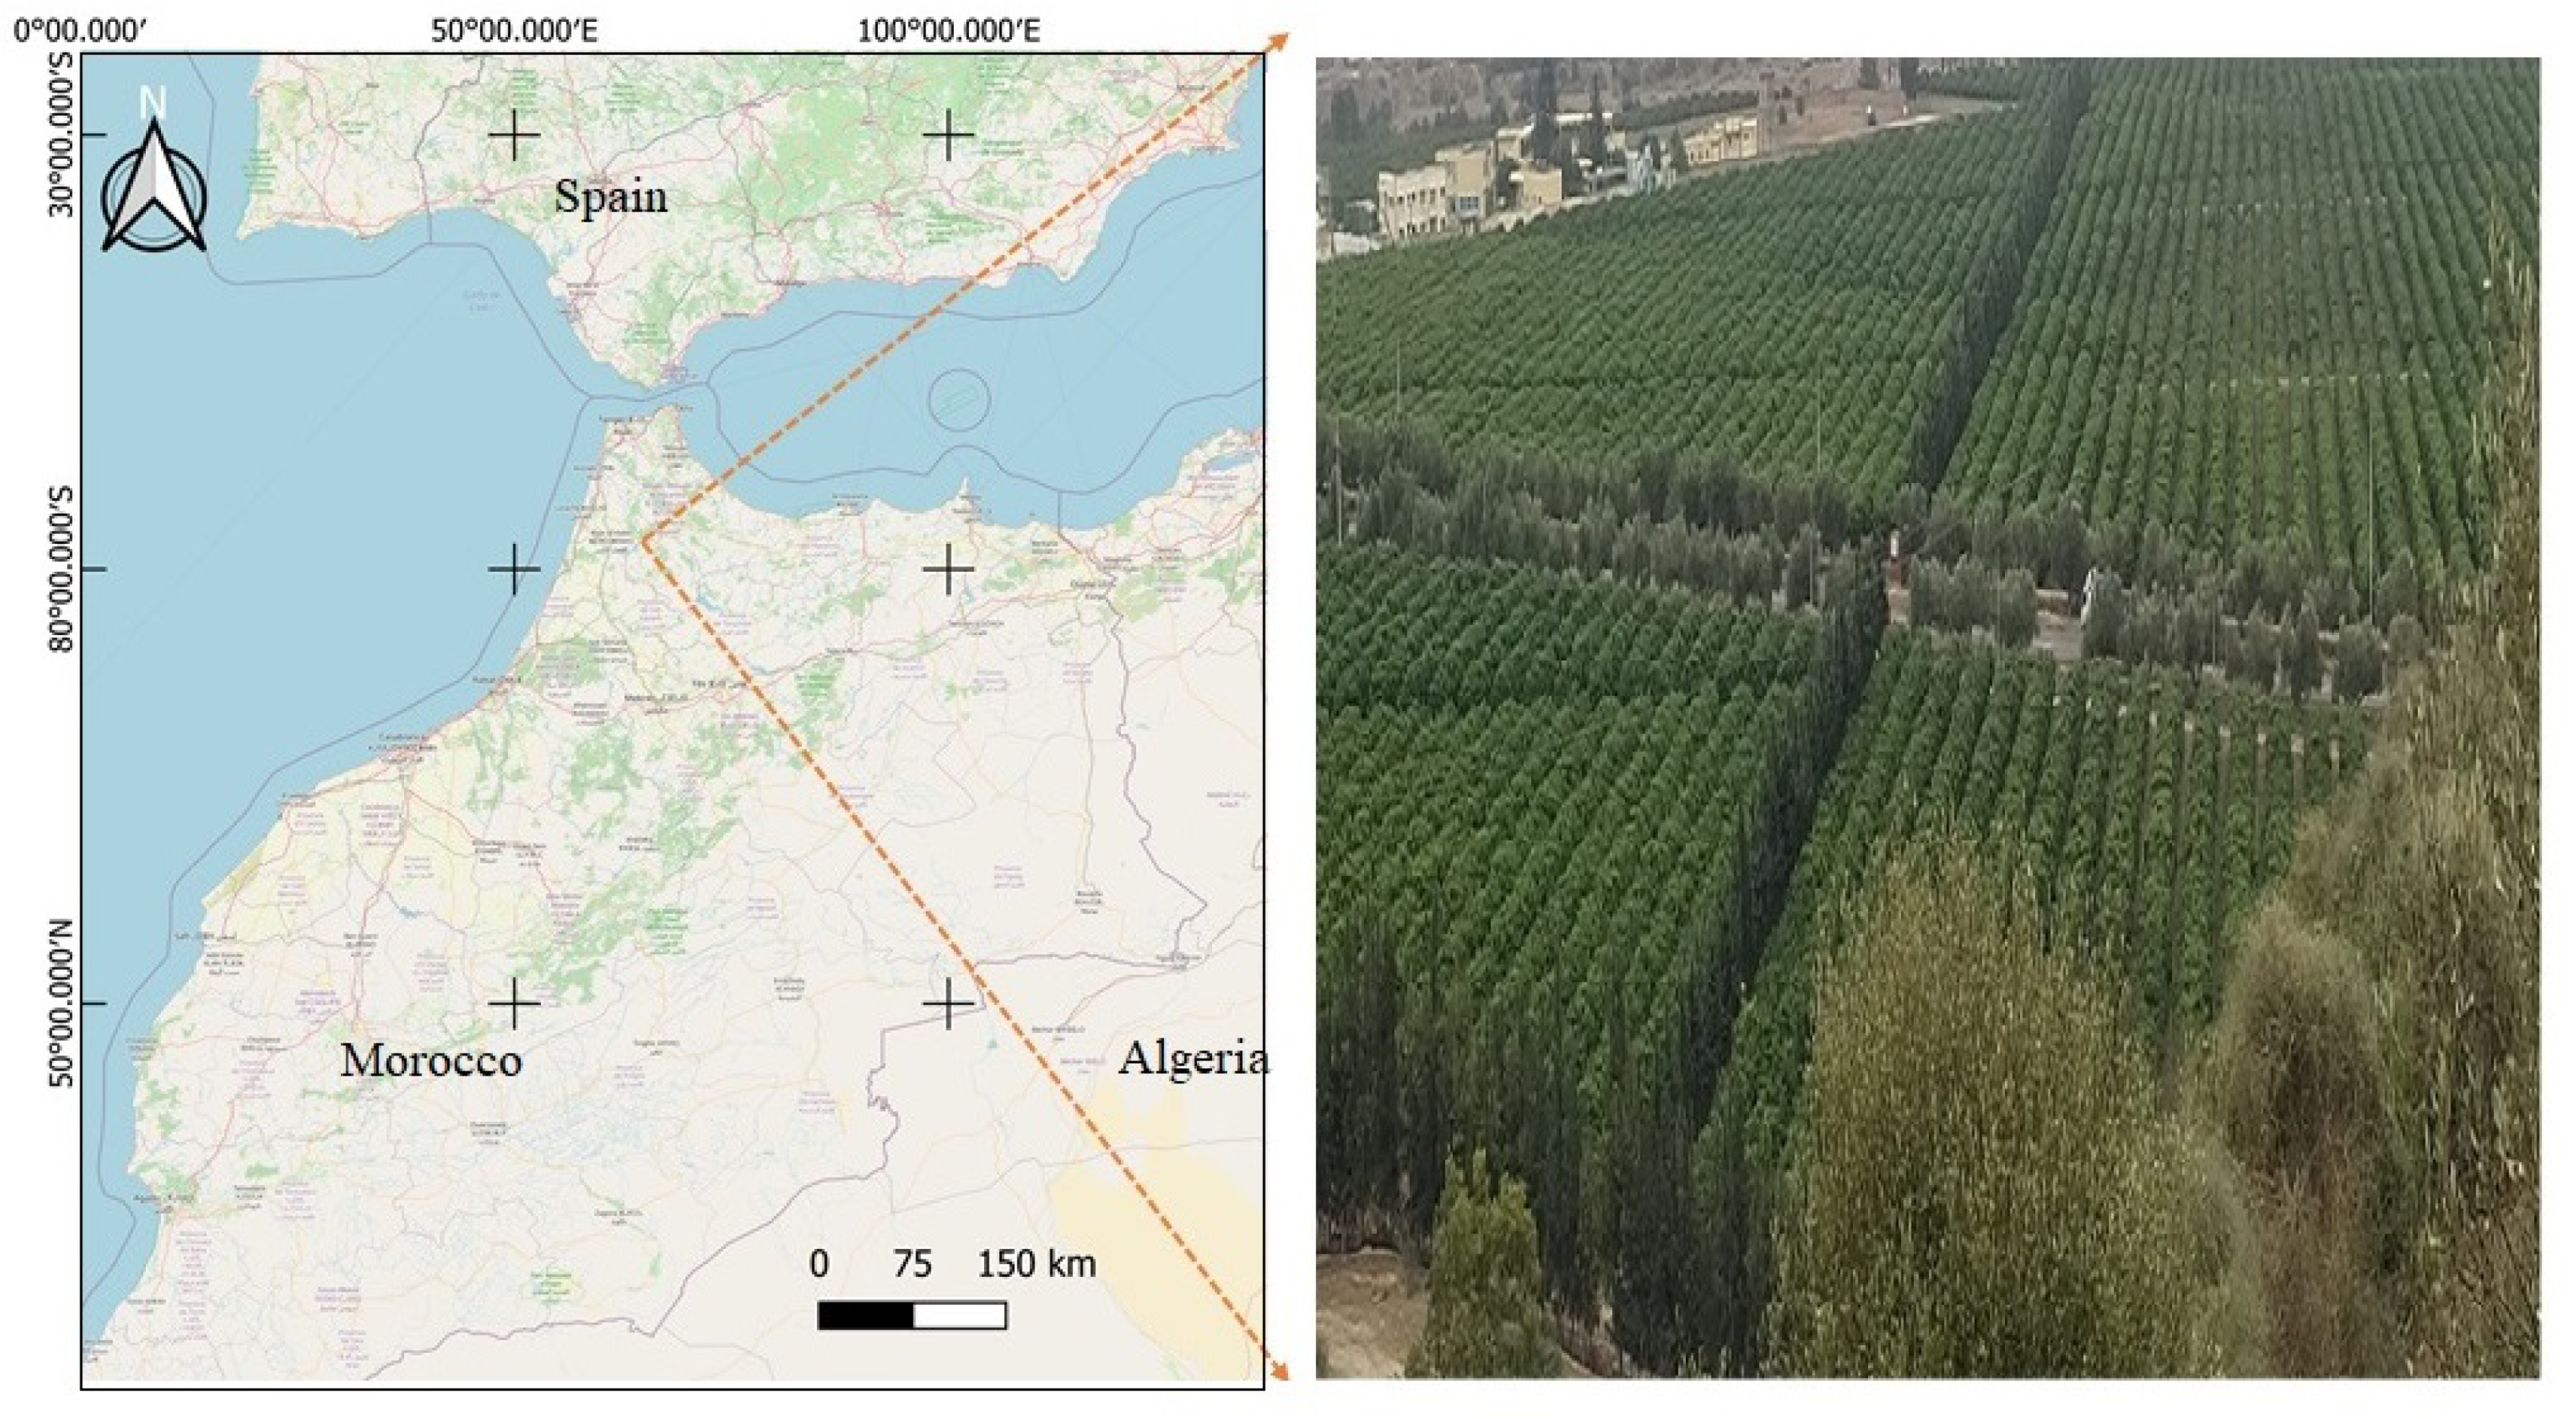
2.1. Study Region
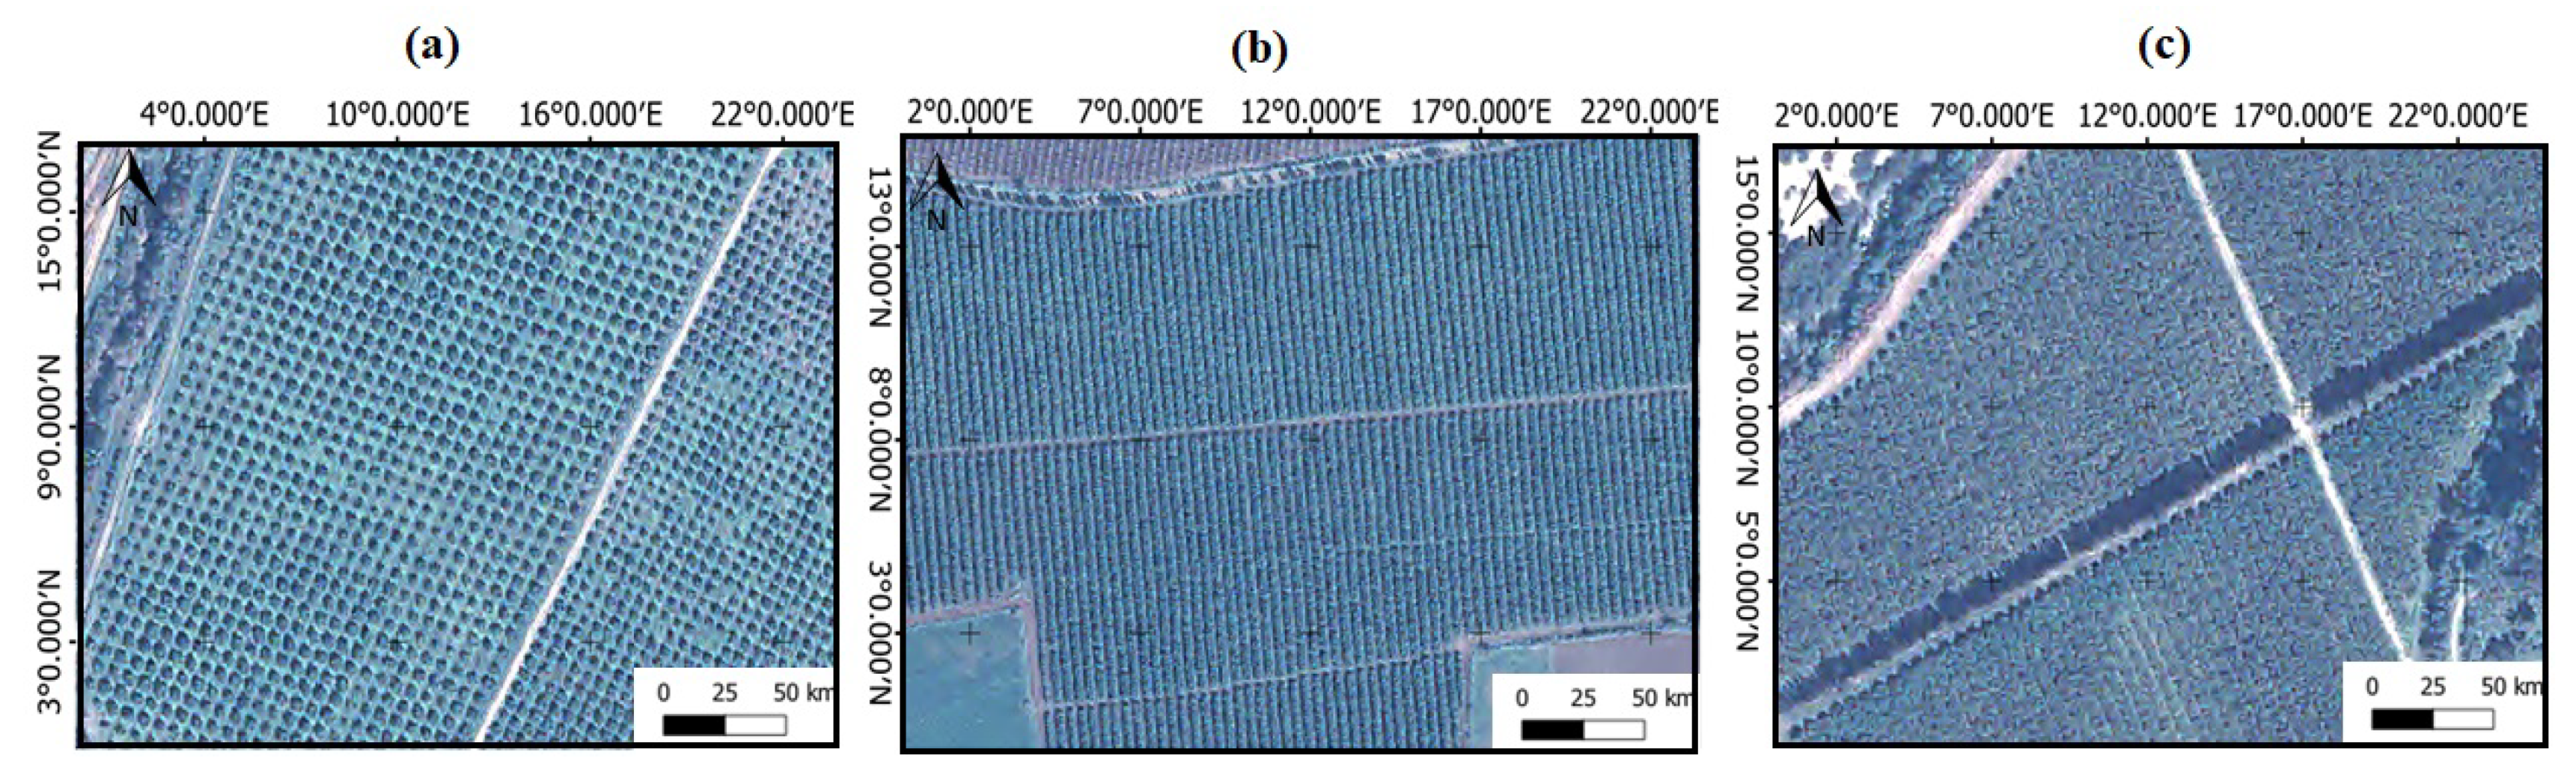
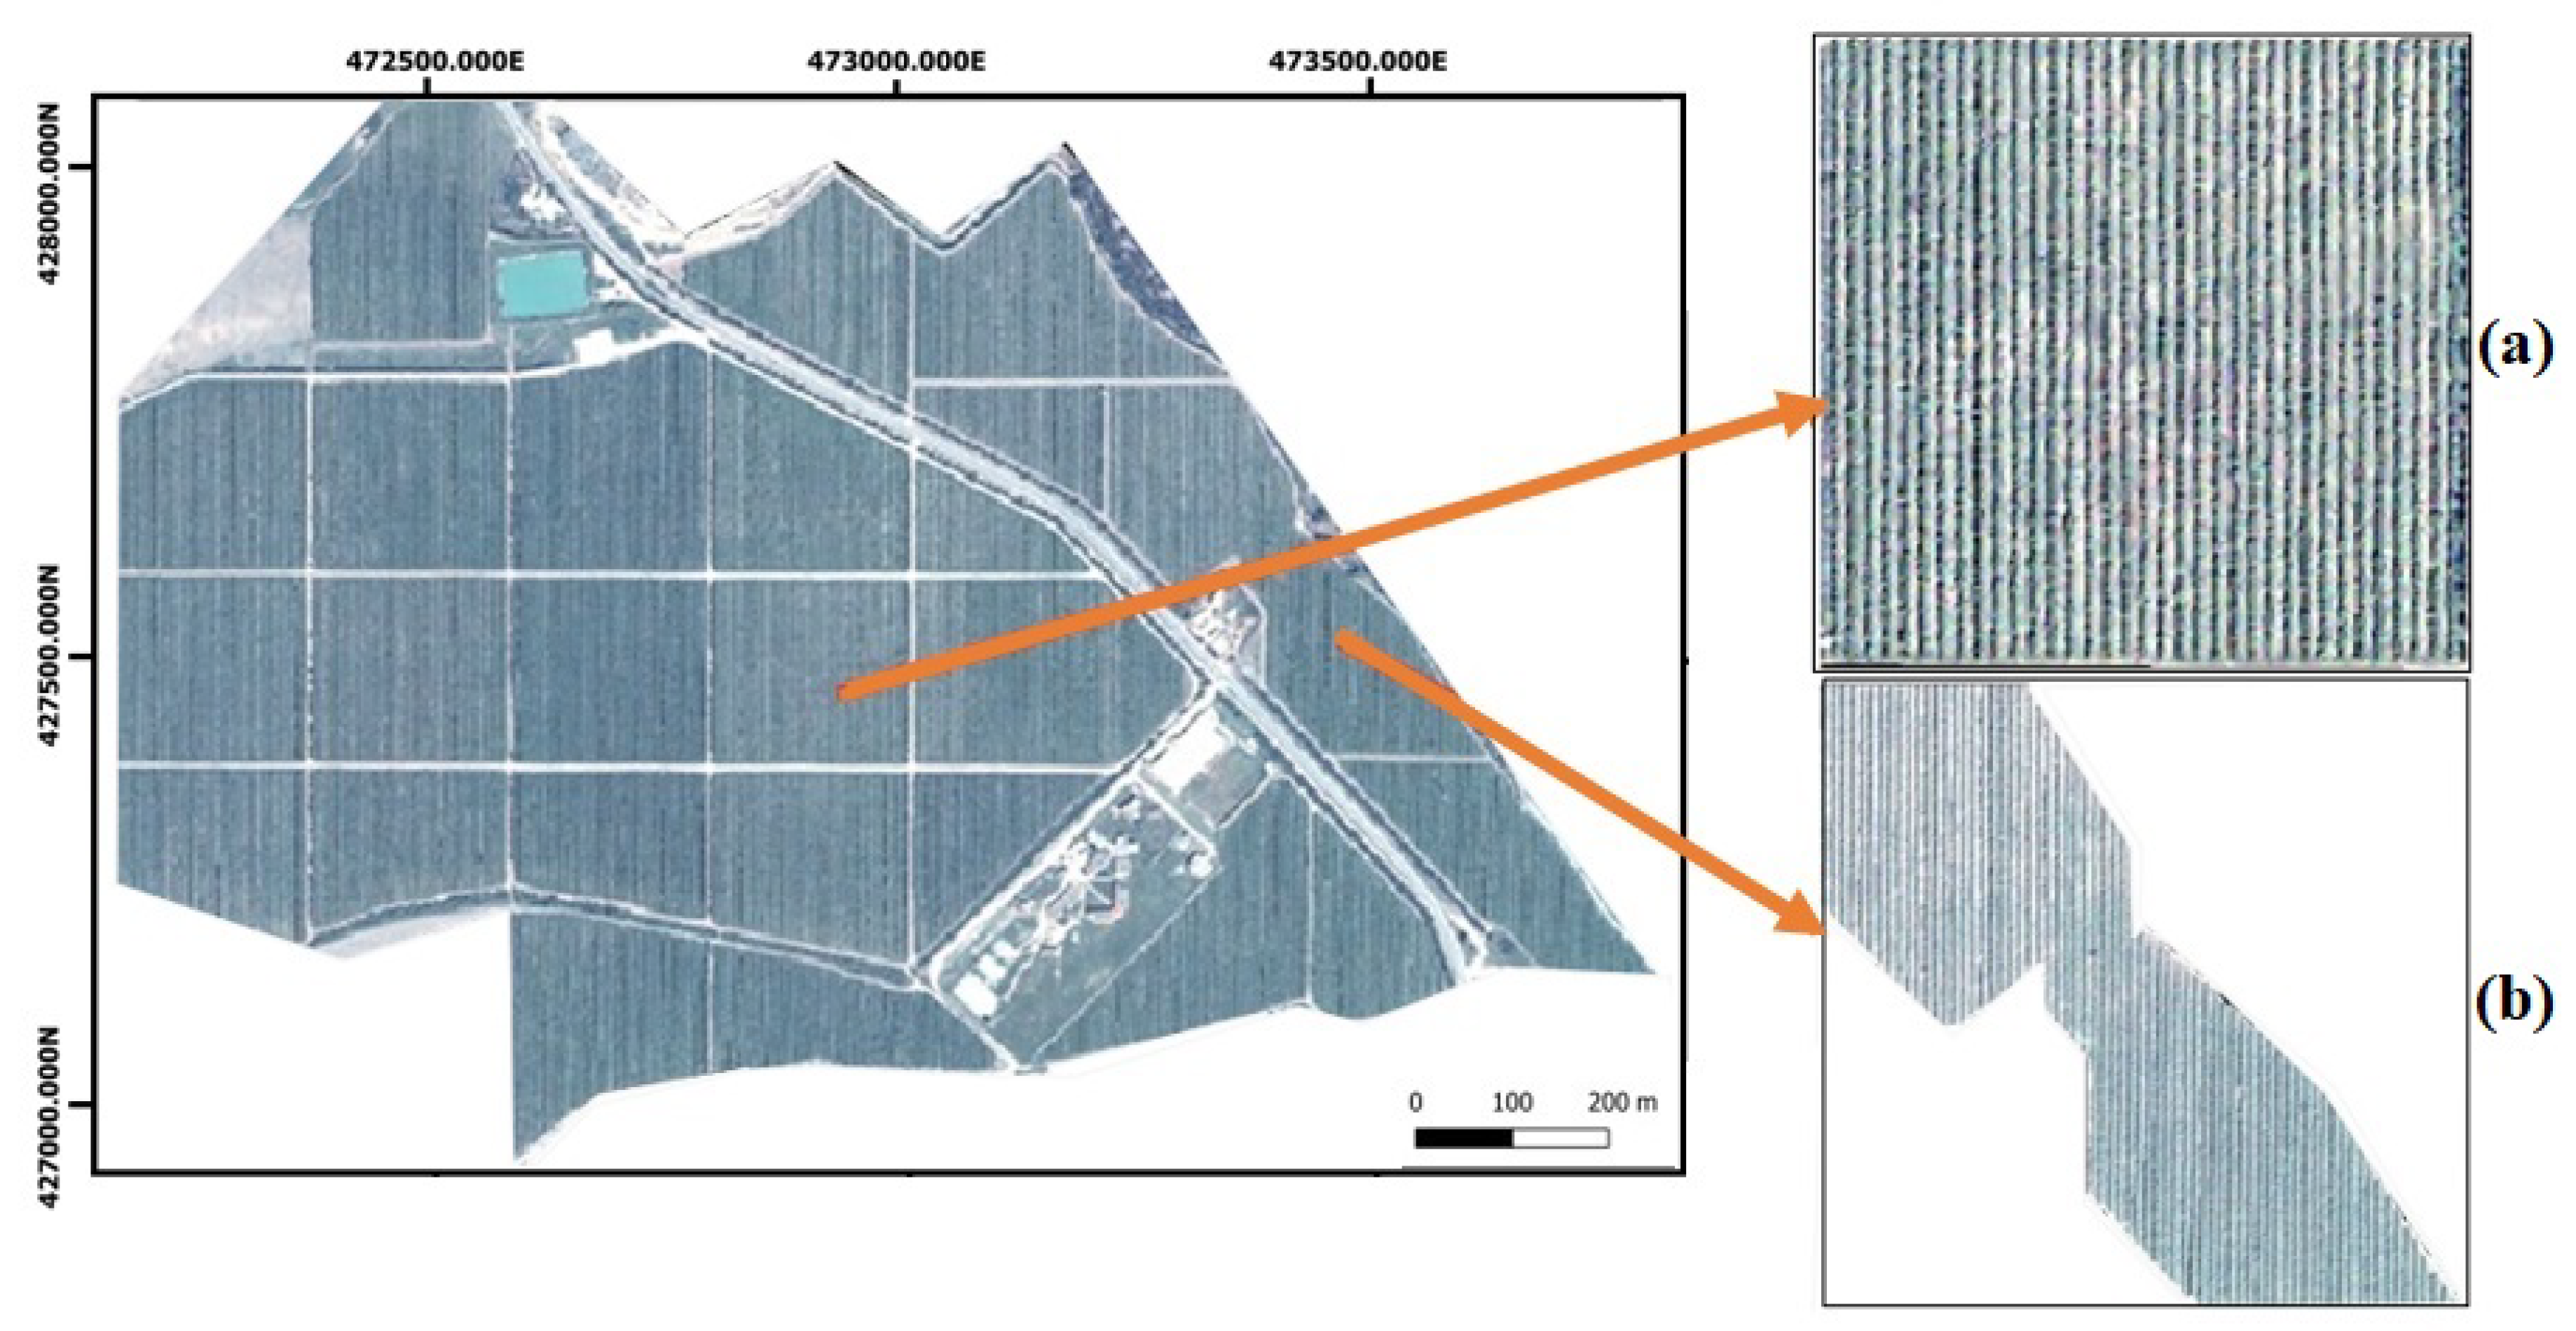
2.2. Data
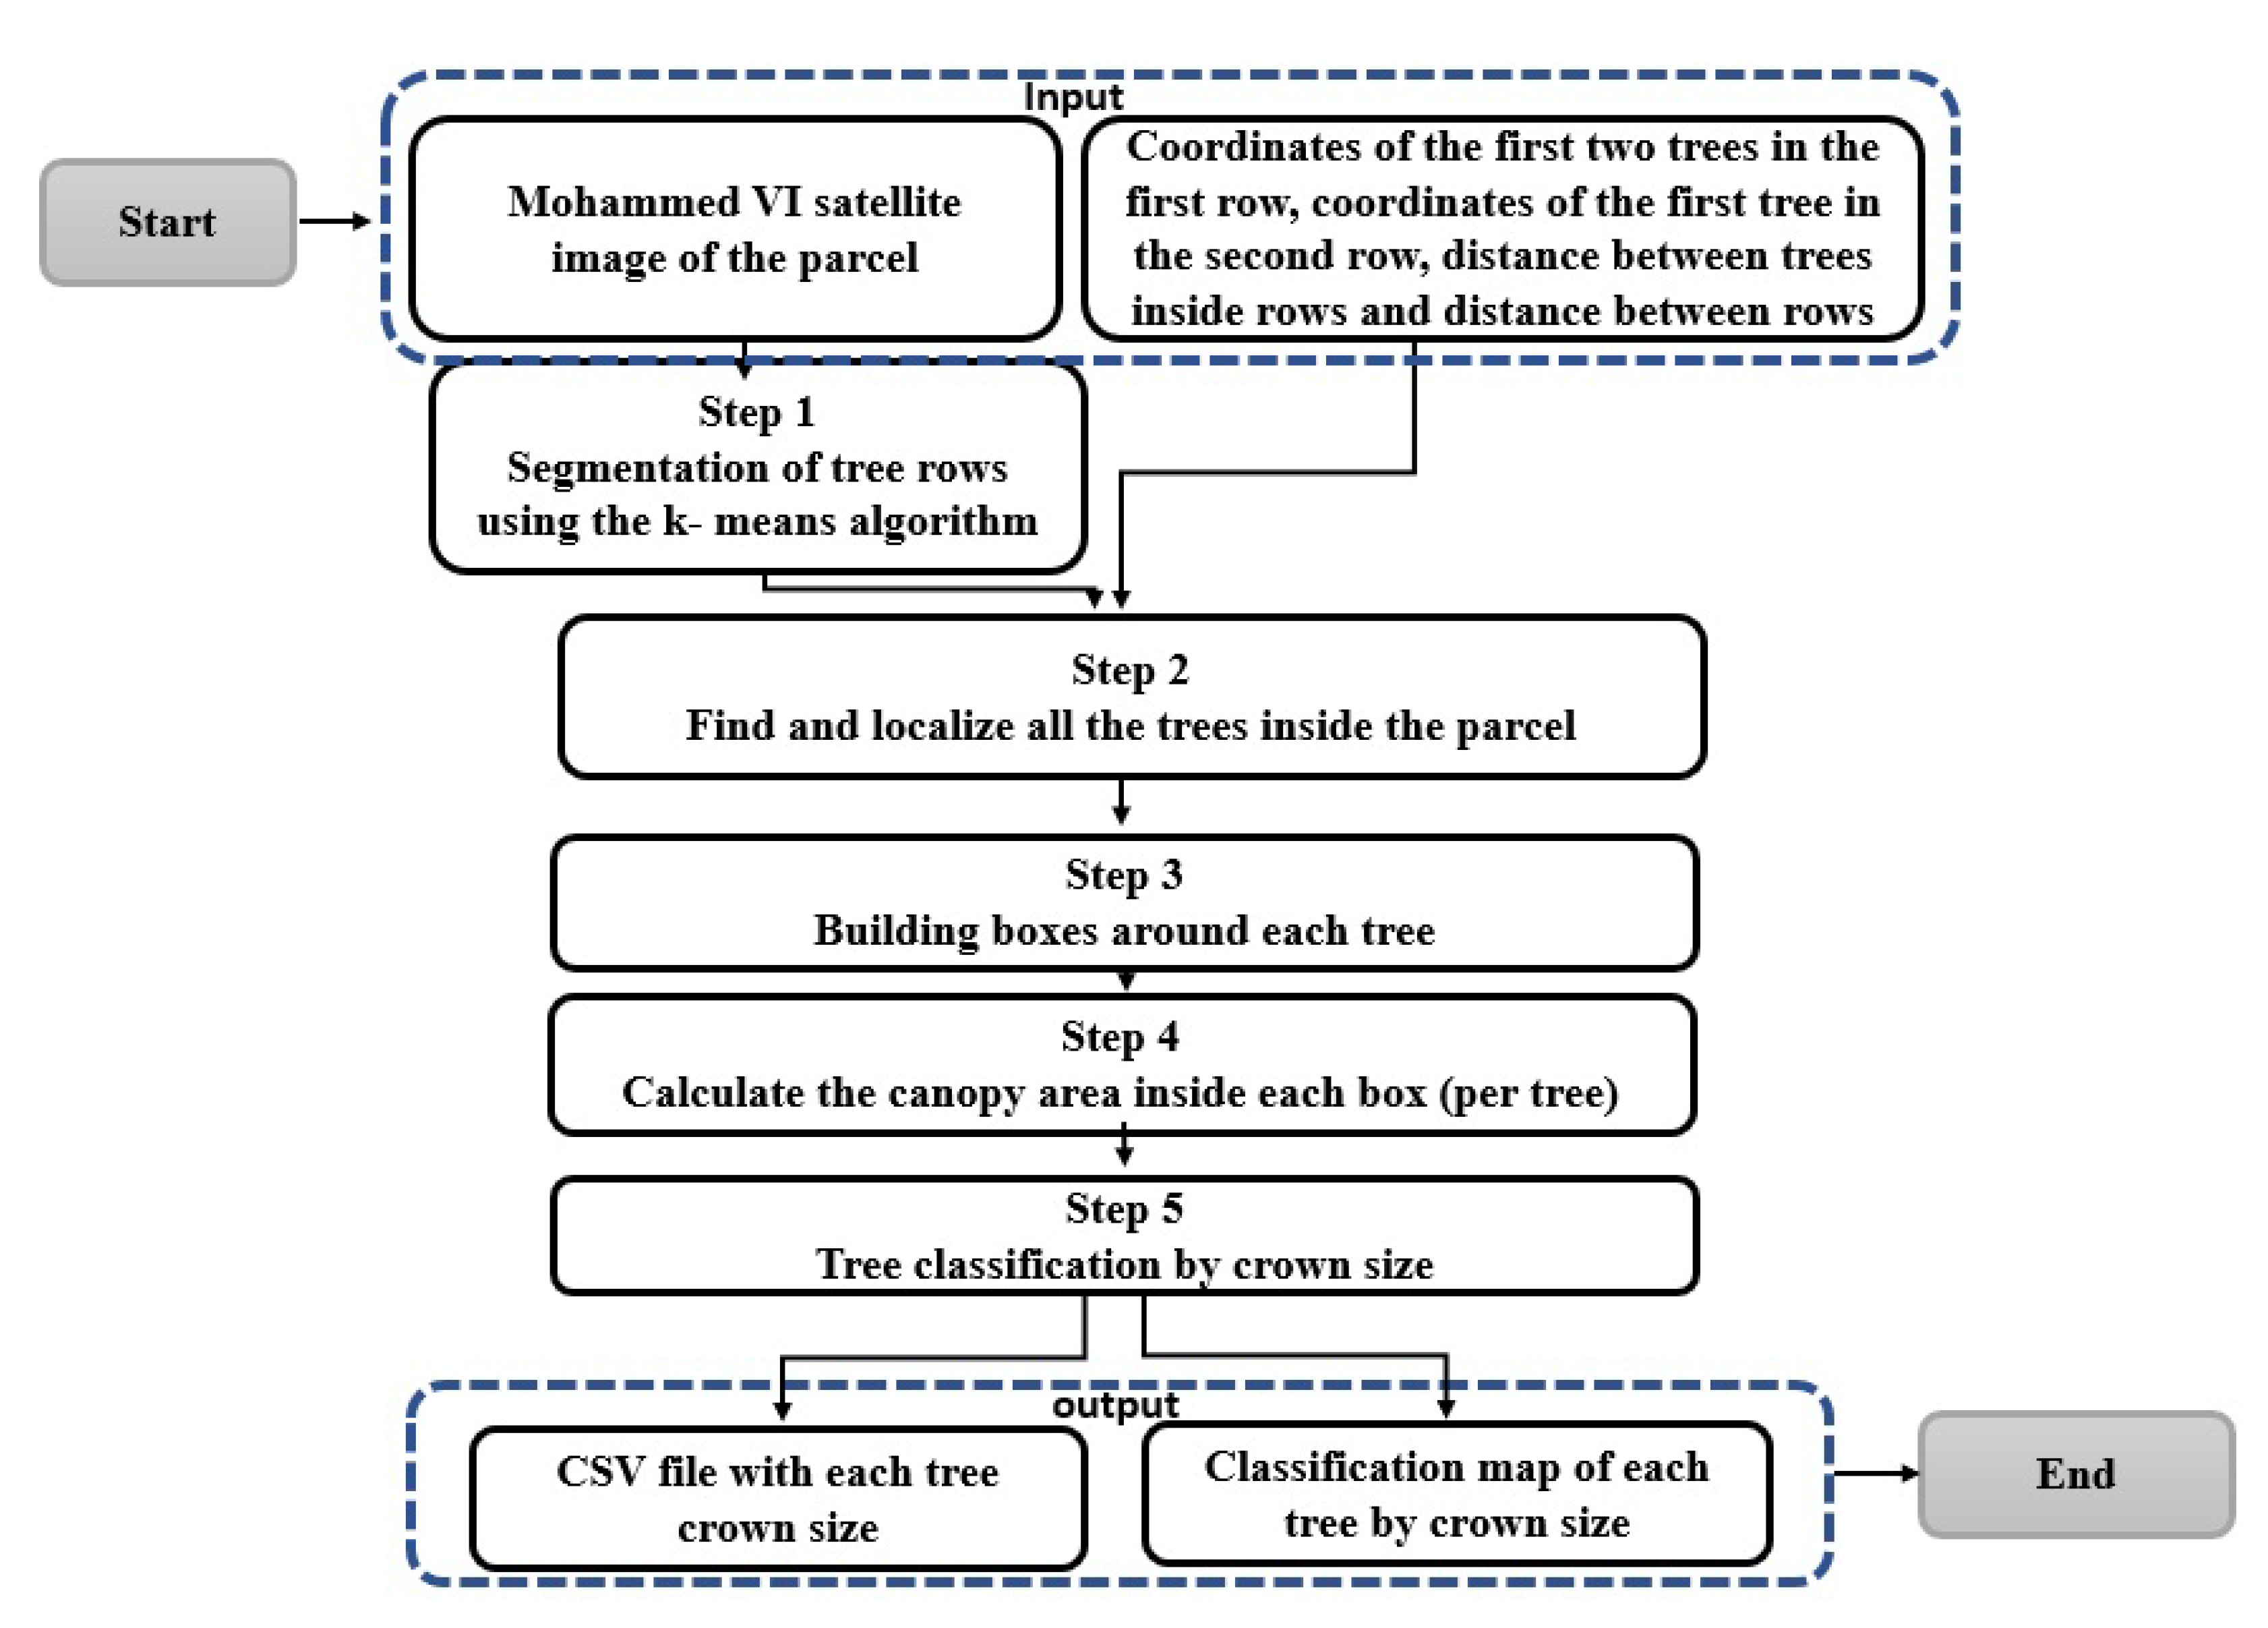
2.3. Our Approach
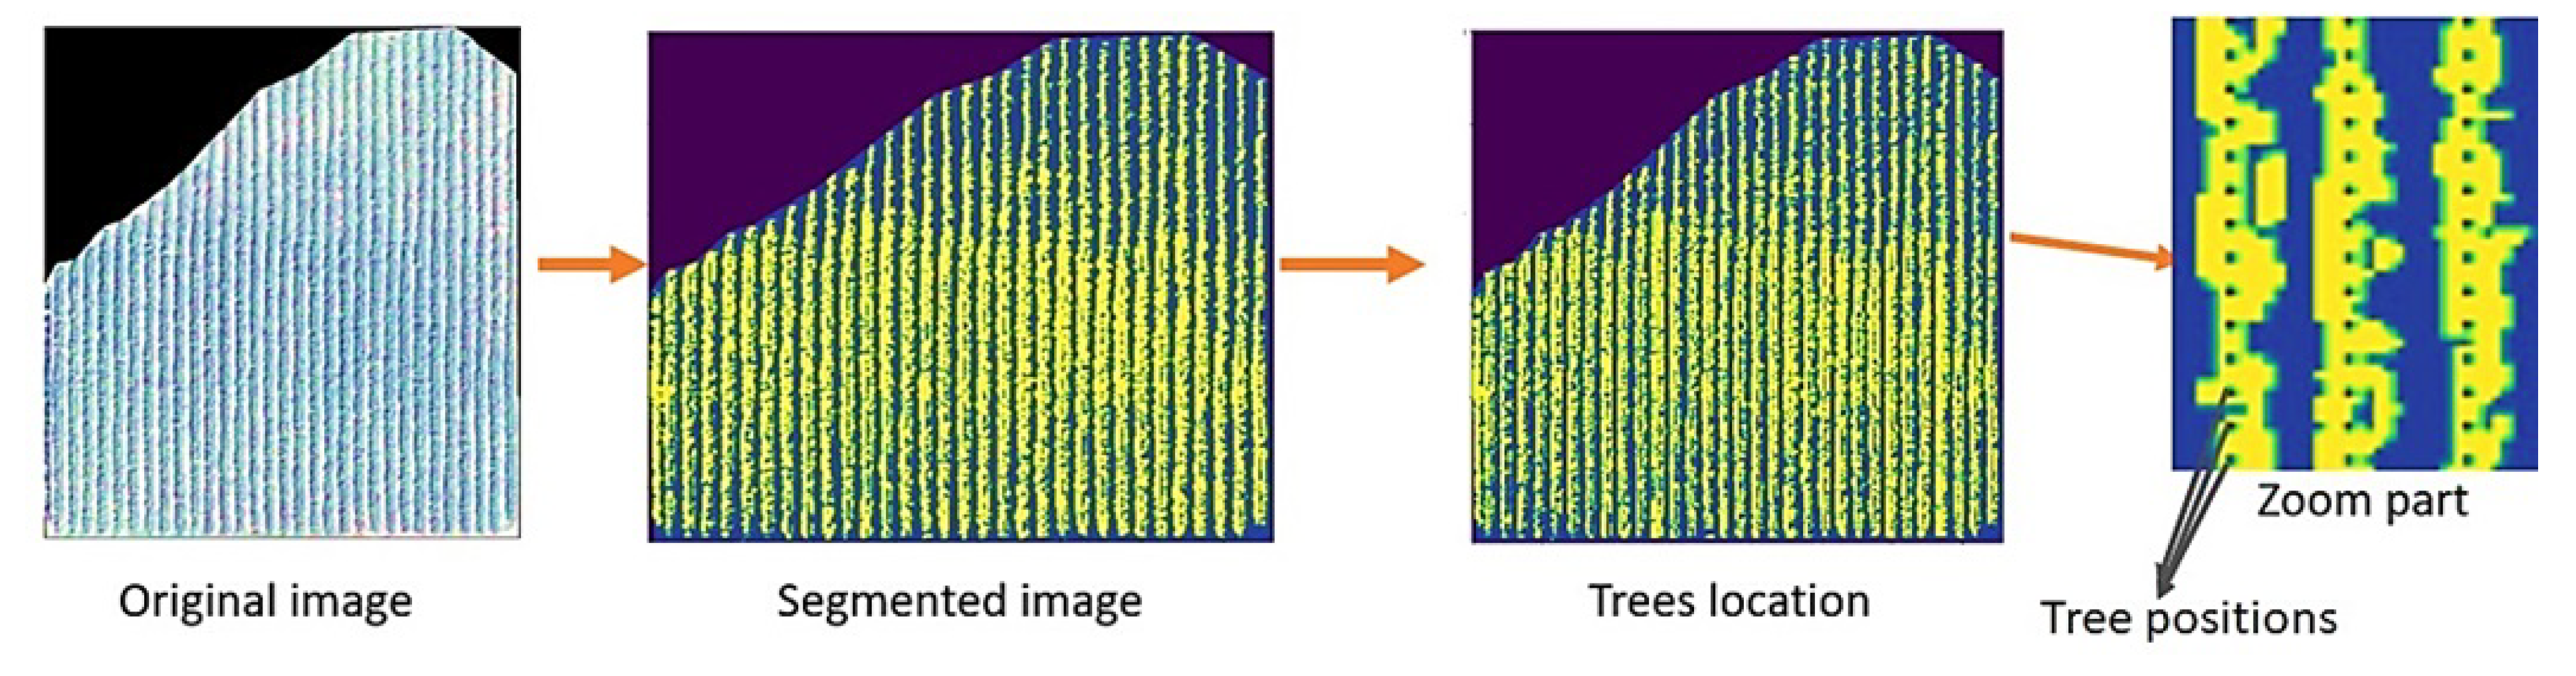
2.3.1. Tree’s Rows Segmentation
2.3.2. Tree Localization
2.3.3. Tree Crown Detection
2.3.4. Tree Classification by Size
3. Results and Validation
4. Conclusions
Author Contributions
Funding
Acknowledgments
Conflicts of Interest
References
- Mazumdar, S.; Dunshea, A.; Chong, S.; Jalaludin, B. Tree Canopy Cover Is Best Associated with Perceptions of Greenspace: A Short Communication. Int. J. Environ. Res. Public Health 2020, 17, 6501. [Google Scholar] [CrossRef]
- Chen, J.; Jin, S.; Du, P. Roles of horizontal and vertical tree canopy structure in mitigating daytime and nighttime urban heat island effects. Int. J. Appl. Earth Obs. Geoinf. 2020, 89, 102060. [Google Scholar] [CrossRef]
- Goodman, R.C.; Phillips, O.L.; Baker, T.R. The importance of crown dimensions to improve tropical tree biomass estimates. Ecol. Appl. 2014, 24, 680–698. [Google Scholar] [CrossRef] [Green Version]
- Ke, Y.; Quackenbush, L.J. A review of methods for automatic individual tree-crown detection and delineation from passive remote sensing. Int. J. Remote Sens. 2011, 32, 4725–4747. [Google Scholar] [CrossRef]
- Rahman, M.F.F.; Fan, S.; Zhang, Y.; Chen, L. A Comparative Study on Application of Unmanned Aerial Vehicle Systems in Agriculture. Agriculture 2021, 11, 22. [Google Scholar] [CrossRef]
- Robson, A.; Rahman, M.M.; Muir, J. Using worldview satellite imagery to map yield in Avocado (Persea americana): A case study in Bundaberg, Australia. Remote Sens. 2017, 9, 1223. [Google Scholar] [CrossRef] [Green Version]
- Tazima, Z.H.; Neves, C.S.V.J.; Yada, I.F.U.; Júnior, R.P.L. Performance of ‘Okitsu’satsuma mandarin trees on different rootstocks in Northwestern Paraná State. Semin. Ciênc. Agrár. 2014, 35, 2297–2308. [Google Scholar] [CrossRef] [Green Version]
- Bioucas-Dias, J.M.; Plaza, A.; Camps-Valls, G.; Scheunders, P.; Nasrabadi, N.; Chanussot, J. Hyperspectral remote sensing data analysis and future challenges. IEEE Geosci. Remote Sens. Mag. 2013, 1, 6–36. [Google Scholar] [CrossRef] [Green Version]
- Hamuda, E.; Glavin, M.; Jones, E. A survey of image processing techniques for plant extraction and segmentation in the field. Comput. Electron. Agric. 2016, 125, 184–199. [Google Scholar] [CrossRef]
- Dyson, J.; Mancini, A.; Frontoni, E.; Zingaretti, P. Deep learning for soil and crop segmentation from remotely sensed data. Remote Sens. 2019, 11, 1859. [Google Scholar] [CrossRef] [Green Version]
- Maddikunta, P.K.R.; Hakak, S.; Alazab, M.; Bhattacharya, S.; Gadekallu, T.R.; Khan, W.Z.; Pham, Q.V. Unmanned aerial vehicles in smart agriculture: Applications, requirements, and challenges. IEEE Sens. J. 2021. [Google Scholar] [CrossRef]
- Laliberte, A.S.; Goforth, M.A.; Steele, C.M.; Rango, A. Multispectral remote sensing from unmanned aircraft: Image processing workflows and applications for rangeland environments. Remote Sens. 2011, 3, 2529–2551. [Google Scholar] [CrossRef] [Green Version]
- Karydas, C.; Gewehr, S.; Iatrou, M.; Iatrou, G.; Mourelatos, S. Olive plantation mapping on a sub-tree scale with object-based image analysis of multispectral UAV data; Operational potential in tree stress monitoring. J. Imaging 2017, 3, 57. [Google Scholar] [CrossRef] [Green Version]
- Cheng, H.; Damerow, L.; Sun, Y.; Blanke, M. Early yield prediction using image analysis of apple fruit and tree canopy features with neural networks. J. Imaging 2017, 3, 6. [Google Scholar] [CrossRef]
- Weinstein, B.G.; Marconi, S.; Bohlman, S.; Zare, A.; White, E. Individual tree-crown detection in RGB imagery using semi-supervised deep learning neural networks. Remote Sens. 2019, 11, 1309. [Google Scholar] [CrossRef] [Green Version]
- Csillik, O.; Cherbini, J.; Johnson, R.; Lyons, A.; Kelly, M. Identification of citrus trees from unmanned aerial vehicle imagery using convolutional neural networks. Drones 2018, 2, 39. [Google Scholar] [CrossRef] [Green Version]
- Ok, A.; Ozdarici-Ok, A. Detection of citrus trees from UAV DSMs. ISPRS Ann. Photogramm. Remote Sens. Spat. Inf. Sci. 2017, 4, 27. [Google Scholar] [CrossRef] [Green Version]
- Maschler, J.; Atzberger, C.; Immitzer, M. Individual tree crown segmentation and classification of 13 tree species using airborne hyperspectral data. Remote Sens. 2018, 10, 1218. [Google Scholar] [CrossRef] [Green Version]
- Li, W.; Fu, H.; Yu, L.; Cracknell, A. Deep learning based oil palm tree detection and counting for high-resolution remote sensing images. Remote Sens. 2017, 9, 22. [Google Scholar] [CrossRef] [Green Version]
- Zortea, M.; Macedo, M.M.; Mattos, A.B.; Ruga, B.C.; Gemignani, B.H. Automatic citrus tree detection from UAV images based on convolutional neural networks. In Proceedings of the 31th Sibgrap/WIA—Conference on Graphics, Patterns and Images, SIBGRAPI’18, Foz do Iguacu, Brazil, 29 October–1 November 2018. [Google Scholar]
- Ampatzidis, Y.; Partel, V. UAV-based high throughput phenotyping in citrus utilizing multispectral imaging and artificial intelligence. Remote Sens. 2019, 11, 410. [Google Scholar] [CrossRef] [Green Version]
- Abdollahnejad, A.; Panagiotidis, D.; Surovỳ, P. Estimation and extrapolation of tree parameters using spectral correlation between UAV and Pléiades data. Forests 2018, 9, 85. [Google Scholar] [CrossRef] [Green Version]
- Alganci, U.; Sertel, E.; Kaya, S. Determination of the olive trees with object based classification of Pleiades satellite image. Int. J. Environ. Geoinform. 2018, 5, 132–139. [Google Scholar] [CrossRef]
- Lee, S.U.; Chung, S.Y.; Park, R.H. A comparative performance study of several global thresholding techniques for segmentation. Comput. Vis. Graph. Image Process. 1990, 52, 171–190. [Google Scholar] [CrossRef]
- Ghahramani, Z. Unsupervised learning. In Summer School on Machine Learning; Springer: Berlin/Heidelberg, Germany, 2003; pp. 72–112. [Google Scholar]
- Garcia-Garcia, A.; Orts-Escolano, S.; Oprea, S.; Villena-Martinez, V.; Garcia-Rodriguez, J. A review on deep learning techniques applied to semantic segmentation. arXiv 2017, arXiv:1704.06857. [Google Scholar]
- Minaee, S.; Boykov, Y.Y.; Porikli, F.; Plaza, A.J.; Kehtarnavaz, N.; Terzopoulos, D. Image segmentation using deep learning: A survey. IEEE Trans. Pattern Anal. Mach. Intell. 2021. [Google Scholar] [CrossRef] [PubMed]
- Zaitoun, N.M.; Aqel, M.J. Survey on image segmentation techniques. Procedia Comput. Sci. 2015, 65, 797–806. [Google Scholar] [CrossRef] [Green Version]
- Ling, P.; Ruzhitsky, V. Machine vision techniques for measuring the canopy of tomato seedling. J. Agric. Eng. Res. 1996, 65, 85–95. [Google Scholar] [CrossRef]
- Huihui, S.; Ni, W.; Wenxiu, T. Tree canopy extraction method of high resolution image based on Gabor filter and morphology. J. Geo-Inf. Sci. 2019, 21, 249–258. [Google Scholar]
- Likas, A.; Vlassis, N.; Verbeek, J.J. The global k-means clustering algorithm. Pattern Recognit. 2003, 36, 451–461. [Google Scholar] [CrossRef] [Green Version]
- Méndez, V.; Pérez-Romero, A.; Sola-Guirado, R.; Miranda-Fuentes, A.; Manzano-Agugliaro, F.; Zapata-Sierra, A.; Rodríguez-Lizana, A. In-Field Estimation of Orange Number and Size by 3D Laser Scanning. Agronomy 2019, 9, 885. [Google Scholar] [CrossRef] [Green Version]
- Zhao, T.; Yang, Y.; Niu, H.; Wang, D.; Chen, Y. Comparing U-Net convolutional network with mask R-CNN in the performances of pomegranate tree canopy segmentation. In Multispectral, Hyperspectral, and Ultraspectral Remote Sensing Technology, Techniques and Applications VII; International Society for Optics and Photonics: Bellingham, WA, USA, 2018; Volume 10780, p. 107801J. [Google Scholar]
- He, K.; Gkioxari, G.; Dollár, P.; Girshick, R. Mask r-cnn. In Proceedings of the IEEE International Conference on Computer Vision, Cambridge, MA, USA, 20–23 June 2017; pp. 2961–2969. [Google Scholar]
- Ronneberger, O.; Fischer, P.; Brox, T. U-net: Convolutional networks for biomedical image segmentation. In Proceedings of the International Conference on Medical Image Computing and Computer-Assisted Intervention, Munich, Germany, 5–9 October 2015; pp. 234–241. [Google Scholar]
- Liu, L.; Cheng, X.; Dai, J.; Lai, J. Adaptive threshold segmentation for cotton canopy image in complex background based on logistic regression algorithm. Trans. Chin. Soc. Agric. Eng. 2017, 33, 201–208. [Google Scholar]
- Chen, Y.; Hou, C.; Tang, Y.; Zhuang, J.; Lin, J.; He, Y.; Guo, Q.; Zhong, Z.; Lei, H.; Luo, S. Citrus tree segmentation from UAV images based on monocular machine vision in a natural orchard environment. Sensors 2019, 19, 5558. [Google Scholar] [CrossRef] [PubMed] [Green Version]
- Rahman, M.M.; Robson, A.; Bristow, M. Exploring the potential of high resolution worldview-3 Imagery for estimating yield of mango. Remote Sens. 2018, 10, 1866. [Google Scholar] [CrossRef] [Green Version]
- Cinat, P.; Di Gennaro, S.F.; Berton, A.; Matese, A. Comparison of unsupervised algorithms for Vineyard Canopy segmentation from UAV multispectral images. Remote Sens. 2019, 11, 1023. [Google Scholar] [CrossRef] [Green Version]
- Mukherjee, S.; Joshi, P.K.; Mukherjee, S.; Ghosh, A.; Garg, R.; Mukhopadhyay, A. Evaluation of vertical accuracy of open source Digital Elevation Model (DEM). Int. J. Appl. Earth Obs. Geoinf. 2013, 21, 205–217. [Google Scholar] [CrossRef]
- Krishna, K.; Murty, M.N. Genetic K-means algorithm. IEEE Trans. Syst. Man, Cybern. Part B 1999, 29, 433–439. [Google Scholar] [CrossRef] [PubMed] [Green Version]
- Zhang, Z.; Kazakova, A.; Moskal, L.M.; Styers, D.M. Object-based tree species classification in urban ecosystems using LiDAR and hyperspectral data. Forests 2016, 7, 122. [Google Scholar] [CrossRef] [Green Version]
- Blaschke, T. Object based image analysis for remote sensing. ISPRS J. Photogramm. Remote Sens. 2010, 65, 2–16. [Google Scholar] [CrossRef] [Green Version]
- Liaw, A.; Wiener, M. Classification and regression by randomForest. R News 2002, 2, 18–22. [Google Scholar]
- Hastie, T.; Rosset, S.; Zhu, J.; Zou, H. Multi-class adaboost. Stat. Its Interface 2009, 2, 349–360. [Google Scholar] [CrossRef] [Green Version]
- Tu, Y.H.; Johansen, K.; Phinn, S.; Robson, A. Measuring canopy structure and condition using multi-spectral UAS imagery in a horticultural environment. Remote Sens. 2019, 11, 269. [Google Scholar] [CrossRef] [Green Version]
- Wang, L.; Gong, P.; Biging, G.S. Individual tree-crown delineation and treetop detection in high-spatial-resolution aerial imagery. Photogramm. Eng. Remote Sens. 2004, 70, 351–357. [Google Scholar] [CrossRef] [Green Version]
- Goodfellow, I.; Bengio, Y.; Courville, A.; Bengio, Y. Deep Learning; MIT Press: Cambridge, MA, USA, 2016; Volume 1. [Google Scholar]
- Soproni, D.; Maghiar, T.; Molnar, C.; Hathazi, I.; Bandici, L.; Arion, M.; Krausz, A. Study of Electromagnetic Properties of the Agricultural Products. J. Electr. Electron. Eng. 2008, 1, 130–133. [Google Scholar]
- El-Harti, A.; Bannari, A.; Manyari, Y.; Nabil, A.; Lahboub, Y.; El-Ghmari, A.; Bachaoui, E. Capabilities of the New Moroccan Satellite Mohammed-VI for Planimetric and Altimetric Mapping. In Proceedings of the IGARSS 2020—2020 IEEE International Geoscience and Remote Sensing Symposium, Waikoloa, HI, USA, 26 September–2 October 2020; pp. 6105–6108. [Google Scholar]
- QGIS, D.T. QGIS Geographic Information System, Open Source Geospatial Foundation. Available online: http://qgis.osgeo.org (accessed on 31 August 2015).
- Lavee, S.; Haskal, A.; Avidan, B. The effect of planting distances and tree shape on yield and harvest efficiency of cv. Manzanillo table olives. Sci. Hortic. 2012, 142, 166–173. [Google Scholar] [CrossRef]


| Parcel | F1-Score | Precision |
|---|---|---|
| Parcel 1 | 0.93 | 0.97 |
| Parcel 2 | 0.91 | 0.95 |
| Parcel 3 | 0.93 | 0.96 |
| Parcel 4 | 0.93 | 0.97 |
| Parcel 5 | 0.94 | 0.98 |
Publisher’s Note: MDPI stays neutral with regard to jurisdictional claims in published maps and institutional affiliations. |
© 2021 by the authors. Licensee MDPI, Basel, Switzerland. This article is an open access article distributed under the terms and conditions of the Creative Commons Attribution (CC BY) license (https://creativecommons.org/licenses/by/4.0/).
Share and Cite
Moussaid, A.; Fkihi, S.E.; Zennayi, Y. Tree Crowns Segmentation and Classification in Overlapping Orchards Based on Satellite Images and Unsupervised Learning Algorithms. J. Imaging 2021, 7, 241. https://0-doi-org.brum.beds.ac.uk/10.3390/jimaging7110241
Moussaid A, Fkihi SE, Zennayi Y. Tree Crowns Segmentation and Classification in Overlapping Orchards Based on Satellite Images and Unsupervised Learning Algorithms. Journal of Imaging. 2021; 7(11):241. https://0-doi-org.brum.beds.ac.uk/10.3390/jimaging7110241
Chicago/Turabian StyleMoussaid, Abdellatif, Sanaa El Fkihi, and Yahya Zennayi. 2021. "Tree Crowns Segmentation and Classification in Overlapping Orchards Based on Satellite Images and Unsupervised Learning Algorithms" Journal of Imaging 7, no. 11: 241. https://0-doi-org.brum.beds.ac.uk/10.3390/jimaging7110241