
IR Reflectography, Pulse-Compression Thermography, MA-XRF, and Radiography: A Full-Thickness Study of a 16th-Century Panel Painting Copy of Raphael

 ,
,  , ,
, ,  , , ,
, , ,
Abstract
:1. Introduction
2. Materials and Methods
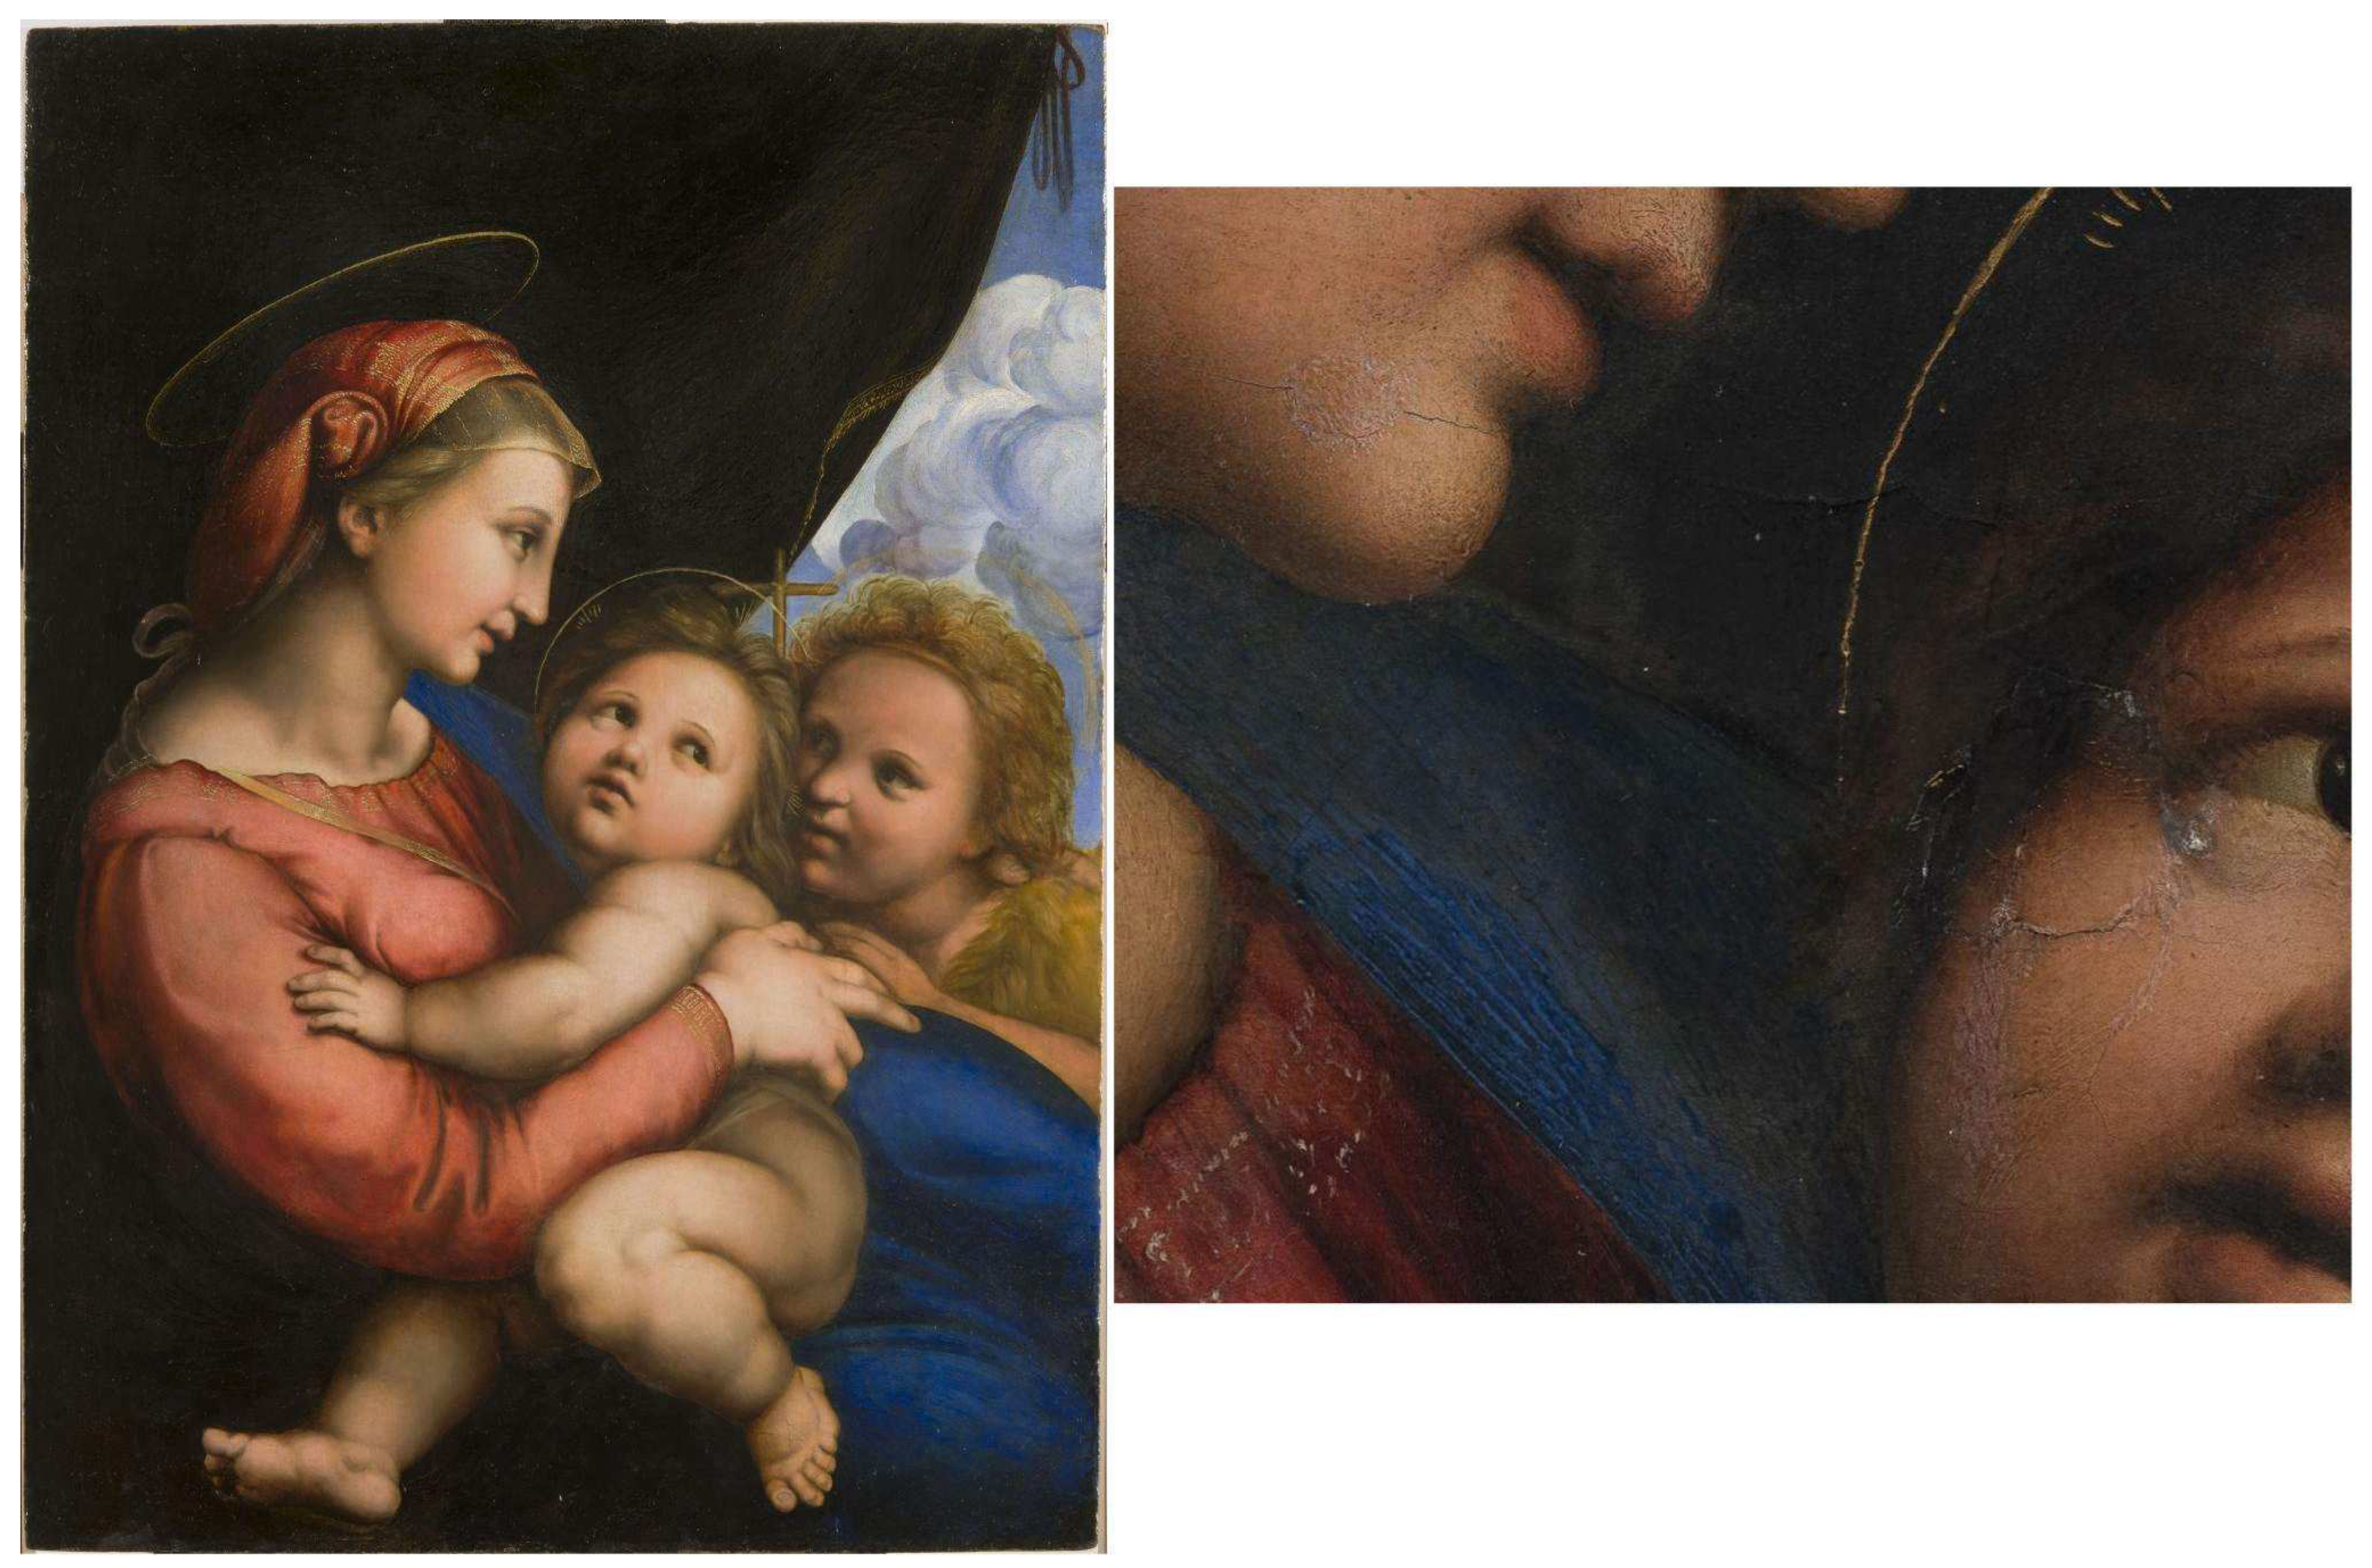
2.1. The Panel Painting Madonna Della Tenda: Technical Features
2.2. Analytical Methods
2.2.1. Technical Photography
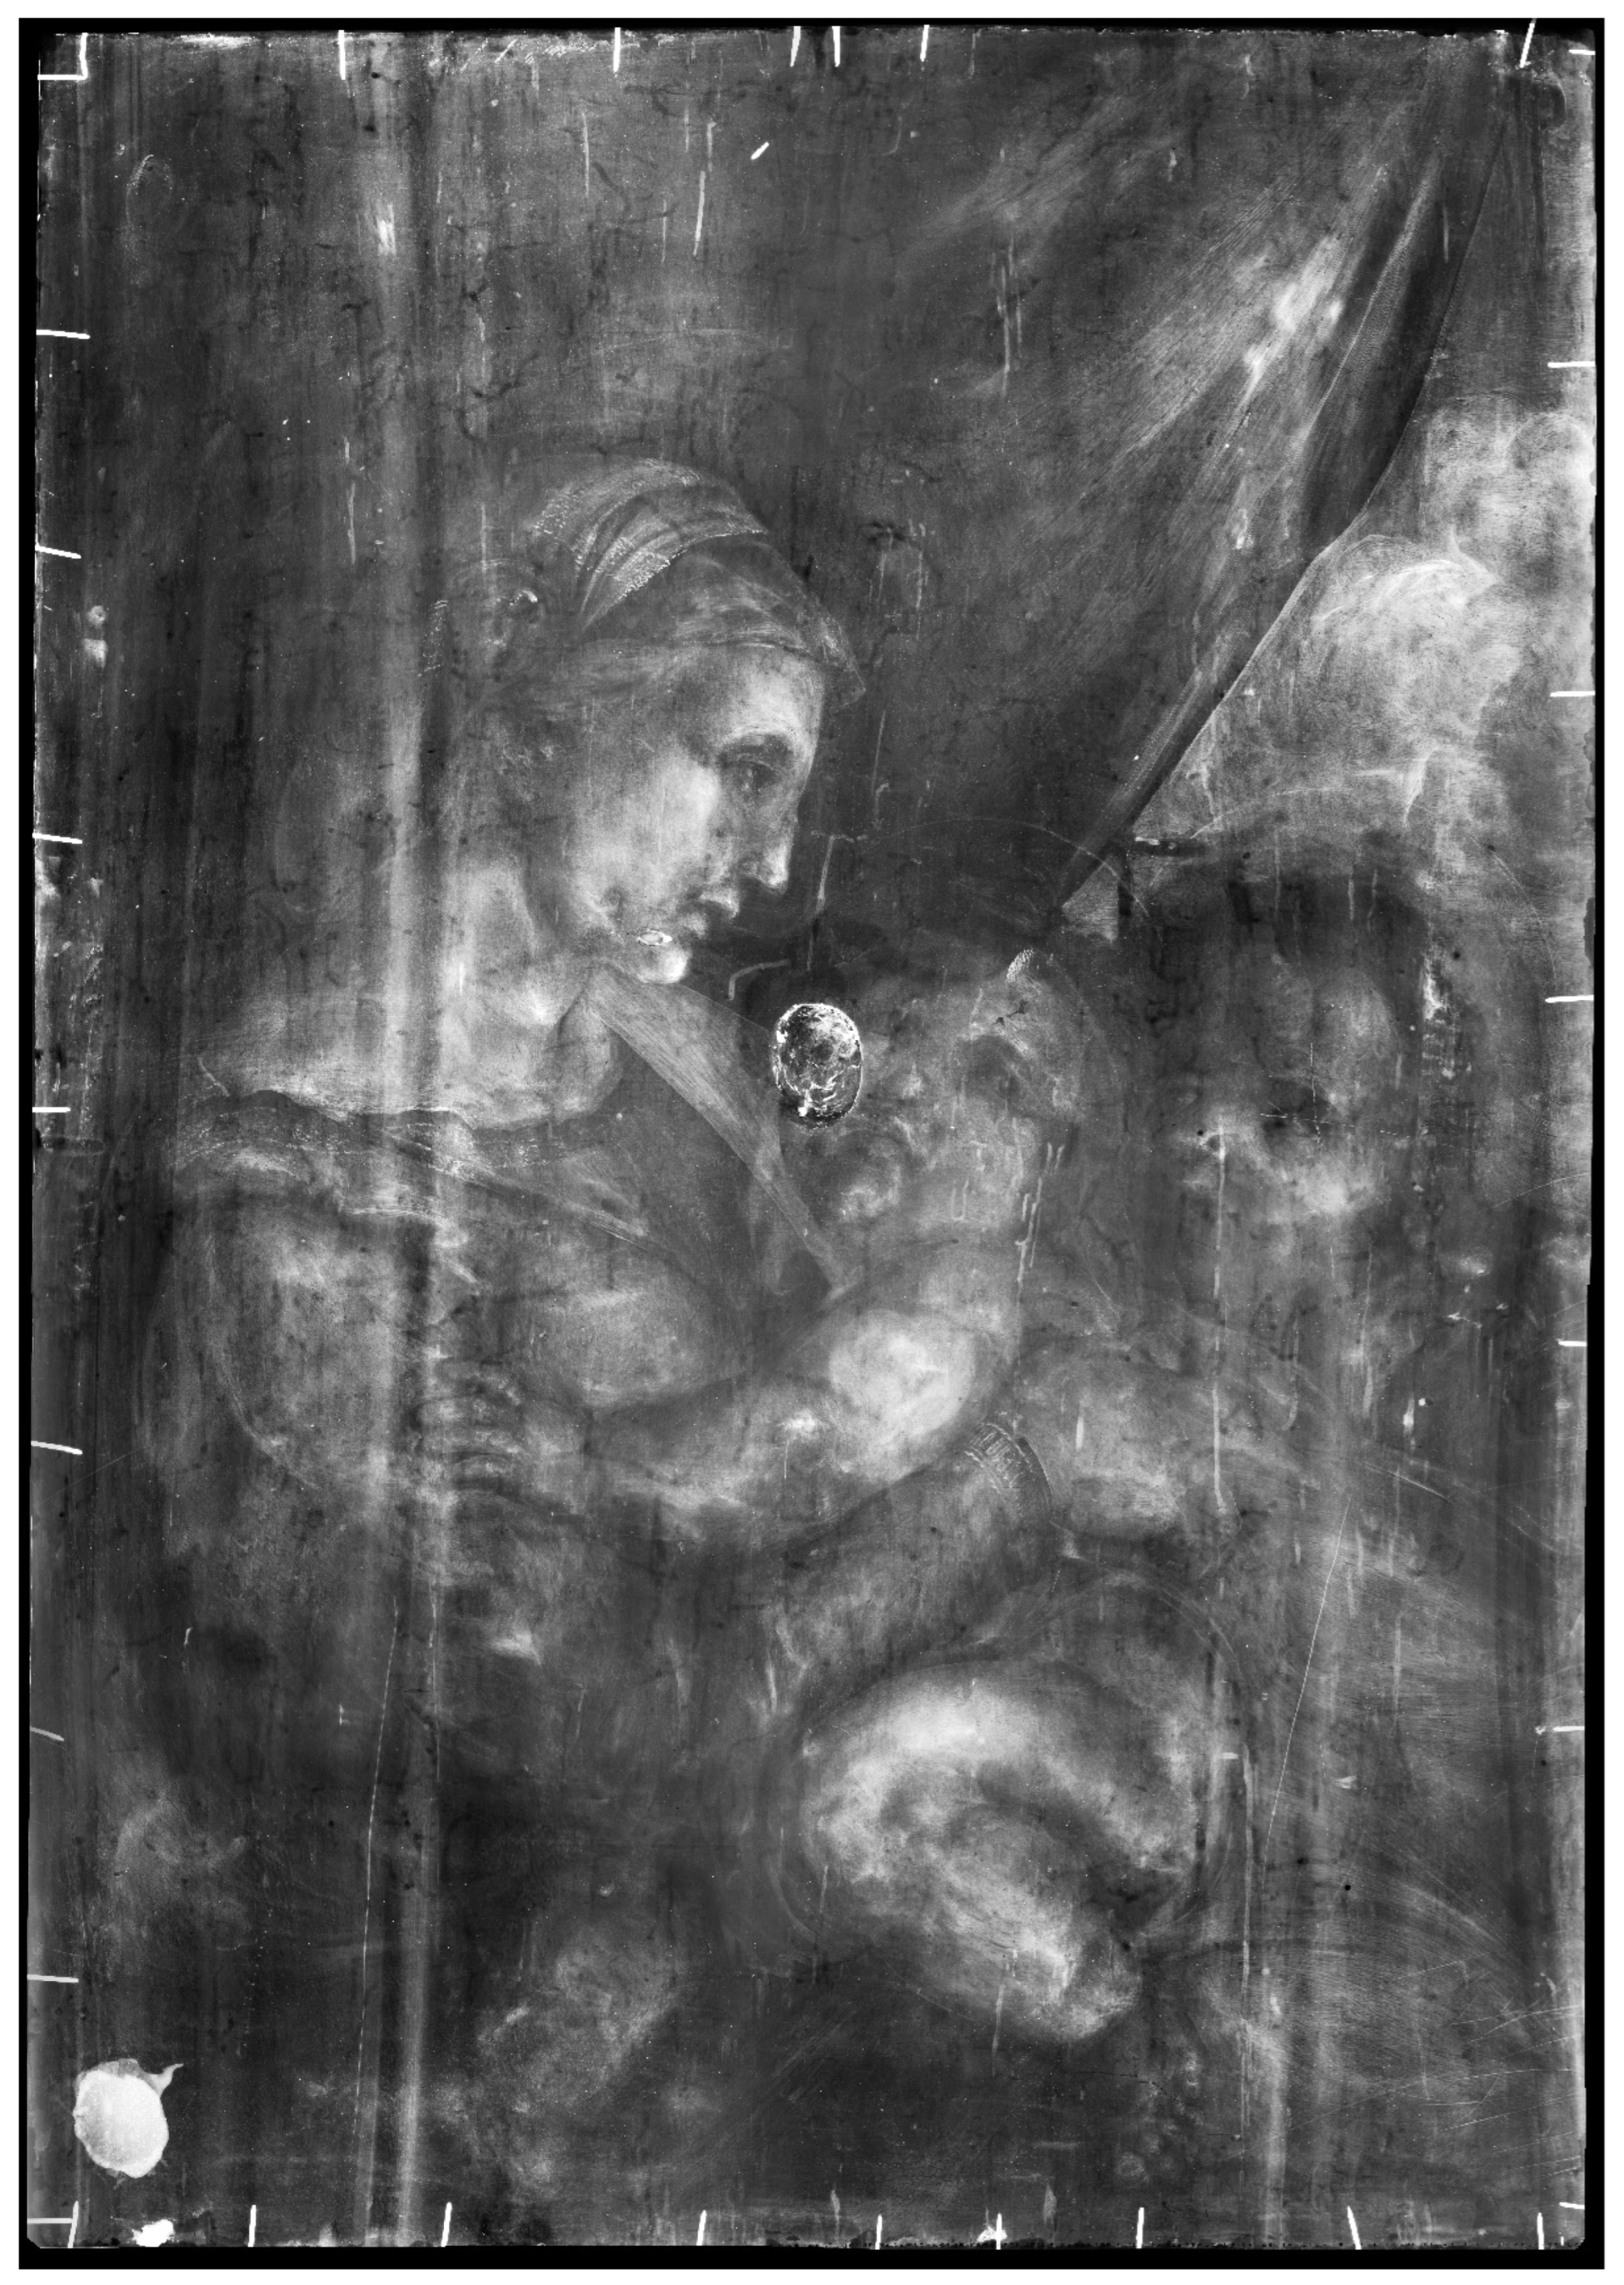
2.2.2. X-ray Radiography (XR)
2.2.3. Pulse-Compression Thermography (PuCT)
2.2.4. Macro X-ray Fluorescence (MA-XRF)
2.2.5. High-Resolution Shortwave Infrared Reflectography (HR-SWIR)
2.2.6. Optical Microscopy (OM) and Scanning Electron Microscopy with Energy-Dispersive X-ray Spectroscopy (SEM/EDS)
3. Results and Discussion
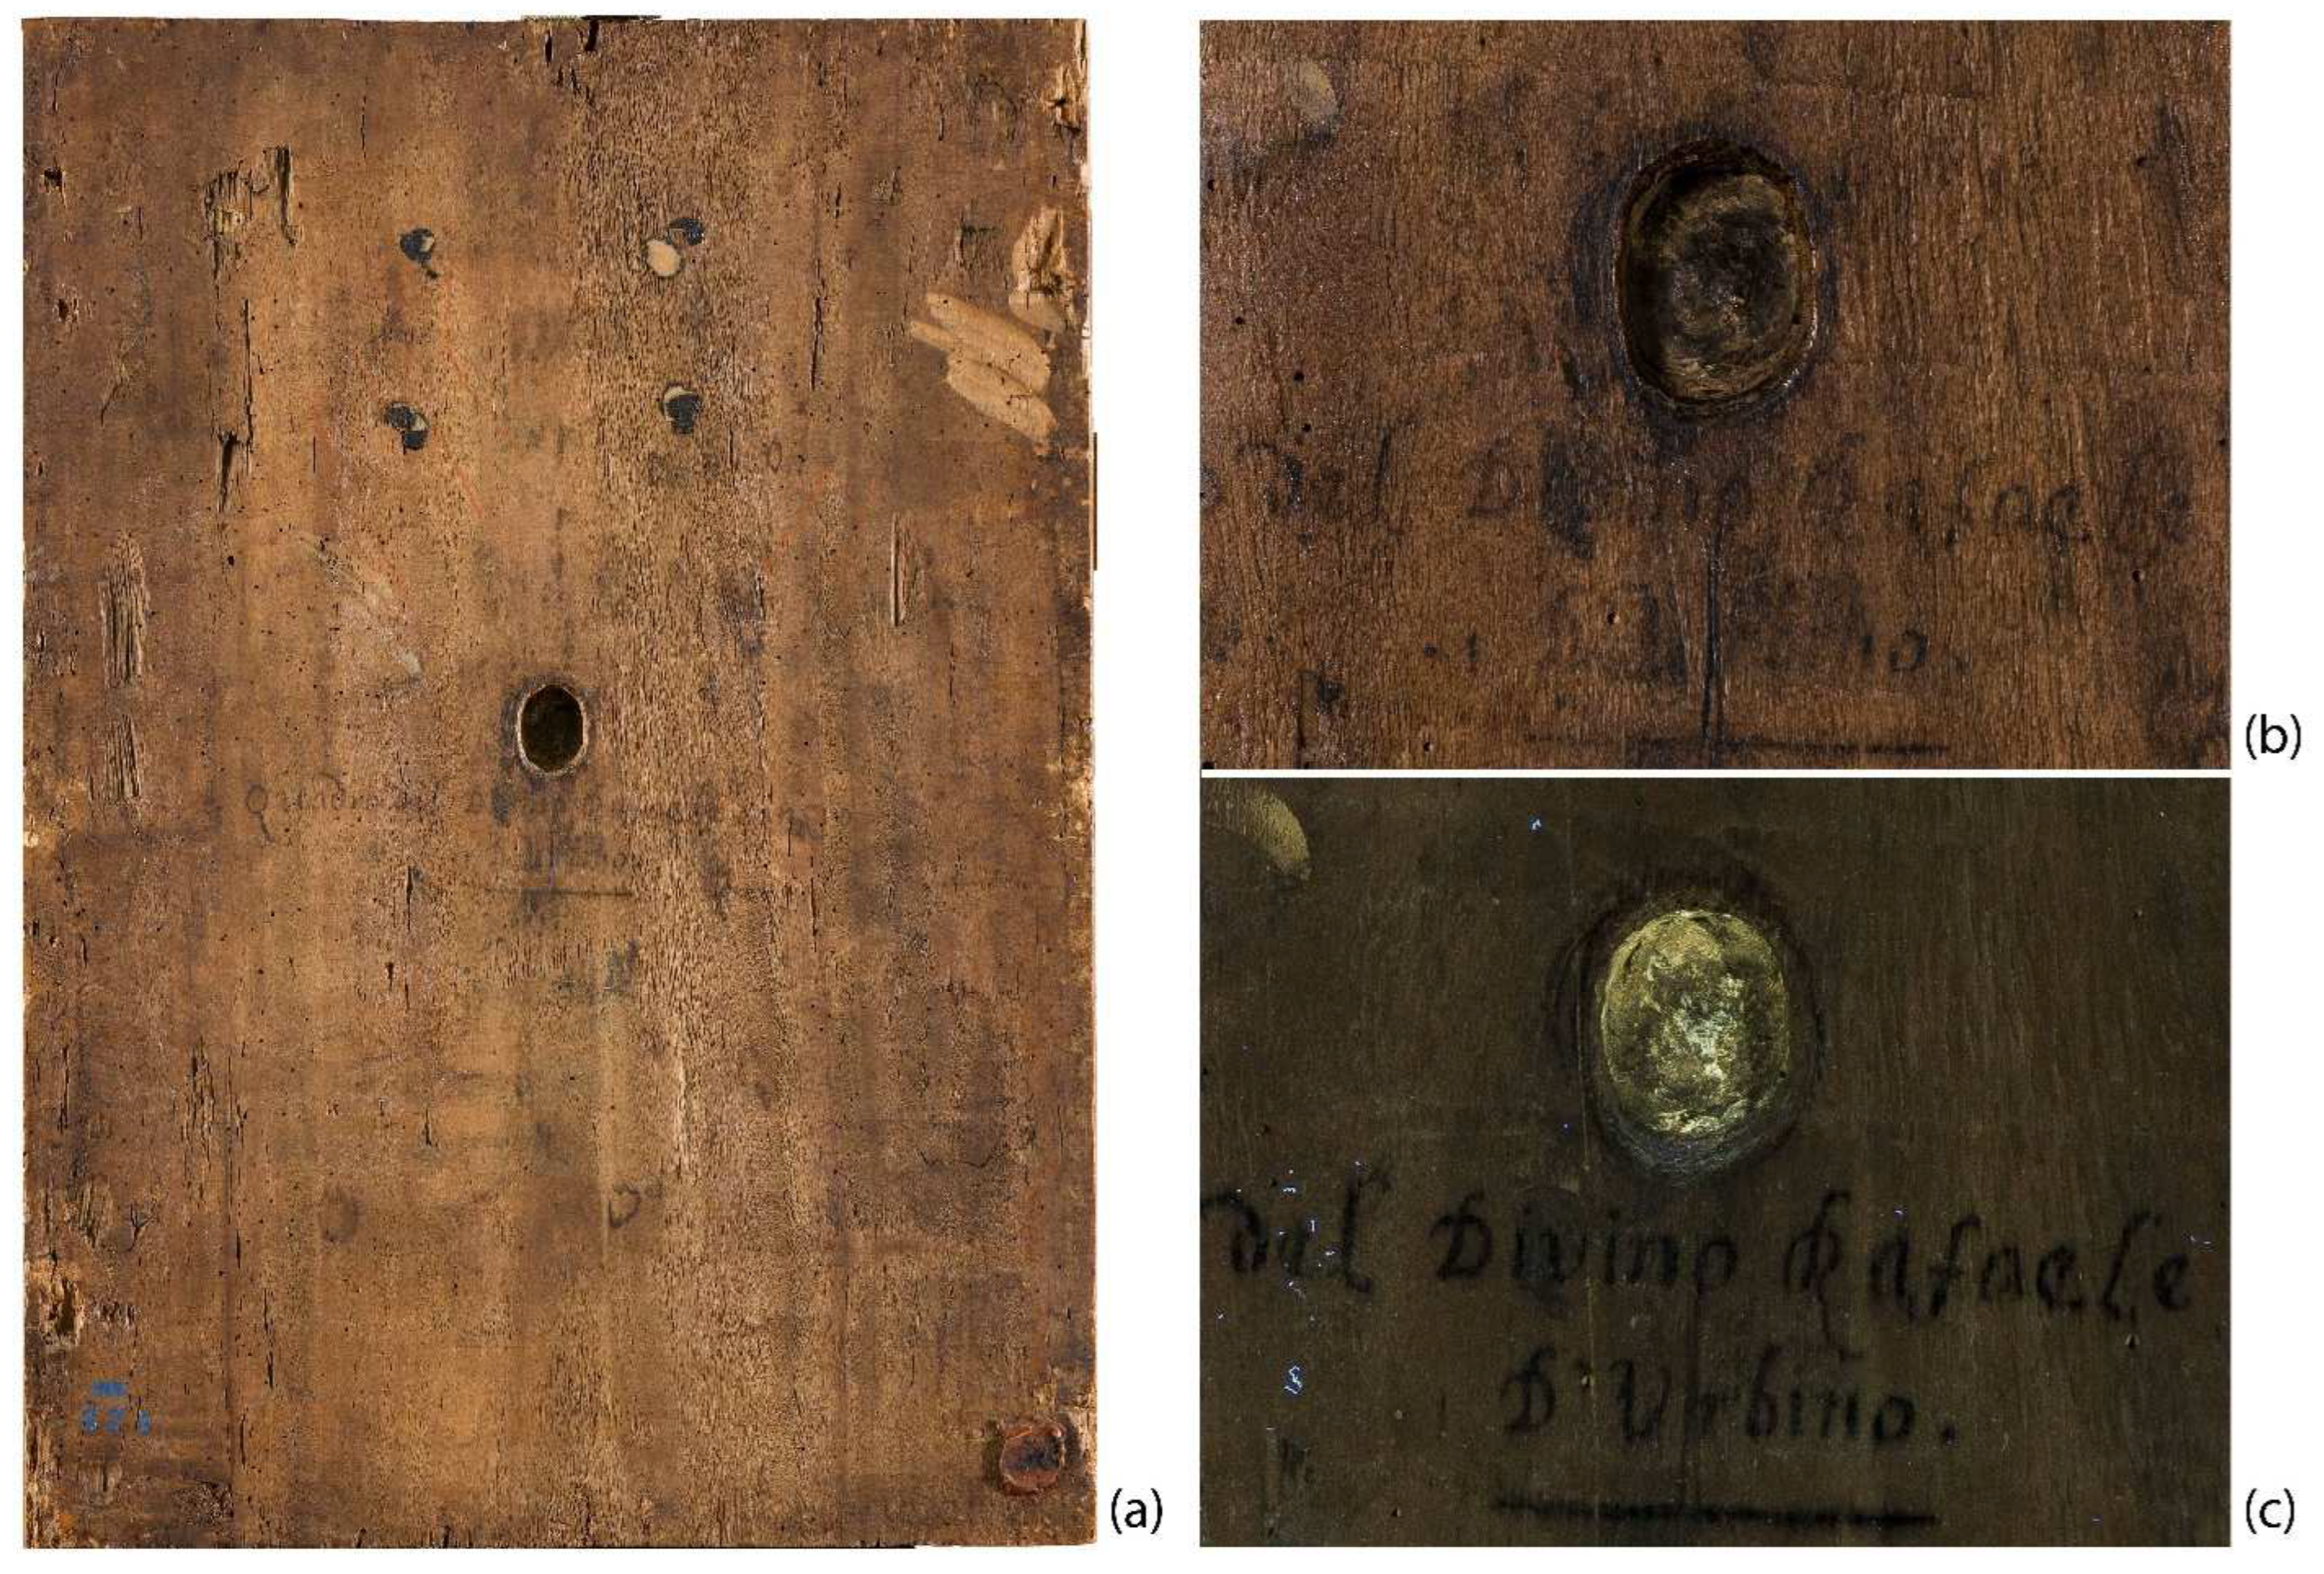
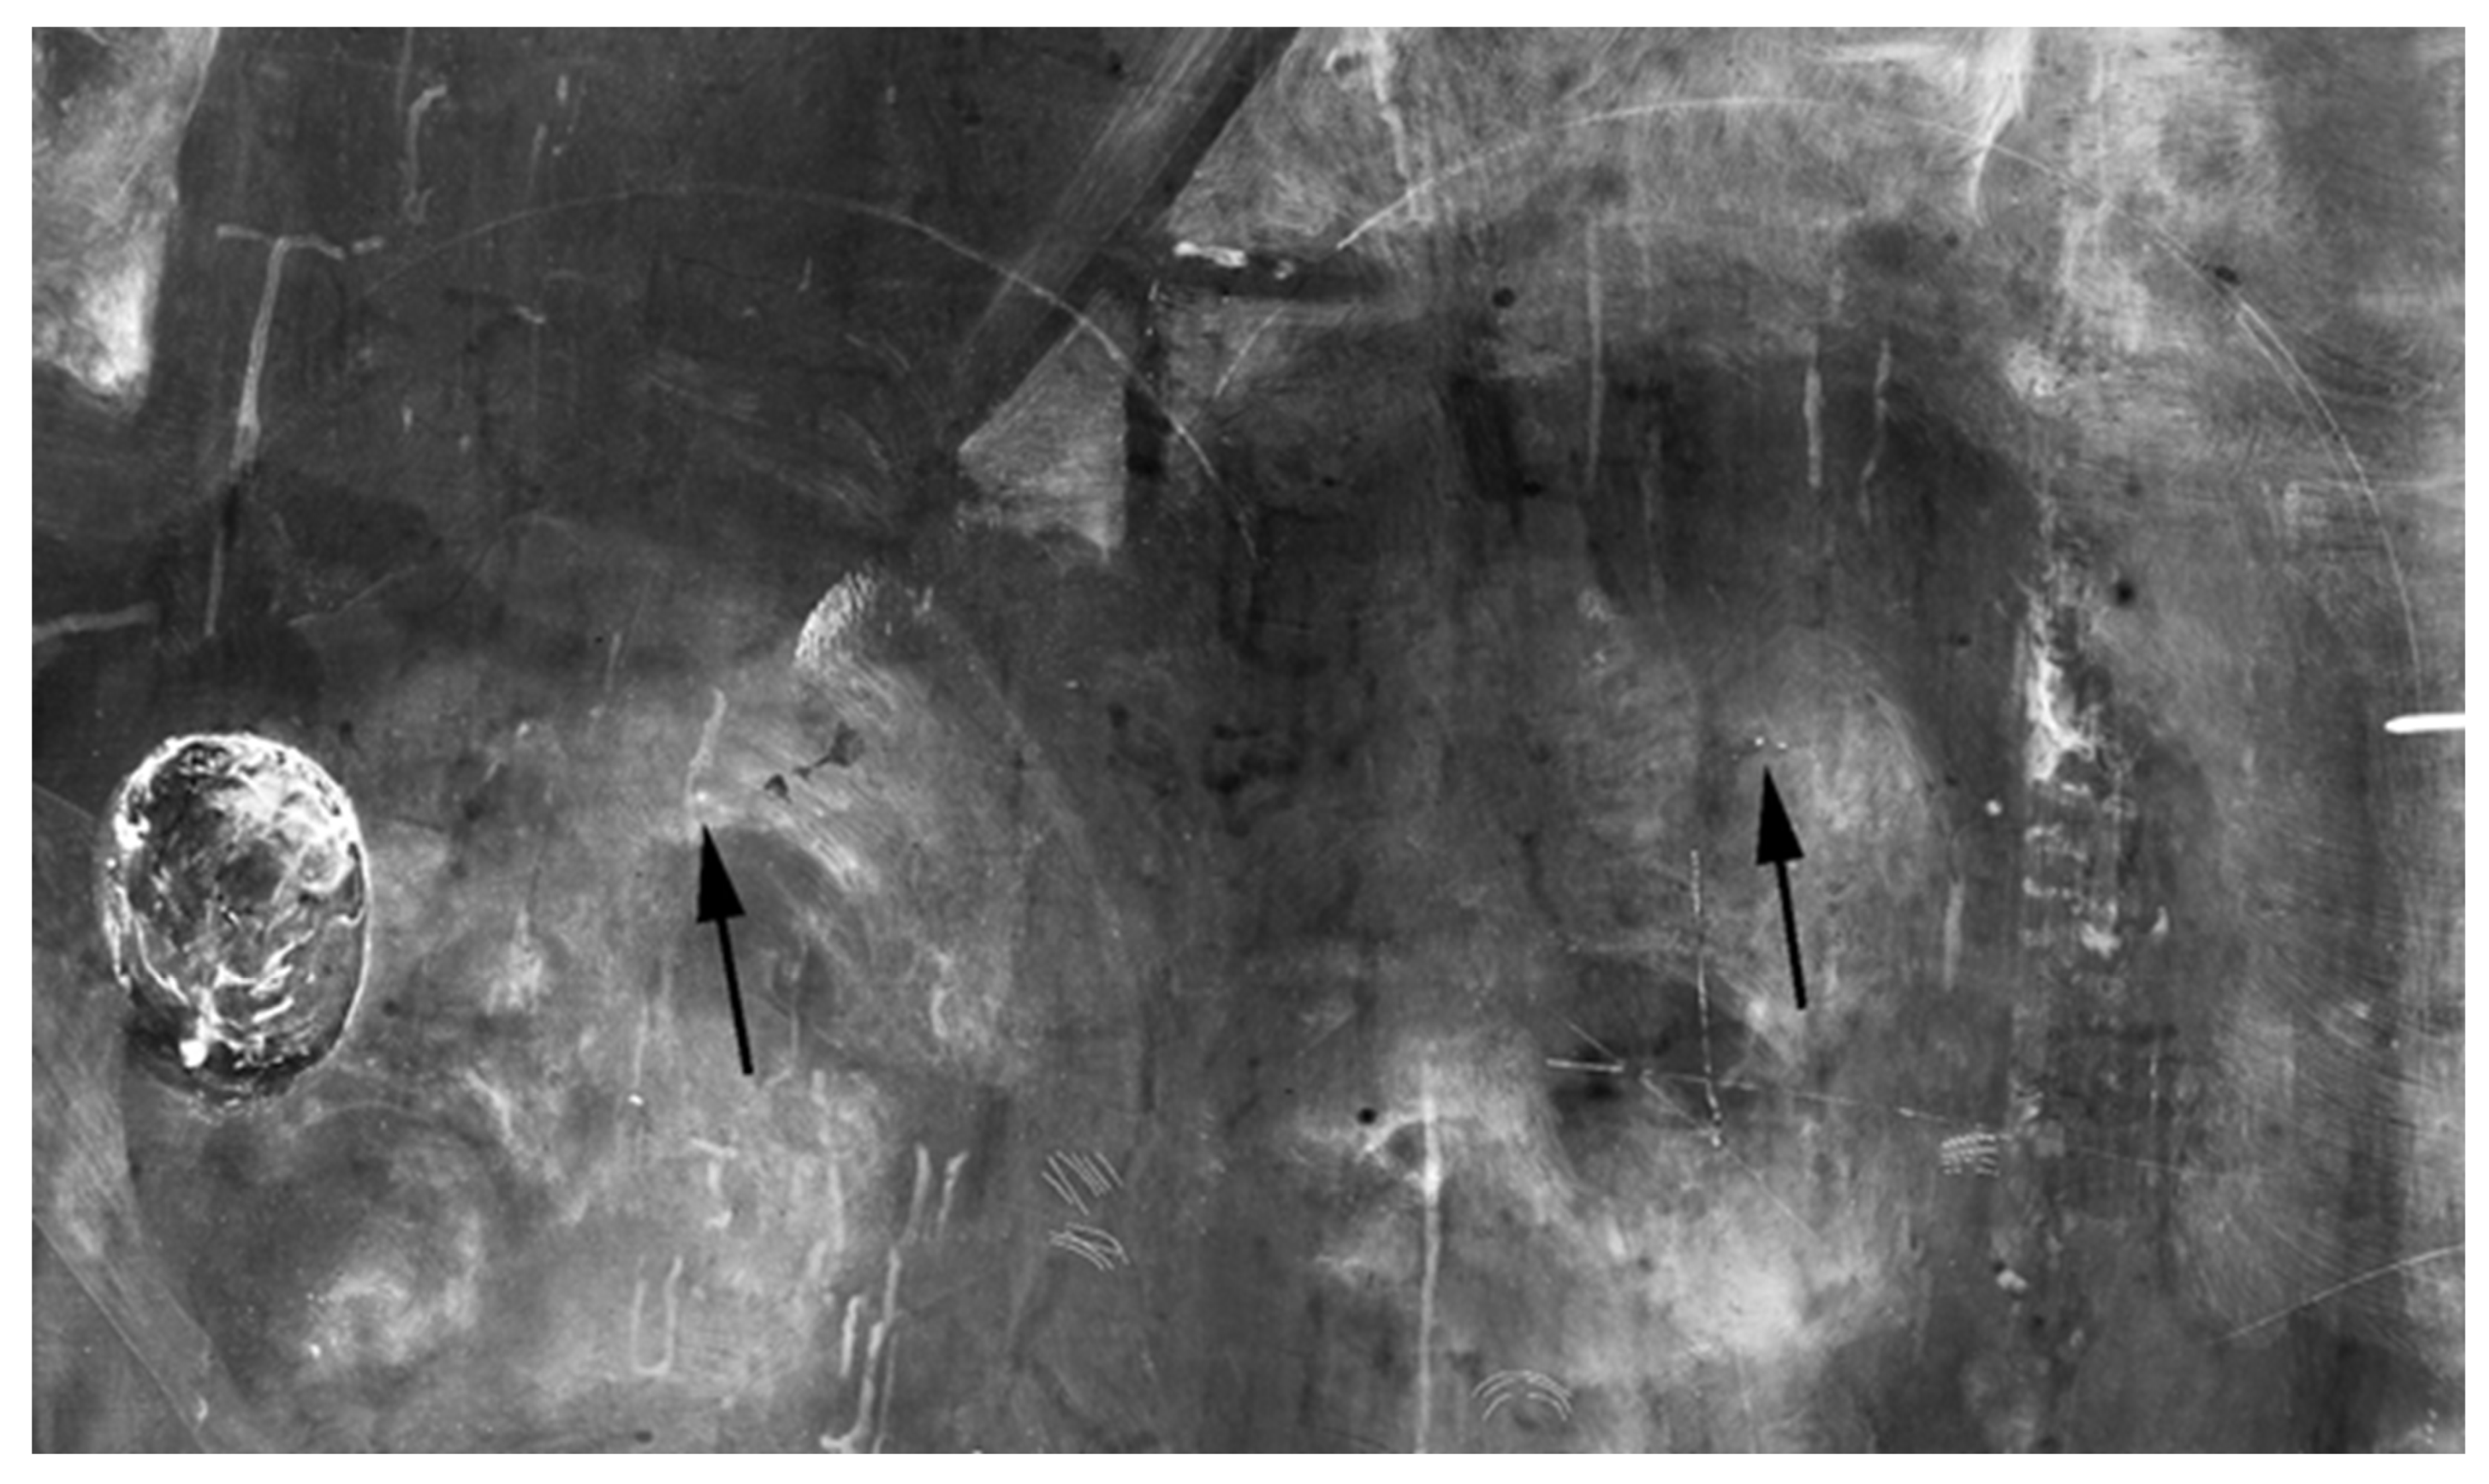
3.1. Wooden Support: The Hole on the Painting’s Back Surface and State of Preservation

| Wooden Support | XR | PuCT | MA-XRF |
|---|---|---|---|
| Wood grains (general view) | The wood grain, typical of poplar wood, is particularly visible in both the left- and right-end sides of the panel, and are much less noticeable in the central slice containing the hole. | The number of visible grains is considerably higher at both the left- and right-end sides, compared to those visible near the hole. | Not detectable |
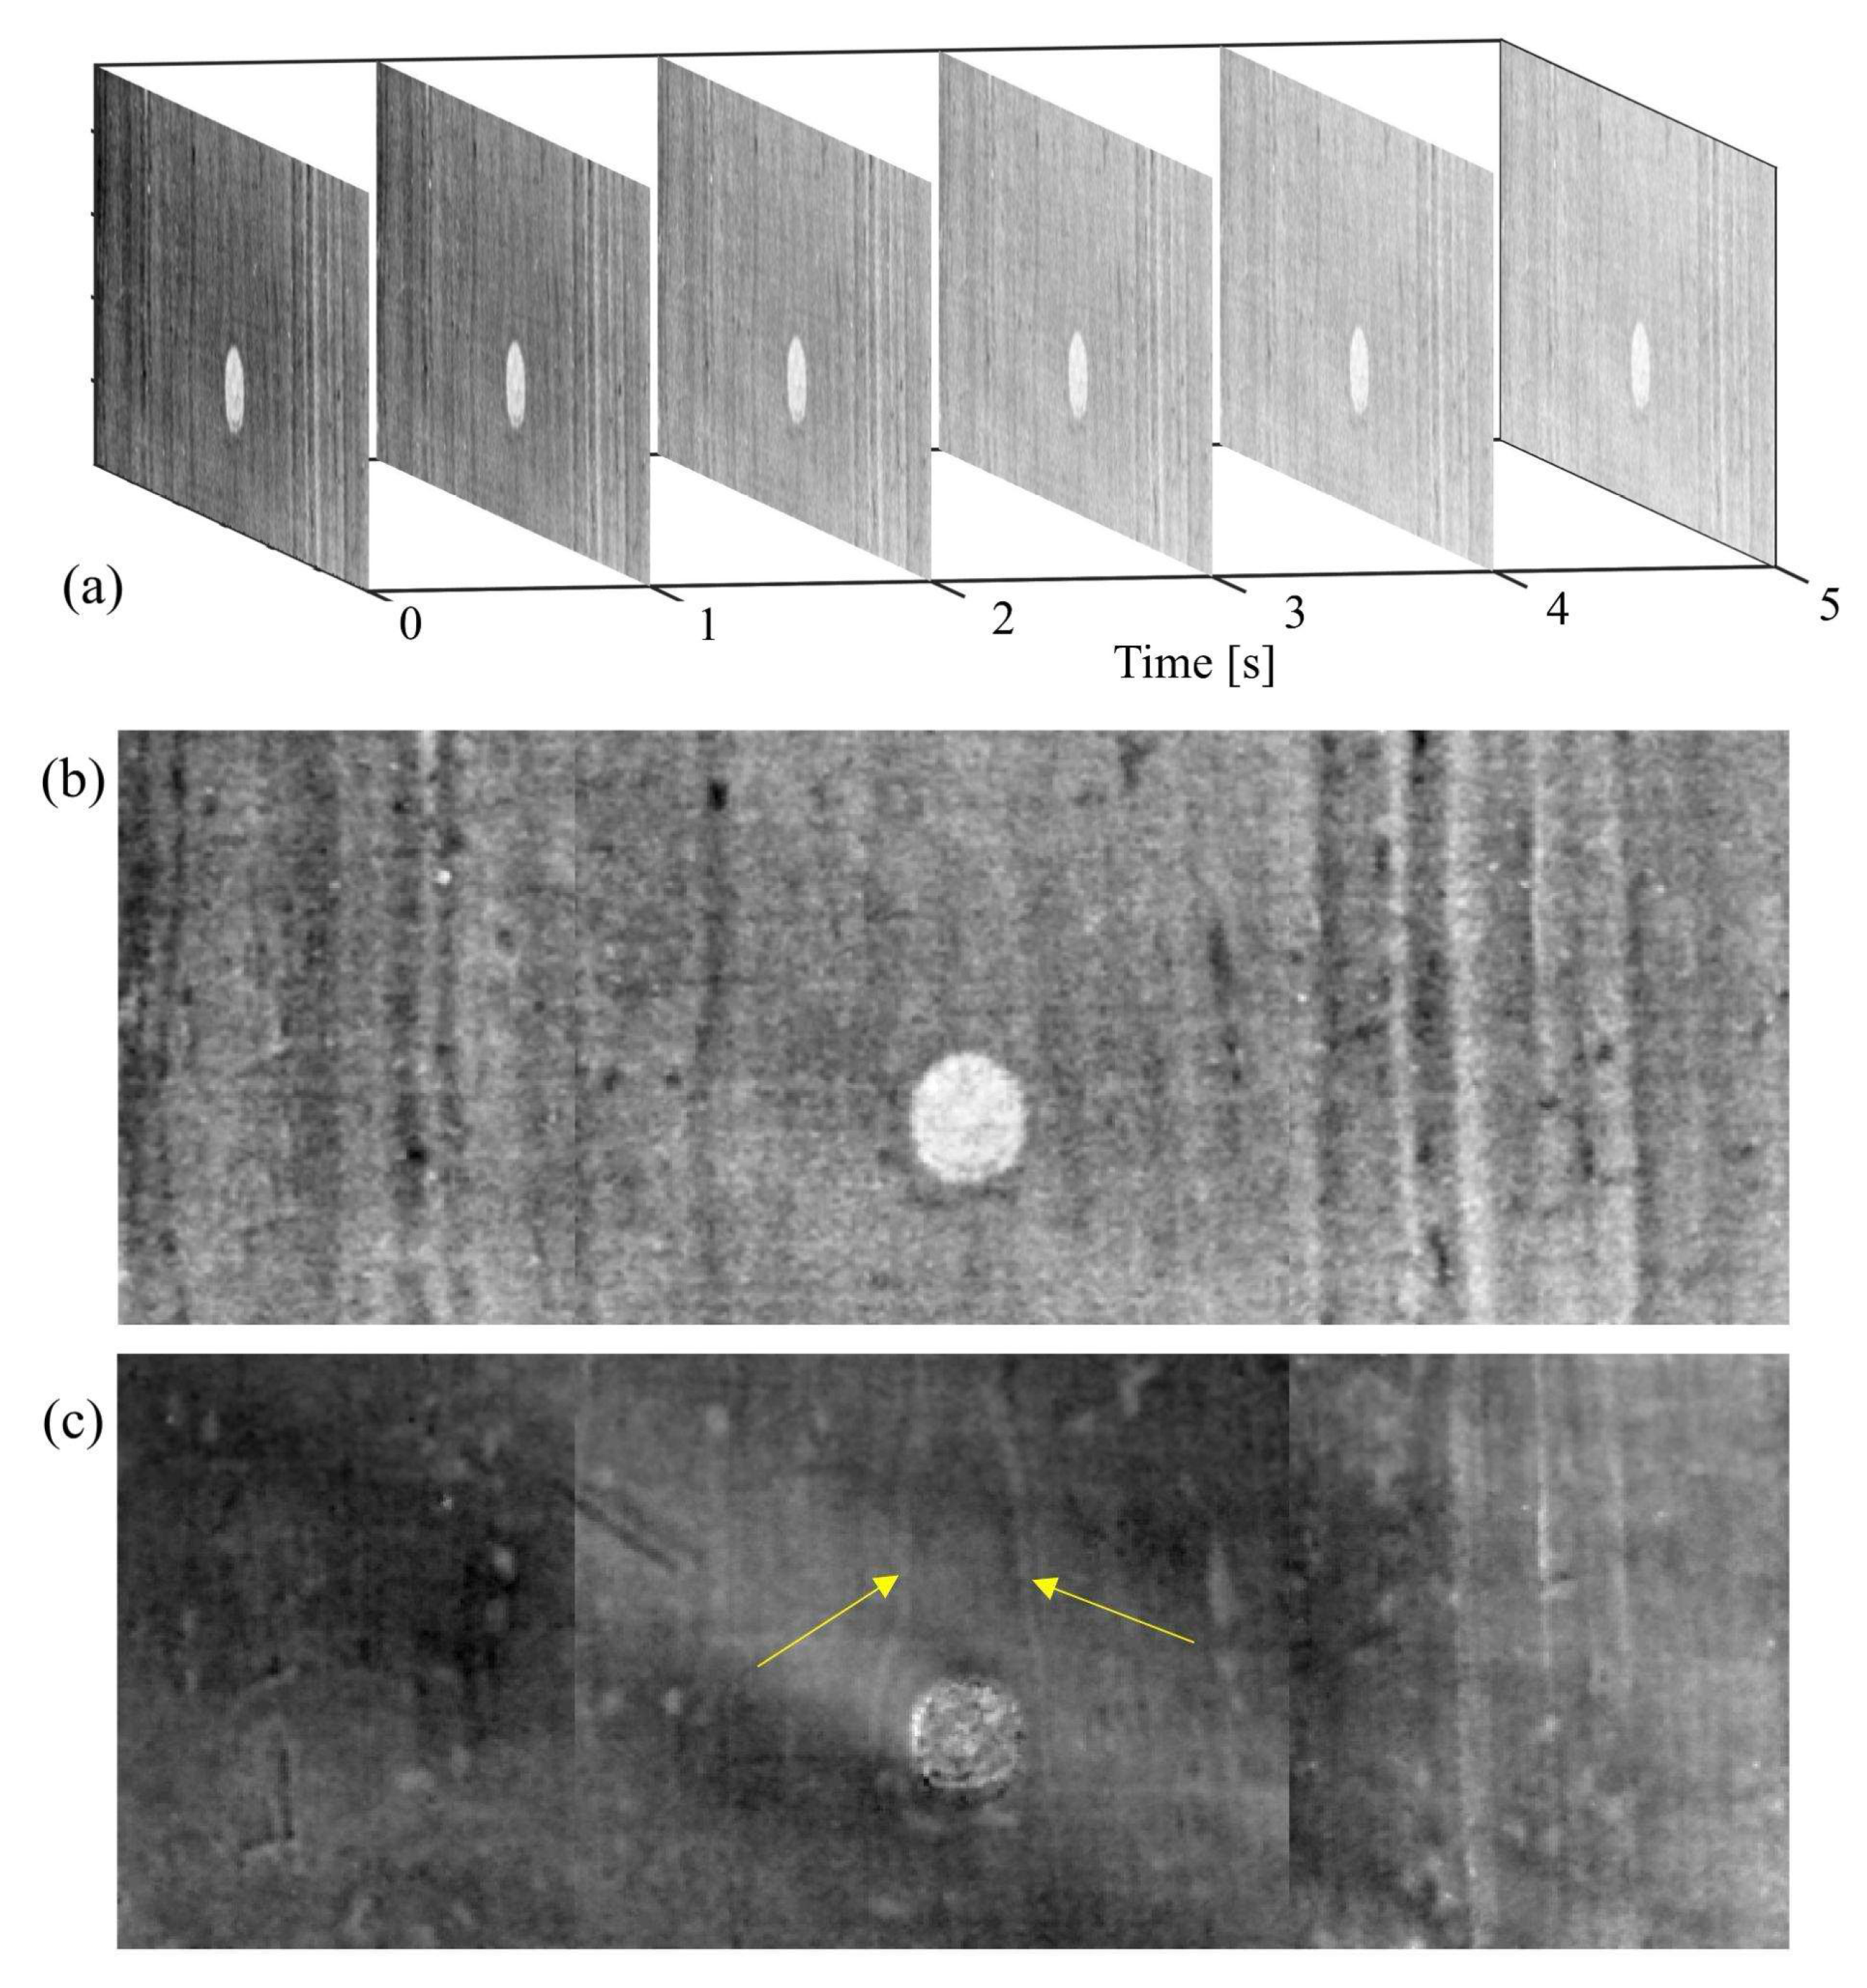
| Wood grains around the hole | Not evident | The wood grain inside the thickness of the board widen around the hole: the most visible wood grains near the hollow follow a smooth trajectory around it, suggesting/confirming that the hollow part could have been a wood knot. | Not detectable |
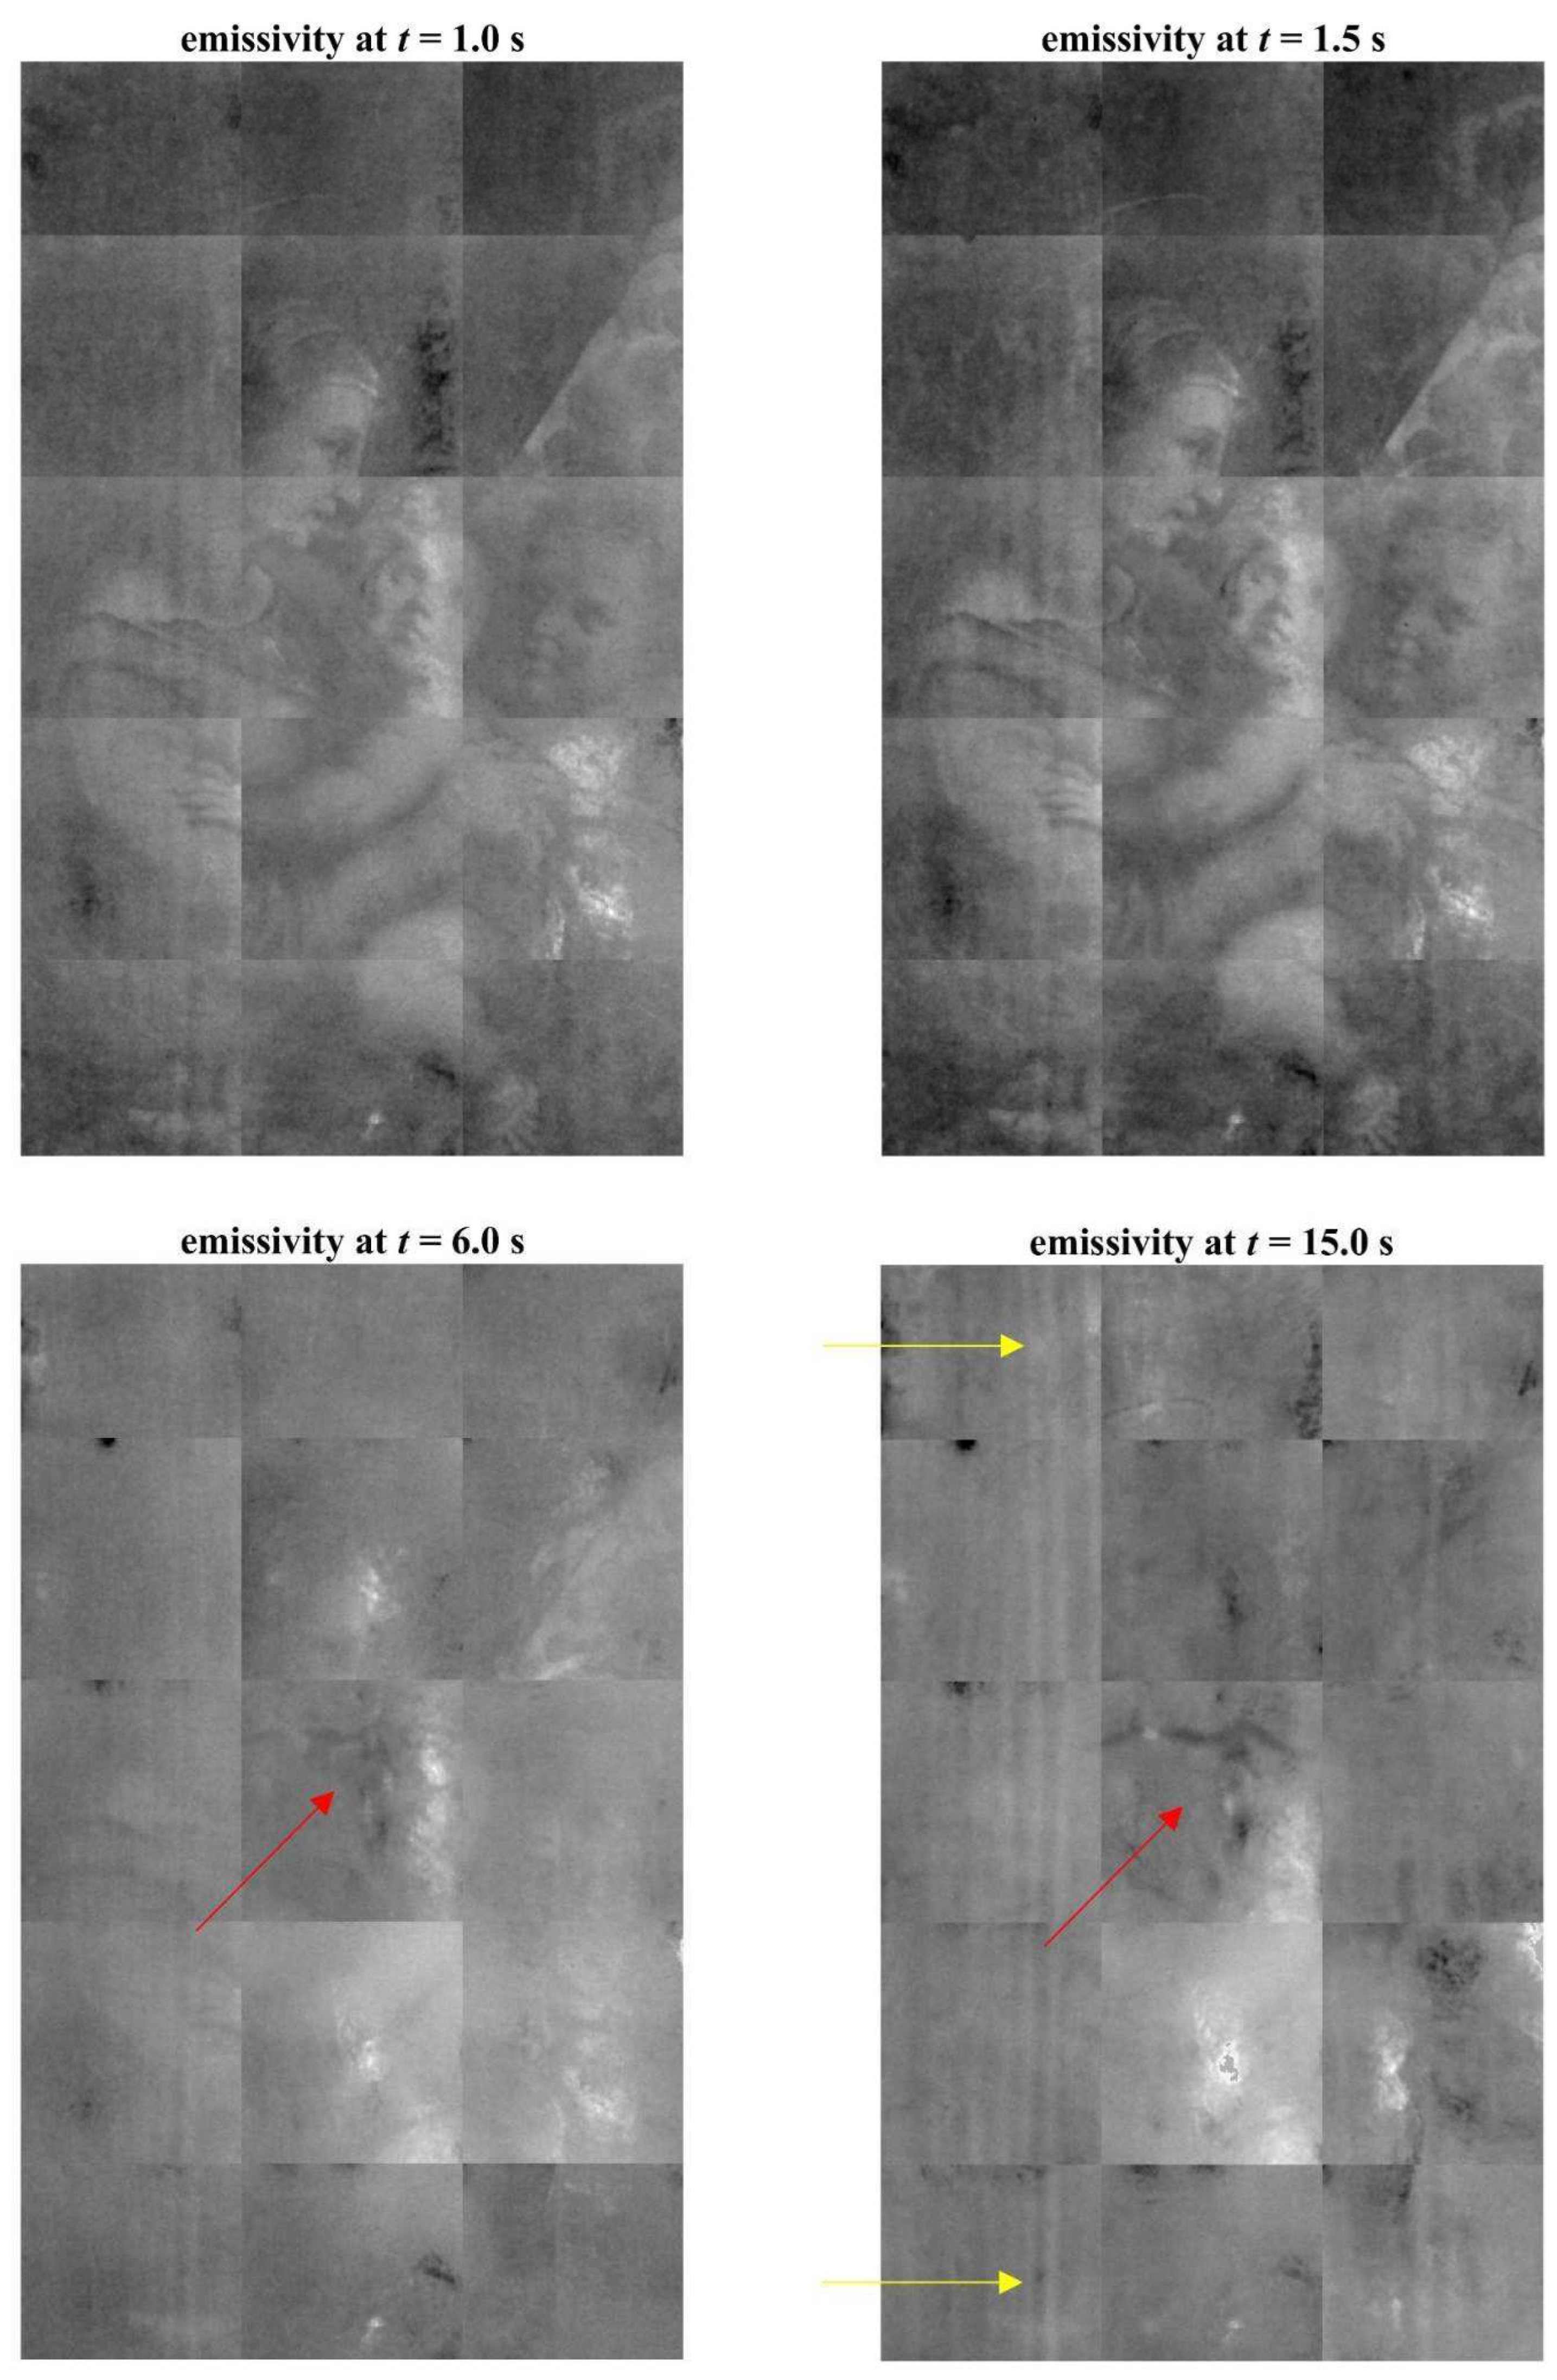
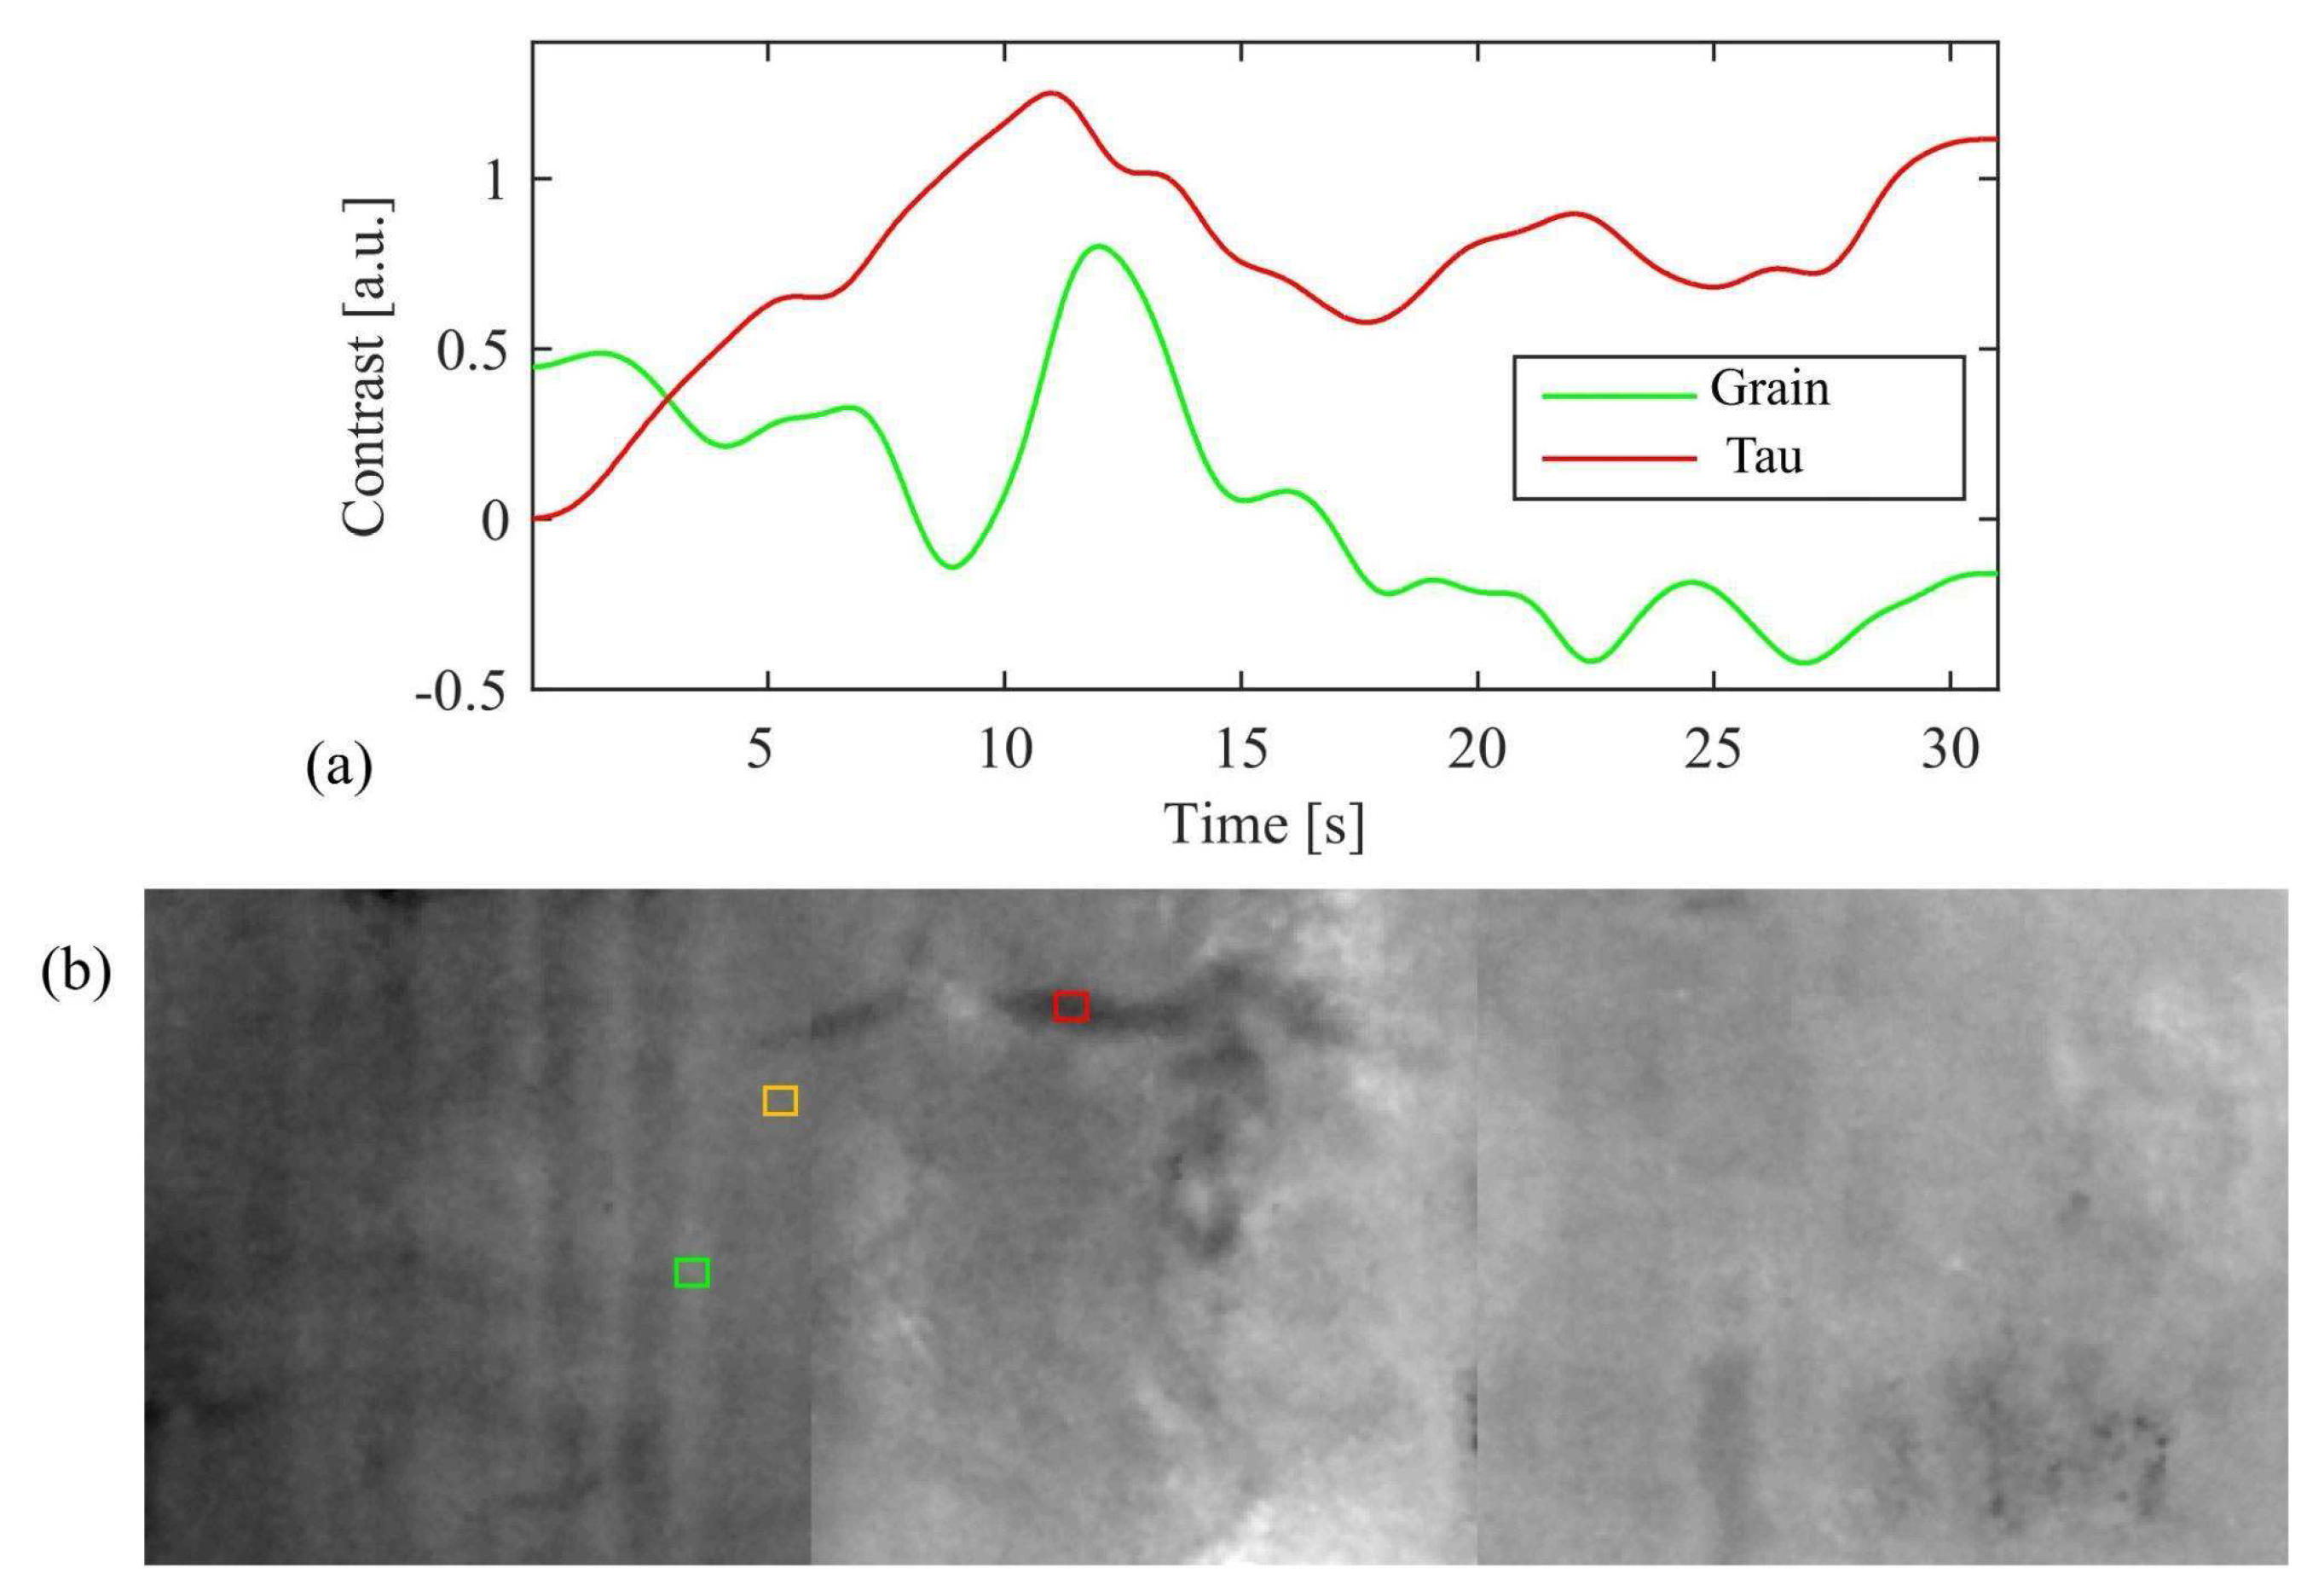
| Tau-shaped element near the hole | Clearly visible | Clearly visible; it is located at the same depth of the wood grain, thus belonging to the support; it appears darker than the surrounding area (its temperature is higher than that of the other pixels/it has lower thermal capacity, so it is potentially a cracked and unfilled area of the wood support). | Not detectable |
| Woodworm tunnels | Visible as radio-transparent traces in the central part of the panel: in many cases they follow the pattern of the wood fibers. | Visible | Not detectable |
| Other vertical signs (area of the green curtain) | Visible as more radio-opaque vertical traces, since filled and/or restored. | Visible as dark lines, becoming whiter as time elapses, in the thermograms acquired at different times from the front panel surface, Figure 8-suggesting that these have been filled and/or restored; filler probably involves only the upper layers. | Only visible in the Cu-distribution map (a lower signal in the distribution of copper make the vertical signs visible). |
3.2. Preparation Phases: From the Ground to the Underdrawing
4. Conclusions
Author Contributions
Funding
Institutional Review Board Statement
Informed Consent Statement
Acknowledgments
Conflicts of Interest
References
- Bava, A.; Villano, S. (Eds.) Sulle Tracce di Raffaello Nelle Collezioni Sabaude; Editris: Torino, Italy, 2021. [Google Scholar]
- Lang, J.; Middleton, A.A. Radiography of Cultural Material, 2nd ed.; Elsevier Butterworth-Heinemann: Oxford, UK, 2005. [Google Scholar]
- Laureti, S.; Colantonio, C.; Burrascano, P.; Melis, M.; Calabrò, G.; Malekmohammadi, H.; Pelosi, C. Development of integrated innovative techniques for paintings examination: The case studies of The Resurrection of Christ attributed to Andrea Mantegna and the Crucifixion of Viterbo attributed to Michelangelo’s workshop. J. Cult. Herit. 2019, 40, 1–16. [Google Scholar] [CrossRef]
- Zhang, H.; Sfarra, S.; Osman, A.; Ibarra-Castanedo, I.; Theodorakeas, P.; Avdelidis, N.P.; Koui, M.; Paoletti, D.; Maldague, X.P.V. Nondestructive Investigation of Paintings on Canvas by Infrared Thermography, Air-Coupled Ultrasound, and X-ray Radiography. In 10th International Symposium on the Conservation of Monuments in the Mediterranean Basin; Koui, M., Zezza, F., Kouis, D., Eds.; Springer: Berlin, Germany, 2018; pp. 367–374. [Google Scholar]
- Emandi, I.; Iovea, M.; Duliu, O.G.; Emandi, A. Ray Radiographic Study of some Panel Painting Icons from the Beginning of the XX Century. Int. J. Conserv. Sci. 2011, 2, 179–183. [Google Scholar]
- Impallaria, A.; Petrucci, F.; Chiozzi, S.; Evangelisti, F.; Squerzanti, S. A scanner for in situ X-ray radiography of large paintings: The case of “Paolo and Francesca” by G. Previati. Eur. Phys. J. Plus 2021, 136, 126. [Google Scholar] [CrossRef]
- Tum, J.; Middleton, A. Radiography of Cultural Material; Routledge: Oxfordshire, UK, 2006. [Google Scholar]
- Gargano, M.; Bonizzoni, L.; Grifoni, E.; Melada, J.; Guglielmi, V.; Bruni, S.; Ludwig, N. Multi-Analytical Investigation of Panel, Pigments and Varnish of The Martyrdom of St. Catherine by Gaudenzio Ferrari (16th Century). J. Cult. Herit. 2020, 46, 289–297. [Google Scholar] [CrossRef]
- Galli, A.; Gargano, M.; Bonizzoni, L.; Bruni, S.; Interlenghi, M.; Longoni, M.; Passaretti, A.; Caccia, M.; Salvatore, C.; Castiglioni, I.; et al. Imaging and Spectroscopic Data Combined to Disclose the Painting Techniques and Materials in the Fifteenth Century Leonardo Atelier in Milan. Dye. Pigment. 2021, 187, 109112. [Google Scholar] [CrossRef]
- Gargano, M.; Ludwig, N.; Poldi, G. A New Methodology for Comparing IR Reflectographic Systems. Infrared Phys. Techn. 2007, 49, 249–253. [Google Scholar] [CrossRef]
- Delaney, J.K.; Trumpy, G.; Didier, M.; Ricciardi, P.; Dooley, K.A. A high sensitivity, low noise and high spatial resolution multi-band infrared reflectography camera for the study of paintings and works on paper. Herit. Sci. 2017, 5, 1–14. [Google Scholar] [CrossRef] [Green Version]
- Fontana, R.; Barucci, M.; Dal Fovo, A.; Pampaloni, E.; Raffaelli, M.; Striova, J. Multispectral IR Reflectography for Painting Analysis. In Advanced Characterization Techniques, Diagnostic Tools and Evaluation Methods in Heritage Science, 1st ed.; Bastidas, D., Cano, E., Eds.; Springer: Berlin, Germany, 2018; Chapter 3. [Google Scholar]
- Gargano, M.; Galli, A.; Bonizzoni, L.; Alberti, R.; Aresi, N.; Caccia, M.; Castiglioni, I.; Interlenghi, M.; Salvatore, C.; Ludwig, N.; et al. The Giotto’s Workshop in the XXI Century: Looking inside the “God the Father with Angels” Gable. J. Cult. Herit. 2019, 36, 255–263. [Google Scholar] [CrossRef]
- Meola, C.; Carlomagno, G.M.; Giorleo, L. The use of infrared thermography for materials characterization. J. Mater. Process. Technol. 2004, 155, 1132–1137. [Google Scholar] [CrossRef]
- Maldague, X.P. Nondestructive Evaluation of Materials by Infrared Thermography; Springer: Berlin/Heidelberg, Germany, 2012. [Google Scholar]
- Zhang, H.; Sfarra, S.; Saluja, K.; Peeters, J.; Fleuret, J.; Duan, Y.; Maldague, X. Non-destructive investigation of paintings on canvas by continuous wave terahertz imaging and flash thermography. J. Nondestruct. Eval. 2017, 36, 34. [Google Scholar] [CrossRef] [Green Version]
- Rippa, M.; Pagliarulo, V.; Lanzillo, A.; Grilli, M.; Fatigati, G.; Rossi, P.; Cennamo, P.; Trojsi, G.; Ferraro, P.; Mormile, P. Active Thermography for Non-invasive Inspection of an Artwork on Poplar Panel: Novel Approach Using Principal Component Thermography and Absolute Thermal Contrast. J. Nondestruct. Eval. 2021, 40, 21. [Google Scholar] [CrossRef]
- Grinzato, E.; Bressan, C.; Marinetti, S.; Bison, P.G.; Bonacina, C. Monitoring of the Scrovegni Chapel by IR thermography: Giotto at infrared. Infrared Phys. Technol. 2002, 43, 165–169. [Google Scholar] [CrossRef]
- Bodnar, J.L.; Candoré, J.C.; Nicolas, J.L.; Szatanik, G.; Detalle, V.; Vallet, J.M. Stimulated infrared thermography applied to help restoring mural paintings. NDTE Int. 2012, 49, 40–46. [Google Scholar] [CrossRef]
- Peeters, J.; Steenackers, G.; Sfarra, S.; Legrand, S.; Ibarra-Castanedo, C.; Janssens, K.; Van der Snickt, G. IR Reflectography and Active Thermography on Artworks: The Added Value of the 1.5–3 µm Band. Appl. Sci. 2018, 8, 50. [Google Scholar] [CrossRef] [Green Version]
- Theodorakeas, P.; Cheilakou, E.; Ftikou, E.; Koui, M. Passive and active infrared thermography: An overview of applications for the inspection of mosaic structures. J. Phys. Conf. Ser. 2015, 655, 012061. [Google Scholar] [CrossRef]
- Pickering, S.; Almond, D. Matched excitation energy comparison of the pulse and lock-in thermography NDE techniques. NDTE Int. 2008, 41, 501–509. [Google Scholar] [CrossRef]
- Laureti, S.; Sfarra, S.; Malekmohammadi, H.; Burrascano, P.; Hutchins, D.A.; Senni, L.; Silipigni, G.; Maldague, X.P.V.; Ricci, M. The use of pulse-compression thermography for detecting defects in paintings. NDTE Int. 2018, 98, 147–154. [Google Scholar] [CrossRef] [Green Version]
- Sfarra, S.; Laureti, S.; Gargiulo, G.; Malekmohammadi, H.; Sangiovanni, M.A.; La Russa, M.; Burrascano, P.; Ricci, M. Low Thermal Conductivity Materials and Very Low Heat Power: A Demanding Challenge in the Detection of Flaws in Multi-Layer Wooden Cultural Heritage Objects Solved by Pulse-Compression Thermography Technique. Appl. Sci. 2020, 10, 4233. [Google Scholar] [CrossRef]
- Laureti, S.; Silipigni, G.; Senni, L.; Tomasello, R.; Burrascano, P.; Ricci, M. Comparative study between linear and non-linear frequency-modulated pulse-compression thermography. Appl. Opt. 2018, 57, D32–D39. [Google Scholar] [CrossRef]
- Wu, S.; Gao, B.; Yang, Y.; Zhu, Y.; Burrascano, P.; Laureti, S.; Ricci, M.; Wang, Y. Halogen optical referred pulse-compression thermography for defect detection of CFRP. Infrared Phys. Technol. 2019, 102, 103006. [Google Scholar] [CrossRef]
- Silipigni, G.; Burrascano, P.; Hutchins, D.A.; Laureti, S.; Petrucci, R.; Senni, L.; Torre, L.; Ricci, M. Optimization of the pulse-compression technique applied to the infrared thermography nondestructive evaluation. NDTE Int. 2017, 87, 100–110. [Google Scholar] [CrossRef]
- Walmsley, E.; Metzger, C.; Delaney, J.-K.; Fletcher, C. Improved visualization of underdrawings with solid-state detectors operating in the infrared. Stud. Conserv. 1994, 39, 217–231. [Google Scholar]
- Delaney, J.K.; Thoury, M.; Zeibel, J.G.; Ricciardi, P.; Morales, K.M.; Dooley, K.A. Visible and infrared imaging spectroscopy of paintings and improved reflectography. Herit. Sci. 2016, 4, 6. [Google Scholar] [CrossRef] [Green Version]
- Pronti, L.; Romani, M.; Verona-Rinati, G.; Tarquini, O.; Colao, F.; Colapietro, M.; Pifferi, A.; Cestelli-Guidi, M.; Marinelli, M. Post-Processing of VIS, NIR, and SWIR Multispectral Images of Paintings. New Discovery on the The Drunkenness of Noah, Painted by Andrea Sacchi, Stored at Palazzo Chigi (Ariccia, Rome). Heritage 2019, 2, 2275–2286. [Google Scholar] [CrossRef] [Green Version]
- Cavaleri, T.; Manchinu, P.; Ventura, B. Il restauro della Madonna della tenda: Note sulla tecnica di esecuzione e sulla storia conservativa. In Sulle Tracce di Raffaello Nelle Collezioni Sabaude; Bava, A., Villano, S., Eds.; Editris: Torino, Italy, 2021; pp. 58–69. [Google Scholar]
- Ricci, M.; Laureti, S.; Malekmohammadi, H.; Sfarra, S.; Lanteri, L.; Colantonio, C.; Calabrò, G.; Pelosi, C. Surface and Interface Investigation of a 15th Century Wall Painting Using Multispectral Imaging and Pulse-Compression Infrared Thermography. Coatings 2021, 11, 546. [Google Scholar] [CrossRef]
- Groppi, F.; Vigliotti, D.; Lanteri, L.; Agresti, G.; Casoli, A.; Laureti, S.; Ricci, M.; Pelosi, C. Advanced documentation methodologies combined with multi-analytical approach for the preservation and restoration of 18th century architectural decorative elements at Palazzo Nuzzi in Orte (Central Italy). Int. J. Conserv. Sci. 2021, 12, 921–934. [Google Scholar]
- Zhang, G.; Zhou, Q. Pseudonoise codes constructed by Legendre sequence. Electr. Lett. 2002, 38, 376–377. [Google Scholar]
- Ricci, M.; Senni, L.; Burrascano, P. Exploiting pseudorandom sequences to enhance noise immunity for air-coupled ultrasonic nondestructive testing. IEEE T. Instrum. Meas. 2012, 61, 2905–2915. [Google Scholar] [CrossRef]
- Romano, F.P.; Caliri, C.; Nicotra, P.; Di Martino, S.; Pappalardo, L.; Rizzo, F.; Santos, H.C. Real-time elemental imaging of large dimension paintings with a novel mobile macro X-ray fluorescence (MA-XRF) scanning tehcnique. J. Anal. At. Spectrom. 2017, 32, 773–781. [Google Scholar] [CrossRef]
- Caliri, C.; Bicchieri, M.; Biocca, P.; Romano, F.P. In situ macro X-ray fluorescence scanning on a Leonardo da Vinci portrait. X-ray Spectrom. 2021, 50, 332–340. [Google Scholar] [CrossRef]
- D’Elia, E.; Buscaglia, P.; Piccirillo, A.; Picollo, M.; Casini, A.; Cucci, C.; Stefani, L.; Romano, F.P.; Caliri, C.; Gulmini, M. Macro X-ray fluorescence and VNIR hyperspectral imaging in the investigation of two panels by Marco d’Oggiono. Microchem. J. 2020, 154, 104541. [Google Scholar] [CrossRef]
- Dos Santos, H.C.; Caliri, C.; Pappalardo, L.; Catalano, R.; Orlando, A.; Rizzo, F.; Romano, F.P. Real-time MA-XRF imaging spectroscopy of the Virgin with the Child painted by Antonello de Saliba in 1497. Microchem. J. 2018, 140, 96–104. [Google Scholar] [CrossRef]
- Križnar, A.; Ager, F.J.; Caliri, C.; Romano, F.P.; Respaldiza, M.Á.; Gómez-Morón, M.A.; Núñez, L.; Magdaleno, R. Study of two large-dimension Murillo’s paintings by means of macro X-ray fluorescence imaging, point X-ray fluorescence analysis, and stratigraphic studies. X-ray Spectrom. 2019, 48, 482–489. [Google Scholar] [CrossRef]
- Nervo, M.; Romano, F.P.; Caliri, C.; Piccirillo, A.; Triolo, P.; Demonte, D.; Gatti, A.; Vergallo, E.; Cardinali, M.; Ferrero, M. “Costruzione del viadotto”: MA-XRF in the pictorial executive technique of Agostino Bosia. X-ray Spectrom. 2021, 50, 253–262. [Google Scholar] [CrossRef]
- Gargano, M.; Cavaliere, F.; Viganò, D.; Galli, A.; Ludwig, N. A New Spherical Scanning System for Infrared Reflectography of Paintings. Infrared Phys. Techn. 2017, 81, 128–136. [Google Scholar] [CrossRef]


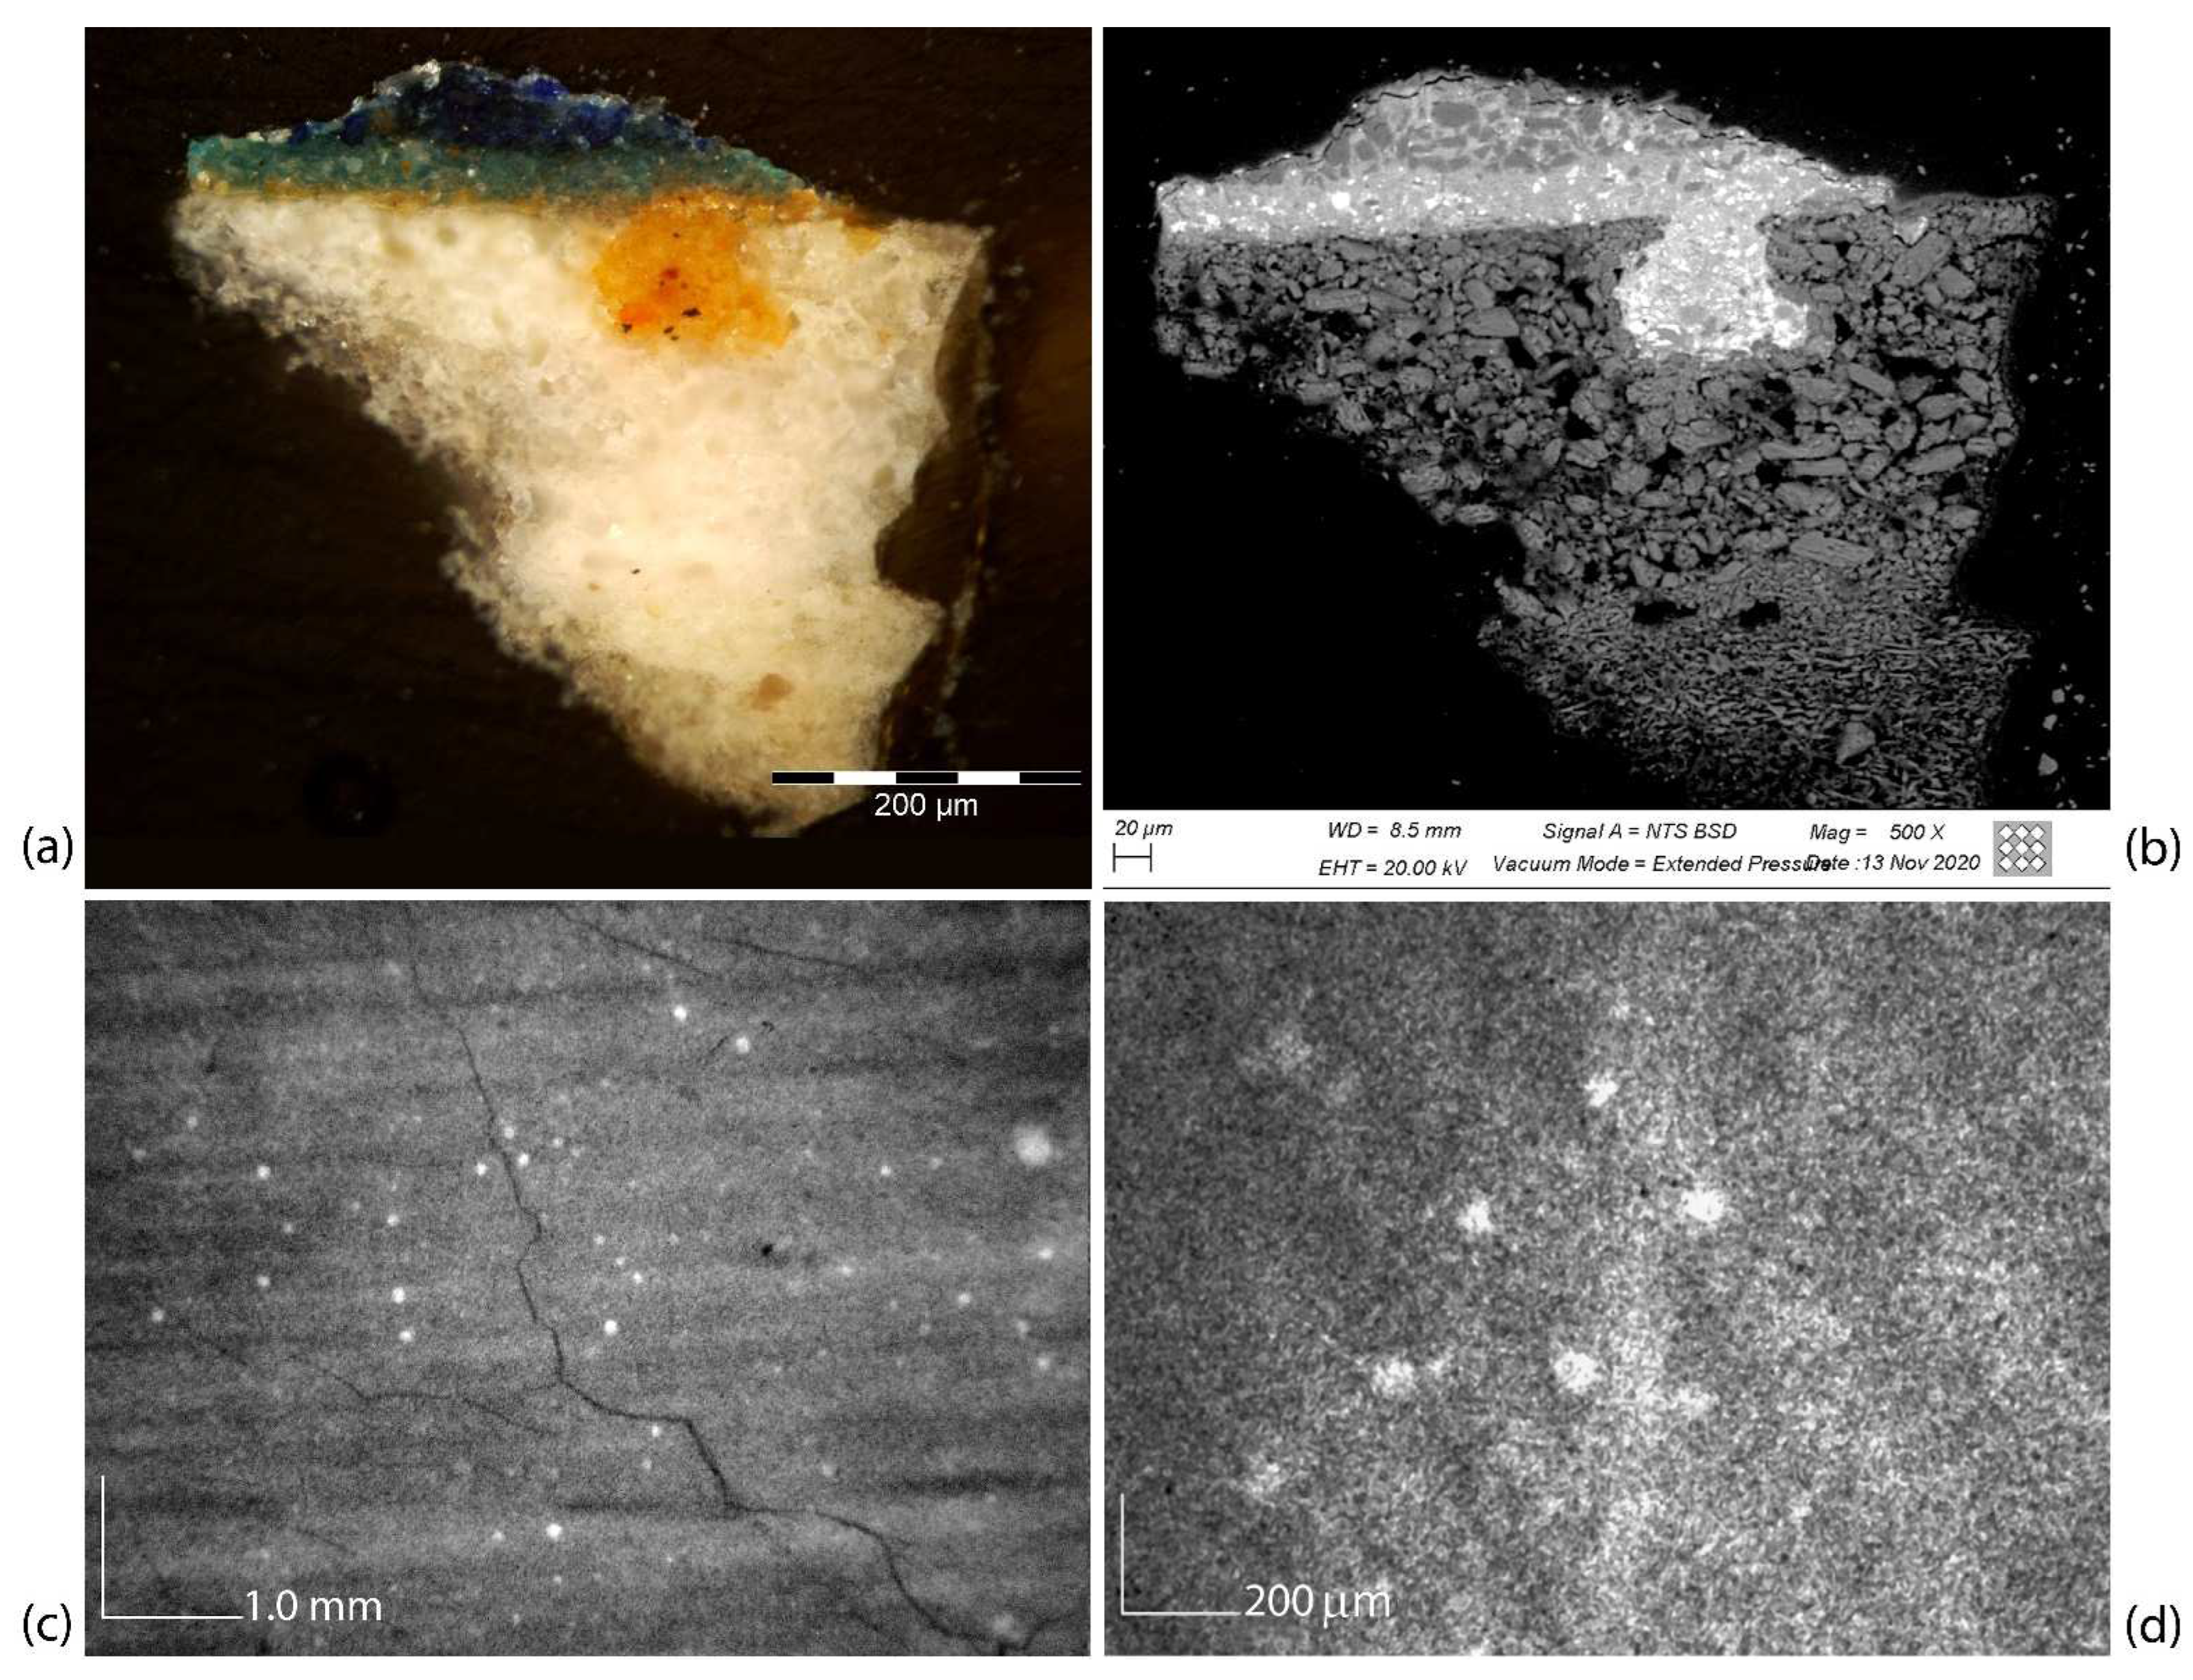
| Preparation Phases | OM and SEM/EDS | MA-XRF | XR | HR-SWIR |
|---|---|---|---|---|
| Ground layer | White layer, made of plaster | Detected the use of calcium-, lead-, and iron-based pigments for the preparation phases (ground and imprimitura not distinguishable between each other). | Not evident | Not evident |
| Imprimitura | Yellow-orange layer, made of lead white and ochres | Visible as radiopaque brushstrokes in some areas, also not in correspondence with lighter areas of paint; imprimitura inclusions in the plaster layer are visible at high magnification as a widespread presence of small, irregular white spots. | Not evident | |
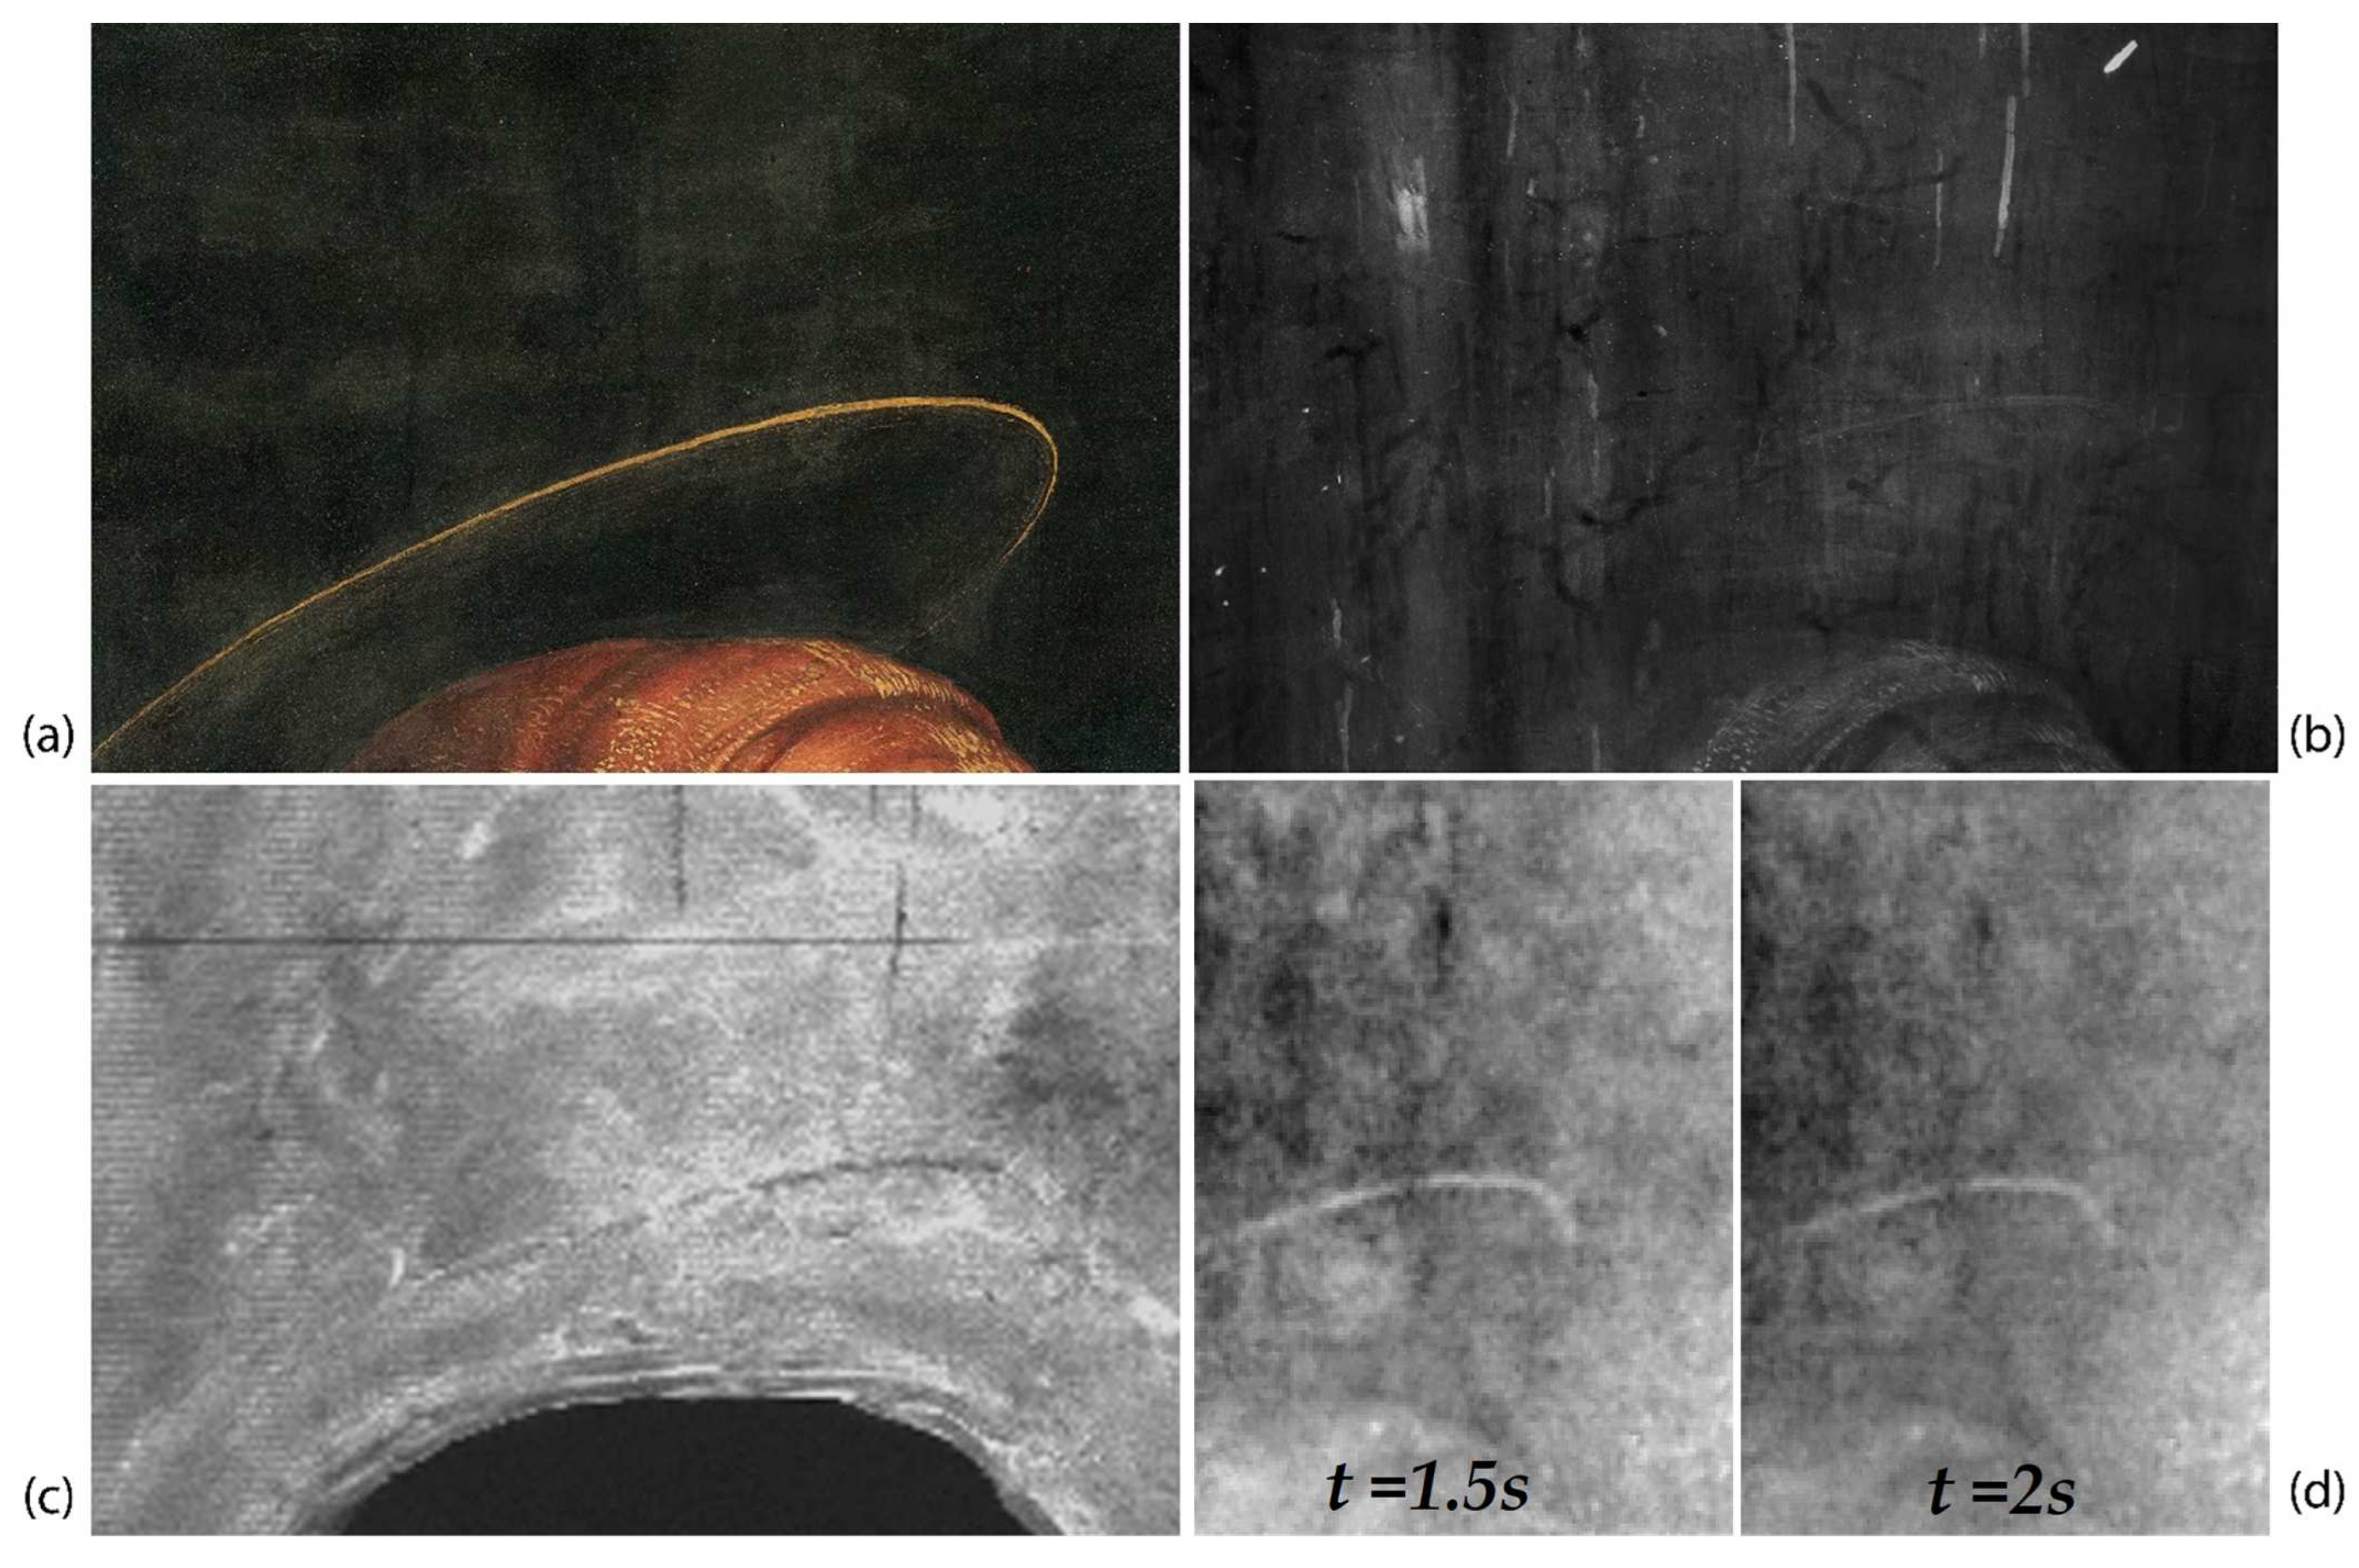
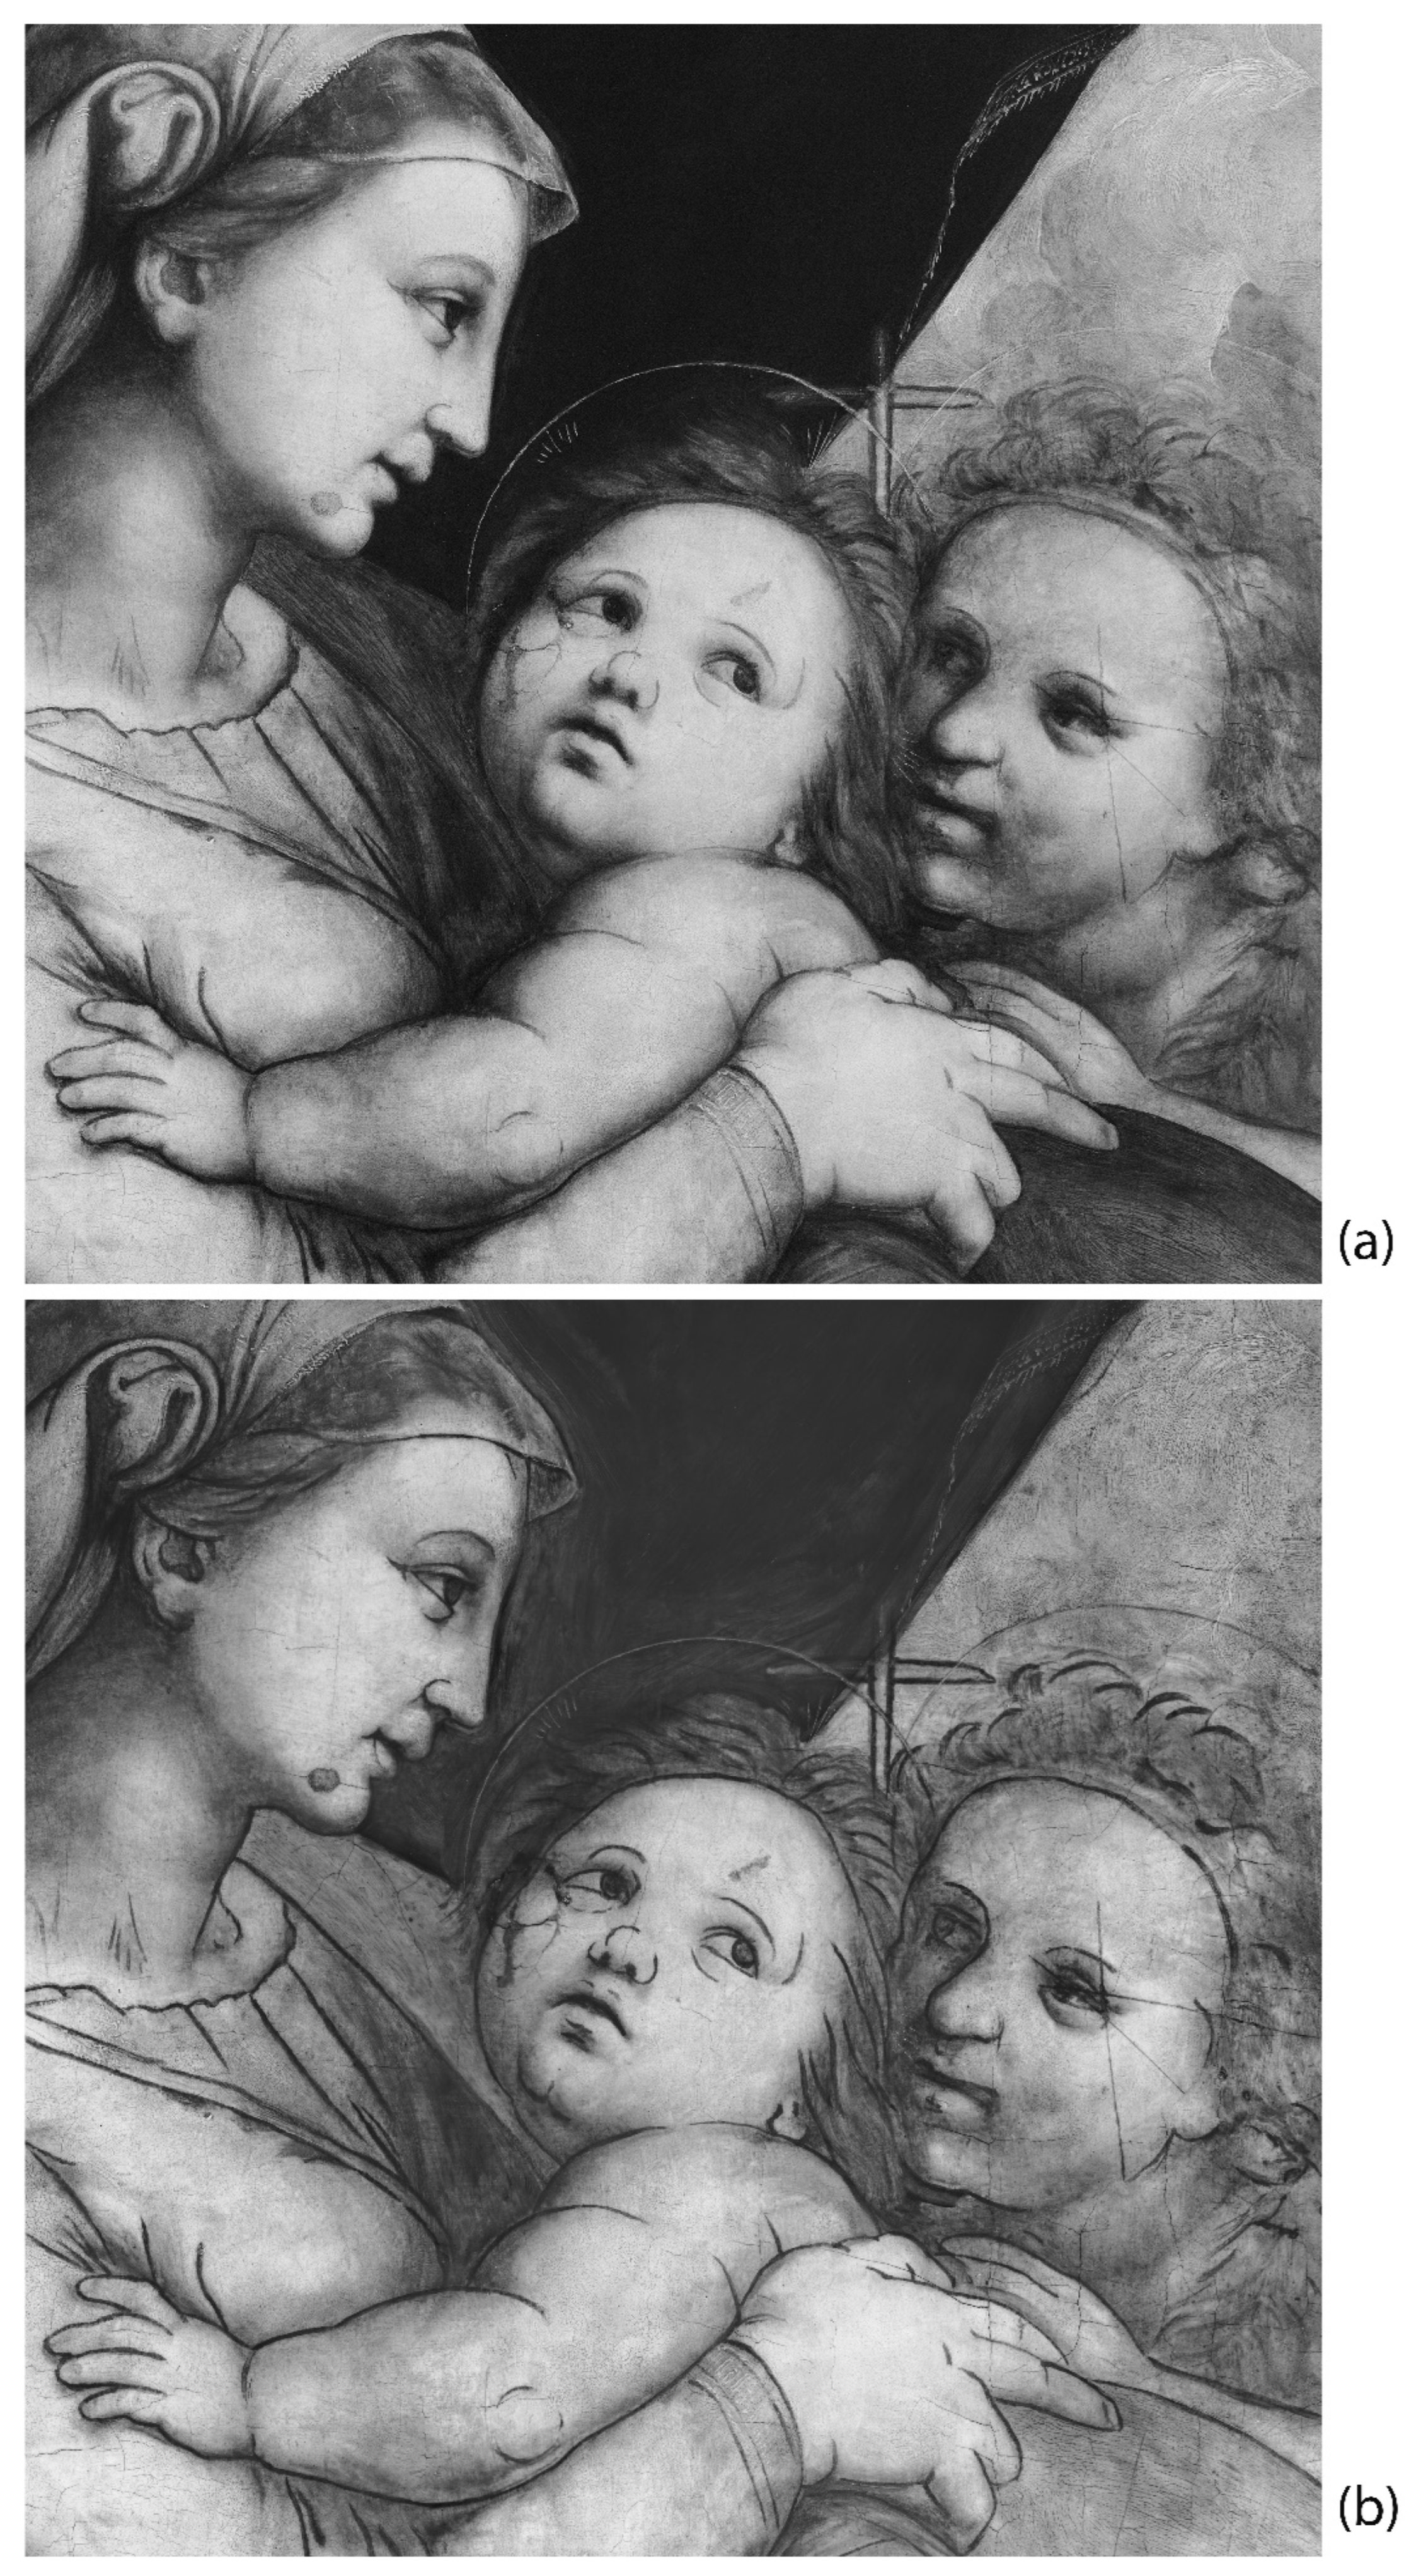
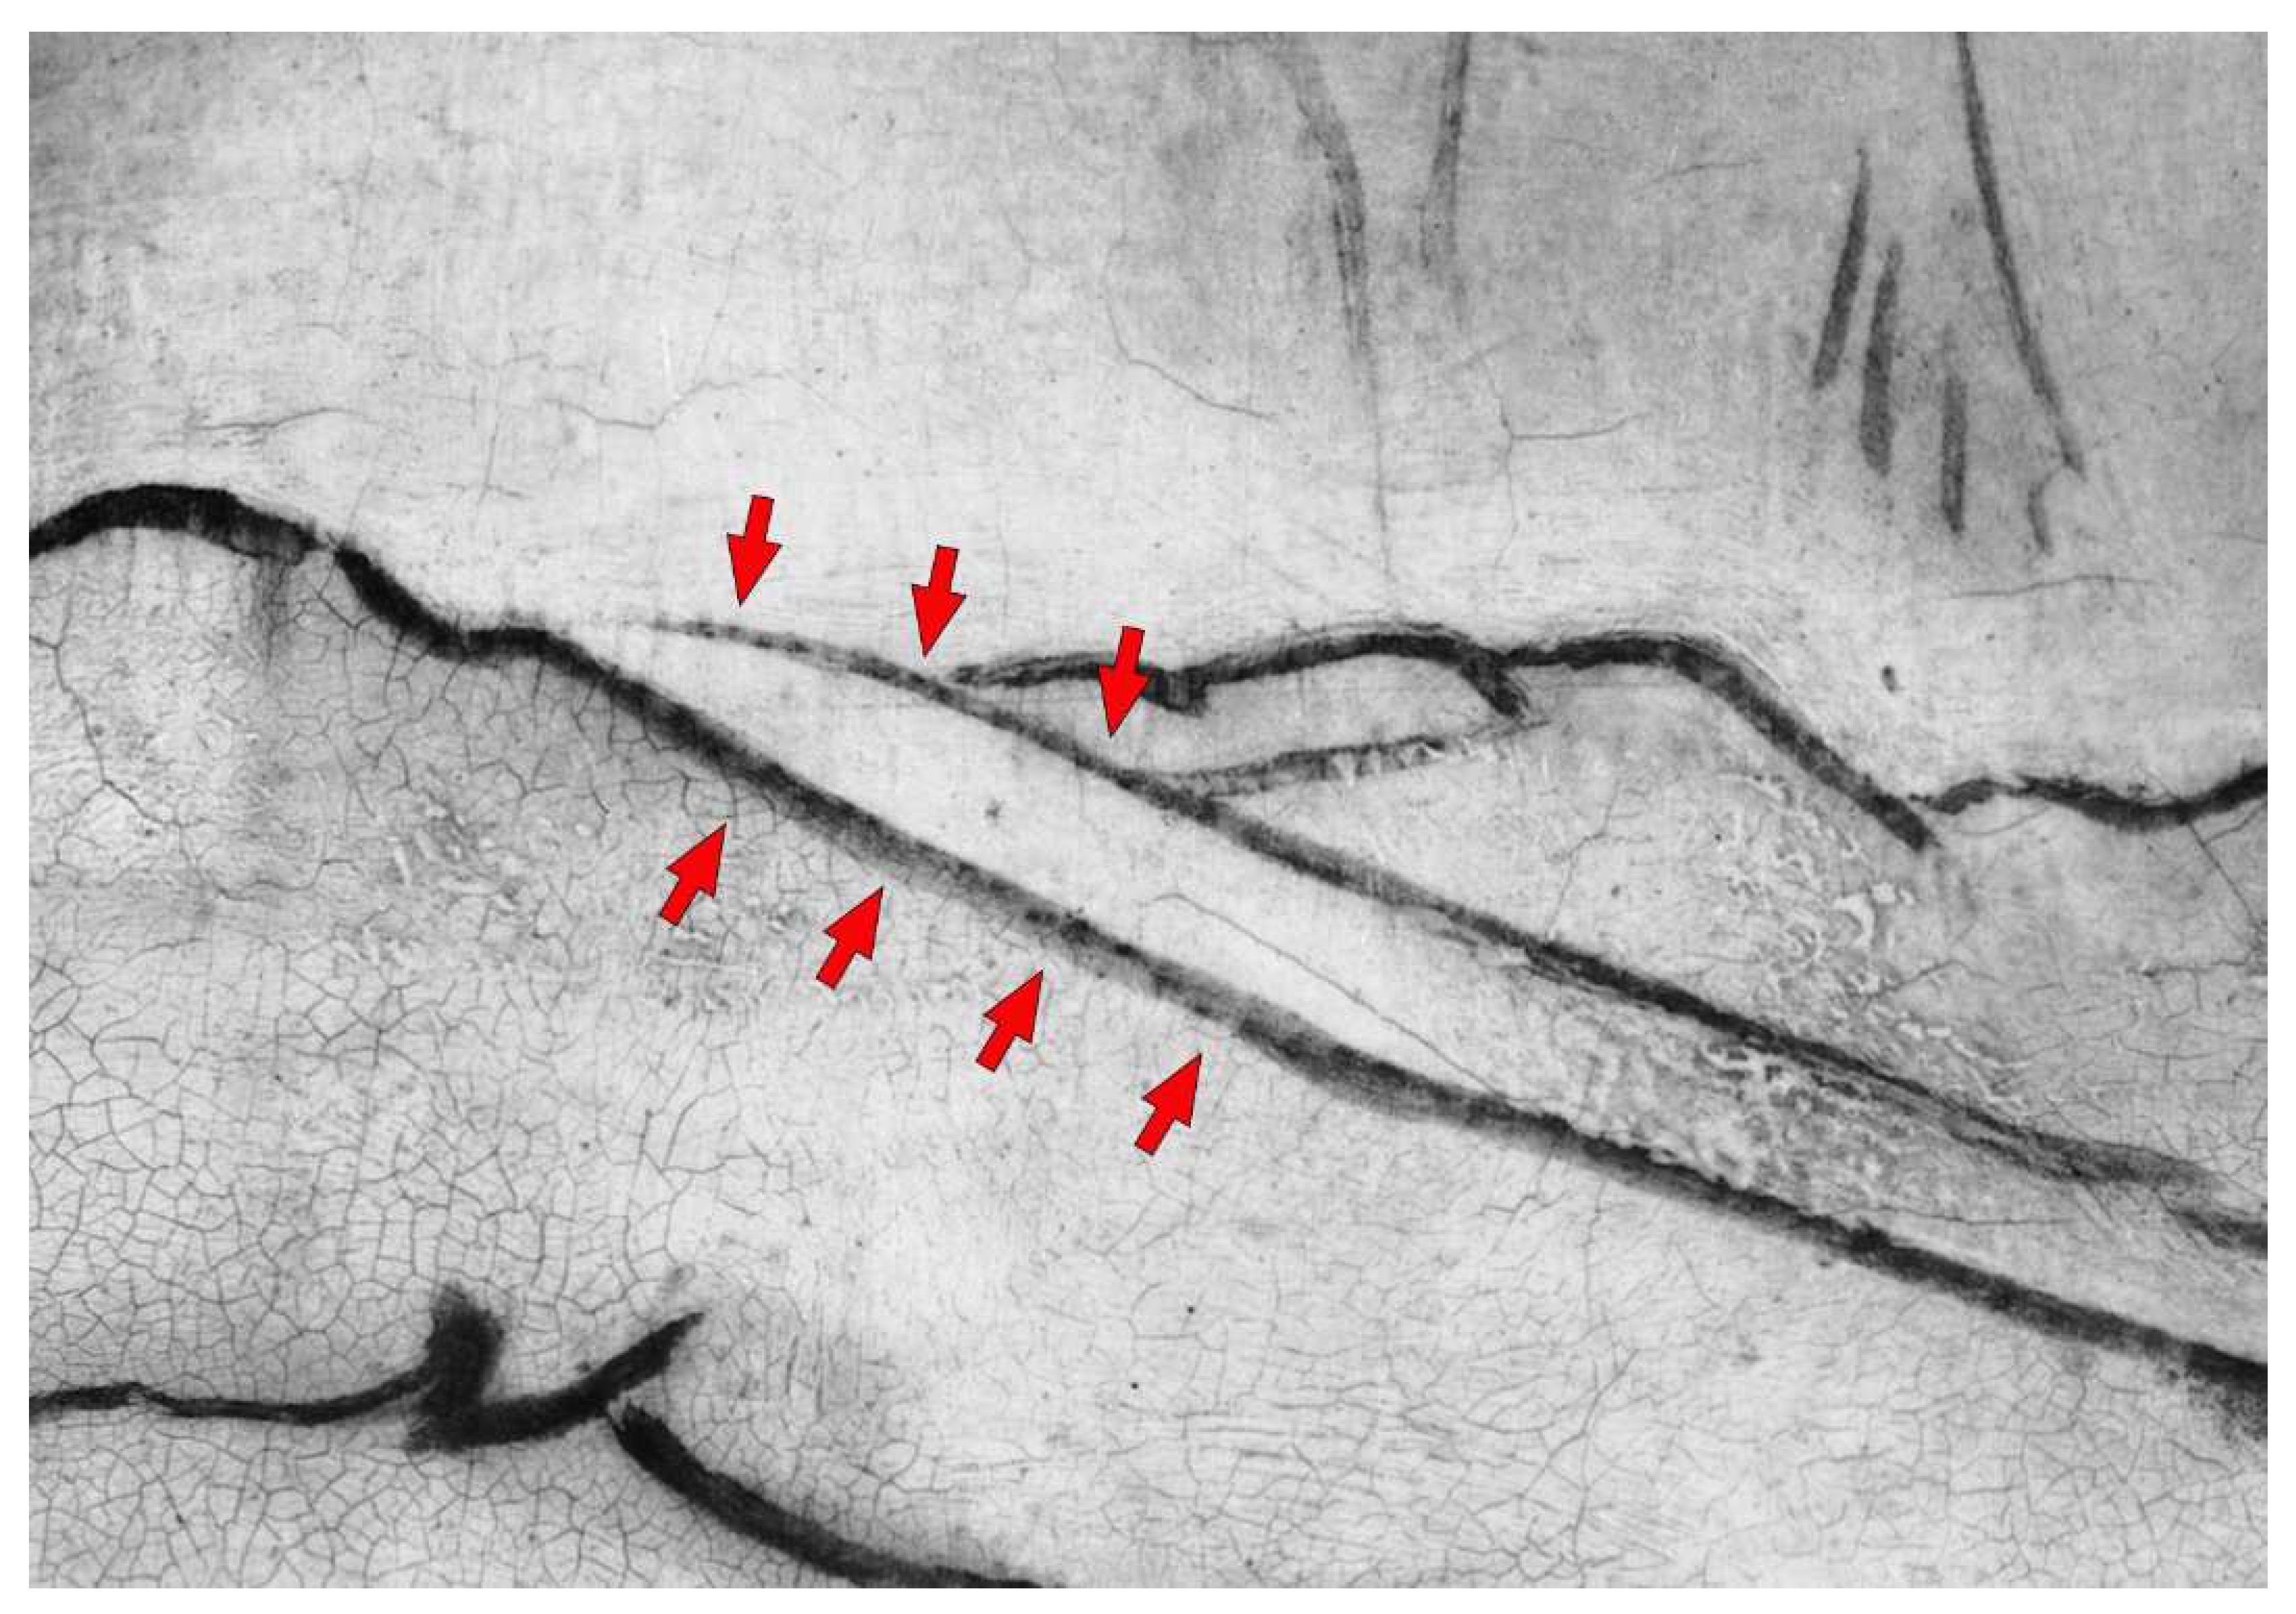
| Underdrawing | Not present in this sample | Not detectable | Visible in correspondence to the previously engraved haloes of the figures. | Limited punched dots and a complete underdrawing made with black ink and brush are visible. |
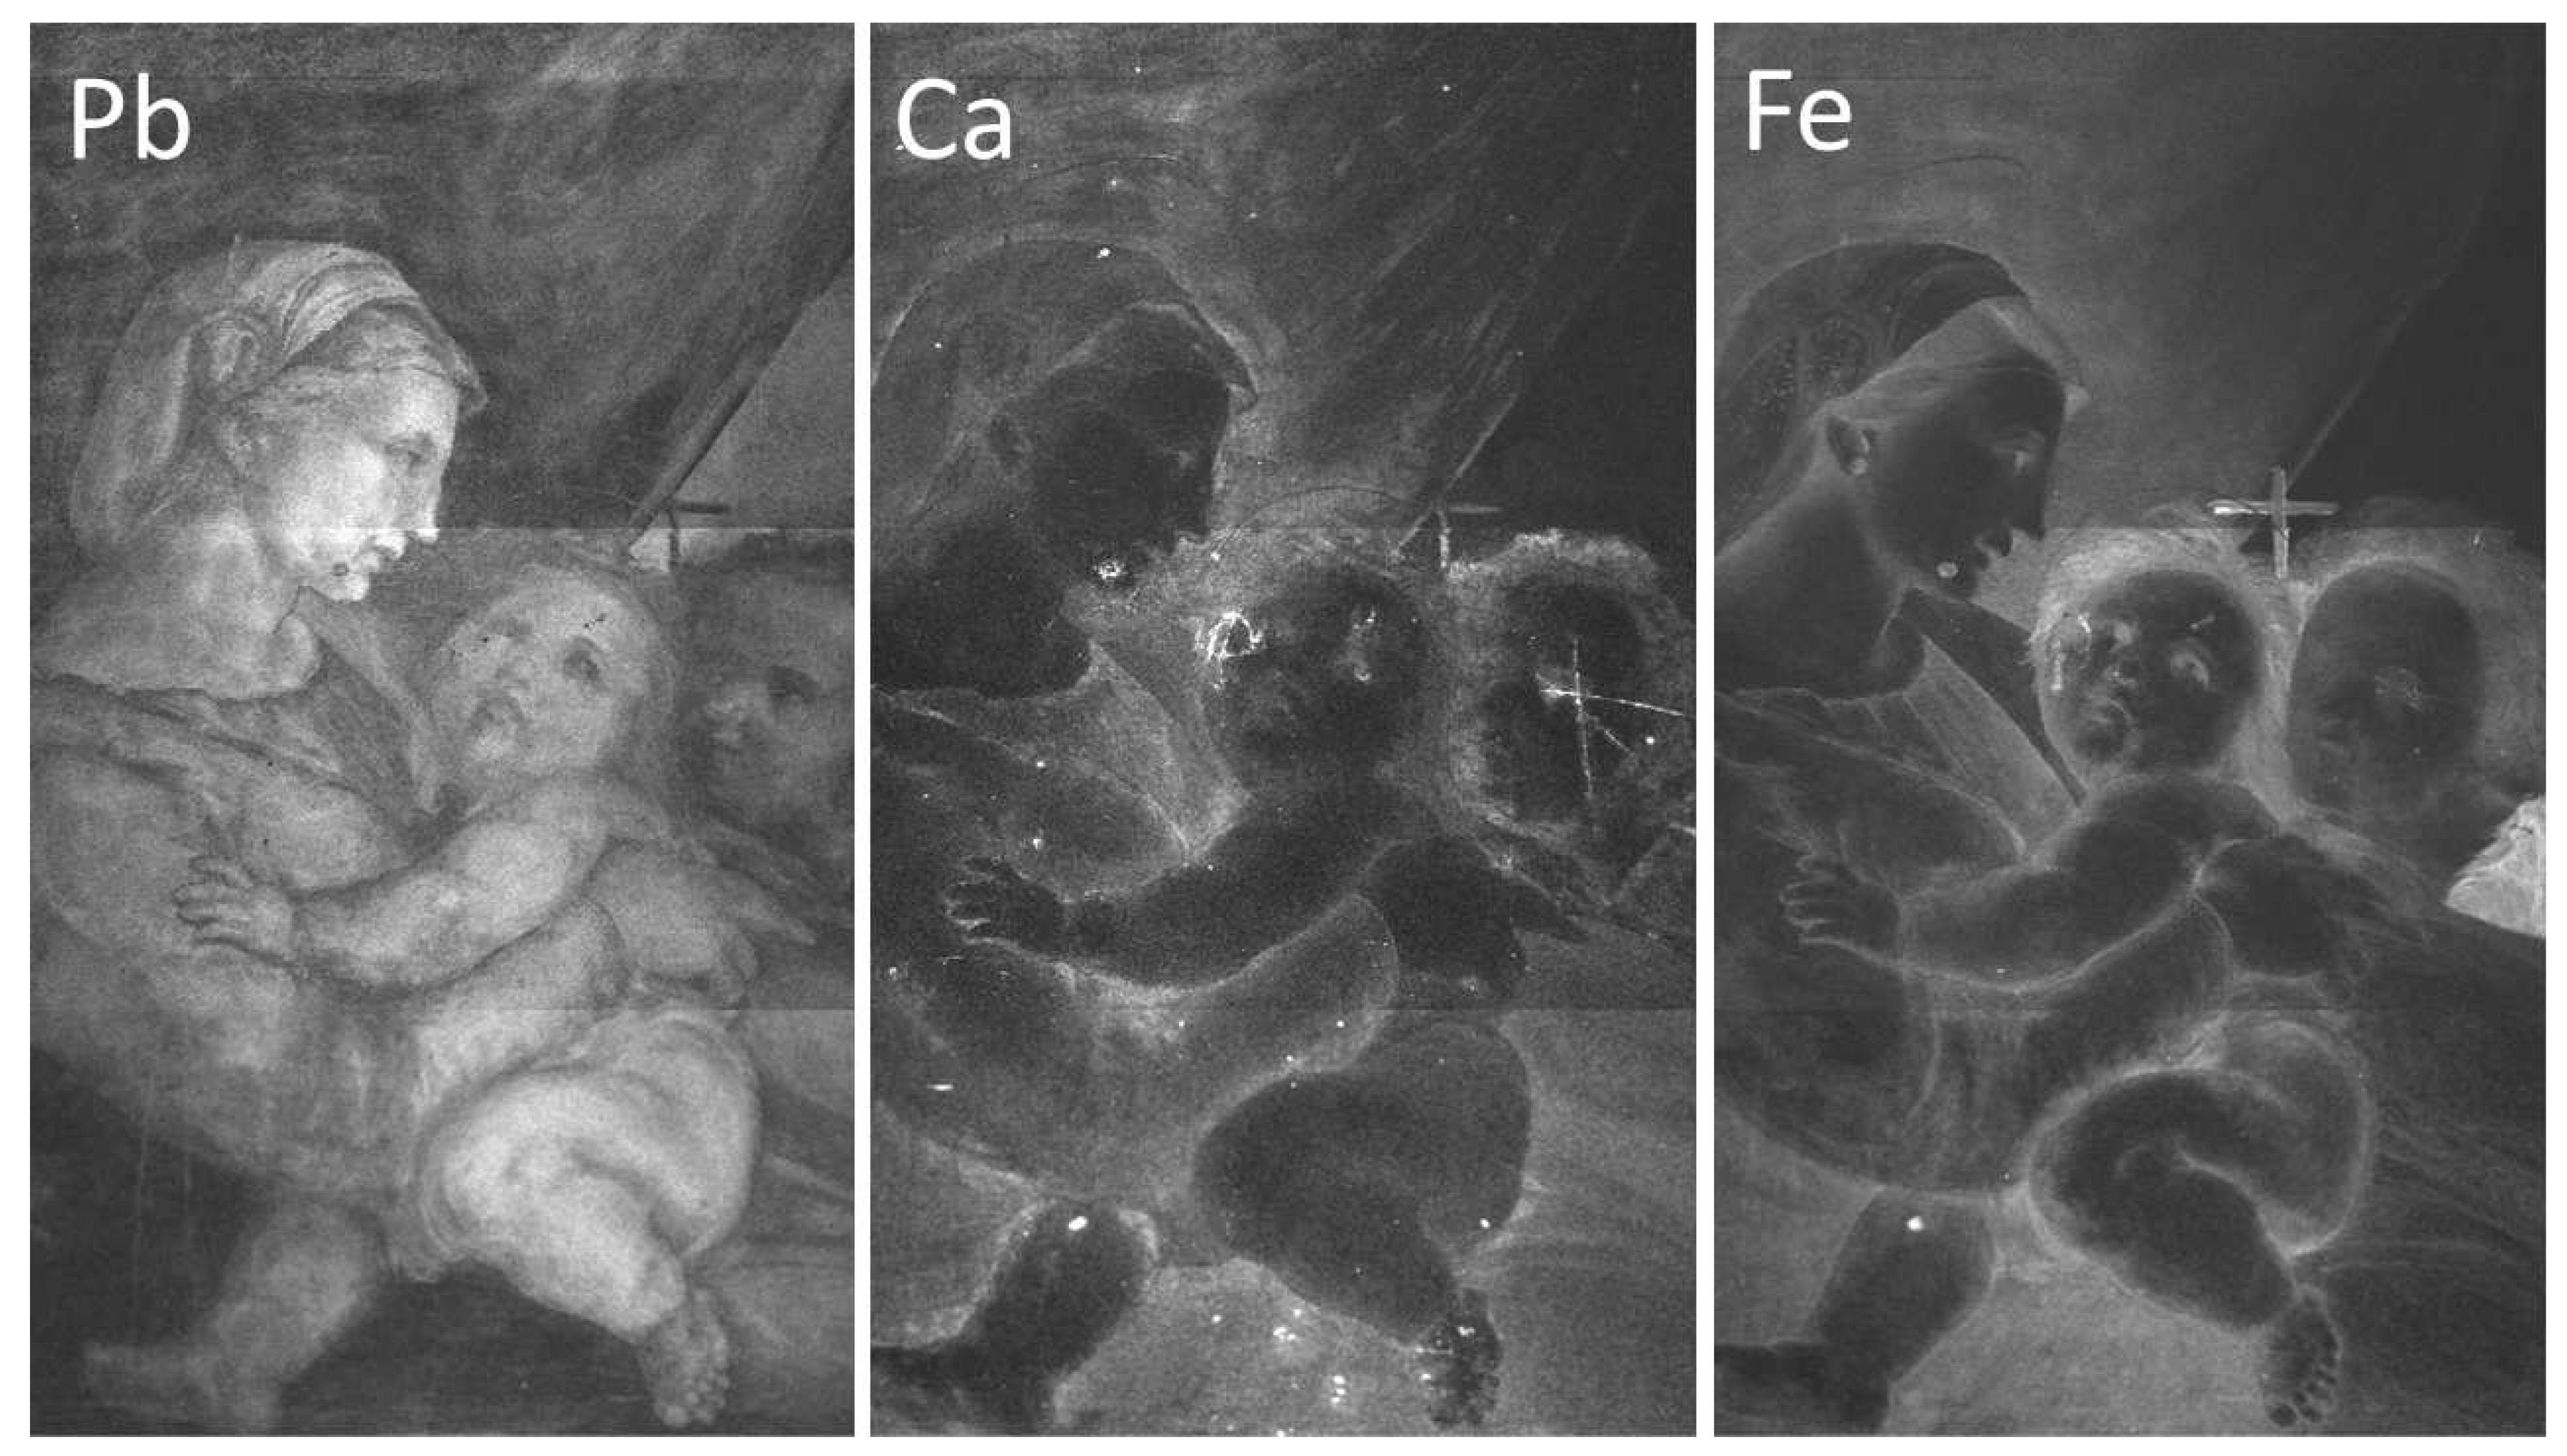
| Engravings | Hardly detectable with this technique; not present in this sample | Evident as a footprint in the Ca-, Pb-, and Fe-distribution maps (more intense signal in the Pb-distribution map; less intense signal in the Ca- and Fe-distribution map). | Visible in correspondence to the figures’ haloes made with a drawing compass. | Not evident |
Publisher’s Note: MDPI stays neutral with regard to jurisdictional claims in published maps and institutional affiliations. |
© 2022 by the authors. Licensee MDPI, Basel, Switzerland. This article is an open access article distributed under the terms and conditions of the Creative Commons Attribution (CC BY) license (https://creativecommons.org/licenses/by/4.0/).
Share and Cite
Cavaleri, T.; Pelosi, C.; Ricci, M.; Laureti, S.; Romano, F.P.; Caliri, C.; Ventura, B.; De Blasi, S.; Gargano, M. IR Reflectography, Pulse-Compression Thermography, MA-XRF, and Radiography: A Full-Thickness Study of a 16th-Century Panel Painting Copy of Raphael. J. Imaging 2022, 8, 150. https://0-doi-org.brum.beds.ac.uk/10.3390/jimaging8060150
Cavaleri T, Pelosi C, Ricci M, Laureti S, Romano FP, Caliri C, Ventura B, De Blasi S, Gargano M. IR Reflectography, Pulse-Compression Thermography, MA-XRF, and Radiography: A Full-Thickness Study of a 16th-Century Panel Painting Copy of Raphael. Journal of Imaging. 2022; 8(6):150. https://0-doi-org.brum.beds.ac.uk/10.3390/jimaging8060150
Chicago/Turabian StyleCavaleri, Tiziana, Claudia Pelosi, Marco Ricci, Stefano Laureti, Francesco Paolo Romano, Claudia Caliri, Bernadette Ventura, Stefania De Blasi, and Marco Gargano. 2022. "IR Reflectography, Pulse-Compression Thermography, MA-XRF, and Radiography: A Full-Thickness Study of a 16th-Century Panel Painting Copy of Raphael" Journal of Imaging 8, no. 6: 150. https://0-doi-org.brum.beds.ac.uk/10.3390/jimaging8060150