Injury Threshold of Oral Contact with Hot Foods and Method for Its Sensory Evaluation


1
Chemisches und Veterinäruntersuchungsamt (CVUA) Karlsruhe, Weissenburger Strasse 3, 76187 Karlsruhe, Germany
2
Retired. Current address: Kastanienweg 50, 53757 Sankt Augustin, Germany
*
Author to whom correspondence should be addressed.
Safety 2018, 4(3), 38; https://0-doi-org.brum.beds.ac.uk/10.3390/safety4030038
Submission received: 9 August 2018
/
Revised: 4 September 2018
/
Accepted: 5 September 2018
/
Published: 6 September 2018
Abstract
:Epidemiological studies indicate an increased risk of esophageal cancer from the consumption of very hot foods and beverages. The contact time and the contact temperature are decisive for the risk of injury. However, measuring the contact temperature is not easy in practice. In the present study, a numerical simulation based on the solution of the heat conduction equation was initially used to investigate whether and for what period of time a constant contact temperature is to be expected under oral conditions. For small food samples (e.g., cooked potatoes) in contact with the tongue, the simulation results in constant contact temperatures of up to 10 s before cooling depending on thickness. Hot beverages, which spread as a thin film and thereby increase their surface area, can therefore be consumed at higher temperatures than solid foods. Furthermore, orientating measurements with a “measuring spoon” determined the contact temperature of 46.5 °C considered to be just comfortable for any period >10 s and about 48 °C for periods of less than 10 s The course of the contact temperatures determined in the experiment over time allows the corresponding threshold values of consumption temperatures for various hot foods to be calculated. In view of the fact that the contact temperature is obviously the determining factor for the risk of injury from burns in the oral cavity in addition to the contact time, it makes sense to reference threshold values to the contact temperature rather than to the surface or consumption temperature of a food product, which is current customary practice. If this contact temperature is defined as a threshold value, the surface or consumption temperature for any other food can be calculated.
1. Introduction
To assess the risk of injury of human skin from contacting hot surfaces, there is a relatively extensive literature [1,2,3,4,5,6,7,8,9,10] and thresholds have been specified in standards and guidelines [11,12]. On the other hand, the risk of injury to the oral mucosa from hot foodstuffs has been little studied. Only very hot beverages were classified by the World Health Organization’s (WHO) International Agency for Research on Cancer (IARC) as “possibly carcinogenic for humans” (group 2A) [13,14] based on sufficient findings in animal experiments [15,16,17] taking into account limited epidemiological data indicating an increased risk of esophageal cancer [18]. The IARC recommends a temperature of 65 °C as a threshold value for very hot beverages [13,14]. Compared to beverages, significantly fewer studies on hot solid foods are available, with the few that exist also showing a connection between the consumption of very hot grilled or fried foods and an increased risk of esophageal cancer [19,20].
For skin contact with hot media, the following physical influencing variables are decisive criteria for the risk of injury: contact temperature, duration of contact, material and type of surface [21]. Beginning with the starting time of the contact between two solid bodies of different but constant temperatures, both bodies have the same temperature in the contact surface, which remains constant for some time, called contact temperature. Physically, it is clearly defined by the starting temperatures of the hot and cold bodies as well as the thermal conductivities, specific densities and specific heat capacities of both bodies, provided that they are “semi-infinite” bodies.
In practice, it is not easy to measure the contact temperature in the case of skin contact with a hot surface. Instead, according to ISO 13732 [12], only the surface temperatures of the hot bodies that cause burns on contact with the skin are to be measured and are defined as injury thresholds for various degrees of skin damage determined in animal experiments. The evaluation procedures developed on this basis for the contact of human skin with hot surfaces, as described e.g., by Siekmann [7], cannot be transferred to the contact of hot food with the oral mucosa. The main difference between the contact of hot food and hot surfaces with human skin or mucous membrane is that the hot food is only ingested in small portions in the mouth, which quickly cool down due to the breathing air. The condition “semi-infinite body” is thus in no way fulfilled. It was, therefore, necessary to check whether a constant contact temperature might occur at all under these conditions and for what period of time. Direct temperature measurement is out of the question under oral conditions. Another problem is that the contact temperature in reality remains constant for only a few seconds, and then drops very quickly because heat is also released from the hot medium into the environment during the contact and is dissipated through the skin.
Therefore, a numerical simulation method was developed, which is based on a one-dimensional solution of the heat conduction equation and allows different boundary conditions (with or without simultaneous heat transfer to the environment outside the contact point). The simulation results for hot solid foods clearly show that a constant contact temperature still exists for about 10 s in samples with a thickness of 2.5 mm and, thus, represents the decisive factor for the sensation of pain in the mucous membrane and for the risk of injury when eating hot solid foods. However, the contact temperature only occurs directly in the contact surface and the simulation results can be used to estimate that measurement is only possible with sensors thinner than 0.1 mm.
A device for measuring the contact temperature with the designation thermestesiometer was developed in 1974 in the USA by Marzetta [1,4]. The measuring head consists of a silicone rubber which has similar thermal properties to human skin. For the measurement, it is heated to 33 °C and placed on the hot surface to be examined. The contact temperature is then measured with a thermocouple which, according to Marzetta, is 0.1 mm below the surface of the measuring head. Siekmann [7] stated that the thermocouple actually is 0.2 mm below the surface and a “small” mathematical correction is necessary to correct the resulting error. Whether the instrument is also suitable for measuring the contact temperature of small samples of food under oral conditions seems questionable and has not yet been demonstrated.
Therefore, a simple, newly developed technique was used to test whether the difficult direct measurement of the contact temperature can be replaced by reproducibly determining sample temperatures that are perceived as pleasant or tolerable for a limited time by the sensory sensation of the tongue. Orienting measurements showed that this is possible. With the test results obtained, the course of the threshold value of the contact temperature over the contact time can be approximated by an exponential function. With this function the consumption temperatures of any solid food with known substance values can be calculated from the contact temperature.
2. Materials and Methods
2.1. Numerical Simulation
The contact temperature TK can be calculated with the following formula derived from a heat balance [21,22]:
With: λ1,2: Thermal conductivity; ρ1,2: Specific density; c1,2: Specific heat; T1: Temperature of the hot body; T2: Temperature of the cold body.
This formula applies to “semi-infinite bodies”. In reality, the contact temperature remains constant only until the temperature fronts propagating from the contact surface in the bodies meet the outer surface or edge areas. Here, cooling takes place by heat dissipation to the environment. The smaller the hot body, the shorter the time of constant contact temperature.
Dissolved after the starting temperature of the warmer body, the following equation results:
Equation (2) can be used to calculate the starting temperature T1 of the hot body if T2 and TK are given.
After long contact times, the adiabatic mixing temperature TM is set, provided that both bodies do not exchange heat with the environment. If the bodies have the masses m1 and m2, TM is:
This formula is known as Richmann’s mixing rule [23]. The formula directly derives from the first law of thermodynamics [24]. If both bodies are made of the same material, the contact temperature is equal to the adiabatic mixing temperature and remains constant until the temperature is completely equalized, provided that no heat is exchanged with the environment.
For the numerical simulation of the temperature field as a function of time and location, both contacting solids are divided each into 13 layers of differentially small thickness parallel to the contact surface. For more detailed depth studies, a larger number of layers would be needed. The limitation to 13 was necessary to reduce the numerical effort and calculation times. The number of time steps was also limited to 2,000 for the same reason. For parameter studies with the material systems of interest here, it proved to be sufficient. For metallic systems, the calculation program had to be extended to 10,000 time steps.
For each layer, energy balances are established, which also form the basis of the heat conduction equation in its general form [25]. The difference between the amounts of heat supplied and dissipated due to temperature gradients leads to temperature changes in the layers, which are calculated in very small successive time steps. As a result, the progression of the temperature profiles over time and over the distance x from the contact surface is calculated. Different boundary conditions (with or without convective heat transfer or radiation to the environment outside the contact area) can be implemented. The calculations were conducted with Excel 2016 V. 16.0.10325 (Microsoft, Redmond, WA, USA). The calculation sheet is available as Supplementary Material S1 (English version) and S2 (German version). Because thermal data for the mucous membrane (or other surfaces inside the oral cavity) were unavailable, skin data were used for the calculations.
2.2. Sensory Analysis and Evaluation
The contact temperature cannot be measured directly as explained above. However, it seems possible to measure the following quantities:
- The temperature T0 perceived as pleasant/tolerable for any period of time t∞ > 10 s.
- The temperatures T(t), which are regarded as barely bearable for a limited time t of 3 to 10 s. The time until the contact is broken off is measured, which systematically decreases with increasing temperature.
A hot, circular sample with a thickness of 8 mm was placed on the tongue for an initial investigation into the development of the method. The tongue was chosen as the most thermal sensitive oral area [26]. Polyvinyl chloride (PVC) was chosen as the sample material. Materials such as glass or ceramics would have been preferable because their properties are closer to those of human skin, but are more difficult to manufacture. Test persons hold the sample with a “measuring spoon” in their hands and put it on their tongues so that the contact can be stopped immediately at any time. The time is measured by a microswitch in the handle closing an electrical circuit when a force is applied to the sample.
The construction of a “measuring spoon” equipped with thermocouples is shown schematically in Figure 1. The thermocouples are used to control the sample temperature, but may not be necessary if a control appears to be dispensable. The sample is surrounded with polystyrene foam outside the contact surface in order to keep marginal influences to a minimum. A sufficient number of measuring spoons with the desired temperatures are provided in small heating cabinets for carrying out experiments with test persons.
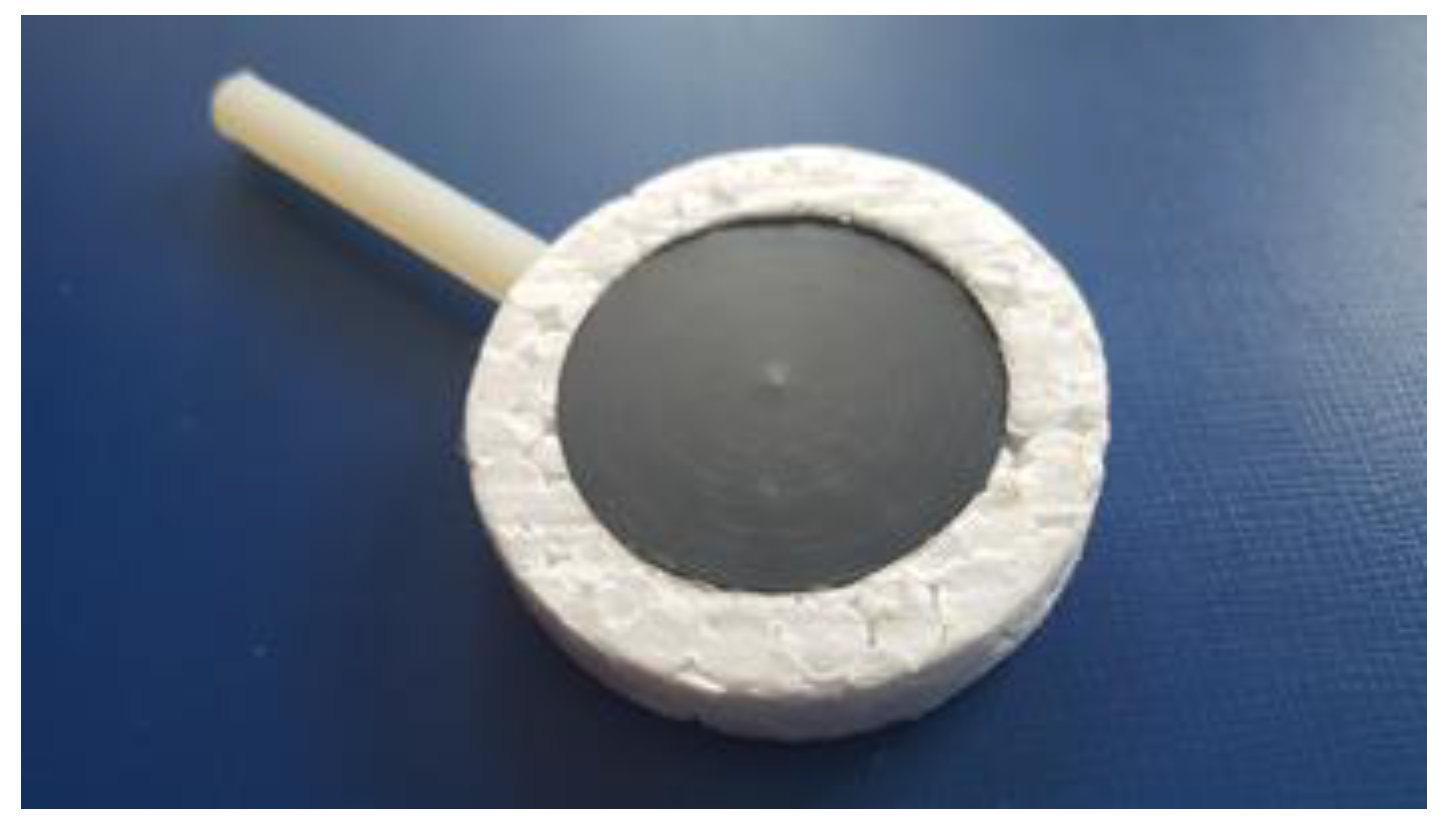
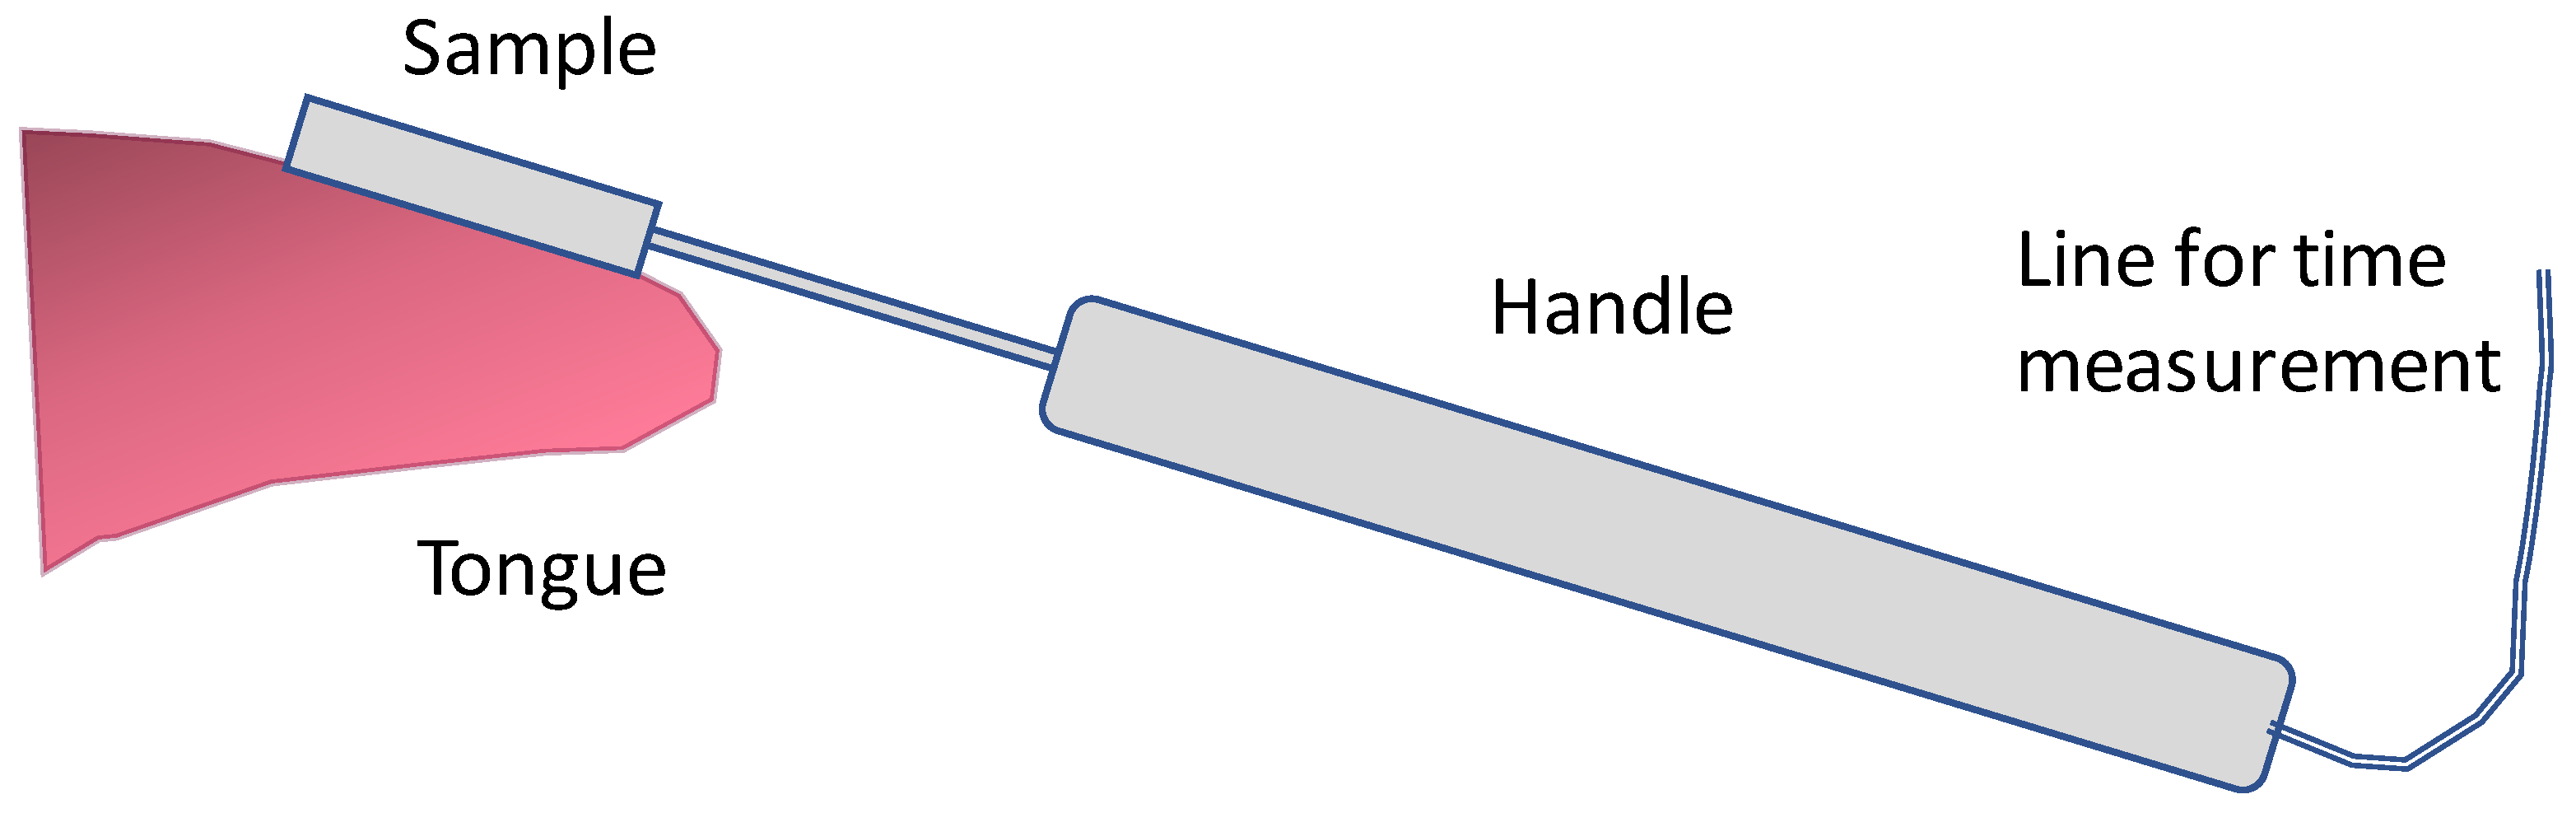
A photo of a PVC sample with sample holder and polystyrene foam shell is shown in Figure 2. This configuration is thermostated in the heating cabinet. Before sensory analysis, the sample holder is inserted as quickly as possible in the receiving adapter on the handle. The drillings for inserting the thermocouples and the fixing screws can be seen in Figure 3. Finally, Figure 4 shows schematically the application of the measuring spoon on the tongue.
Starting from small values, the contact temperature of the PVC-sample is increased in steps of 1 °C. The respective starting temperature to which the sample must be heated in order to reach the desired contact temperature is calculated with Equation (2). For example, the calculation shows a starting temperature of 73.3 °C for PVC at the desired contact temperature of 46 °C.
This relationship is shown graphically in Figure 5. The blue line applies to PVC. For comparison, the calculated consumption temperatures for potatoes (orange) and water (grey) are also provided. The exact numerical values for the contact temperature 55 °C are given. The consumption temperatures of potatoes and water differ only slightly due to the considerable water content of potatoes. Potatoes were found to be particularly suitable because the samples are easy to produce and do not denature when heated. The sample surface may also be covered with a cling film for hygienic reasons, if necessary, which has no influence on the temperature profile (data not shown). Some other sample types may not be adequate to test by the device. E.g., cheese melts when heated and becomes disgusting. Galantine also melts. This influences the cooling curve by latent heat. Even water may be examined; however, leak problems occurred between sample holder and cling film as well as air bubbles.
3. Results
3.1. Simulation Results
To calculate the contact problem of food with human mucosa, 2,000 time steps are sufficient for convergence. For metallic contact partners, 10,000 time steps are necessary. If the time steps are too large, the procedure implemented in Excel becomes unstable, i.e., chaotic oscillations and no stable results occur.
The simulation method was tested on the following special case for which an exact analytical solution exists [27]: a hot body with a constant surface temperature is brought into contact with a cold body whose temperature increases with contact until it reaches the temperature of the hot body. The analytically exactly calculated temperature profiles over time and place (Gaussian error functions) correspond well with the numerically calculated profiles. Furthermore, the simulation provides values of the contact temperature and adiabatic mixing temperature according to Richmann’s mixing rule, which correspond exactly to the analytically calculated values.
Figure 6 shows temperature profiles for the same times t from 0.25 s to 10 s above the location coordinate x. The contact area is x = 0 and is dashed. A cylindrical sample of 2.5 mm thickness consisting of boiled potatoes in contact with a geometrically equal control volume of human skin at 35 °C was used as a basis.
In the simulation, a heat transfer between the free surface of the sample with aspirated breathing air (20 °C) was considered. The heat transfer coefficient was estimated at 20 W/(m2∙K). In addition, a heat transfer between the control volume of the skin and the surrounding tissue with an estimated heat transfer coefficient of 300 W/(m2∙K) was assumed. The contact temperature is 54.5 °C and is shown as a horizontal, dashed blue line. As can be seen, the temperature profiles displayed in different colours intersect for the same times and the dotted line for the contact temperature at the contact point at x = 0 in one point. This means that the contact temperature at this point is almost constant over a period of 10 s. Figure 7 shows the temperature profiles over a longer period from 2.5 to 100 s.
The temperature profiles have already dropped below the starting temperatures of 70 °C or 35 °C from 5 s (yellow curve) due to the external heat transfer. The effect grows with increasing time, and the temperature in the contact surface has already dropped to about 42 °C after 100 s, as the brown curve shows.
The heat transfer coefficients mentioned are empirical values. For gases in free convection, they are between 3 and 30 W/(m2∙K) [28]. Increasing the heat transfer coefficient between the free surface of the sample and the respiratory air to fictitious values up to 50 W/(m2∙K) leads to faster cooling of the edge areas, the temperature profiles in the contact zone around x = 0 remain unchanged over a period of up to 10 s. According to Log [29], the heat transfer coefficient between the food sample and air was estimated to be 10 W/(m²∙K). During short periods an increase of the heat transfer coefficient between the control volume and the surrounding skin tissue up to fictious values of 3000 W/(m2∙K) has only a very small influence. The reason for this is that the control volume and the surrounding tissue have the same temperature at the start of the contact, so that no heat flow takes place for a short time. Therefore, it can be assumed that even the blood circulation in the tongue tissue for short times up to 10 s has no appreciable influence on the temperature field in the contact zone. The temperature difference between the sample surface and the 20 °C assumed temperature of the breathing air is much larger, so that there is a stronger effect here. The assumed numerical values of the heat transfer coefficients therefore suffice for a realistic estimation of the duration of a constant contact temperature. It was not the goal of the considerations to map all the details of the temperature field as accurately as possible. However, the thickness of the samples has a big influence on the duration of the contact temperature. A relatively small thickness of 2.5 mm was deliberately used to show the effect. Larger thicknesses of the samples lead to longer periods of constant contact temperature.
Figure 8 shows the time course of the temperature profiles for the same configuration as shown in Figure 6 and Figure 7. The temperature profiles marked by different colours are valid for constant distances x from the contact surface at x = 0. The calculated contact temperature (54.5 °C) is entered as a dotted blue curve. The temperature profiles of the sample lie in the higher range of high temperatures with distances of −0.1 mm to −2.5 mm. Below are the temperature profiles in corresponding layers of the skin marked with positive x values. The black curve for x = 0 coincides with the dotted blue horizontal lines for the contact temperature for a period of up to about 10 s; as time increases further, it deviates from this as expected due to the cooling of the sample in the direction of lower temperatures.
As can be seen, the constant contact temperature only occurs directly in the contact surface at x = 0. The bright red curves for x = ±0.1 mm are still about ±2 °C away from the contact temperature or the temperature at x = 0 after about 2 s. This means that the contact temperature can only be measured with sensors that are significantly smaller than 0.1 mm.
The simulation results for food clearly show that a constant contact temperature exists for about 10 s and thus represents the decisive factor for the sensation of pain in the mucous membrane and for the risk of injury when eating hot solid foods.
3.2. Initial Measurement Results
The results of the orienting measurements (test person: second author W.L.) are summarized in Table 1. Measurement 1 was repeated several times beginning with a start temperature of 66.3 °C or a contact temperature of 44 °C until a contact temperature T0 of 46.5 °C over a period of more than 10 s proved to be well tolerated. Furthermore, several measurements were carried out at contact temperatures of 47 °C, 48 °C and 49 °C. The measurement times until abortion of the tests after exceeding the tolerance threshold are listed in Table 1. As expected, the times vary greatly, possibly also due to inhomogeneities of the temperature field in the PVC samples. For further field tests, the temperature should be limited to 48 °C in order to exclude any risk of injury. For this reason, the threshold temperature T2 cannot be determined for very small times t → 0. It is estimated at T2 = 55 °C. Ref. [7] indicates the maximum threshold temperature at 1 s contact time for Pertinax at 95 °C. This corresponds to a contact temperature of approximately 54 °C. With the estimated value 55 °C for t = 0, this value is deliberately not exceeded for safety reasons. More detailed information require further investigation.
The value pairs compiled in the table are shown in Figure 9 as square points. To describe the functional relationship between the measured contact time t and contact temperature T(t), an exponential function of the following form is proposed:
T(t) = a ∙ exp(k∙t) + T0
The constant T0 of the Equation (4) stands for the contact temperature, which is perceived as still tolerable over a longer period of time. It forms the horizontal tangent of the function for t → ∞, is directly determined by measurement 1 (see Table 1), and represents the horizontal tangent of the exponential curve for long times (dashed red line in Figure 9). At time t = 0, T2 is estimated as described. The constants k and a can be calculated from (t = 0, T2) and only one further pair of values (t1, T1) as follows:
k = ln((T2 − T0)/(T1 − T0))/(t2 − t1) and a = (T1 − T0)/exp(k ∙ t1)
The value pairs used to calculate the constants k (<0) and a as grid points are circled in red and the course of the function is shown as a solid blue curve. The green dashed curve represents the average of all functions approximated with the measured values. For comparison, the contact temperature 52.9 °C calculated from the threshold value for hot beverages 65 °C at t = 0 is entered and marked as a grey circle. It is significantly higher than the measured value T0 = 46.5 °C for solid foods.
The results of this pilot investigation show that the procedure described is practicable. It needs to be validated by examinations with as large a group of test persons as possible.
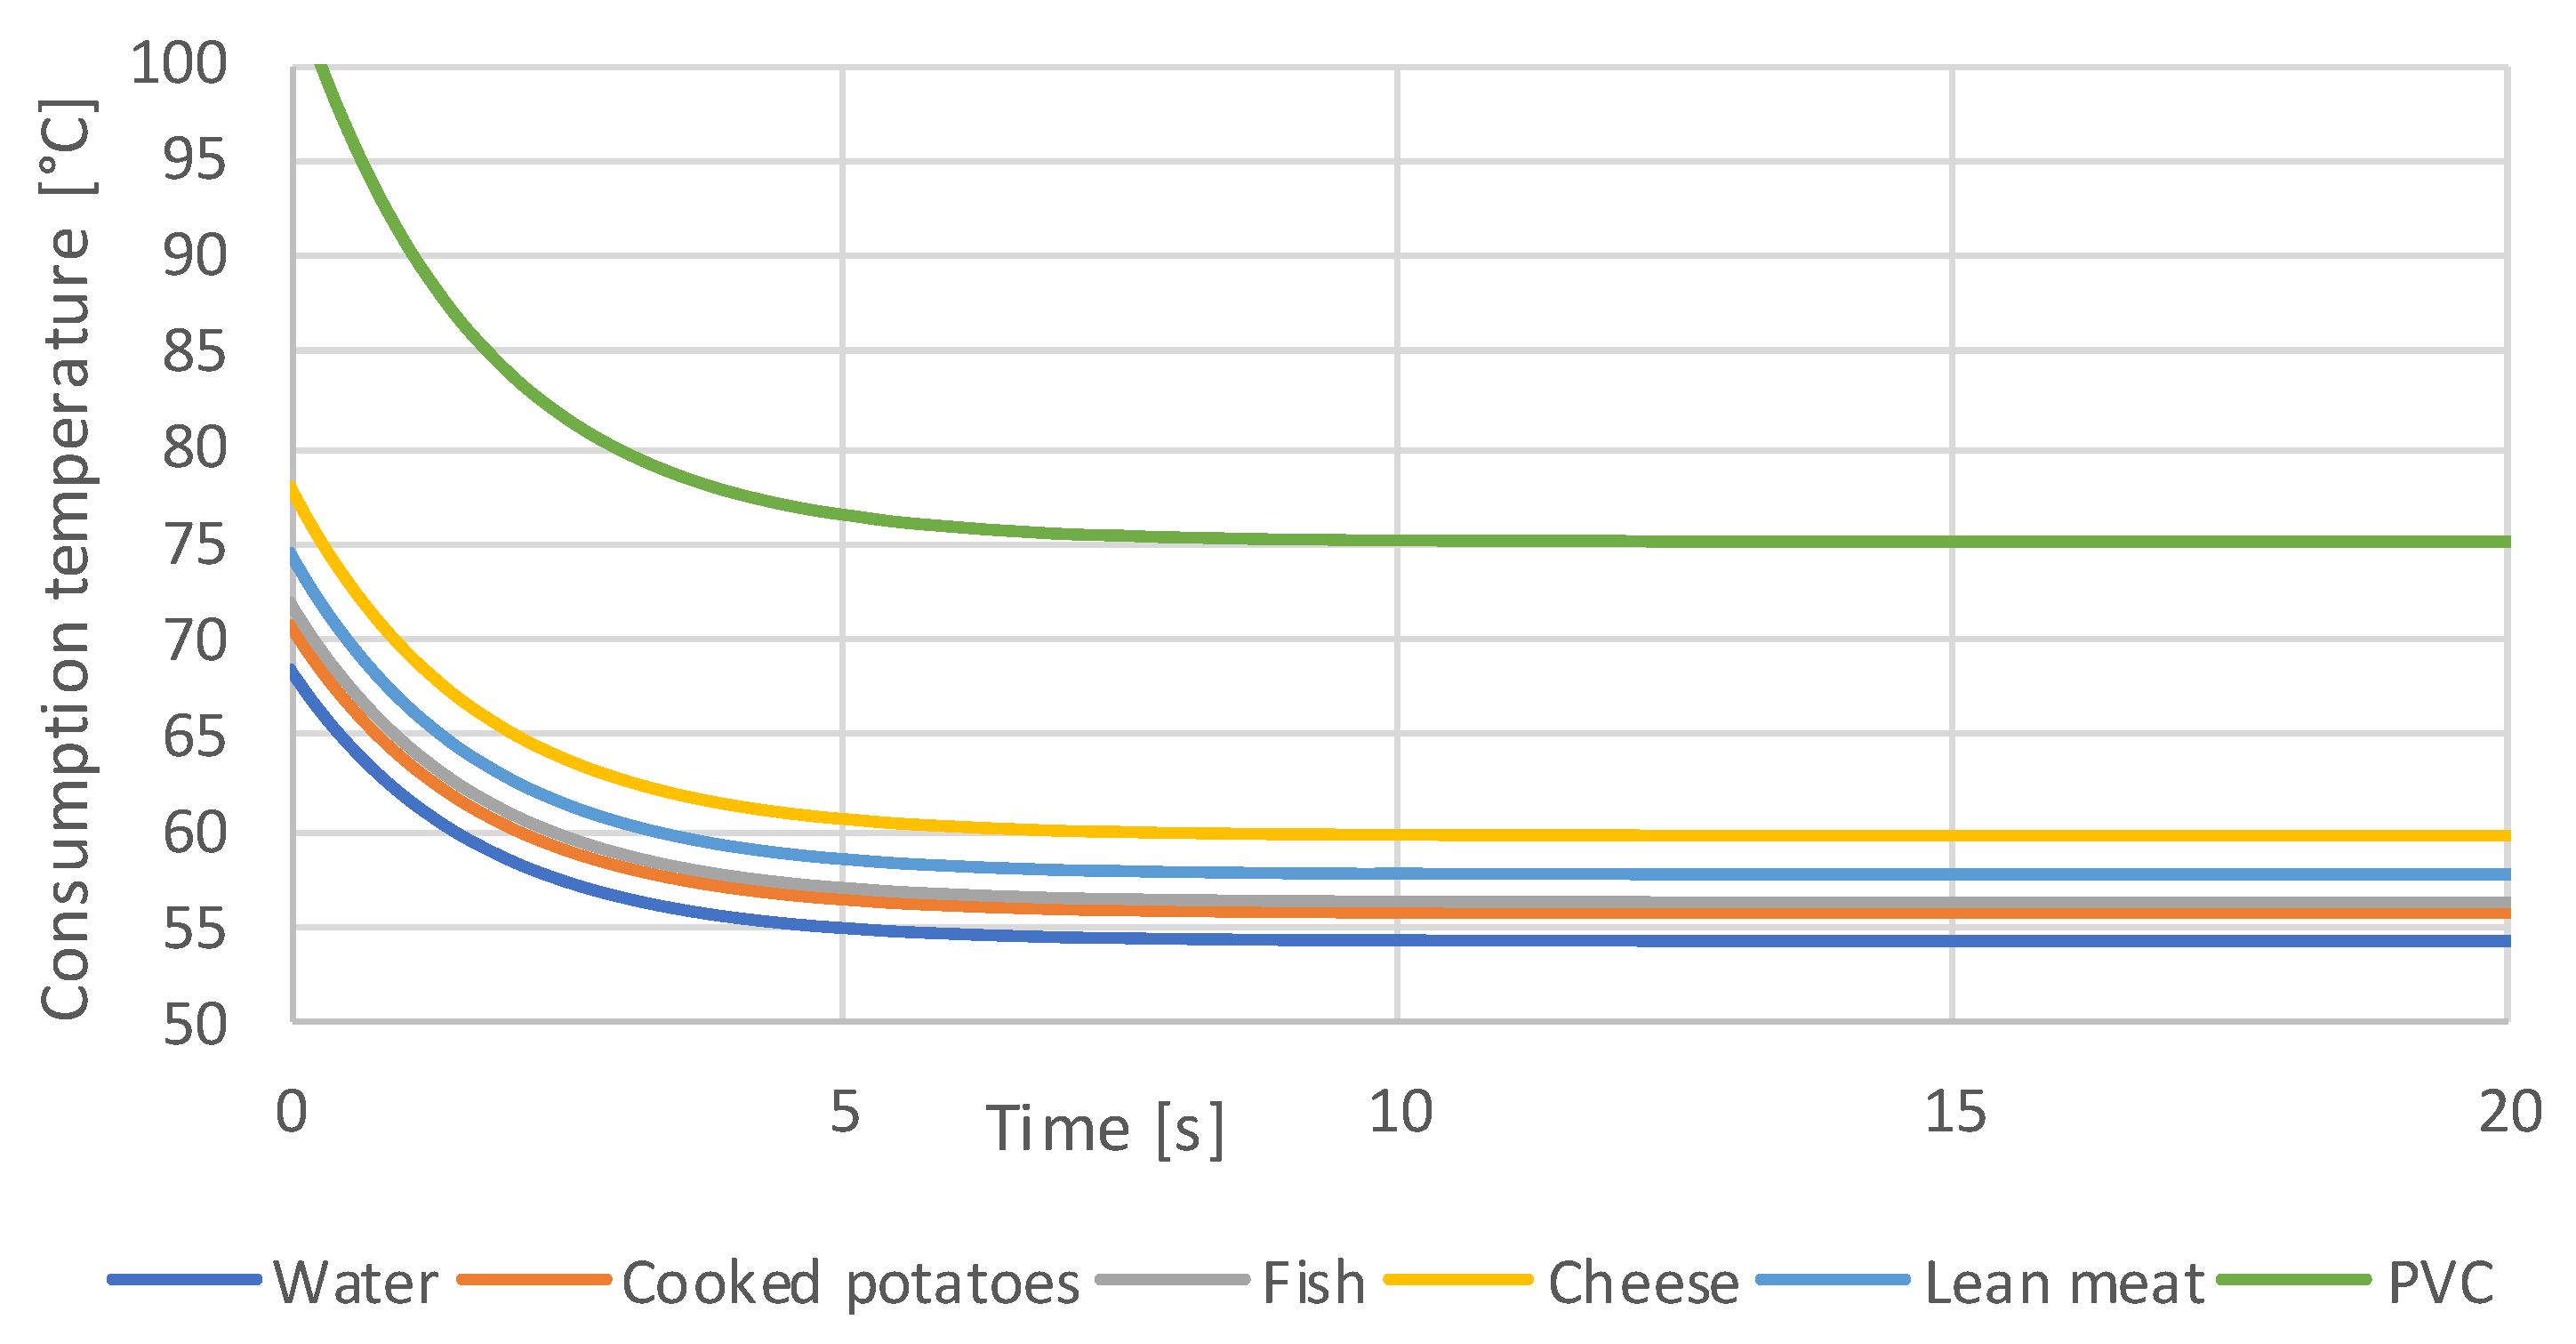
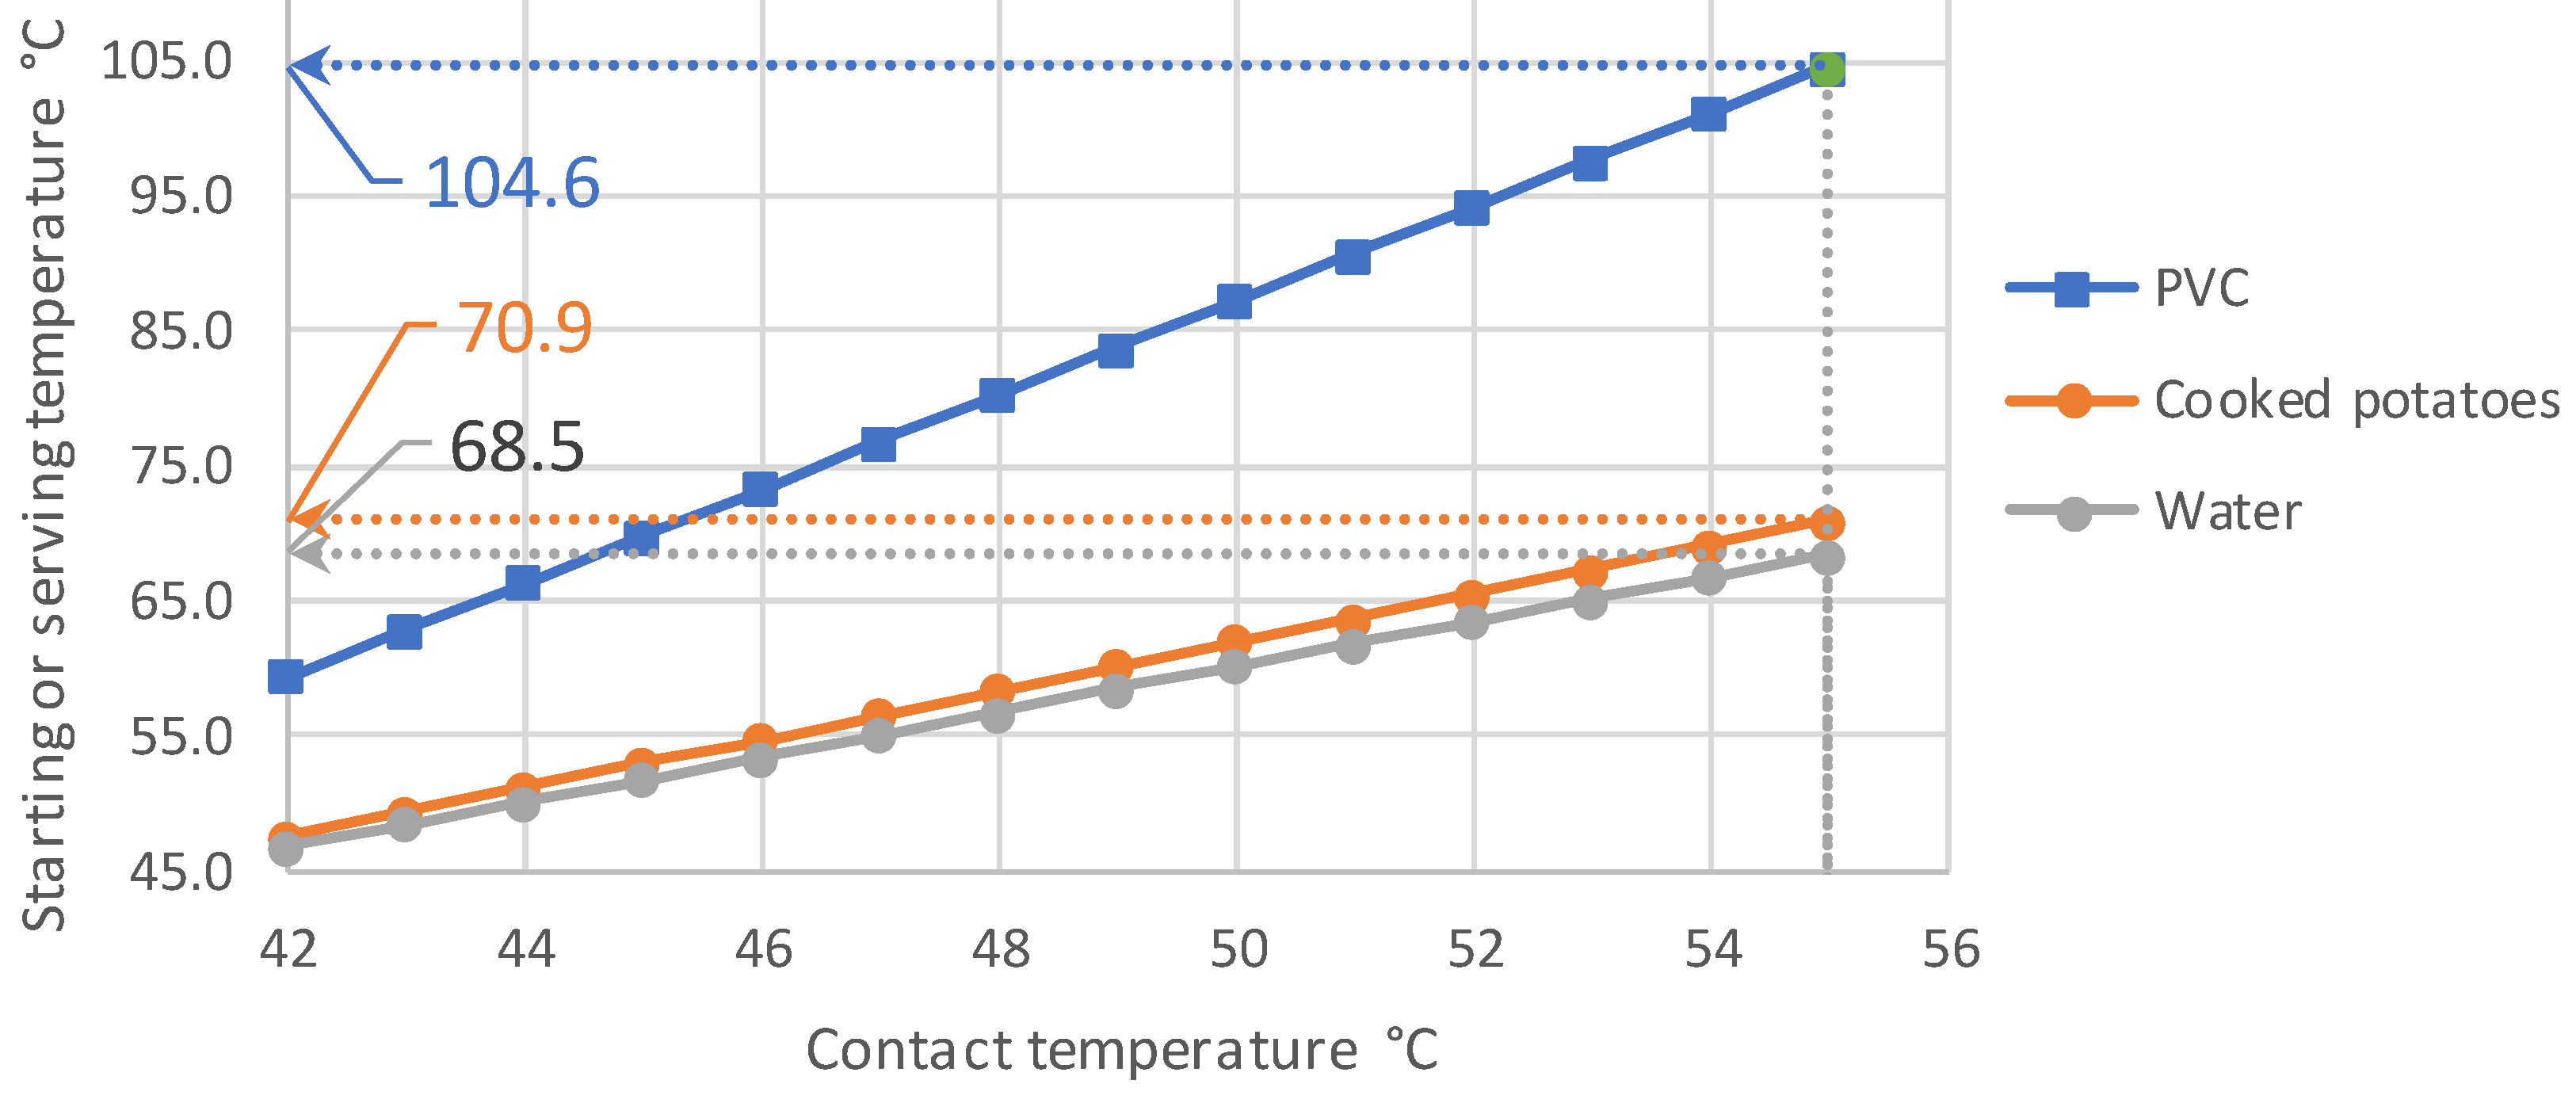
With this function for the contact temperature, the start temperature, i.e., the consumption temperature, can be calculated for any solid food with known substance data, see Figure 10. A sample of PVC or other suitable material is sufficient.
4. Discussion
The simulation method corresponds to the exact analytical calculation for the special case of a hot body with constant temperature [27] and also provides the correct values of the contact temperatures. For very long contact times (without heat exchange with the environment, i.e., for adiabatic conditions) it supplies the exact mixing temperatures according to Richmann’s mixing rule [22].
The thermodynamic simulation of the contact of the oral mucosa with a hot sample leads to three essential findings:
- A constant contact temperature only occurs directly in the contact surface. Even at a distance of ±0.1 mm, deviations of about ±2 °C occur for times up to 2 s. Therefore, the contact temperature could only be measured with sensors much smaller than 0.1 mm, which are not commercially available.
- The contact temperature remains constant for about 10 s in the samples examined, which are only 2.5 mm thick, and only decreases continuously afterwards. Thus, the contact temperature represents the essential parameter for assessing the risk of injury.
- Orienting experiments indicate that it is possible to define a generalizable threshold value for the contact temperature as a function of the contact time of hot foods, with which the consumption temperatures of any food can be calculated. A transfer to hot drinks is not easily possible and requires further investigation.
Physically, contact between a hot food sample and the tongue is not an ideal contact, i.e., a flat contact at any point of the contact surface. In reality, the food meets a saliva film that is first heated and partially displaced, but is also trapped in small caverns between the food and the surface of the tongue. However, the thermal conductivity, density and specific heat of the saliva do not differ so much from the values of the skin tissue that a significant influence on the temperature field at the contact point can be expected (Table 2). The simulation shows that a constant contact temperature also occurs when a higher heat transfer resistance is assumed in a thin contact layer. However, the heat flow through the contact surface becomes smaller.
For water, the material values used—thermal conductivity, specific heat capacity and density—and their temperature dependence are very precisely known. In the case of the solid substances examined, conflicting data are sometimes given in the literature. In the case of foodstuffs, there is in any case a natural range of variation. The data from Refs. [25,30,31,32,33] were used. The calculated contact temperatures should, therefore, only be regarded as estimations. However, the effects on the simulation results are minimal. The material properties used are listed in Table 2. The PVC sample was made of a commercially available rod material made of rigid PVC. For more detailed investigations, a certified material should be used.
Strictly speaking, the formula for the contact temperature applies only to solids. Pure heat conduction takes place at the contact area. Convective heat transfer mechanisms play a role in the contact of a liquid with a solid. The main difference between hot solid foods and hot drinks in contact with the tongue or oral mucosa is that the drink spreads in the mouth as a thin film that mixes with saliva and cools faster than a thicker layer of solid food. The heat exchange of a hot beverage with the breathing air is also intensified by the fact that the surface area of the absorbed liquid quantity increases considerably as a result of film formation. Lee et al. [34] give a corresponding explanation for the fact that hot beverages can be absorbed at temperatures above the threshold value for pain perception. With a film of 0.75 mm thickness, the existence of a constant contact temperature is reduced to about 1.5 s duration, as the simulation shows.
Further limitations of the study include that skin data were used for the calculations. However, it can be assumed that the data do not differ too much from the mucous membrane. The blood circulation and thus the heat dissipation into the surrounding tissue could differ. This is included in the heat transfer coefficient, which was varied for testing. During the tests, some of the hot samples were placed on the top of the hand to check whether burning sensation occurs. The feeling of warmth on the hand, however, was similarly perceived to that on the tongue (data not shown)—so there does not seem to be much difference. This is confirmed by the fact that human skin pain receptors are located at approximately 0.1 mm depth [29].
Another limitation not possible to be considered by the methodology is the influence of biting, chewing, and salivary flow. For the calculation of cooling processes including influences such as breathing more strongly with breathing air during reciprocation of the food in the mouth, or chewing and wetting with saliva, too many model assumptions would be required and therefore this was not attempted. With the described procedure, however, it is possible to determine which temperatures and contact times are tolerable. In fact, food stays in the mouth only for a fraction of a second if it is considered too hot. Otherwise, it is moved back and forth in the mouth, wetted with saliva, cooled by breathing air, or completely eliminated. The aim of this work was not to illustrate this process but rather to show if and for how long the contact temperature exists in order to be considered as the determining parameter for the sensation of pain and to define threshold values.
5. Conclusions
Food portions that are too hot are moved inside the mouth, cooled by breathing air and, typically, only reach the esophagus when they have cooled sufficiently. This reduces the risk of injury and carcinogenic risk of the esophagus. However, consumers may presumably consider consumption temperatures that are higher than the preferable temperature T0 similar to the consumption of very hot beverages [21,35]. In addition to the existing minimum serving temperatures (to avoid a microbiological risk, typically 65 °C [36]), the introduction of maximum temperatures also appears to be prudent. The results shown in Figure 10 indicate that the consumption temperature of foods with high water content, such as potatoes, should not exceed 60 °C. It should be noted, however, that these results are based on only a few orientation experiments and need further validation. Furthermore, a habituation effect with regular consumption of very hot food can lead to a reduction of pain [37,38,39]. This must be considered in further experimental investigations. The methods presented here offer the necessary instruments for the practical execution and quantitative evaluation of such investigations.
Supplementary Materials
The following are available online at https://0-www-mdpi-com.brum.beds.ac.uk/2313-576X/4/3/38/s1, Tables S1 and S2: Calculation table for numerical simulation of contact temperatures in Microsoft Excel format (S1: English version, S2: German version).
Author Contributions
Conceptualization, W.L. and D.W.L.; Methodology, W.L.; Formal Analysis, W.L.; Writing-Original Draft Preparation, W.L.; Writing-Review and Editing, D.W.L.; Visualization, W.L.
Funding
This research received no external funding.
Conflicts of Interest
The authors declare no conflict of interest.
References
- Marzetta, L.A. Engineering and constructional manual for an instrument to make burn hazard measurements in consumer products. Nat. Bur. Stand. (U.S.) Tech. Note 1974, 816, 1–48. [Google Scholar]
- Zhai, L.; Adlhart, C.; Spano, F.; Innocenti, M.R.; Piatek, A.K.; Li, J.; Rossi, R.M. Prediction of steam burns severity using Raman spectroscopy on ex vivo porcine skin. Sci. Rep. 2018, 8, 6946. [Google Scholar] [CrossRef] [PubMed]
- McMaster, P.D.; Hudack, S.S. The participation of skin lymphatics in repair of the lesions due to incisions and burns. J. Exp. Med. 1934, 60, 479–501. [Google Scholar] [CrossRef] [PubMed]
- Marzetta, L.A. A thermesthesiometer-An instrument for burn hazard measurement. IEEE Trans. Biomed. Eng. 1974, BME-21, 425–427. [Google Scholar] [CrossRef] [PubMed]
- Manzinger, H. Temperaturgrenzen für die Verbrennung der Haut: Ultraschall-B-Scan-Untersuchung. Dissertation; Ludwig Maximilians Universität: Munich, Germany, 1990. (In German) [Google Scholar]
- Cullen, R. The oral-burn syndrome and its effects on dental implants. J. Oral Implantol. 1998, 24, 219–221. [Google Scholar] [CrossRef]
- Siekmann, H. Recommended maximum temperatures for touchable surfaces. Appl. Ergon. 1990, 21, 69–73. [Google Scholar] [CrossRef]
- Siekmann, H. Determination of maximum temperatures that can be tolerated on contact with hot surfaces. Appl. Ergon. 1989, 20, 313–317. [Google Scholar] [CrossRef]
- Moritz, A.R.; Henriques, F.C. Studies of Thermal Injury: II. The Relative Importance of Time and Surface Temperature in the Causation of Cutaneous Burns. Am. J. Pathol. 1947, 23, 695–720. [Google Scholar] [PubMed]
- Madea, B. Basiswissen Rechtsmedizin; Springer: Berlin/Heidelberg, Germany, 2007. (In German) [Google Scholar]
- Parsons, K. Human Thermal Environments: The Effects of Hot, Moderate, and Cold Environments on Human Health, Comfort, and Performance; CRC press: Boca Raton, FL, USA, 2014. [Google Scholar]
- ISO. Ergonomics of the Thermal Environment—Methods for the Assessment of Human Responses to Contact with Surfaces—Part 1: Hot Surfaces; ISO 13732-1:2006; International Organization for Standardization: Geneva, Switzerland, 2006. [Google Scholar]
- Loomis, D.; Guyton, K.Z.; Grosse, Y.; Lauby-Secretan, B.; El, G.F.; Bouvard, V.; Benbrahim-Tallaa, L.; Guha, N.; Mattock, H.; Straif, K. Drinking Coffee, Mate, and Very Hot Beverages; IARC Publication: Lyon, France, 2018. [Google Scholar]
- Loomis, D.; Guyton, K.Z.; Grosse, Y.; Lauby-Secretan, B.; El, G.F.; Bouvard, V.; Benbrahim-Tallaa, L.; Guha, N.; Mattock, H.; Straif, K. IARC Working Group on the Evaluation of Carcinogenic Risks to Humans Carcinogenicity of drinking coffee, mate, and very hot beverages. Lancet Oncol. 2016, 17, 877–878. [Google Scholar] [CrossRef]
- Rapozo, D.C.; Blanco, T.C.; Reis, B.B.; Gonzaga, I.M.; Valverde, P.; Canetti, C.; Barja-Fidalgo, C.; Simao, T.A.; Albano, R.M.; Kruel, C.D.; et al. Recurrent acute thermal lesion induces esophageal hyperproliferative premalignant lesions in mice esophagus. Exp. Mol. Pathol. 2016, 100, 325–331. [Google Scholar] [CrossRef] [PubMed]
- Li, Z.G.; Shimada, Y.; Sato, F.; Maeda, M.; Itami, A.; Kaganoi, J.; Komoto, I.; Kawabe, A.; Imamura, M. Promotion effects of hot water on N-nitrosomethylbenzylamine-induced esophageal tumorigenesis in F344 rats. Oncol. Rep. 2003, 10, 421–426. [Google Scholar] [CrossRef] [PubMed]
- Okaru, A.O.; Rullmann, A.; Farah, A.; Gonzalez de Mejia, E.; Stern, M.C.; Lachenmeier, D.W. Comparative oesophageal cancer risk assessment of hot beverage consumption (coffee, mate and tea): The margin of exposure of PAH vs very hot temperatures. BMC Cancer 2018, 18, 236. [Google Scholar] [CrossRef] [PubMed]
- Islami, F.; Boffetta, P.; Ren, J.S.; Pedoeim, L.; Khatib, D.; Kamangar, F. High-temperature beverages and foods and esophageal cancer risk—A systematic review. Int. J. Cancer 2009, 125, 491–524. [Google Scholar] [CrossRef] [PubMed]
- Lin, J.; Zeng, R.; Cao, W.; Luo, R.; Chen, J.; Lin, Y. Hot beverage and food intake and esophageal cancer in southern China. Asian Pac. J. Cancer Prev. 2011, 12, 2189–2192. [Google Scholar] [PubMed]
- Andrici, J.; Eslick, G.D. Hot food and beverage consumption and the risk of esophageal cancer: A meta-analysis. Am. J. Prev. Med. 2015, 49, 952–960. [Google Scholar] [CrossRef] [PubMed]
- Dirler, J.; Winkler, G.; Lachenmeier, D.W. What temperature of coffee exceeds the pain threshold? Pilot study of a sensory analysis method as basis for cancer risk assessment. Foods 2018, 7, 83. [Google Scholar] [CrossRef] [PubMed]
- Baehr, H.D.; Stephan, K. Wärme- und Stoffübertragung; Springer: Berlin/Heidelberg, Germany, 2013. (In German) [Google Scholar]
- Jost, U. Kurzes Lehrbuch der Physikalischen Chemie; Dr. Dietrich Steinkopff Verlag: Darmstadt, Germany, 1966. [Google Scholar]
- Weigand, B.; Köhler, J.; von Wolfersdorf, J. Thermodynamik Kompakt; Springer: Berlin/Heidelberg, Germany, 2013; (In German). [Google Scholar] [CrossRef]
- Böckh, P.; Wetzel, T. Wärmeübertragung. Grundlagen und Praxis; Springer: Berlin/Heidelberg, Germany, 2017; (In German). [Google Scholar] [CrossRef]
- Green, B.G.; Gelhard, B. Perception of temperature on oral and facial skin. Somatosens. Res. 1987, 4, 191–200. [Google Scholar] [CrossRef] [PubMed]
- Schlünder, E.-U. Einführung in die Wärme- und Stoffübertragung; Friedr. Vieweg + Sohn: Braunschweig, Germany, 1975; (In German). [Google Scholar] [CrossRef]
- Specht, E. Vorlesungsmanuskript: Grundlagen der Wärme- und Stoffübertragung. Wintersemester 2008/2009. Available online: http://www.uni-magdeburg.de/isut/TV/Download/Waerme-_und_Stoffuebertragung_Kapitel_1+2_WS0809.pdf (accessed on 6 August 2018). (In German).
- Log, T. Modeling skin injury from hot rice porridge spills. Int. J. Environ. Res. Public Health 2018, 15, 808. [Google Scholar] [CrossRef] [PubMed]
- Grimm, H. Eigenschaften von Wasser in Tabellen, 2006. Available online: http://www.wissenschaft-technik-ethik.de/wasser_eigenschaften.html (accessed on 3 August 2018). (In German).
- Kern. Polyvinyl Chloride (PVC-U). Technical Datasheet; Kern GmbH Kunststoffwerke: Großmaischeid, Germany, 2018. [Google Scholar]
- Spieß, W.E.L.; Walz, E.; Nesvadba, P.; Morley, M.; van Haneghem, I.A.; Salmon, D.R. Thermal conductivity of food materials at elevated temperatures. High Temp. High Press. 2001, 33, 693–697. [Google Scholar] [CrossRef]
- Kurzhals, H.-A. Kühlen und Gefrieren von Lebensmitteln; Behrs: Hamburg, Germany, 2007. (In German) [Google Scholar]
- Lee, H.S.; Carstens, E.; O’Mahony, M. Drinking hot coffee: Why doesn’t it burn the mouth? J. Sens. Stud. 2003, 18, 19–32. [Google Scholar] [CrossRef]
- Langer, T.; Winkler, G.; Lachenmeier, D.W. Untersuchungen zum Abkühlverhalten von Heißgetränken vor dem Hintergrund des temperaturbedingten Krebsrisikos. Deut. Lebensm. Rundsch. 2018, 114, 307–314. (In German) [Google Scholar] [CrossRef]
- DIN. Lebensmittelhygiene—Temperaturen für Lebensmittel; DIN 10508:2012-03; Beuth Verlag GmbH: Berlin, Germany, 2012. (In German) [Google Scholar]
- Riedl, R.; Lütgendorff-Gyllenstorm, H. Zu heißes Essen und Trinken—Die unbeachtete Gefahr. Deut. Lebensm. Rundsch. 2011, 107, 71–83. (In German) [Google Scholar]
- Lütgendorff-Gyllenstorm, H. Risikofaktor Nahrung Mit Mehr als 37 Grad Celsius. Wir essen und Trinken zu Heiß; Verlag Wilhelm Maudrich: Vienna, Austria, 1994. (In German) [Google Scholar]
- Verst, L.-M.; Winkler, G.; Lachenmeier, D.W. Dispensing and serving temperatures of coffee-based hot beverages. Exploratory survey as a basis for cancer risk assessment. Ernahrungs Umschau 2018, 65, 64–70. [Google Scholar] [CrossRef]
Figure 1.
Structure of the measuring spoon with thermocouples (sectional view, schematic).
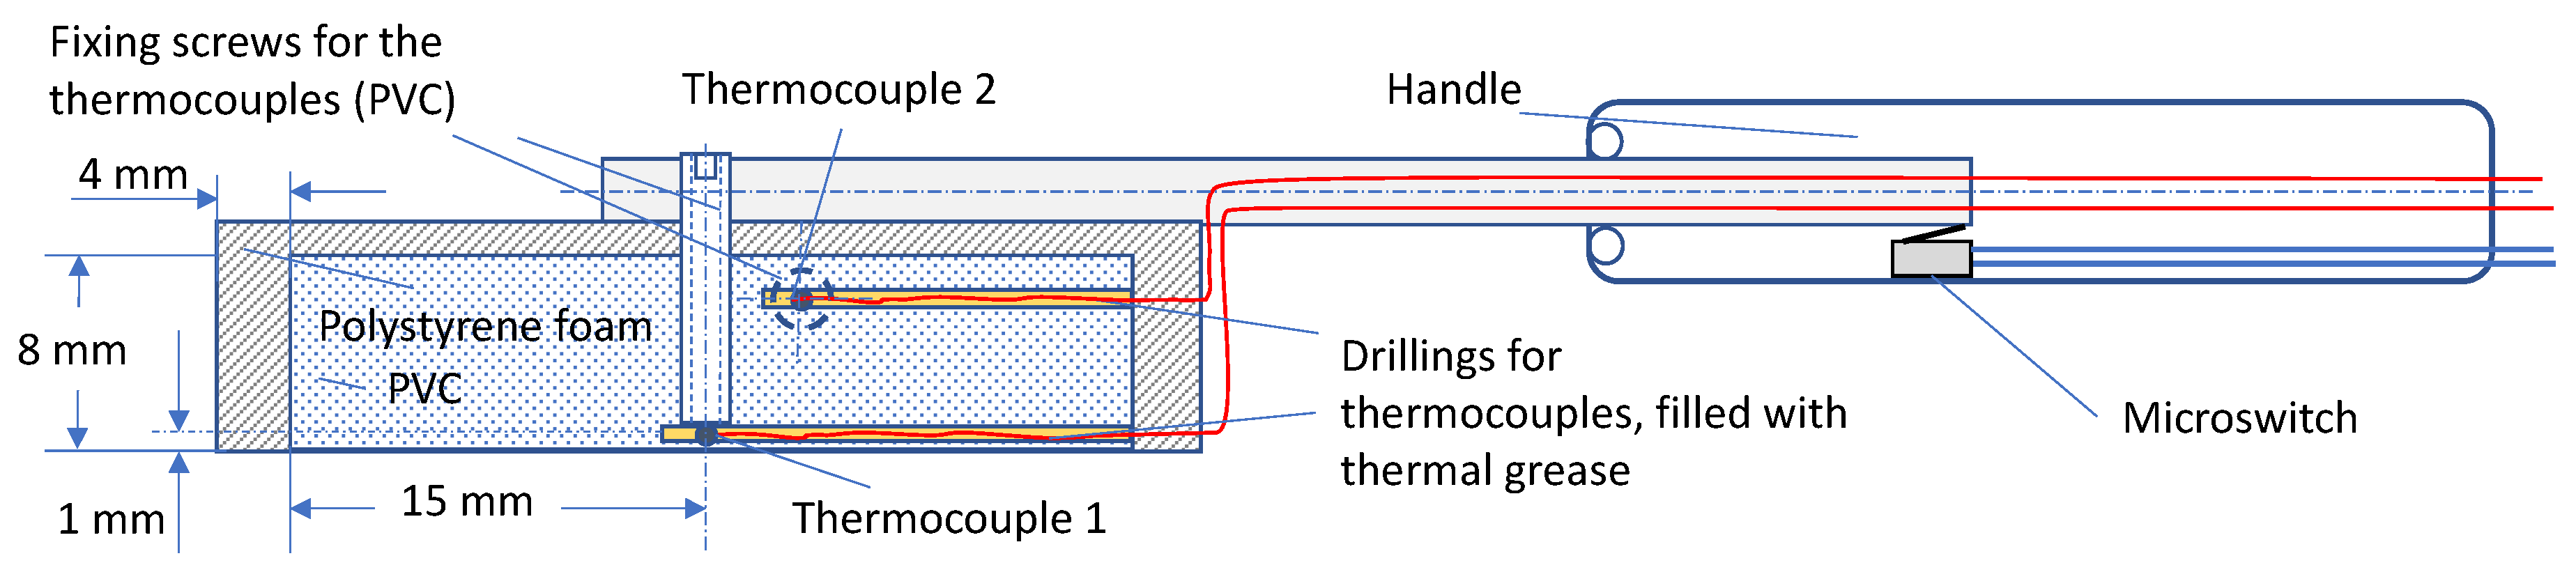
Figure 2.
Photo of a polyvinyl chloride (PVC) sample with sample holder.

Figure 3.
Photo of a PVC-sample with drilling for thermocouples.
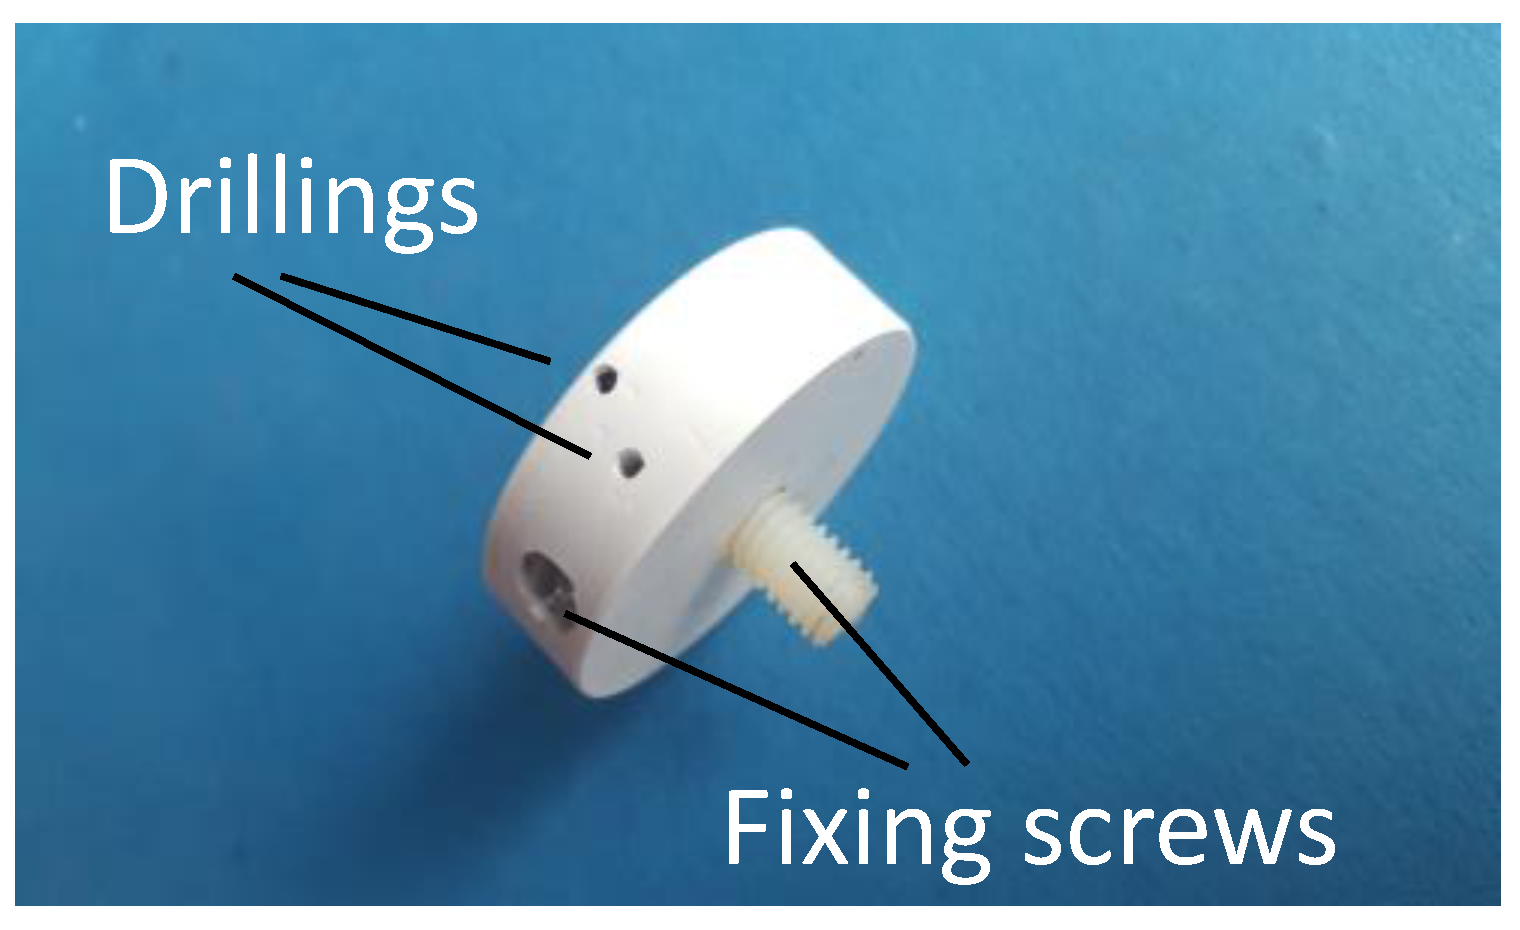
Figure 4.
Application of the measuring spoon conducting a test.

Figure 5.
Starting and consumption temperatures as a function of the contact temperature.

Figure 6.
Temperature profiles for equal times t from 0.25 s to 10 s above the local coordinate x for a cylindrical sample of boiled potatoes 2.5 mm thick and 70 °C starting temperature in contact with the tongue. Tongue temperature: 35 °C.
Figure 6.
Temperature profiles for equal times t from 0.25 s to 10 s above the local coordinate x for a cylindrical sample of boiled potatoes 2.5 mm thick and 70 °C starting temperature in contact with the tongue. Tongue temperature: 35 °C.
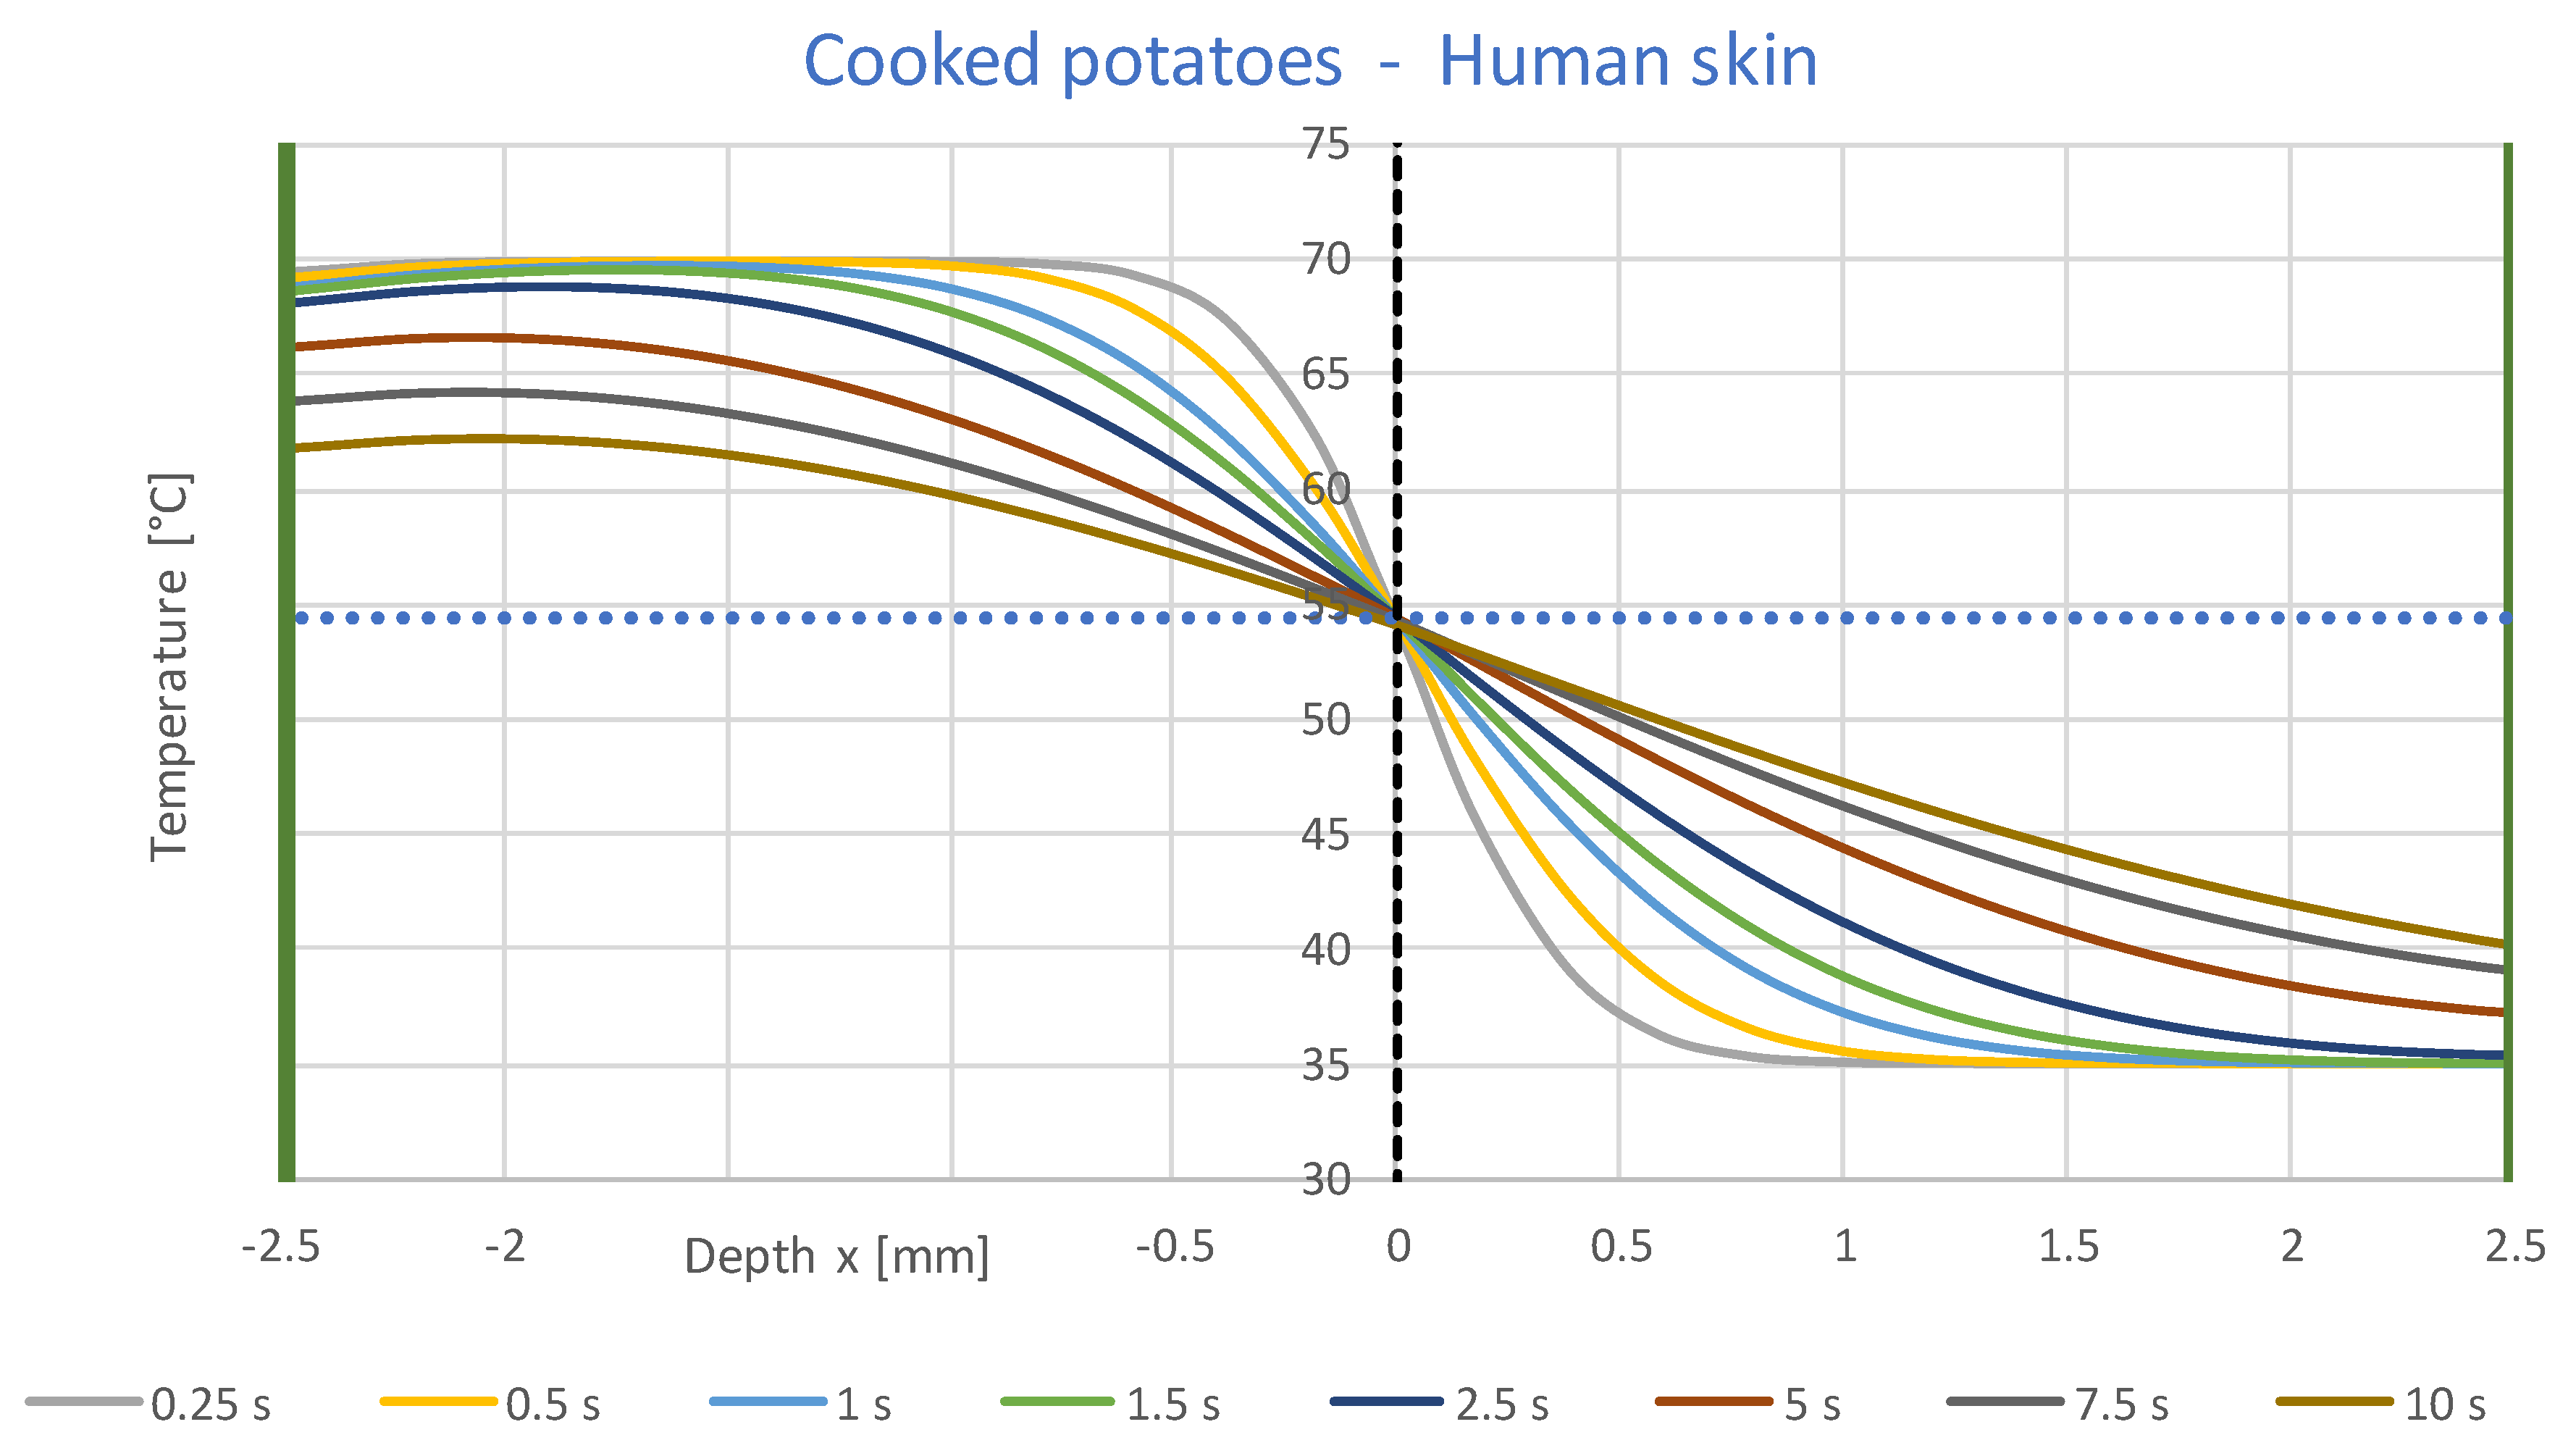
Figure 7.
Temperature profiles for equal times t from 2.5 s to 100 s above the local coordinate x for a cylindrical sample of boiled potatoes 2.5 mm thick and 70 °C starting temperature in contact with the tongue. Tongue temperature: 35 °C.
Figure 7.
Temperature profiles for equal times t from 2.5 s to 100 s above the local coordinate x for a cylindrical sample of boiled potatoes 2.5 mm thick and 70 °C starting temperature in contact with the tongue. Tongue temperature: 35 °C.
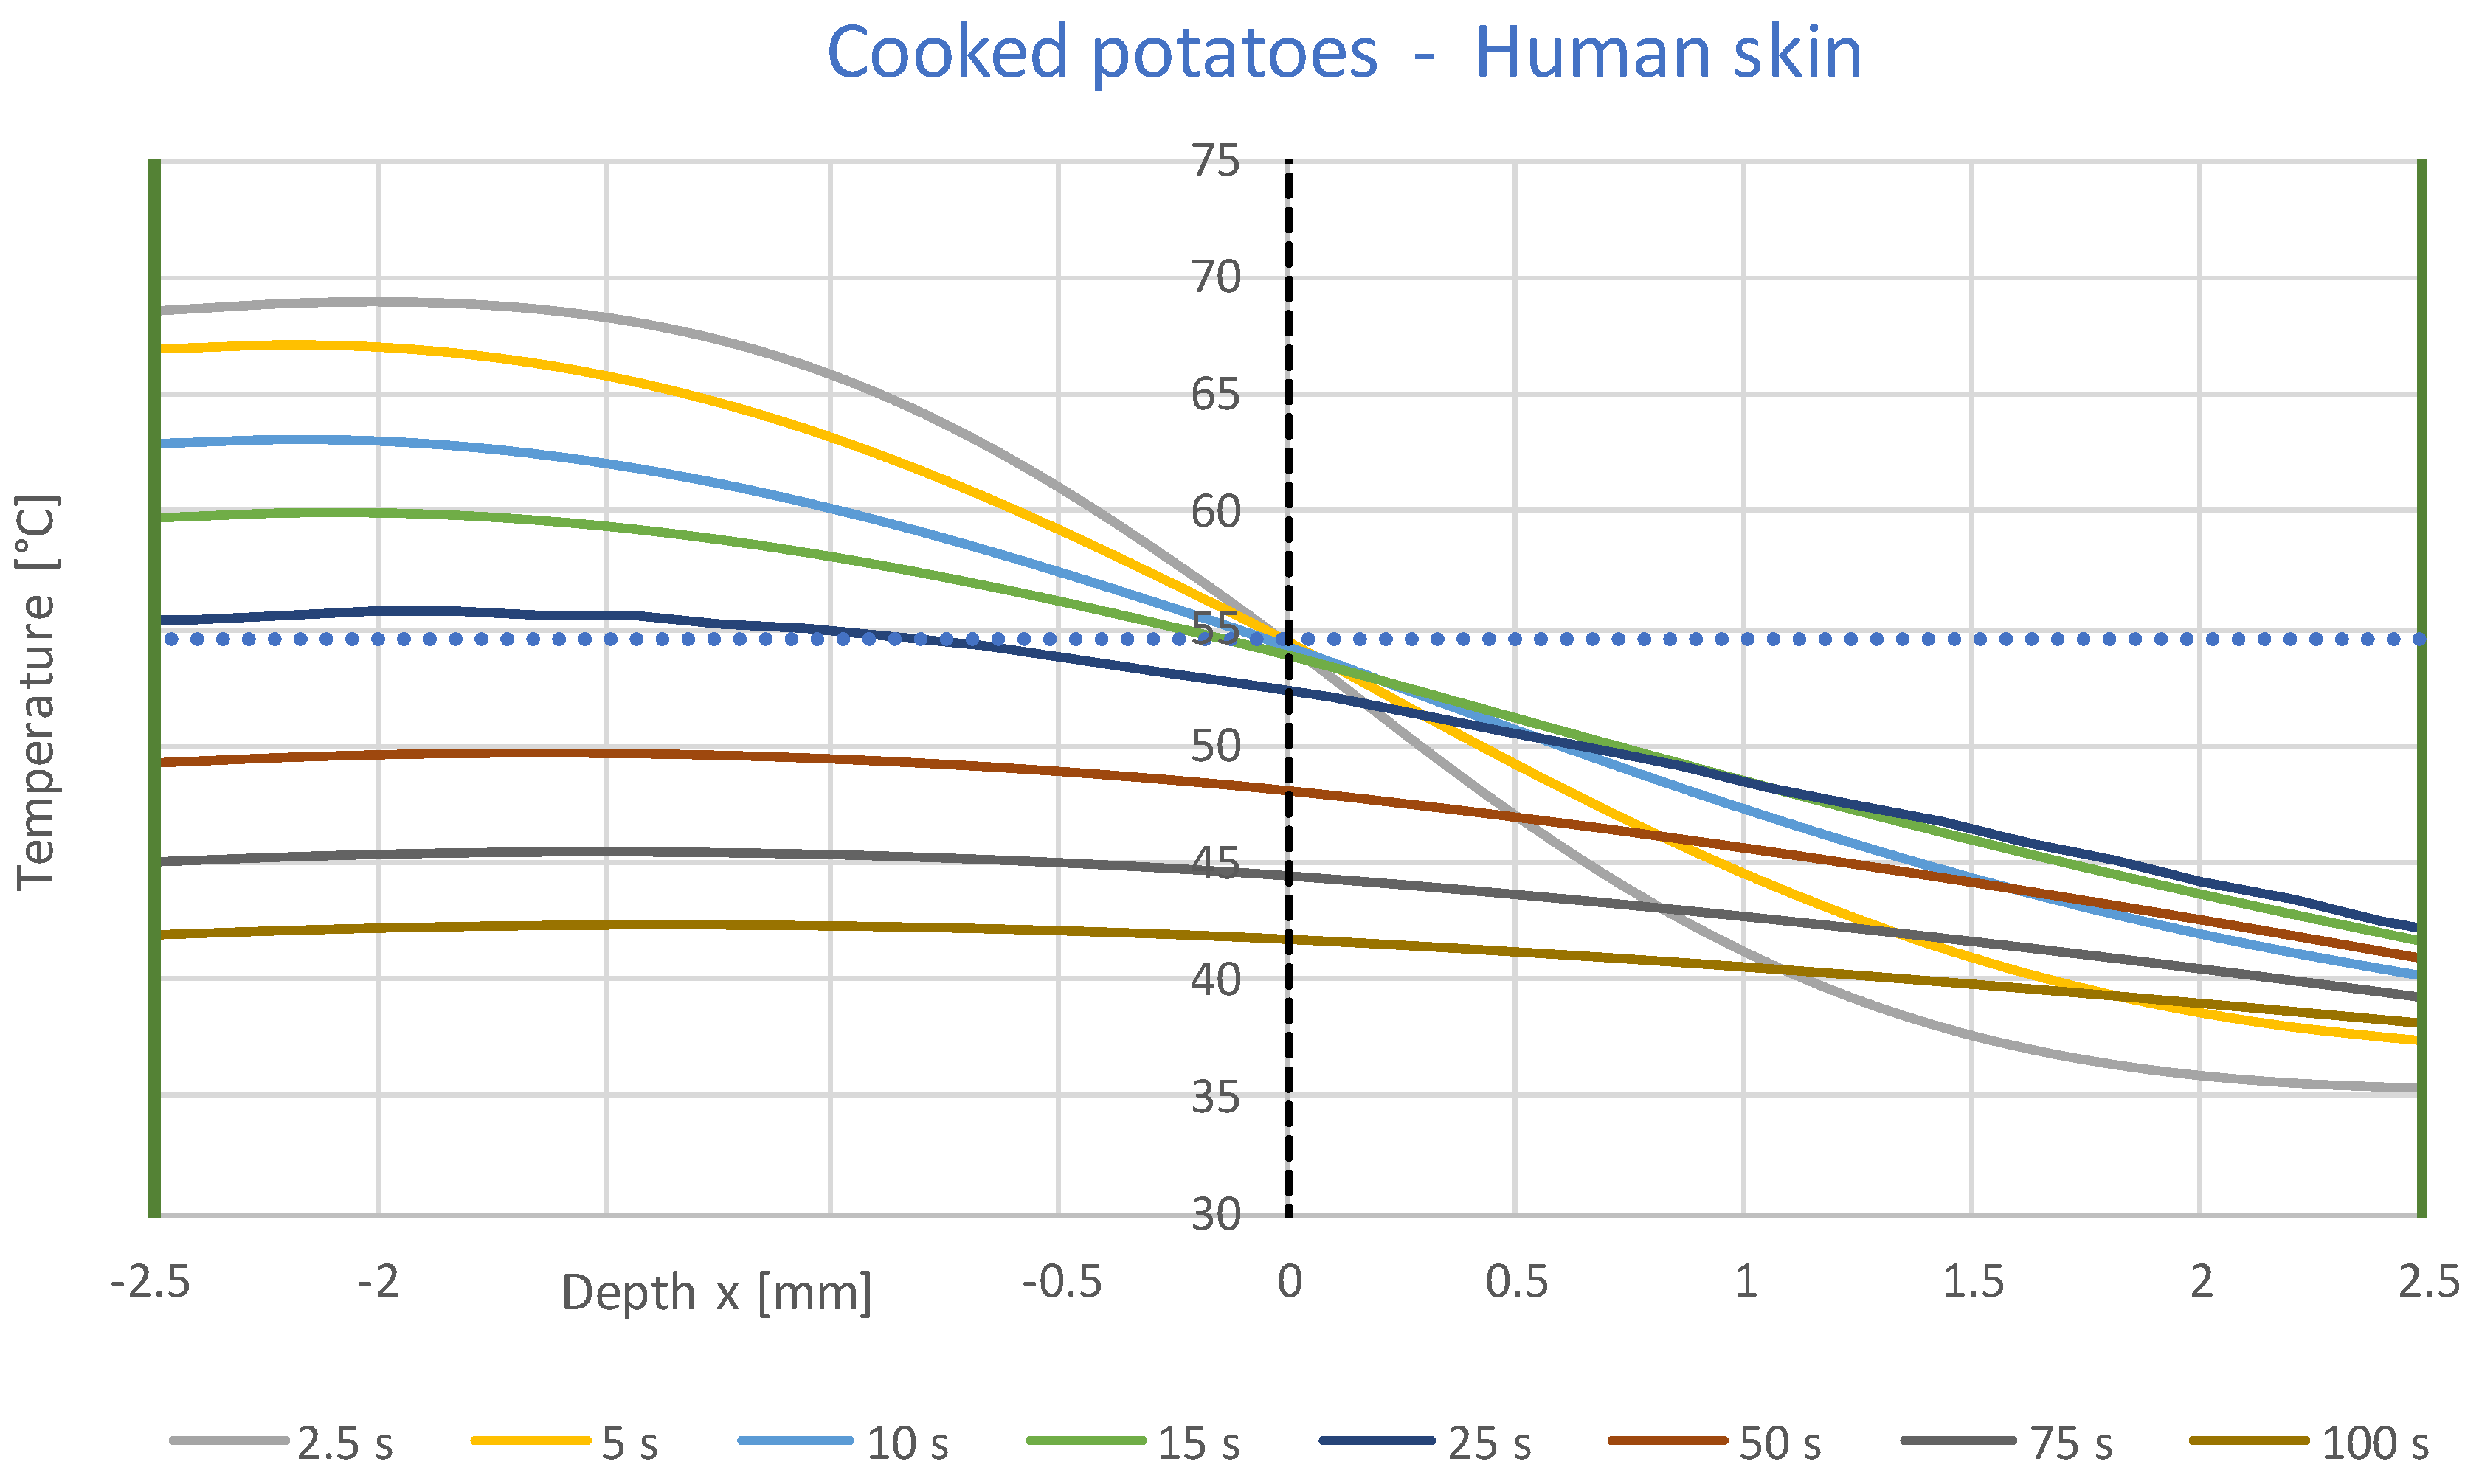
Figure 8.
Temperature profiles over time in different layers of a 2.5 mm thick sample of boiled potatoes at 70 °C and human skin at 35 °C from the contact surface (x = 0) to the surfaces (x = ±2.5 mm).
Figure 8.
Temperature profiles over time in different layers of a 2.5 mm thick sample of boiled potatoes at 70 °C and human skin at 35 °C from the contact surface (x = 0) to the surfaces (x = ±2.5 mm).
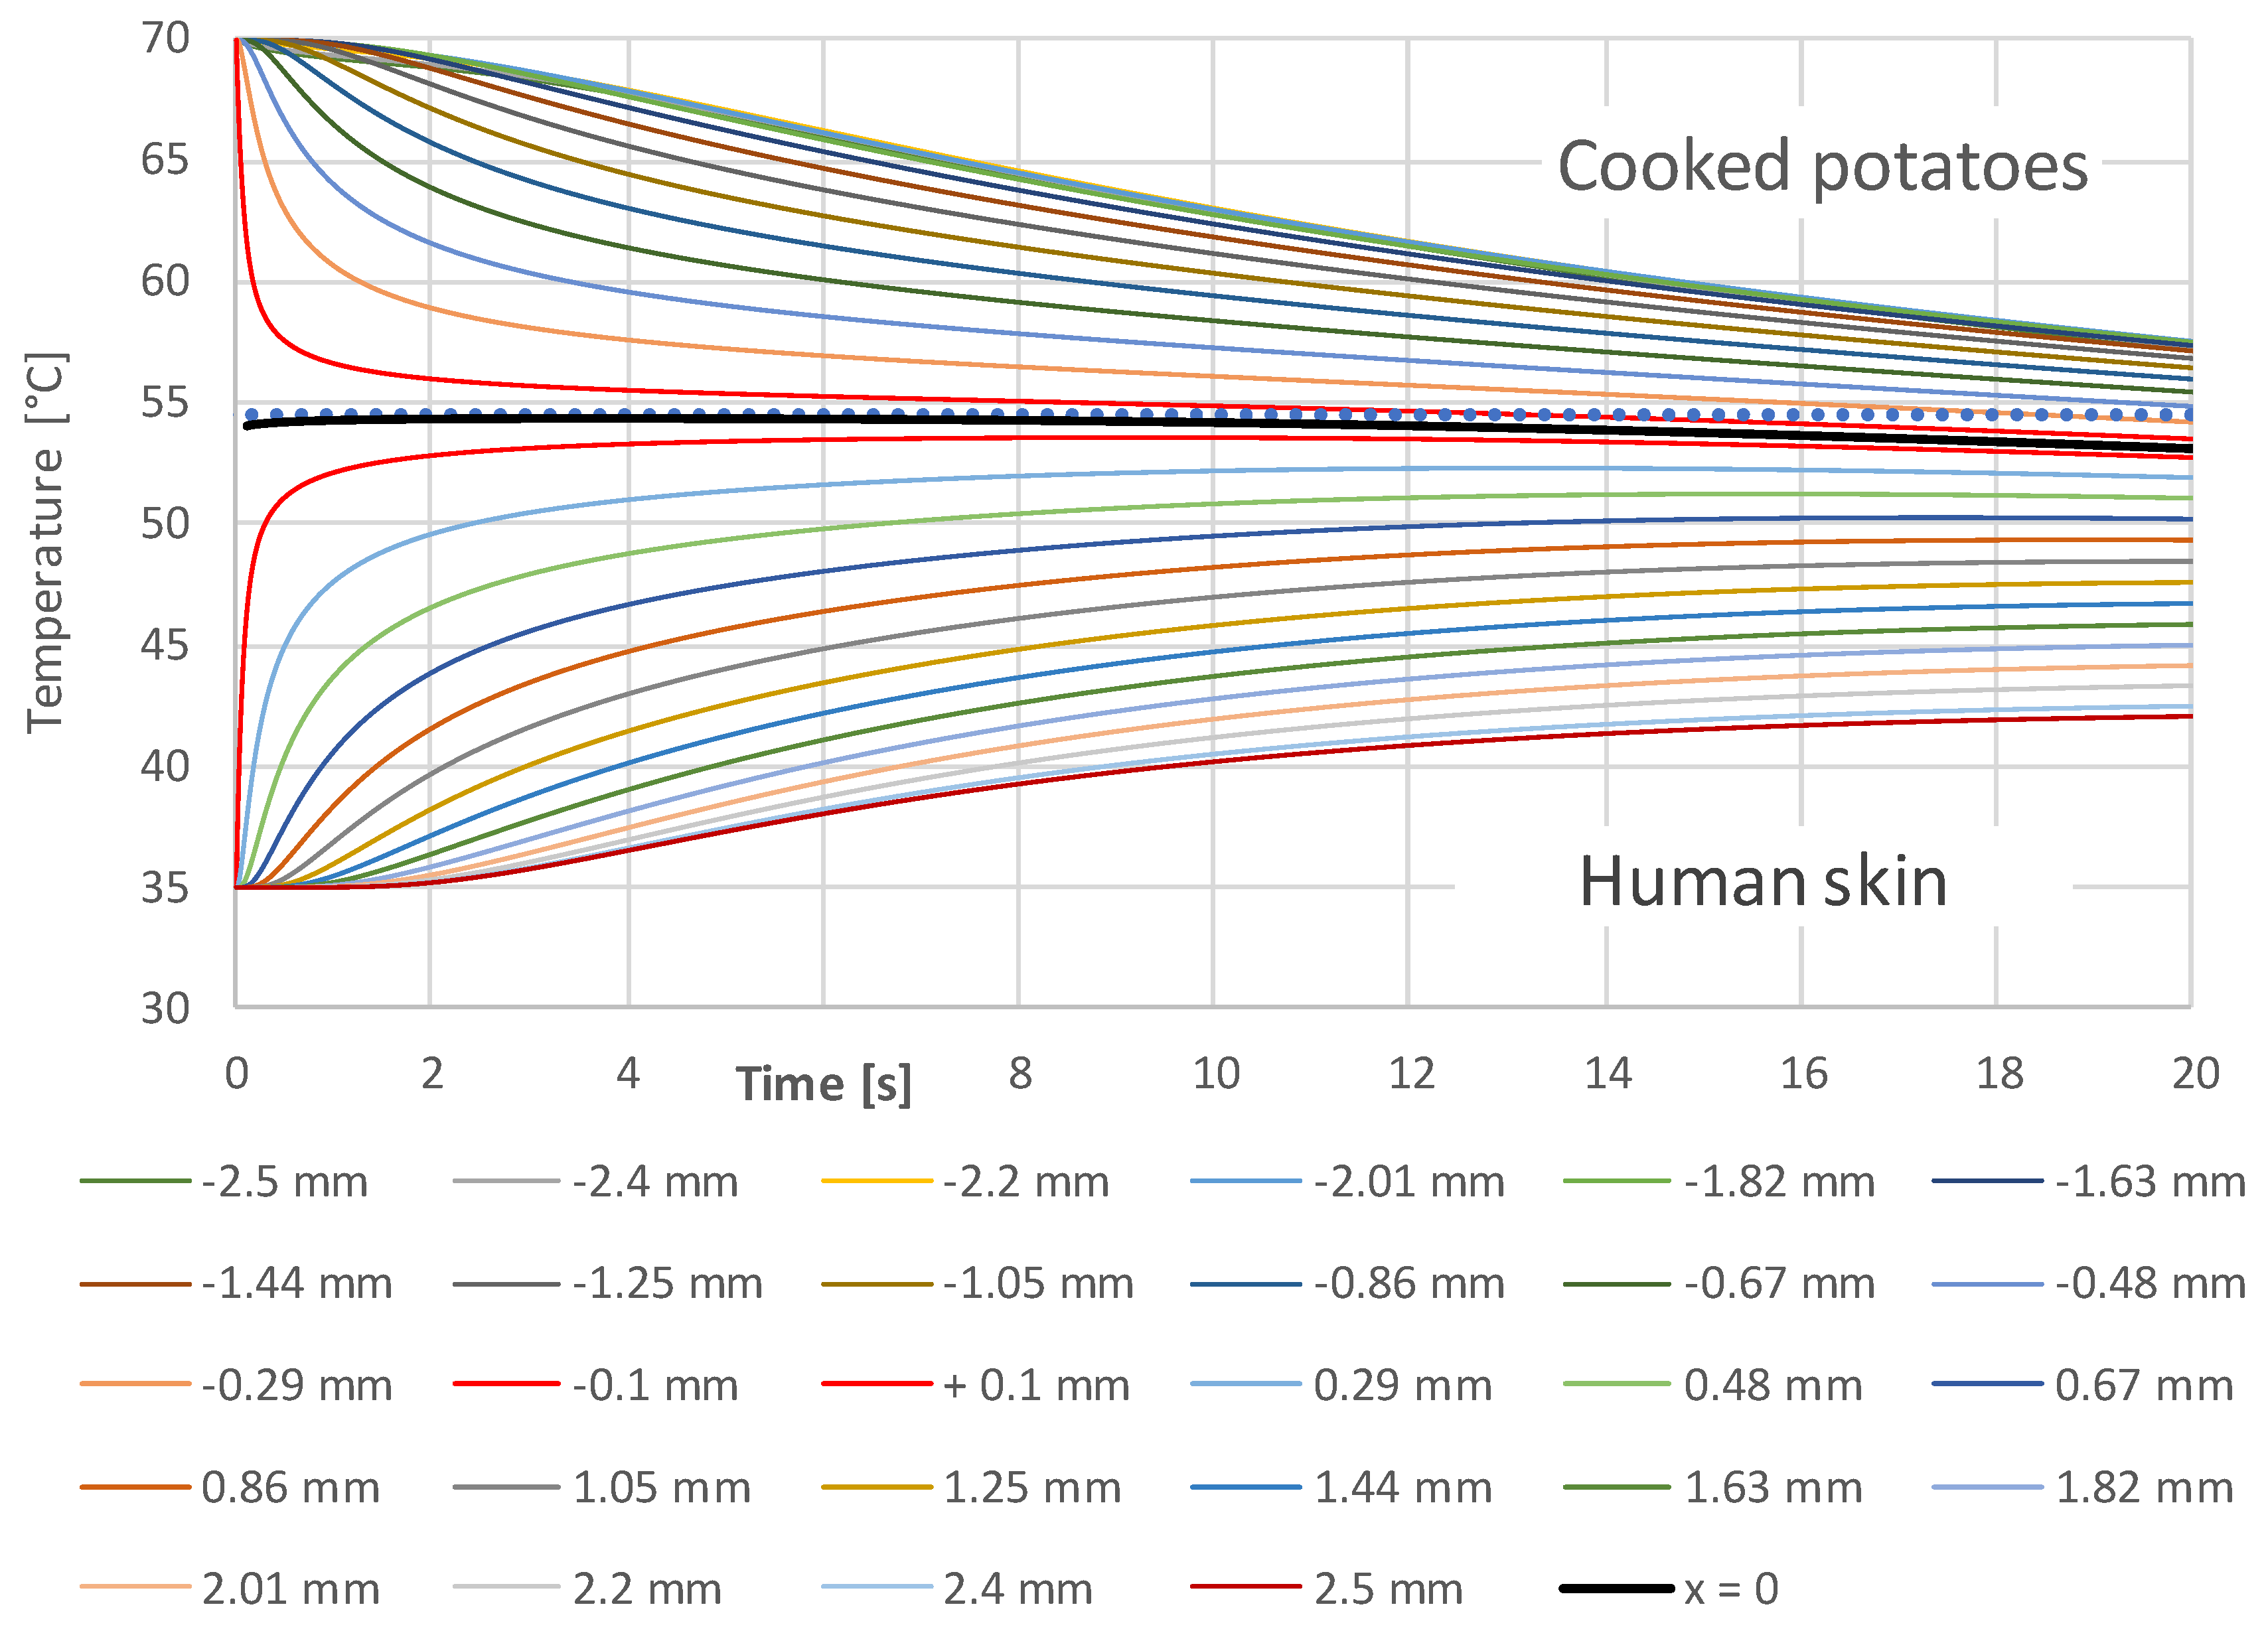
Figure 9.
Measured value pairs and interpolation by an exponential function (Equation (4)).
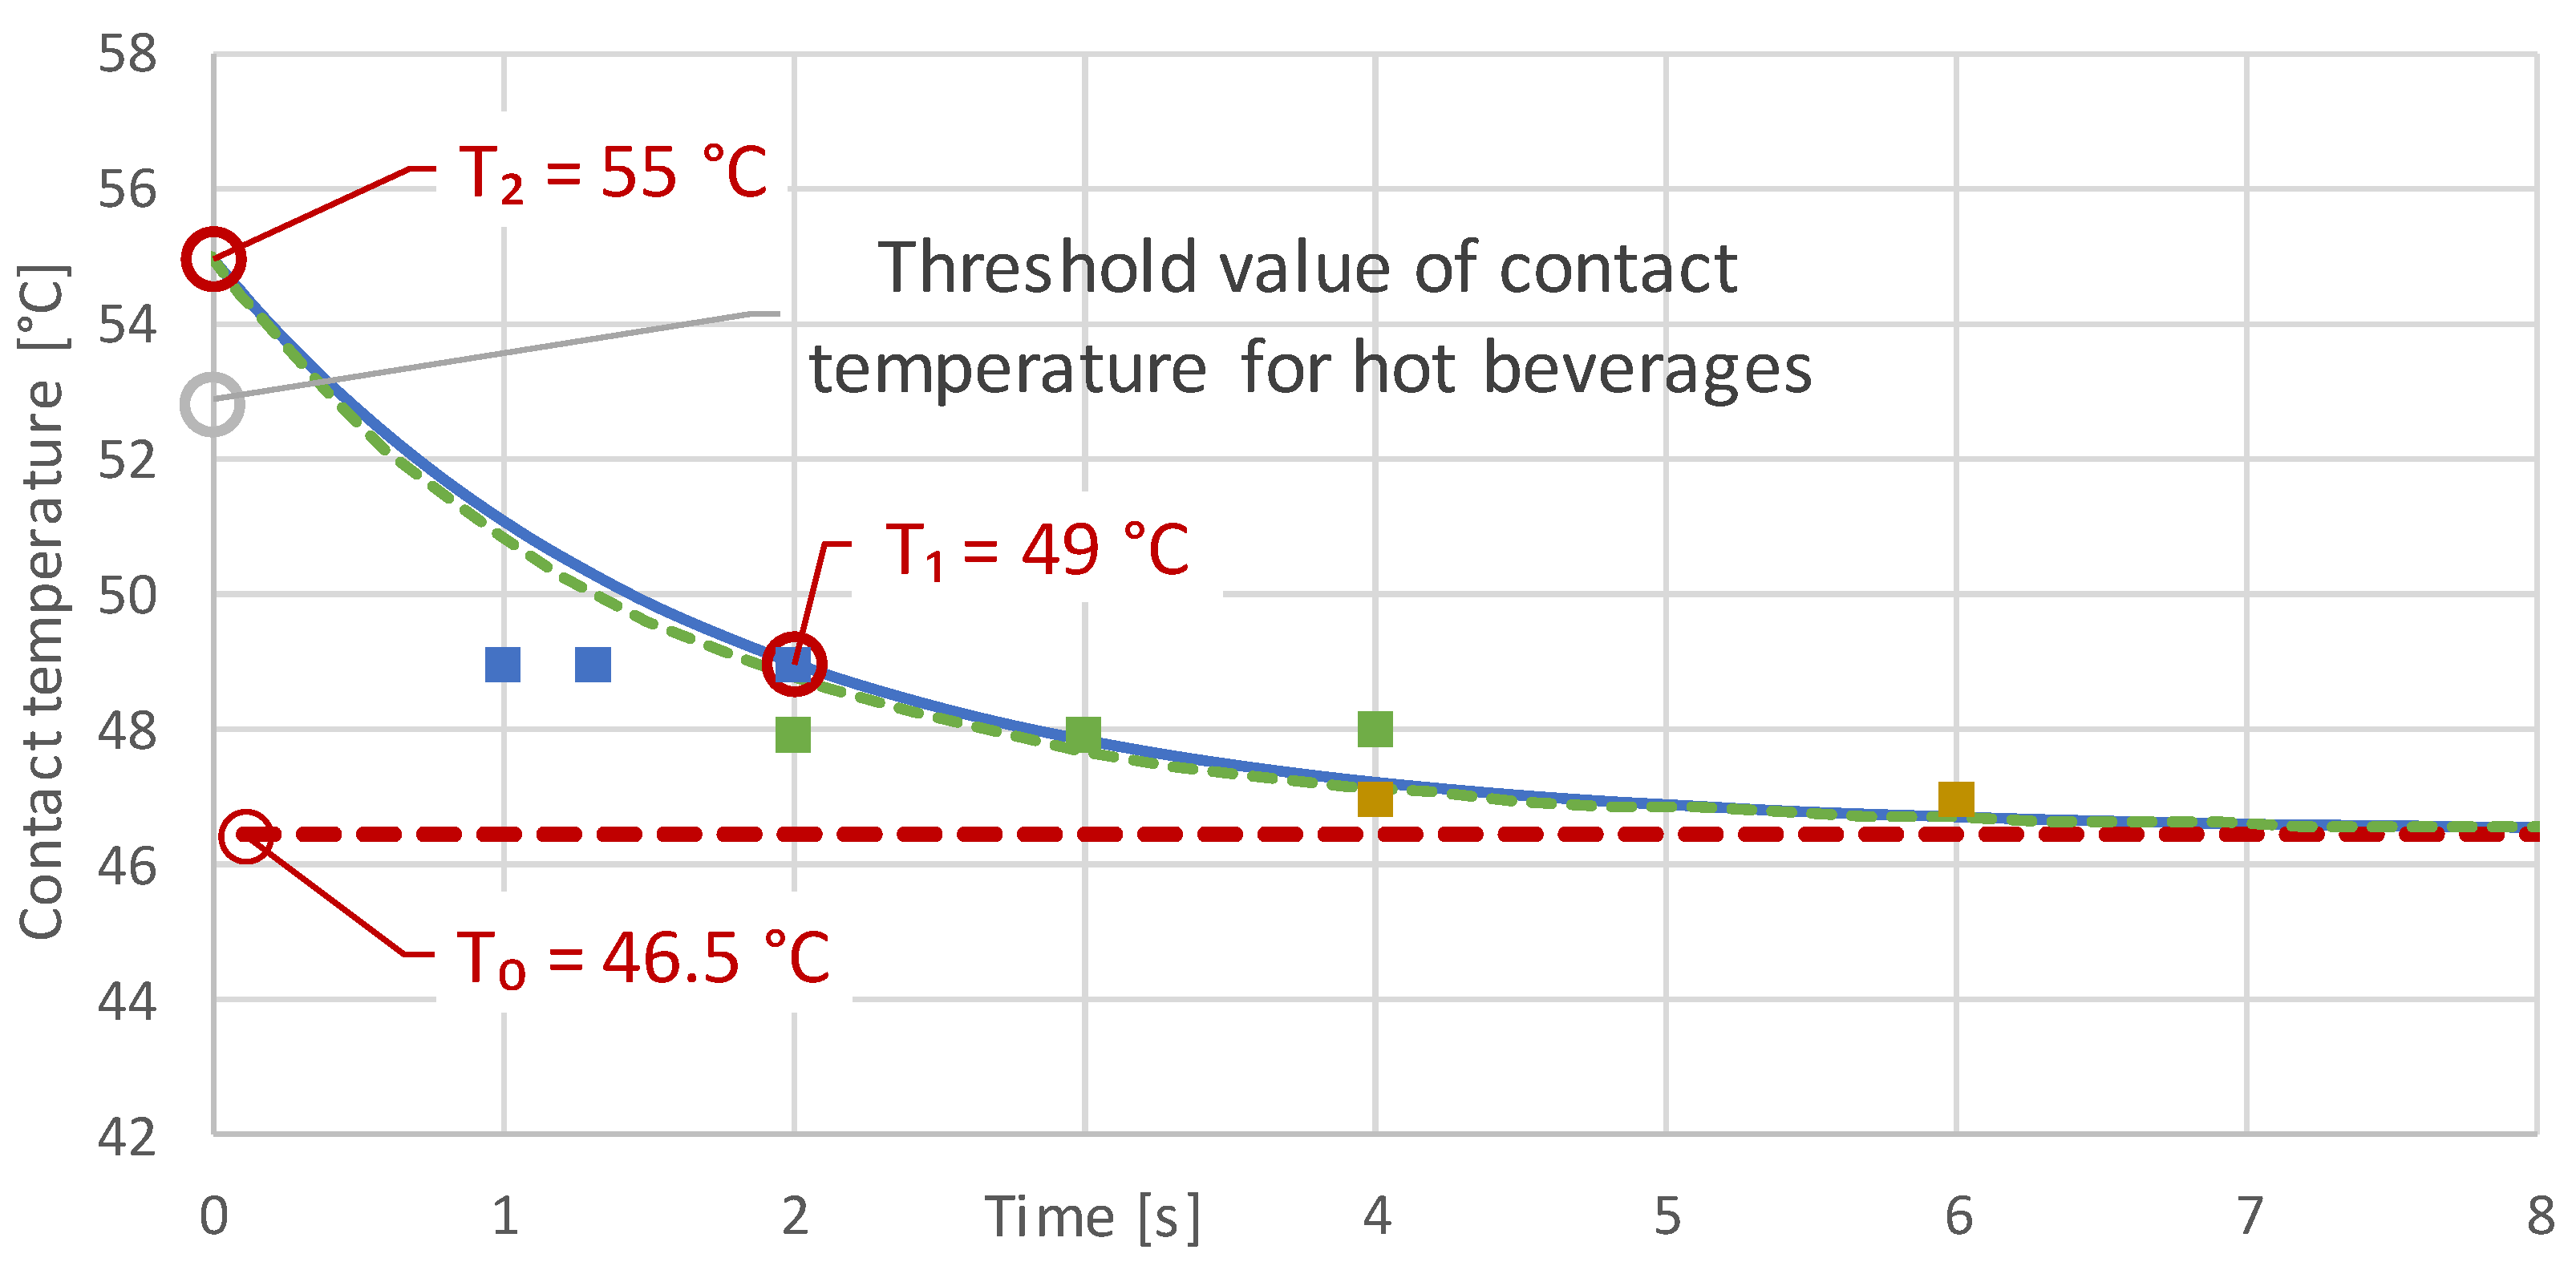
Figure 10.
Consumption temperatures of different solid foods calculated from the interpolated curve for the permissible contact temperature in Figure 9; for comparison: water and PVC.
Figure 10.
Consumption temperatures of different solid foods calculated from the interpolated curve for the permissible contact temperature in Figure 9; for comparison: water and PVC.

Table 1.
Results of orienting measurements.
| Measurement | Starting Temperature T (°C) | Contact Temperature T0, T1 (°C) | Measuring Time t (s) |
|---|---|---|---|
| 1 | 75.0 | 46.5 | >10 |
| 2a | 76.8 | 47.0 | 4 |
| 2b | 76.8 | 47.0 | 6 |
| 3a | 80.3 | 48.0 | 3 |
| 3b | 80.3 | 48.0 | 2 |
| 3c | 80.3 | 48.0 | 4 |
| 4a | 83.7 | 49.0 | 1 |
| 4b | 83.7 | 49.0 | 2 |
| 4c | 83.7 | 49.0 | 1 |
Table 2.
Material properties used.
| Material Properties | Human Skin | Water (60 °C) | PVC | Potatoes | Cheese | Fish | Meat (Lean) | Vegetables |
|---|---|---|---|---|---|---|---|---|
| Thermal conductivity λ [W/(m·K] | 0.50 | 0.65 | 0.15 | 0.55 | 0.35 | 0.50 | 0.40 | 0.50 |
| Density ρ [kg/m³] | 1020 | 983 | 1380 | 1050 | 1080 | 990 | 990 | 1050 |
| Specifiy heat c [J/(kg·K] | 2400 | 4184 | 960 | 3350 | 2430 | 3430 | 3200 | 3200 |
| Thermal effusivity b = (λ·ρ·c)0.5 | 1106.35 | 1640.23 | 445.78 | 1390.91 | 955.66 | 1303.02 | 1125.70 | 1296.15 |
| Literature | [25] | [30] | [31] | [32] | [33] | [32] | [32] | [32] |
© 2018 by the authors. Licensee MDPI, Basel, Switzerland. This article is an open access article distributed under the terms and conditions of the Creative Commons Attribution (CC BY) license (http://creativecommons.org/licenses/by/4.0/).
Share and Cite
MDPI and ACS Style
Lachenmeier, D.W.; Lachenmeier, W. Injury Threshold of Oral Contact with Hot Foods and Method for Its Sensory Evaluation. Safety 2018, 4, 38. https://0-doi-org.brum.beds.ac.uk/10.3390/safety4030038
AMA Style
Lachenmeier DW, Lachenmeier W. Injury Threshold of Oral Contact with Hot Foods and Method for Its Sensory Evaluation. Safety. 2018; 4(3):38. https://0-doi-org.brum.beds.ac.uk/10.3390/safety4030038
Chicago/Turabian StyleLachenmeier, Dirk W., and Walter Lachenmeier. 2018. "Injury Threshold of Oral Contact with Hot Foods and Method for Its Sensory Evaluation" Safety 4, no. 3: 38. https://0-doi-org.brum.beds.ac.uk/10.3390/safety4030038
Note that from the first issue of 2016, this journal uses article numbers instead of page numbers. See further details here.