How Much Practice Is Required to Reduce Performance Variability in a Virtual Reality Mining Simulator?


1
School of Human Kinetics, Laurentian University, Sudbury ON P3E 2C6, Canada
2
School of Mathematics and Computer Science, Laurentian University, Sudbury ON P3E 2C6, Canada
*
Author to whom correspondence should be addressed.
Safety 2019, 5(2), 18; https://0-doi-org.brum.beds.ac.uk/10.3390/safety5020018
Submission received: 11 December 2018
/
Revised: 25 March 2019
/
Accepted: 1 April 2019
/
Published: 13 April 2019
(This article belongs to the Special Issue Mine Safety)
Abstract
:Virtual reality allows researchers to explore training scenarios that are not feasible or are potentially risky to recreate in the real world. The aim of this research was to examine whether using a tutorial session prior to using the mining simulator could adequately reduce the performance variability and increase the consistency of participant performance metrics. Eighteen participants were randomly assigned to a tutorial or a non-tutorial group. The tutorial group completed a five-minute tutorial that introduced them to the basics of the machine and virtual reality environment. All participants then completed five sessions in the simulator lasting five minutes each. Personality scores were recorded and participants answered questions to test their situational awareness after each session. Performance metrics such as number of collisions and perception response time were recorded by the simulator. A Wilcoxon signed rank test was used to determine at what point a significant difference in performance metrics was apparent across the five sessions. A mixed effects multilevel regression was done to evaluate the change in variability across time. There were no significant correlations between the personality questionnaire scores and the number of collisions or the perception response time. Both groups demonstrated high standard deviation scores for collisions and perception response time, but the tutorial group had decreasing variability across time. Both groups began to exhibit more consistent scores in the simulator after 10 min of use. Situational awareness questions require some refinement prior to further testing.
1. Introduction
The underground mining industry continues to be challenged by operators who have a very limited view of the tunnel around them [1]. Since most load-haul-dump (LHD) machines are designed with operators seated perpendicular to the direction of travel, they must use twisted and bent postures in an effort to obtain a line-of-sight (LOS) for safe operation of the machine [2]. Past research has found that a large percentage of accidents and fatalities involving LHD machines in the mining industry could be directly related to poor operator LOS. From the Mine Safety and Health Association (MSHA) literature, it is evident that fatal injury in the mining industry resulting from equipment is four times higher than that of any other industry, and the LHD accounts for 9% of the fatalities [3]. Elsewhere, the rates of fatality from mechanized haulage range from 12 to 19.5% [4]. In an attempt to increase visibility and awareness for the operator, the industry has introduced systems broadly classified as proximity awareness technologies (PAT). A basic video system was deemed useful and suitable for improving visibility in a reversing task on an underground mining machine [5]. Prior to that, Ruff evaluated a variety of PATs specifically for their suitability in underground use [6]. Despite this early initiative, there has been no standard put forward within the industry on what constitutes a best practice for PAT implementation. The New South Wales Government MDG document first published in 2013 puts forward some guidelines for consideration by companies wishing to implement collision avoidance systems [7]. The extensive document suggests the need for different levels of intervention (including alert, alarm, and stop criteria) but does not include details related to how the information should be displayed. Since then, several companies have developed proprietary algorithms for detecting obstacles, and different interfaces to project this information to the driver of heavy equipment have been explored. The task of determining which system might be the optimal design for underground mine operations is complicated by the difficulty of gathering in-situ test data from operators using the systems in production mines.
The use of simulators allows researchers to evaluate a variety of potential scenarios in a relatively risk-free environment. This can be especially useful in high risk workplaces, such as the mining industry. Tichon and Burgess-Limerick identified other reasons, including reduction of cost and impact on workplace productivity, and the ability to explore scenarios that are not feasible to recreate in the real world, as rationale to explore using virtual reality (VR) as a training method [8]. Custom-made simulator environments can also be useful for evaluating technology concepts that have not yet been perfected for real-world applications. With this in mind, our research lab has designed a virtual reality simulator on the Unity gaming platform, with an integrated joystick and pedal controller to closely mimic operation of a load-haul-dump (LHD) machine [9]. In this custom environment, variations of proximity awareness technology can be tested for optimal design features without the added expense of numerous mock-ups and prototypes. For instance, the interface display can be customized to provide video data only, video data with map detail overlay, icon and text hazard information, and audio and haptic alarms, depending on the research question of interest.
In addition to evaluations into human-factors-related design issues, the VR simulator has been coded with options to allow researchers to evaluate how much attention users have to devote to things in the virtual environment. Kass et al. found that individuals with higher levels of situation awareness (SA) had fewer collisions in a driving simulator [10]. Sneddon et al. identified that the majority of incidents analyzed using an SA framework occurred due to a failure in Level 1 Situation Awareness, known as the perception of elements in the environment [11]. Finally, there are personality features, such as trait mindfulness, distraction, and likelihood of attention-related lapses that are likely related to the ability of a user to keep and maintain SA [12]. Some of these personality characteristics can be quantified using a variety of surveys [13,14,15].
The main task in our custom simulator, known as the Situational Awareness Mining Simulator (SAMS), is for the operator to pick up broken rock (muck) in the bucket of an accurately-scaled LHD, and deliver the muck to the designated dumping location. Several features intended to test Level 1 SA have been built into the SAMS, and a datalog file records performance metrics such as collision occurrence and perception response time for identifying pedestrians within the mine. In preliminary research, it was found that high rates of variability in collisions and perception response times were affecting subsequent analysis of those performance variables across different research conditions [9]. Therefore, the purpose of this study was to examine if using a tutorial session prior to completing a research study with the mining simulator could reduce the variability observed in novice users. The ability to use undergraduate students as a test bed is desirable due to the ability to test numerous iterations of PAT design features in a virtual environment, without the associated cost of field research. Once the research team has been able to narrow down the best possible features of a PAT, it will be worth the considerable time and effort to recruit actual miners to test those variations in the simulator, and later, in the field. However, one must have a method by which it can be determined that the test population has reached some base level of proficiency prior to the beginning of the test trials. Thus, the first hypothesis was that individuals who completed the tutorial would have significantly fewer average collisions, higher situational awareness scores, and faster average perception response time across all trials, compared to those that did not complete the trial. Secondly, this study aimed to determine whether any attention-related personality scores, as measured by the Cognitive Failures Questionnaire (CFQ), Mindful Attention Awareness Scale (MAAS), and the Domain-Specific Risk-Taking (DOSPERT) Scale correlated with any simulator performance metrics (i.e., collisions, perception response time, SA questions).
2. Materials and Methods
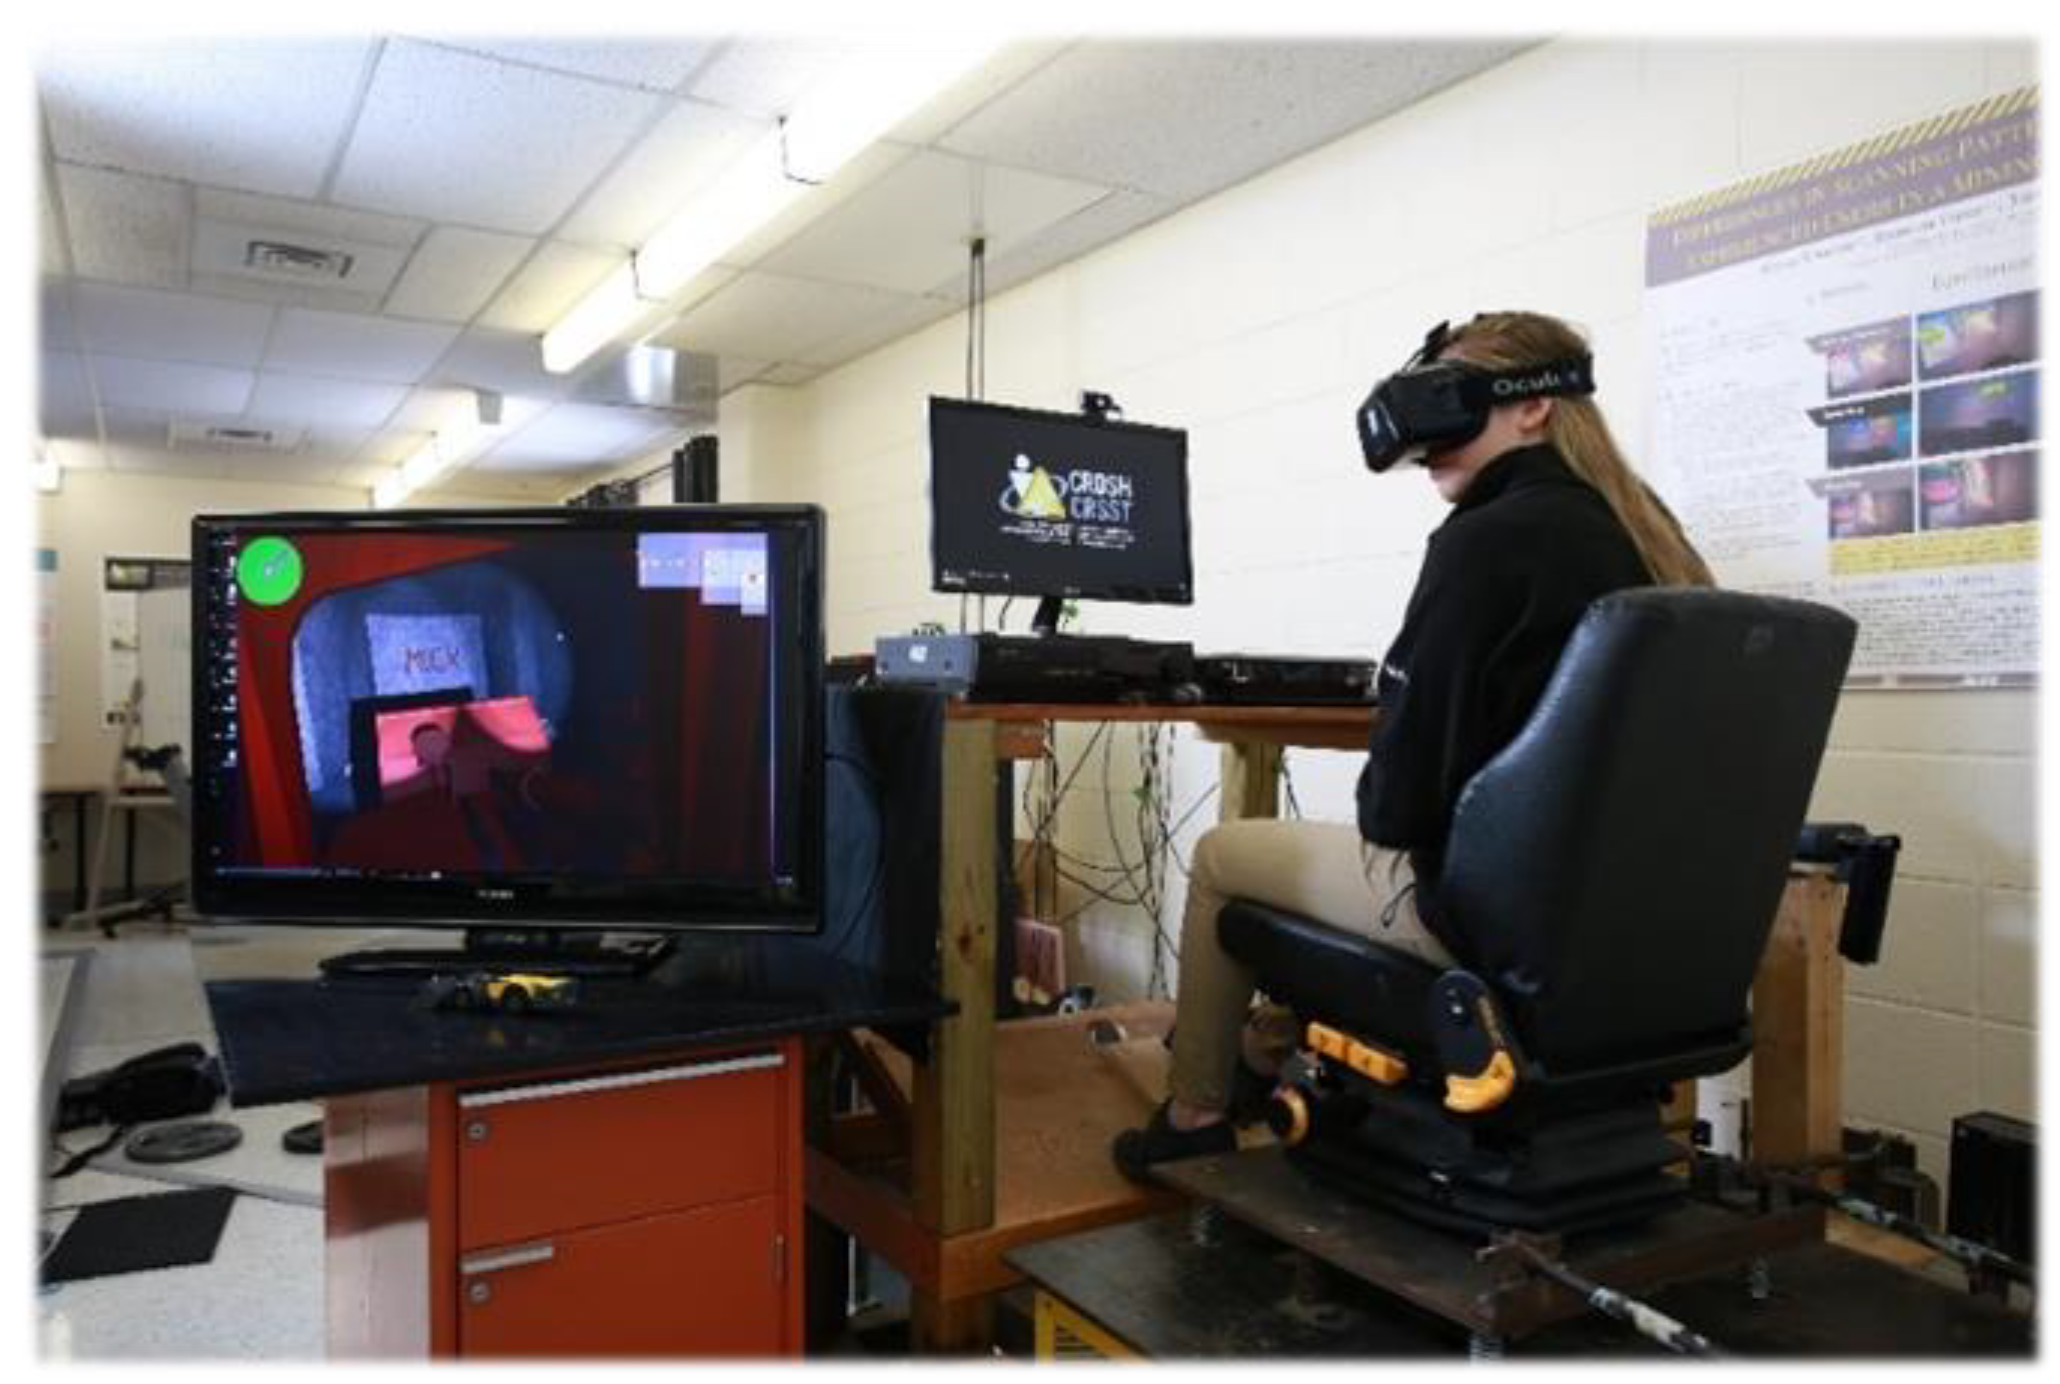
The equipment used in this study included the Oculus Rift DK2 headset, a joystick for operation of the LHD within the simulator, and the Situational Awareness Mining Simulator (SAMS), created at Laurentian University through the Centre for Research in Occupational Safety and Health. Ethical approval for the study was granted by the Research Ethics Board for the university (Case 2015-11-10). Based on previous work, a power calculation was performed based on the reported differences in collisions between the practice trial and the average of the session trials to determine that the optimal sample size was n = 15 in a repeated design [9]. This closely matched the sample size required (n = 13) for an independent design using the number of pedestrian collisions from Kass et al. [10]. The intent was to collect at least 20 participants, and we were successful in recruiting 22 participants. However, only 18 of the participants completed the study in its entirety, with usable data for analysis. There were 13 females and 5 males tested with ages ranging from 18 to 27 years, and the average age was 21.0 (SD = 2.52). Participants were randomly assigned to one of two groups, tutorial or no tutorial. The tutorial was a five-minute session in a separate virtual reality (VR) space that provided an overview of the LHD machine, how the controls worked, and how to navigate in VR. All participants then completed five sessions lasting five minutes each in the simulator (Figure 1).
The sessions all had the same purpose, which was to deliver broken rock (muck) from one location to the designated muck dumping station. Within the simulated mine, participants encountered pedestrians and other vehicles, which they were instructed to avoid hitting. They were also instructed to press a specific button on the joystick as soon as they detected a pedestrian in their environment. This was logged as a perception response time by the simulator datalog system. If the participant did not acknowledge a pedestrian in their environment within 20 s, it was marked as a missed pedestrian. The total number of missed pedestrians was also recorded for analysis. The simulator datalog system also recorded the number of times the machine collided with the environment. Subsequently, the log files produced by SAMS were obtained to calculate a mean value for perception response time for each session, and the total number of collisions variable for each session.
After each five-minute session, the simulation was paused by the researcher, and participants were asked a situational awareness question related to the environment in which they had just finished working. Questions were marked as either right or wrong given the response from the participant. The questions were developed specifically for this mine simulator environment, and generally, can be thought to represent Level 1 of situational awareness, i.e., Perception of elements in the environment [16]. The Level 1 SA questions included items that the participants might have noticed while navigating in their environment, such as the color of the vent tubing, location of the broken vent, the level of mine at which they were located, the color of the refuge station door, etc. An attempt was made to randomize the question order among participants. The situational awareness score was expressed as a percent of correct answers (out of five).
At the end of the first session, participants completed the CFQ [14]. At the end of the second session, participants completed the MAAS [13]. At the end of the third session, participants completed the DOSPERT questionnaire [17]. For this study, the total DOSPERT score and the Health (H) only score were used.
Due to non-normal data distributions, non-parametric Spearman Correlations were run to compare the scores from the personality questionnaires with the total number of collisions, average perception response time, and number of correct situational awareness responses. A Kruskal–Wallis test was used to determine the effect of the tutorial on SAMS performance metrics. A Friedman test was used to evaluate the effect of time (five sessions) on the collisions and perception response time performance metrics. A Wilcoxon Signed Rank Test was used as a follow-up for any significant findings across the five sessions with the False Detection Rate (FDR) used to determine significance for multiple comparisons. Due to large individual variation in perception response time and collisions, a mixed effects multilevel regression was done to evaluate the change in variability across time. A p-value of 0.05 was required for significance in all tests. An additional descriptive analysis is presented.
3. Results
3.1. Personality Measures
Spearman Correlations were completed to evaluate personality questionnaire scores and the following performance variables: missed pedestrians in the mine, perception response time, and collisions. There was one significant correlation (r = 0.623) found between missed pedestrians and the CFQ score (Table 1). There were no significant correlations found for collisions (Table 1), although MAAS and total collisions approached significance and the r-value of −0.425 suggests a medium effect size using Cohen’s standard. There were no significant correlations found for reaction time (Table 1). A medium effect size was suggested between CFQ and average perception response time (r = 0.310) though there was no statistical significance.
3.2. Tutorial Effect
A Kruskal–Wallis test was used to test the effect of a tutorial on collisions, perception response time, and situational awareness recorded during each of the five sessions that constituted the testing phase. The only session that demonstrated a significant difference between collisions experienced by the tutorial and non-tutorial group was session four (χ2 = 6.964, p = 0.008) with non-tutorial participants showing significantly higher collisions than the participants who completed the tutorial. Session one (χ2 = 0.018, p = 0.894), session two (χ2 = 0.032, p = 0.858), session three (χ2 = 2.916, p = 0.088), and session five (χ2 = 2.727, p = 0.099) did not show any significant results. Therefore, the average collisions across all sessions was calculated and compared against the tutorial groups. There was no significant difference between average collisions and the tutorial group (p = 0.182). A Kruskal–Wallis test was also run to determine if there was any significant difference in the amount of missed pedestrians between the tutorial groups. There was no significant difference between the tutorial and non-tutorial groups.
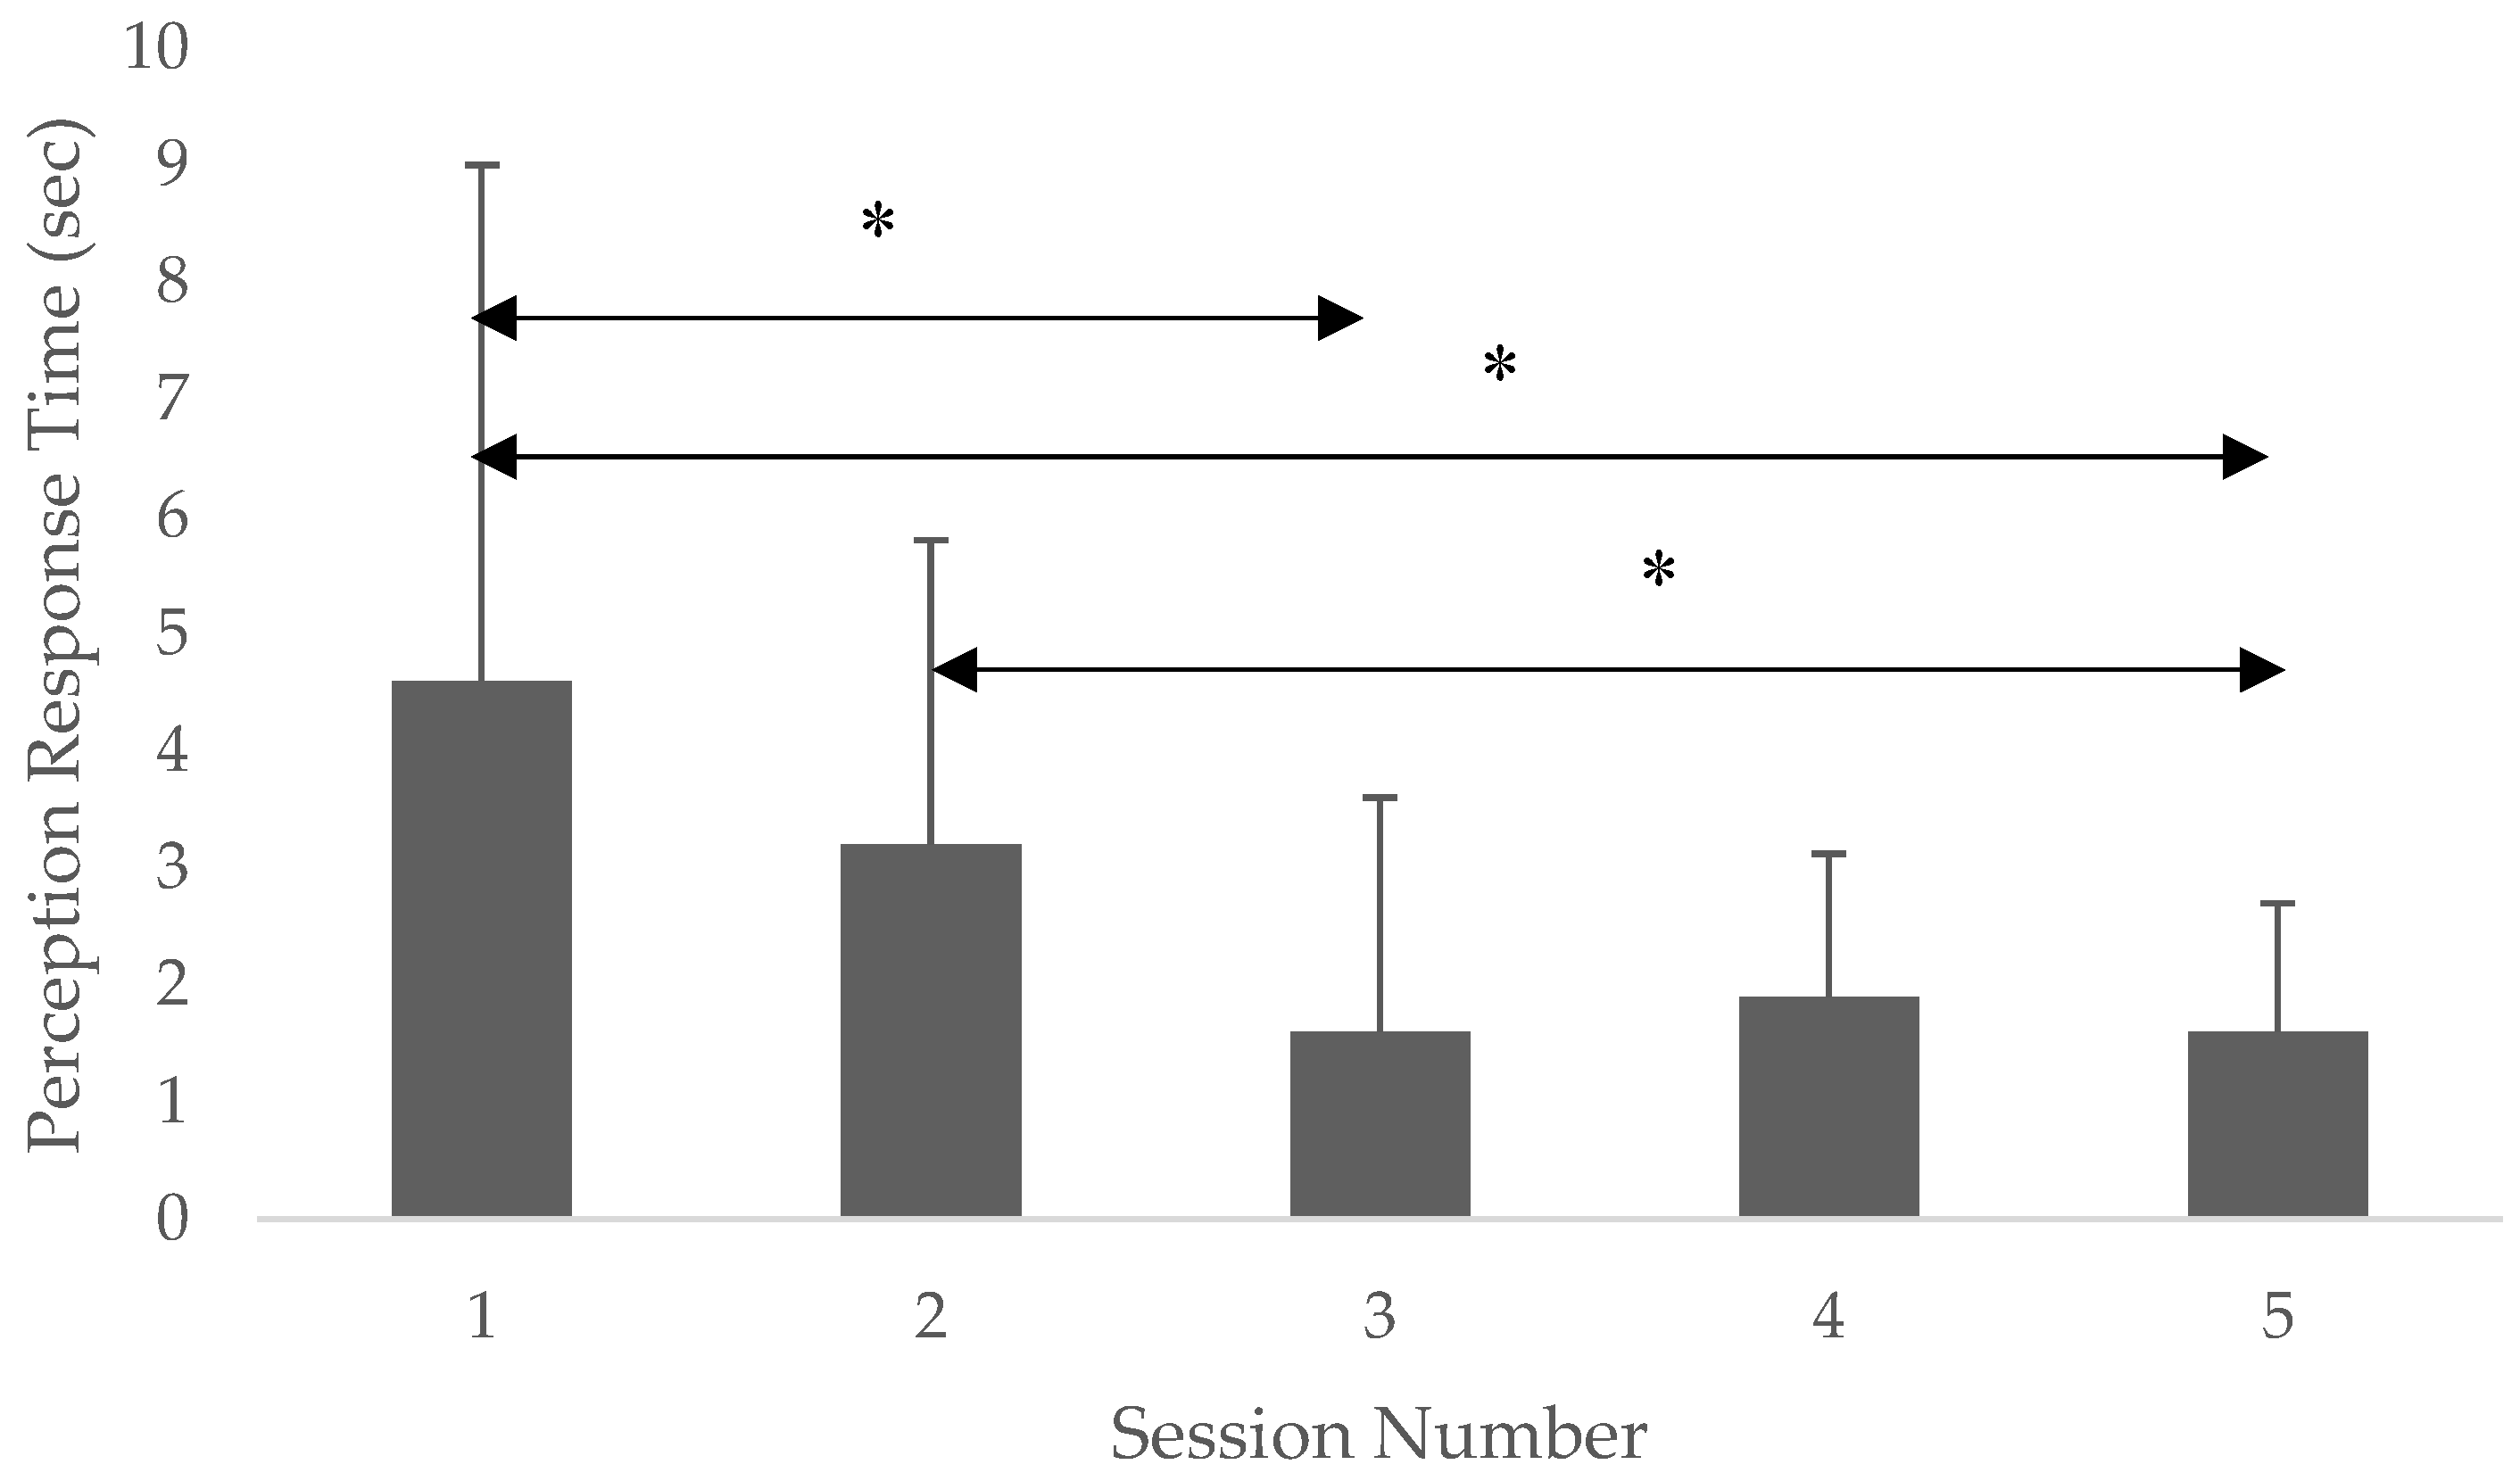
Due to the lack of significance between groups on the measure of perception response time, the between-subject variable of tutorial/no-tutorial was collapsed, and differences between the five sessions were explored using non-parametric Friedman tests. The Friedman demonstrated a significant difference between sessions (Figure 2) across time for the perception response time (p = 0.004). Wilcoxon Signed Rank tests were used to identify where the difference existed using an adjusted p-value based on the recommendation of Benjamini and Hochberg [18] for multiple comparisons. Results demonstrated that there was a significant difference in perception response time between sessions one and three (p = 0.006), one and five (p = 0.007), and two and five (p = 0.012). The Friedman test for situational awareness showed no significant difference between sessions, while collisions were found to have one significant difference between sessions one and two (p = 0.034).
3.3. Participant Variability
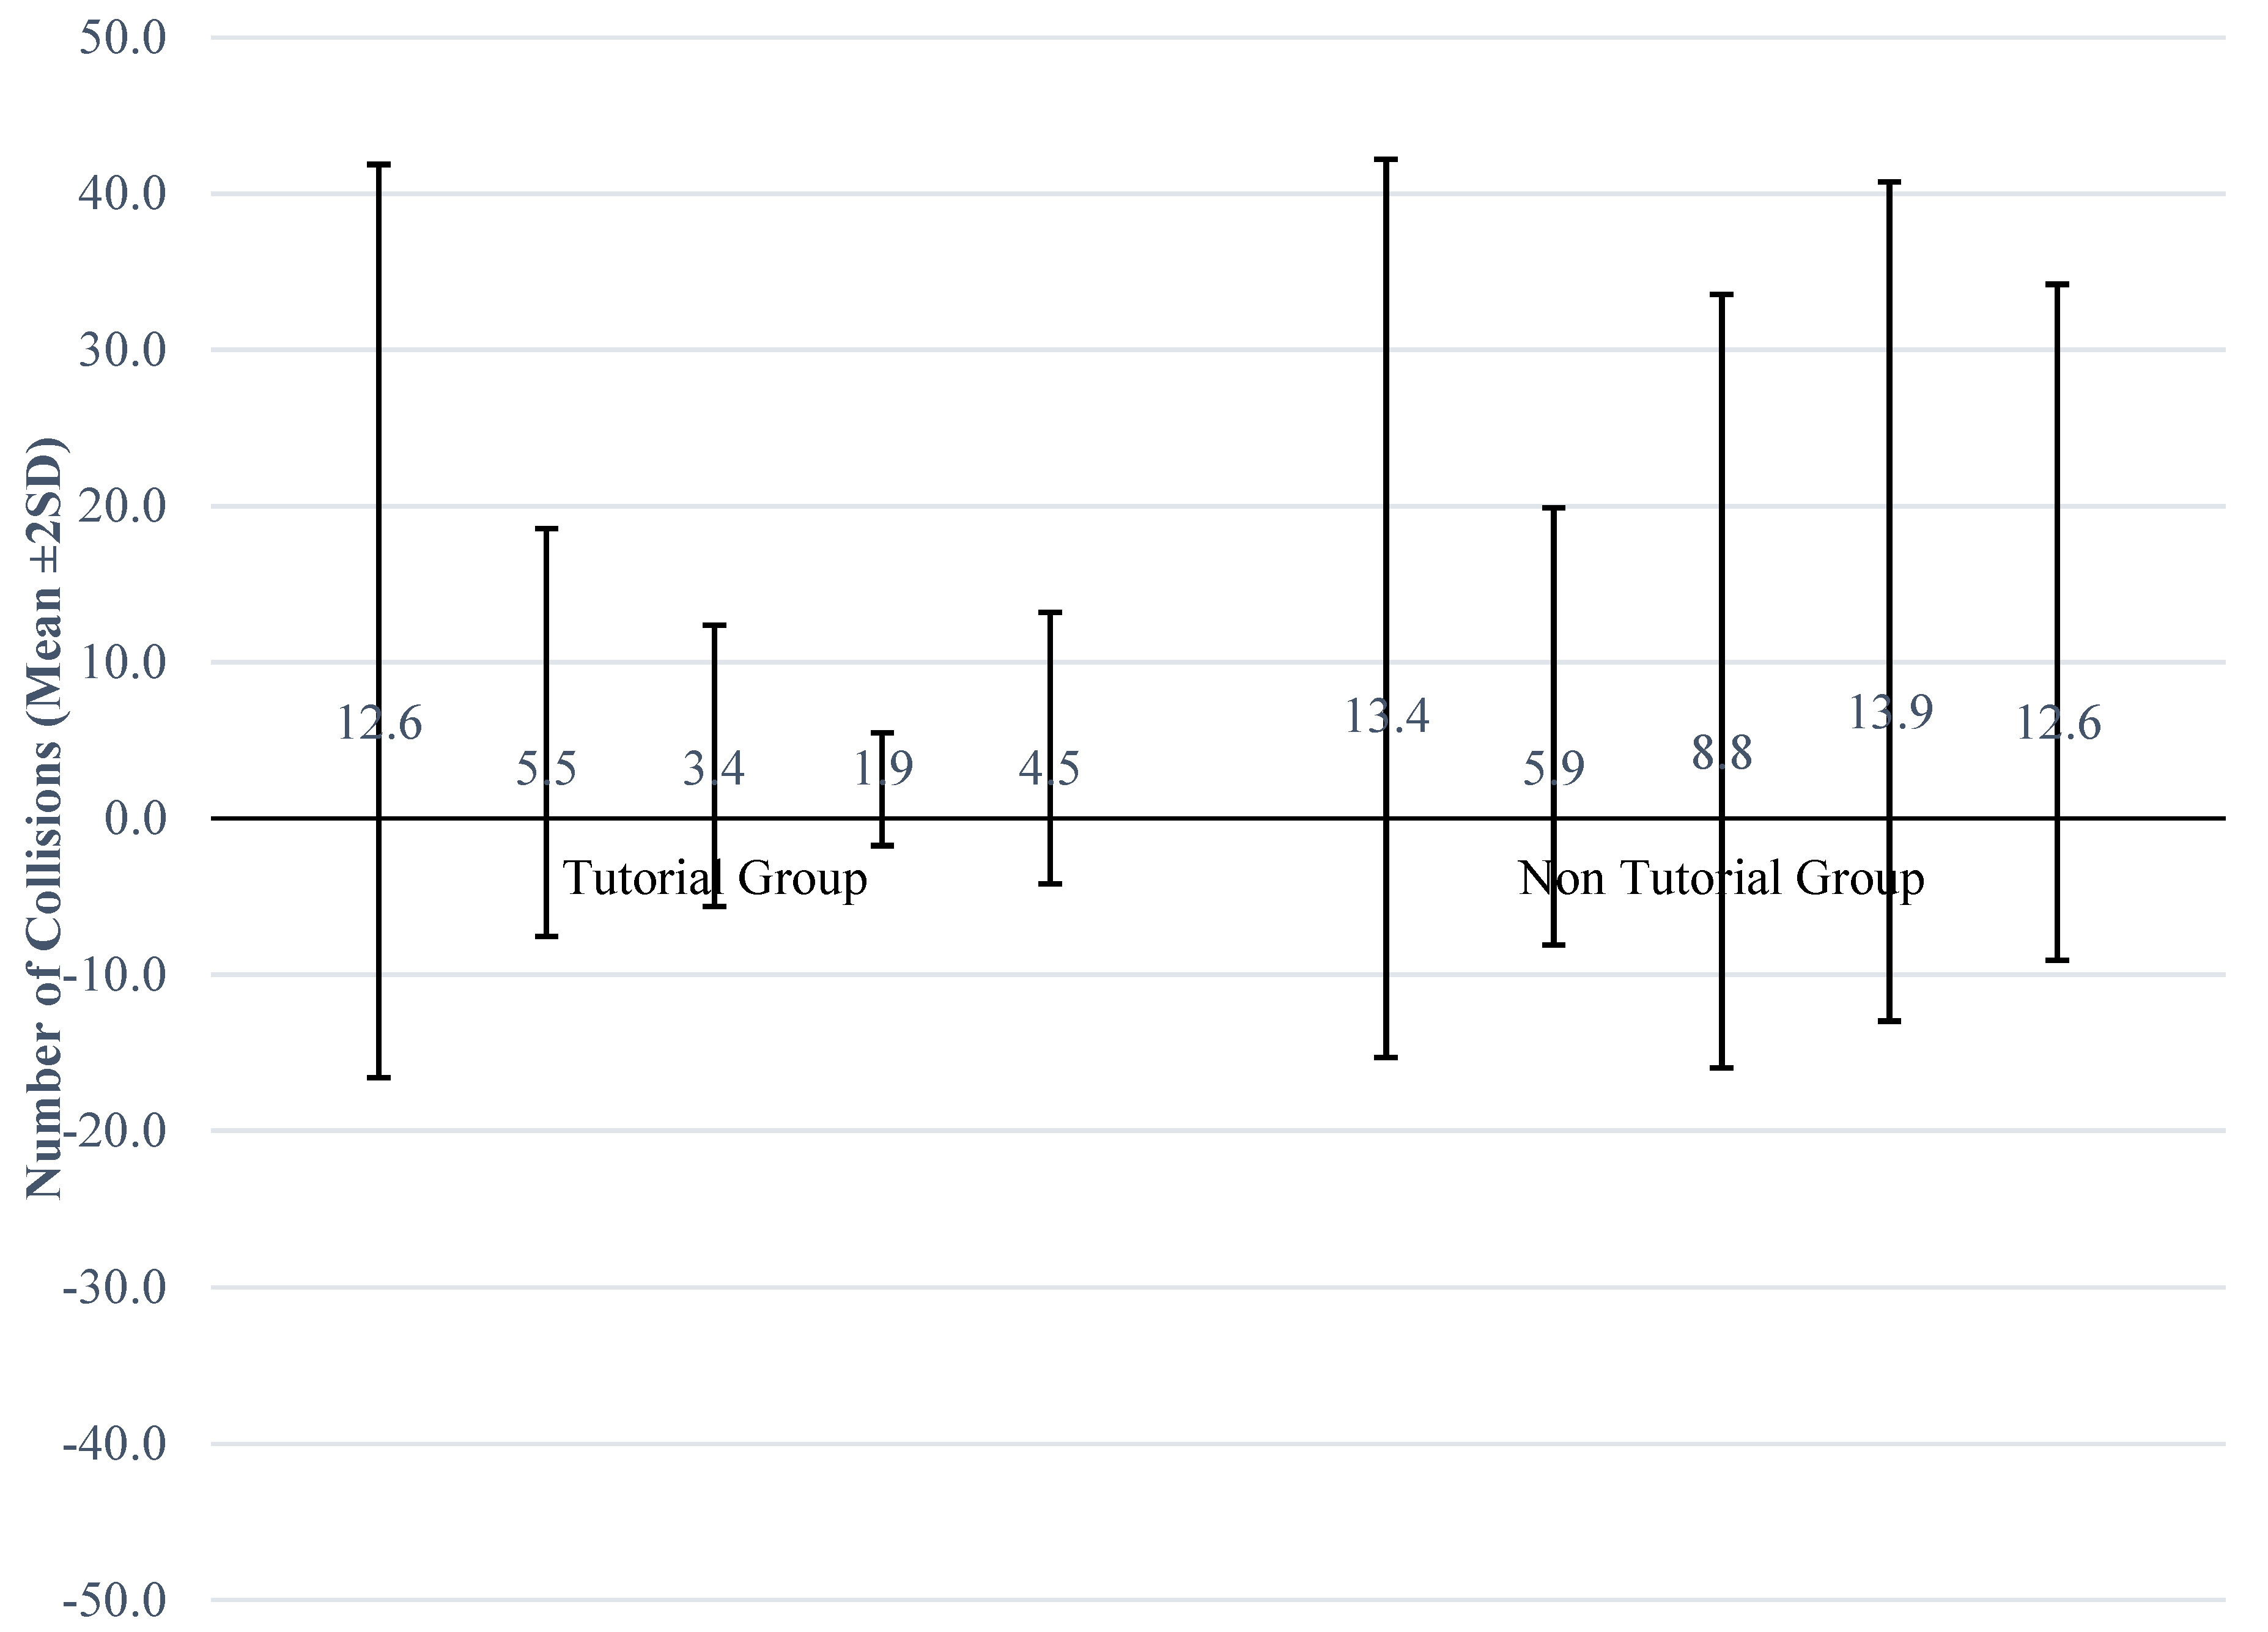
The lack of significance for the collision variable was largely due to the large variability in response demonstrated in Figure 3. A standard deviation error bar graph was created to demonstrate the high levels of variance in total number of collisions across each session, as a function of tutorial vs. non-tutorial groups (Figure 3). Descriptively, the variance in the non-tutorial group appears to be greater across the five sessions whereas the variance in the tutorial group appears to be decreasing across time.
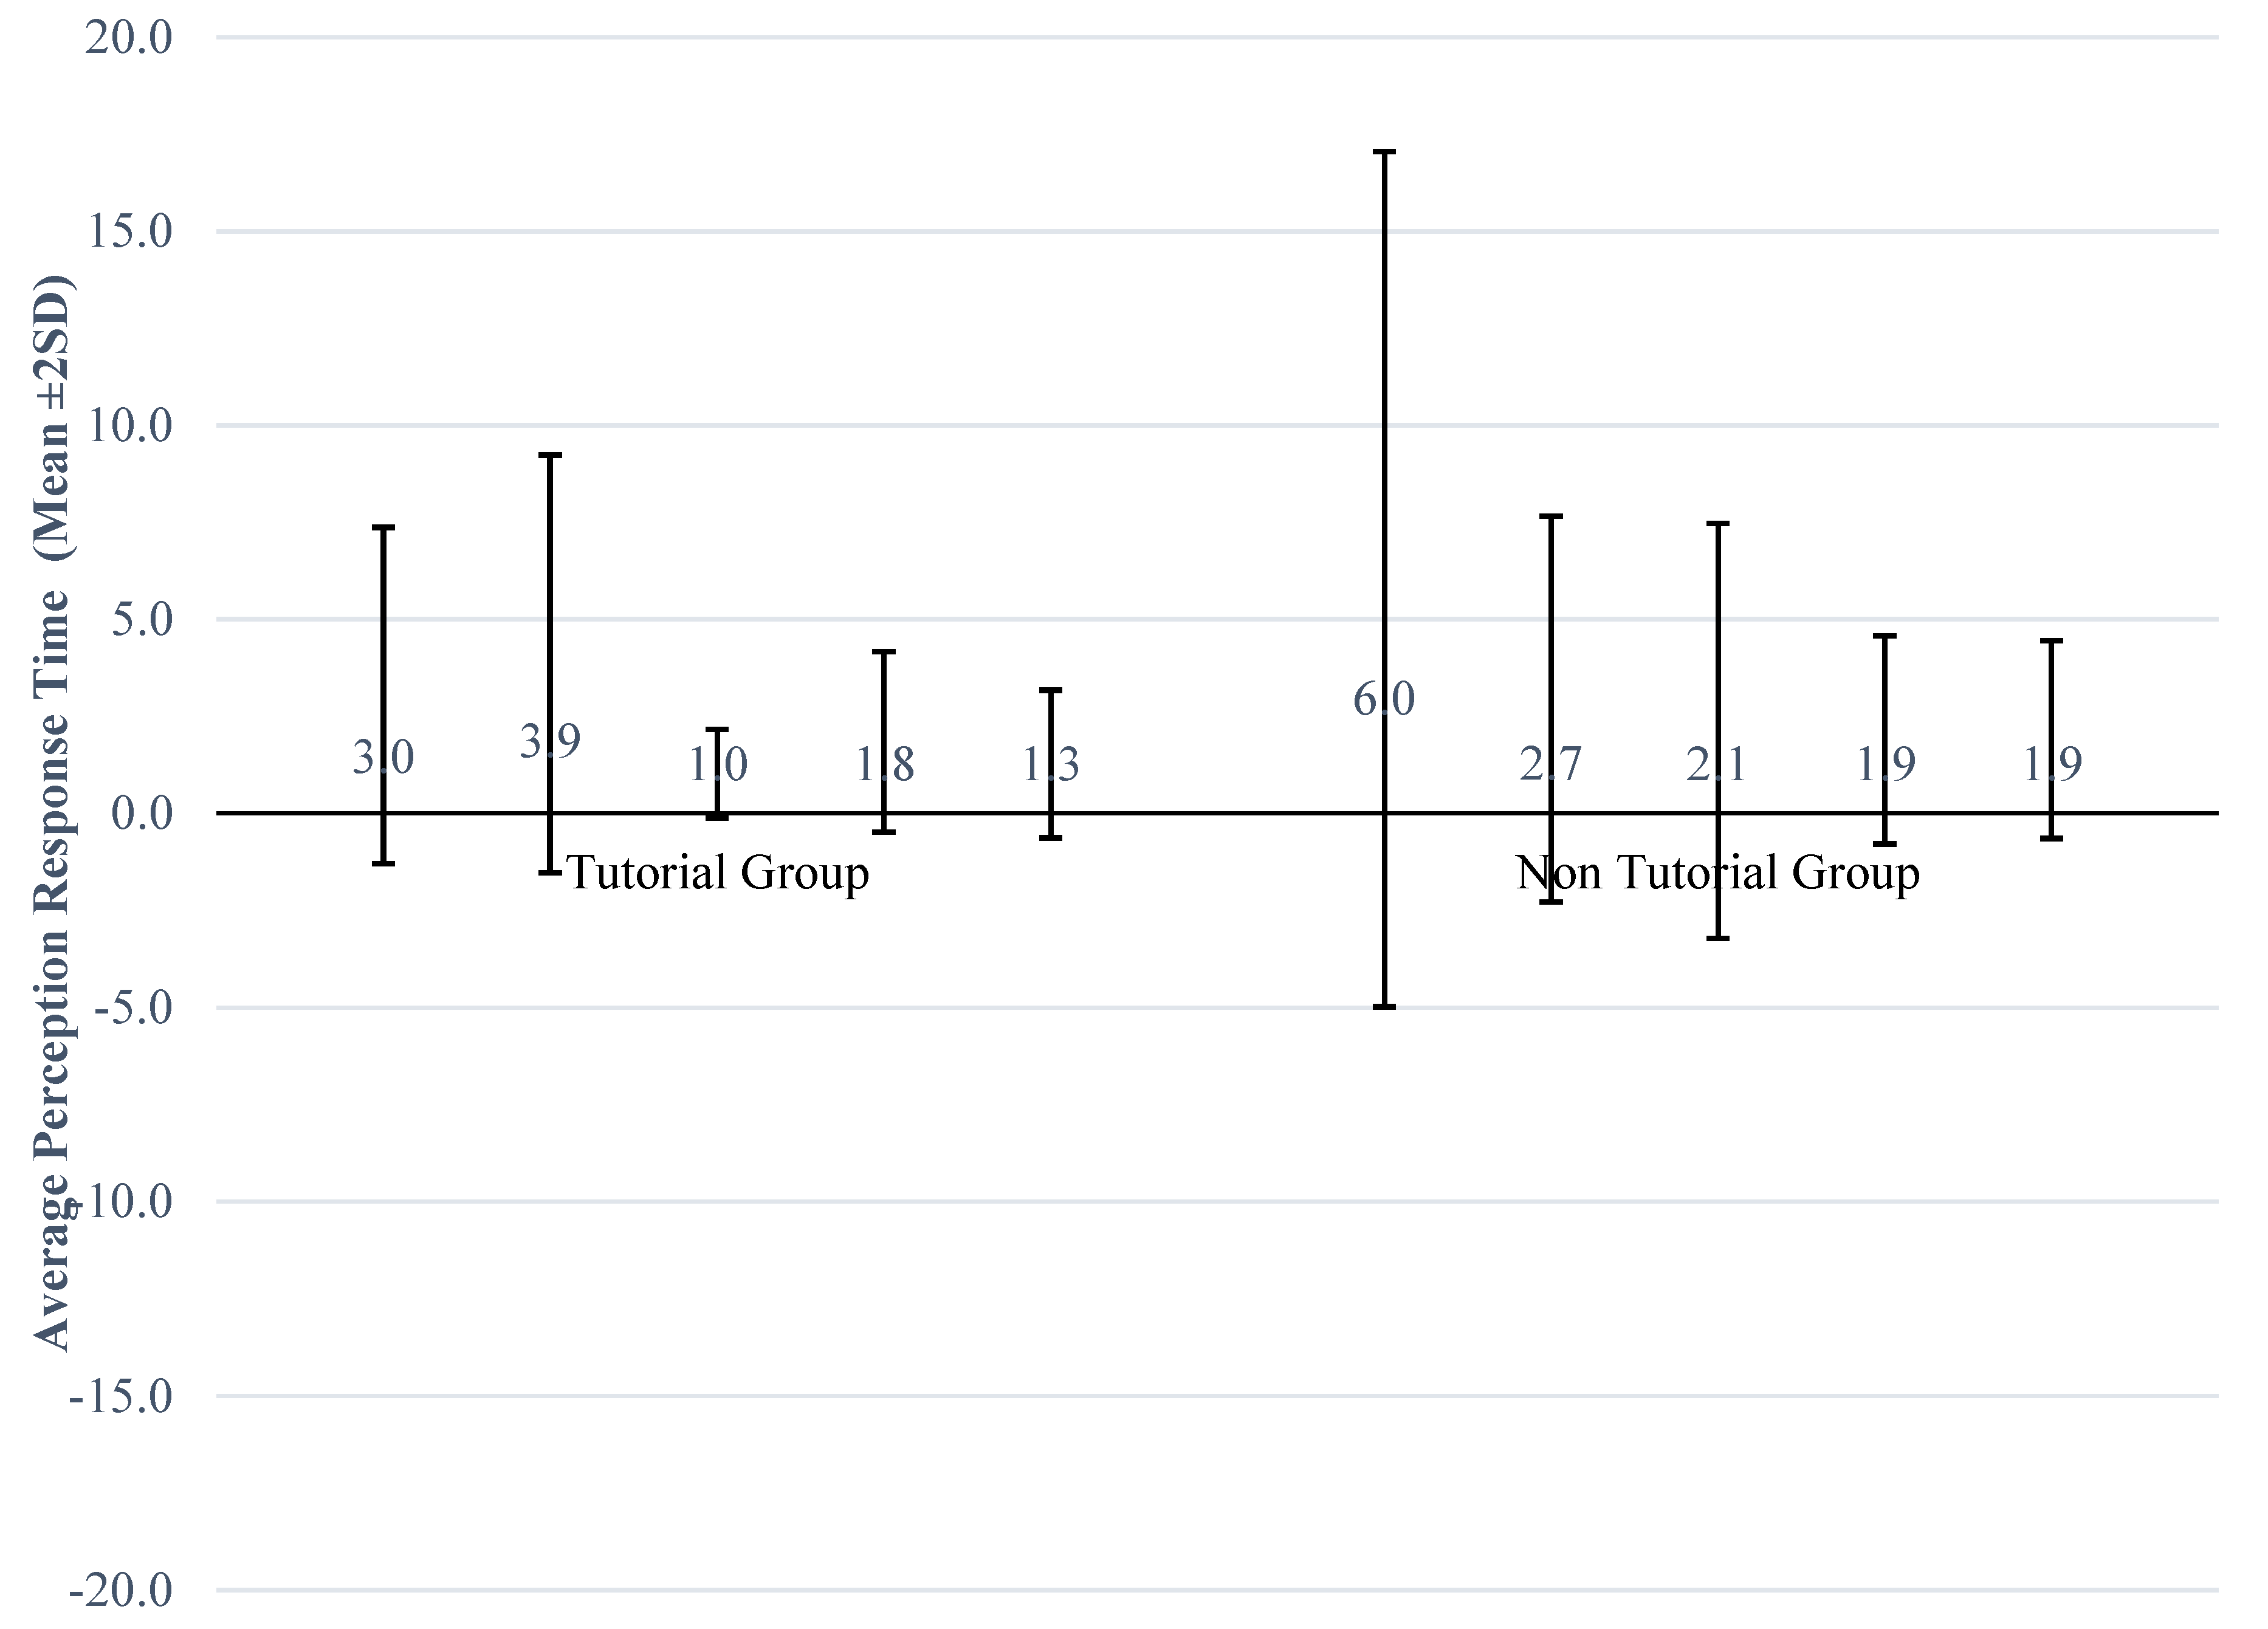
A second standard deviation error bar graph was created to demonstrate the variance present in perception response times for each session while separating the tutorial and non-tutorial groups (Figure 4). The effect is not as pronounced for the perception response times as compared to the number of collisions, but still appears to be consistently larger across the time points in the non-tutorial group than the tutorial group.
Therefore, a mixed-effect multilevel regression test was used to test the assumption that the differences between the two tutorial groups on the measure of collisions was normally distributed. This test produced a significant Wald chi square of 12.29 (p = 0.0065).
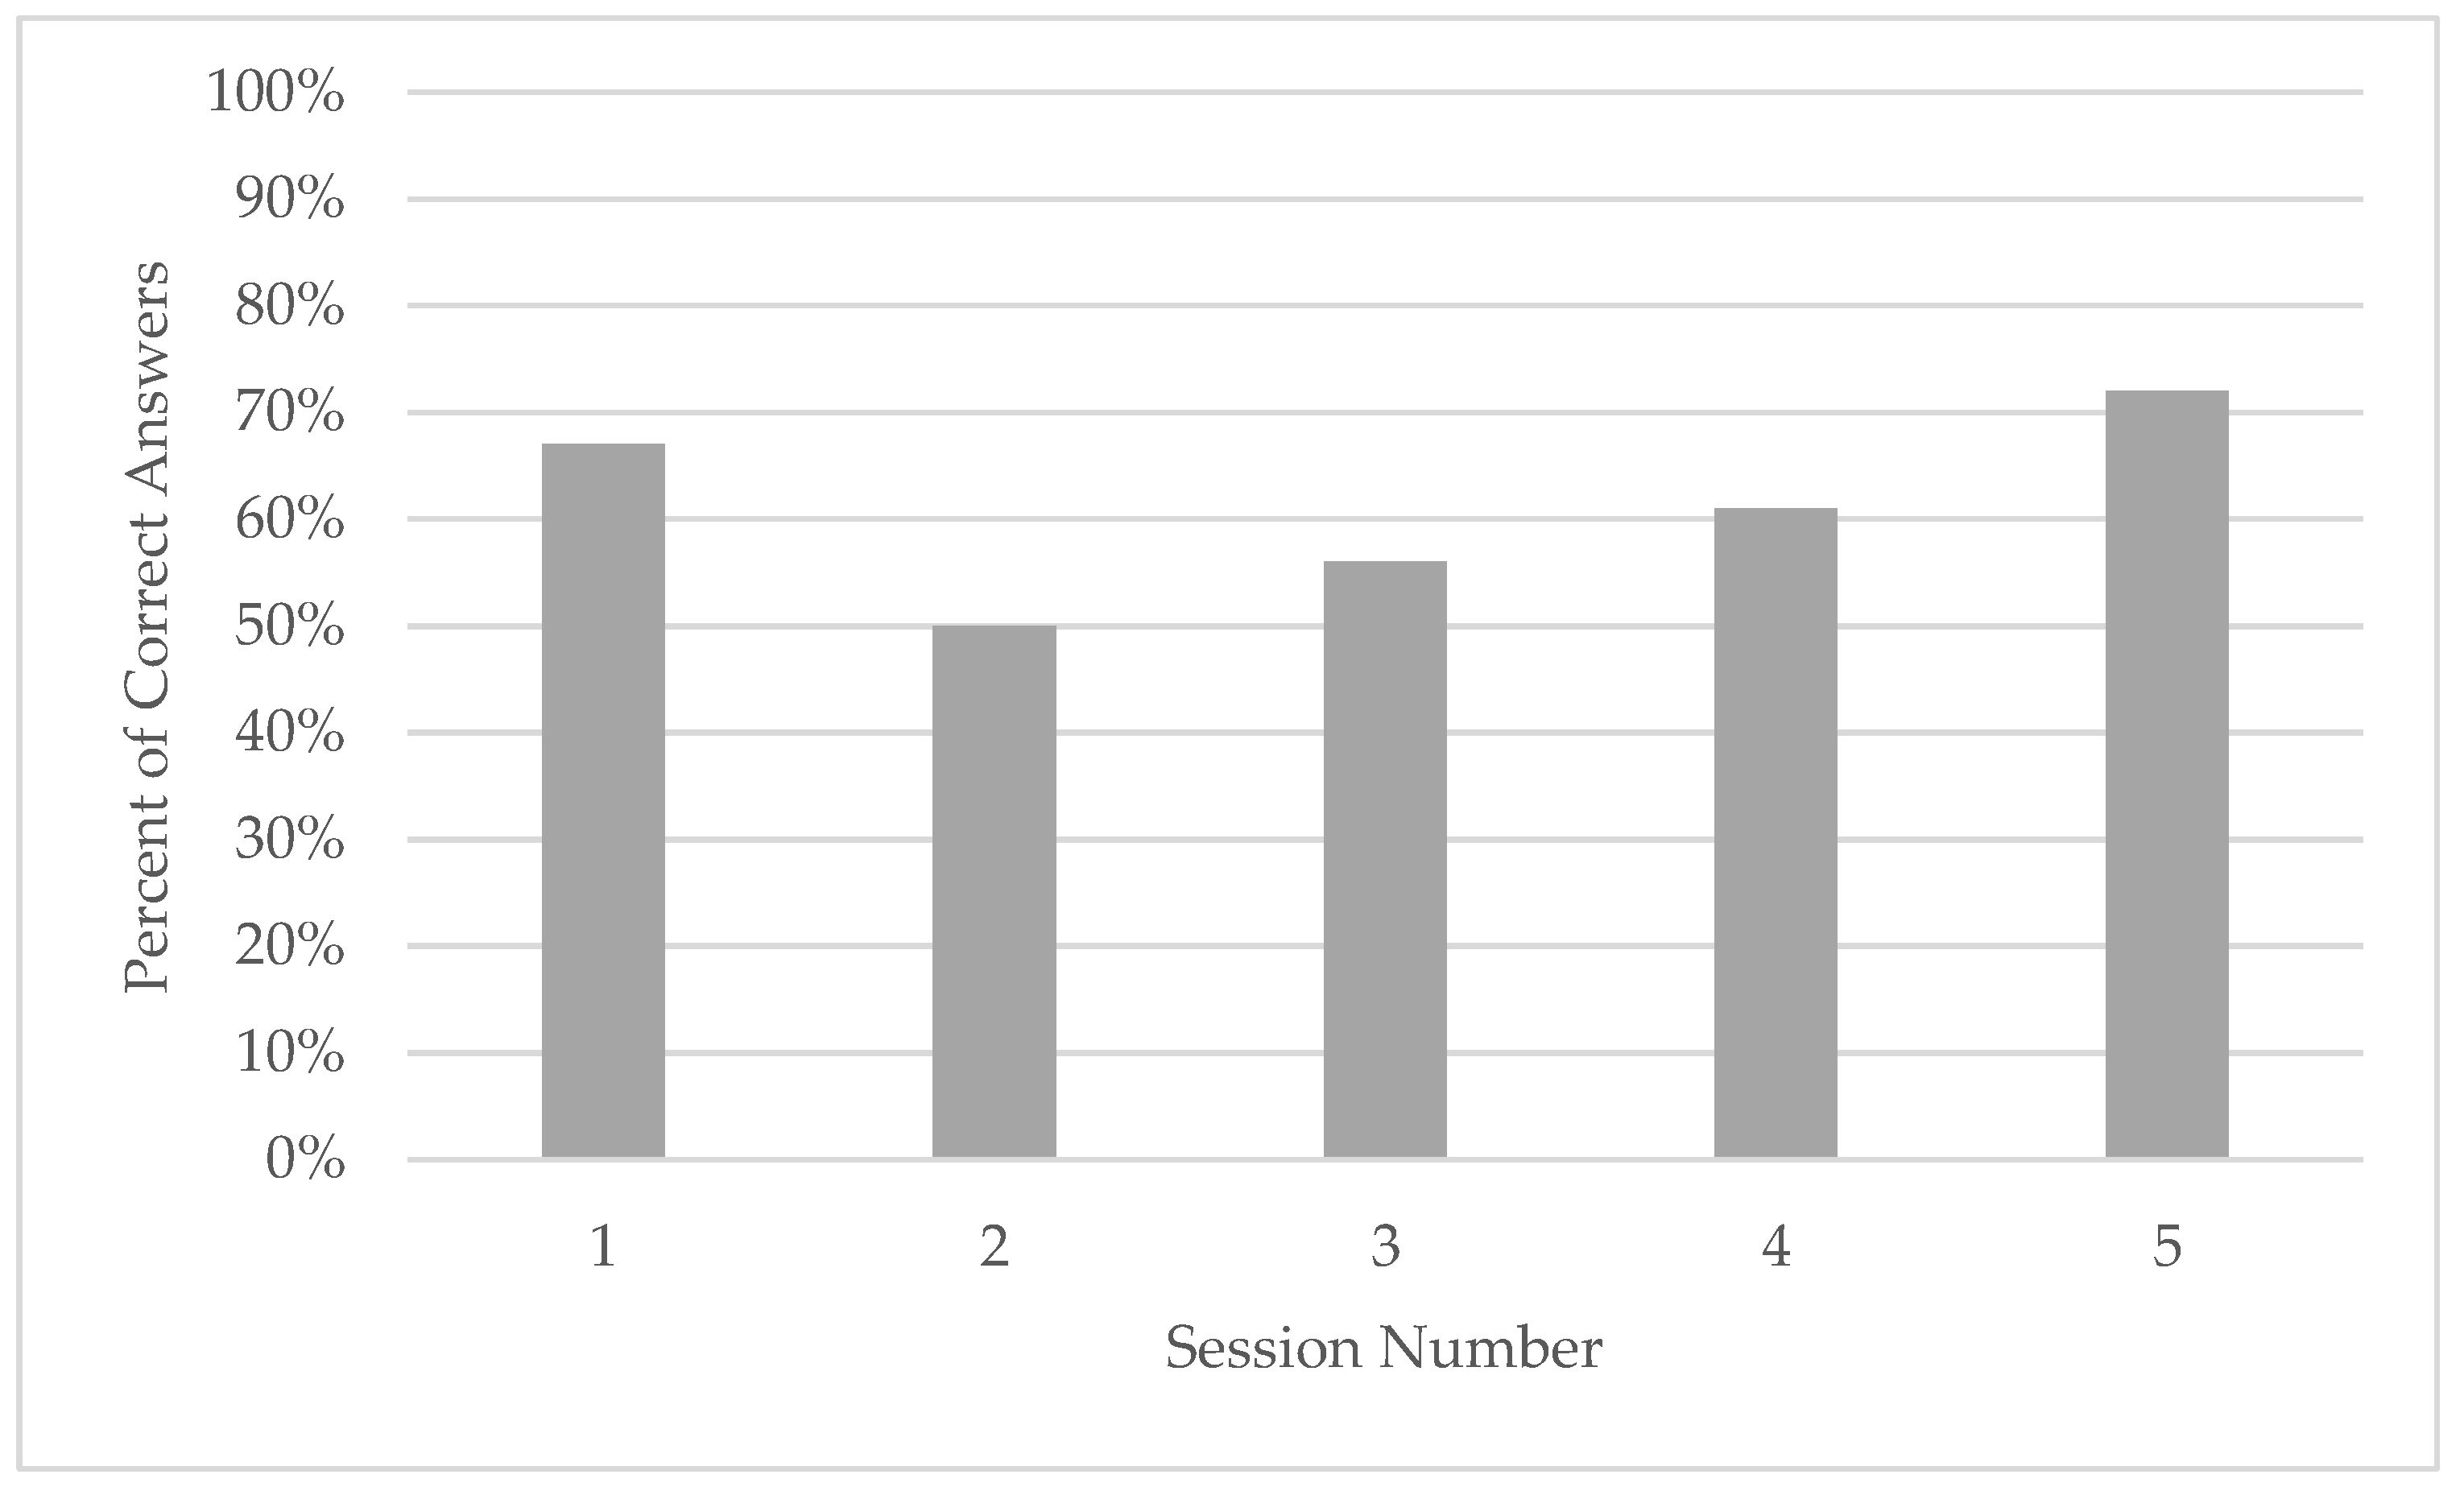
Finally, there was no significant difference between tutorial and non-tutorial groups and their ability to answer the situational awareness questions. The tutorial group scored 3.4/5 (68%) correct while the non-tutorial group scored 2.7/5 (54%) correct. Although there was an attempt to randomize the six situational awareness questions that were asked after each five-minute session, if the participant did not pass certain simulator features (i.e., the refuge door, the broken vent pipe), it was not possible to ask that question following that session. This resulted in a less than optimal randomization procedure. Furthermore, there was large variation in the rate of correct answers between different questions (Table 2). For instance, both mine depth and refuge door were only answered correctly 22 and 29% of the time, respectively, regardless of when they were presented to the participants. In contrast, questions such as gear currently being used, color of vent piping, and location of the broken pipe scored 82% and higher. These variations likely impacted the rate of answering questions correctly as the session progressed (Figure 5). In general, the rate of correctly answering an SA question (irrespective of which question was posed) increased from sessions two through five (50–72%) while session one had participants answering correctly 67% of the time.
4. Discussion
This research study set out to examine the use of a tutorial session to reduce the variability of performance from participants in a mining simulator. A secondary purpose was to explore whether any personality features correlated with physical or cognitive performance in the mining simulator. A large amount of variance obscured any meaningful conclusions that could be made concerning the effect of the up-front tutorial session on SAMS metrics such as collisions and perception response times. Our main interest was in determining whether the five-minute tutorial session could effectively reduce the variability observed with learning to use the SAMS. The Wald chi-square demonstrated there was a significant change in the amount of variance present in the collision data for the group who received the tutorial vs. the group that did not. This suggested that the five-minute tutorial was effective at reducing collisions to a point that could make the number of collisions a meaningful variable to evaluate more complex PAT designs.
When the data from both tutorial and non-tutorial groups were averaged together, the non-parametric tests were able to differentiate a plateau in performance metric variability across the five sessions. This was more apparent in the perception response time where the values dropped significantly beyond the first two sessions. Effectively, once the users had spent 10 min in the simulator, they were responding more consistently as measured by perception response time in trials 3, 4, and 5. Minimally, a 5 min tutorial followed by a 10 min learning phase might eliminate most of the variability in learning to use the SAMS, and produce more consistent responses from participants. Previous research with the SAMS has discussed the need to achieve a set level of competence in the simulator prior to using the participant for a research study [9]. When one takes the average perception response time and collisions from the last three trials in this study (trial 3, 4, and 5), a participant should be responding to pedestrians in the environment with a perception response time of 1.7 seconds and have no more than 8.2 collisions in a period of 5 min to be deemed a competent user of SAMS. Based on this criteria, there are users from this study that would have never achieved this base level of competence and who would be excused from subsequent testing phases. In fact, 6 out of 18 participants would be disqualified from this study based on average collisions exceeding 8.2. If the average of the last three sessions is used, collisions would have disqualified five participants. Using a cutoff criteria of 1.7 s for perception response time would have eliminated 12 out of 18 participants using the average perception response time across all five sessions. Using the average of the last three sessions would have disqualified 7 out of 18 participants, and not necessarily the same ones identified for violating the collision criteria. Using the perception response time achieved in the final session alone eliminated just five participants, but only two of those were also eliminated based on collision data. Clearly, the concept of a base level of competence requires additional confirmation as a way to eliminate individual variability in virtual reality users.
As a secondary purpose, this work investigated whether any personality related variables correlated with performance metrics in SAMS. It is of interest to determine which constructs of mindfulness may be related to improved attention, and by proxy, better performance in the simulator, particularly because mindfulness has been shown to be a trainable state characteristic via interventions [19]. Those with innately high levels of mindfulness and awareness may do better at tasks that require sustained visual attention, such as the pedestrian detection task built into SAMS. With this in mind, several measures of attentional focus were measured and their correlation to performance metrics measured with the SAMS was explored. Despite a lack of significant findings, two relationships are worth noting due to their medium effect size. Firstly, as mindfulness score (measured by the MAAS) increased, there was a concomitant decrease in collisions, suggesting that those with higher levels of mindfulness and attentional-focus had fewer collisions, and were generally more adept at navigating in VR. Likewise, higher cognitive failure scores were correlated with higher perception response times (slower to identify pedestrians) and more missed pedestrians. In this work, those who scored high on the CFQ were more likely to respond slowly to pedestrians in the environment, and were more likely to completely miss pedestrians who appeared. The correlation between CFQ and collisions was not significant, and was actually negative in direction, so it is possible that those who scored higher on CFQ were more focused on reducing collisions in the environment than responding to pedestrians appearing in their vicinity. These findings match previous work by Schmertz et al. in which high mindfulness was linked to low omission rates [13]. Omission rates might be considered an extreme example of lapsed attention, and may be a more accurate reflection of how mindfulness and attention related variables interact with human performance of a work task.
A limited number of situational awareness questions were asked in this study (only one after each session for a total out of five), and there were some large discrepancies between them in how easily they were answered by participants. The question-asking process was also not adequately randomized in this study due to some features being located in specific parts of the environment (i.e., researcher could not ask about “mine depth” if the participant had not passed the location where it was written in the environment). In general, there was an increasing level of accurate responses across time, ranging from a low of 50% correct in session 2 up to 72% in session 5. The first session responses were potentially skewed upwards due to a predominance of participants being asked about pipe color, which had a high correct response rate of 83%. Session 2 was also likely skewed downwards due to a large number of respondents receiving the question about mine depth, which only had a 22% correct response rate. Future work will look to randomize situational awareness questions more adequately, as well as add more complex levels of situational awareness (i.e., Level 2 and 3) questions to the simulator. As expected, there were no significant differences detected on measures of situational awareness scores between those who completed the tutorial and those who did not. The lack of randomization may have contributed to this null result. Furthermore, there was no apparent correlation between the number of correct situation awareness questions and either collisions or perception response time. The tutorial group reached an average of 68% correct while the non-tutorial group was at 54%. Similarly, previous work by Knight had a first round of participants scoring 69%, which improved to 87% once the participants were cued to be looking for certain things in the environment [9]. The increasing rate of correct responses observed in this study may indicate a similar trend, although it is more likely that session 2 was inordinately skewed downwards by a difficult to answer question (mine depth at 22%), while session 5 was skewed upwards by an easily answered question (location of broken pipe at 92%). Thus, on average, across the five sessions, the correct response rate for the entire group was 61%, which is substantially below both trials presented in the work by Knight [9]. A review of question-type, order, and amount is required to improve the ability of the simulator to provide a true test of Level 1 situational awareness.
This work was also initiated in an attempt to find a cut point that would define competent vs. not-competent users. The work by Knight proposed the use of a 75% threshold for correct responses to the SA questions to indicate those with high situational awareness [9]. Taking that value and comparing participants in this work who would have been disqualified based on the suggested performance metric cutoff (i.e., 8.2 collisions or 1.72 s perception response time), we find 4/8 overlap in both categories. In other words, half of those who scored higher on situational awareness in this study would have been disqualified based on high collisions or slow response times. It would seem that when working with novice VR participants, one cannot have highly competent and highly attentive responders. Future work may need to eliminate participants who do not achieve a base level of competence from continuing in the study, in an attempt to get more uniform respondents to the research trial. An additional limitation of this work is the use of novice, undergraduate students as a participant pool. While this population provides an ongoing source of participants with whom we can test a variety of PAT design features, it may not represent the population that will eventually make use of the technology. The role of the simulator is not to determine the only answer but to narrow down the many existing commercial options so that field testing of an optimal system is more efficient.
There are several aspects of the simulator environment that continue to be modified to enhance its capacity of doing research on important topics such as the design of proximity awareness technologies. Although collisions were a performance metric that was tracked by SAMS, and was also provided as feedback to the user as a tallied count on their dashboard, there was no immediate feedback from the simulator that a collision had occurred. This has since been rectified by providing the user with instantaneous audio (breaking glass noise) and visual (cracks on the machine window) information about a collision occurring. The high levels of intra-individual differences continue to challenge the acquisition of meaningful data to answer more complex research questions in the simulator. Possible ways to limit this variance would be to normalize the data in some manner (i.e., expressing total collisions in each session as a percent of total collisions across all sessions). Further, another study that limits participants to those who have met one of the performance metric cutoff values discussed above (either collisions or perception response time) may demonstrate that a less variable cohort can be achieved.
5. Conclusions
In conclusion, a high degree of variability among participants remained although the effect of a tutorial session appears to reduce the variability rate, which is positive for future research efforts. The level of immersion in the simulator will continue to increase with the addition of more realistic environments, and built-in artificial intelligence features, which may help users feel more immersed in the process and produce more consistent responses to the environment. More advanced situational awareness concepts will be added to the simulator to improve the realism of questions that are asked of the participants. Based on the findings in this study, a minimum of 5 min of tutorial plus 10 min of practice time in the simulator will be used prior to future studies.
Author Contributions
This paper was made possible due to the following contributions by authors as follows: conceptualization, C.N. and C.K.; methodology, C.K. and C.N.; software, A.L.; formal analysis, C.N. and A.G.; resources, A.G.; data curation, C.N. and A.G.; writing—original draft preparation, C.N.; writing—review and editing, A.G.; visualization, A.G.; supervision, A.G. and A.L.; project administration, A.G.; funding acquisition, A.G.
Funding
This research received no external funding.
Acknowledgments
We would like to acknowledge the contribution of Bruce Oddson in the statistical analysis of this data and the custom programming provided by Stefan Klaassen.
Conflicts of Interest
The authors declare no conflict of interest.
References
- Godwin, A.A.; Eger, T.R.; Salmoni, A.D.; Dunn, P.G. Virtual design modification yield line-of-sight improvements for LHD operators. Int. J. Ind. Ergon. 2008, 38, 202–210. [Google Scholar] [CrossRef]
- Boocock, M.G.; Weyman, A.K.; Corlett, T.C.; Naylor, J. The problems of restricted visibility from free-steered mining vehicles. Vis. Veh. 1996, 5, 355–362. [Google Scholar]
- Groves, W.A.; Kecojevic, V.J.; Komljenovic, D. Analysis of fatalities and injuries involving mining equipment. J. Saf. Res. 2007, 38, 461–470. [Google Scholar] [CrossRef]
- Sanmiquel, L.; Freijo, M.; Edo, J.; Rossell, J. Analysis of work related accidents in the Spanish mining sector from 1982–2006. J. Saf. Res. 2010, 41, 1–7. [Google Scholar] [CrossRef]
- Schutte, P.C.; Shaba, M.N. Ergonomics of Mining Machinery and Transport in the South African Mining Industry; CSIR Mining Technology, Project Number SIM 02 05 04. Safety in Mines Research Advisory Committee, 2003. Available online: https://researchspace.csir.co.za/dspace/handle/10204/1297 (accessed on 5 December 2018).
- Ruff, T.M. Monitoring Blind Spots: A Major Concern for Haul Trucks. Eng. Min. J. 2001, 202, 17–26. [Google Scholar]
- MDG 2007. Guideline for the Selection and Implementation of Collision Management Systems for Mining; NSW Government, Trade & Investment Mine Safety, 2013. Available online: https://www.resourcesandenergy.nsw.gov.au/__data/assets/pdf_file/0004/507316/MDG-2007-Guideline-for-the-selection-and-implementation-of-collision-management-systems-for-mining-2014.pdf (accessed on 5 August 2018).
- Tichon, J.; Burgess-Limerick, R. A review of virtual reality as a medium for safety related training in mining. J. Health Saf. Res. Pract. 2011, 3, 33–40. [Google Scholar]
- Knight, C.E.J. The Mediating Role of Mindfulness, Attention and Situational Awareness on Driving Performance in a Virtual Reality Underground Mine. Master’s Thesis, Laurentian University, Sudbury, ON, Canada, 2018. [Google Scholar]
- Kass, S.J.; VanWormer, L.A.; Mikulas, W.L.; Legan, S.; Bumgarner, D. Effects of Mindfulness Training on Simulated Driving: Preliminary Results. Mindfulness 2011, 2, 236–241. [Google Scholar] [CrossRef]
- Sneddon, A.; Mearns, K.; Flin, R. Situation awareness and safety in offshore drill crews. Cogn. Technol. Work 2006, 8, 255–267. [Google Scholar] [CrossRef]
- Schmertz, S.K.; Anderson, P.L.; Robins, D.L. The relation between self-report mindfulness and performance on tasks of sustained attention. J. Psychopathol. Behav. Assess 2009, 31, 60–66. [Google Scholar] [CrossRef]
- Brown, K.W.; Ryan, R.M. The benefits of being present, Mindfulness and its role in psychological well-being. J. Pers. Soc. Psychol. 2003, 84, 822–848. [Google Scholar] [CrossRef] [PubMed]
- Broadbent, D.E.; Cooper, P.F.; FitzGerald, P.; Parkes, K.R. The cognitive failures questionnaire (CFQ) and its correlates. Br. J. Clin. Psychol. 1982, 21, 1–16. [Google Scholar] [CrossRef]
- Barragán, D.; Roberts, D.M.; Baldwin, C.L. Validation of the Attention-Related Driving Errors Scale (ARDES) in an English-Speaking Sample. Hum. Factors 2006, 58, 1262–1274. [Google Scholar] [CrossRef]
- Endsley, M.R.; Garland, D.J. Theoretical underpinnings of situation awareness: A critical review. In Situation Awareness Analysis and Measurement, 1st ed.; CRC Press: Boca Raton, FL, USA, 2000; ISBN 978080582. [Google Scholar]
- Weber, E.U.; Blais, A.R.; Betz, N. A domain-specific risk-attitude scale: Measuring risk perceptions and risk behaviors. J. Behav. Decis. Mak. 2002, 15, 263–290. [Google Scholar] [CrossRef]
- Benjamini, Y.; Hochberg, Y. Controlling the false discovery rate: A practical and powerful approach to multiple testing. J. R. Stat. Soc. 1995, 57, 289–300. [Google Scholar] [CrossRef]
- Zeidan, F.; Johnson, S.K.; Diamond, B.J.; David, Z.; Gollkasian, P. Mindfulness meditation improves cognition: Evidence of brief mental training. Conscious Cogn. 2010, 19, 597–605. [Google Scholar] [CrossRef] [PubMed]
Figure 1.
User with virtual reality (VR) headset navigating on load-haul-dump (LHD) machine in the virtual mine environment.
Figure 1.
User with virtual reality (VR) headset navigating on load-haul-dump (LHD) machine in the virtual mine environment.

Figure 2.
Average perception response time (sec) across time for all participants. * p was significant using the False Detection Rate (FDR) correction rate.
Figure 2.
Average perception response time (sec) across time for all participants. * p was significant using the False Detection Rate (FDR) correction rate.

Figure 3.
Standard deviation error bar of collisions from each session vs. tutorial and non-tutorial groups.
Figure 3.
Standard deviation error bar of collisions from each session vs. tutorial and non-tutorial groups.

Figure 4.
Standard deviation error bar of perception response time from each session vs. tutorial and non-tutorial groups.
Figure 4.
Standard deviation error bar of perception response time from each session vs. tutorial and non-tutorial groups.

Figure 5.
Rate of correctly answering situational awareness questions as a function of sessions.


Table 1.
Spearman Correlation results of questionnaire scores against total collisions, average perception response time, and missed pedestrians. CFQ = Cognitive Failures Questionnaire; MAAS = Mindful Attention Awareness Scale; DOSPERT = Domain-Specific Risk-Taking Scale.
Table 1.
Spearman Correlation results of questionnaire scores against total collisions, average perception response time, and missed pedestrians. CFQ = Cognitive Failures Questionnaire; MAAS = Mindful Attention Awareness Scale; DOSPERT = Domain-Specific Risk-Taking Scale.
| Questionnaire | Missed Pedestrians | Total Collisions | Average Perception Response Time |
|---|---|---|---|
| Correlation (r) | Correlation (r) | Correlation (r) | |
| CFQ | 0.623 * | −0.170 | 0.310 |
| MAAS | −0.188 | −0.425 | −0.148 |
| DOSPERT | 0.024 | −0.082 | −0.188 |
| DOSPERT HEALTH ONLY | 0.008 | −0.177 | −0.041 |
* p < 0.05.
Table 2.
Rate of correct answers by question type.
| Situational Awareness Question | % Correct |
|---|---|
| Mine Depth | 22% |
| Gear Currently Driving | 82% |
| Number of Collisions (tally) | 50% |
| Ventilation Pipe Color | 83% |
| Location of Broken Pipe | 92% |
| Color of Refuge Door | 29% |
© 2019 by the authors. Licensee MDPI, Basel, Switzerland. This article is an open access article distributed under the terms and conditions of the Creative Commons Attribution (CC BY) license (http://creativecommons.org/licenses/by/4.0/).
Share and Cite
MDPI and ACS Style
Nickel, C.; Knight, C.; Langille, A.; Godwin, A. How Much Practice Is Required to Reduce Performance Variability in a Virtual Reality Mining Simulator? Safety 2019, 5, 18. https://0-doi-org.brum.beds.ac.uk/10.3390/safety5020018
AMA Style
Nickel C, Knight C, Langille A, Godwin A. How Much Practice Is Required to Reduce Performance Variability in a Virtual Reality Mining Simulator? Safety. 2019; 5(2):18. https://0-doi-org.brum.beds.ac.uk/10.3390/safety5020018
Chicago/Turabian StyleNickel, Courtney, Carolyn Knight, Aaron Langille, and Alison Godwin. 2019. "How Much Practice Is Required to Reduce Performance Variability in a Virtual Reality Mining Simulator?" Safety 5, no. 2: 18. https://0-doi-org.brum.beds.ac.uk/10.3390/safety5020018
Note that from the first issue of 2016, this journal uses article numbers instead of page numbers. See further details here.