Impact of Various Clothing Variations on Firefighter Mobility: A Pilot Study


1
Bond Institute of Health and Sport, Bond University, Gold Coast, QLD 4229, Australia
2
Tactical Research Unit, Bond University, Gold Coast, QLD 4229, Australia
*
Author to whom correspondence should be addressed.
Safety 2019, 5(4), 78; https://0-doi-org.brum.beds.ac.uk/10.3390/safety5040078
Submission received: 15 September 2019
/
Revised: 22 October 2019
/
Accepted: 28 October 2019
/
Published: 31 October 2019
Abstract
:Firefighter clothing is known to restrict movement and increase the risk of musculoskeletal injury. The aim of this study was to investigate differences between clothing variations and firefighter mobility. Data were collected from eight firefighters using a randomized counterbalanced, repeated measures, design. Three different clothing variants (V1–V3) in addition to current station wear (S) were trialed. Combinations of S and V1 (SV1) and V2 (SV2) were also trialed. Outcome measures included: standing reach height; the Functional Movement Screen [FMS]; vertical jump; a visual analogue scale [VAS] for the FMS, vertical jump, step ups and crawl; and a mannequin sketch to mark areas of discomfort. V3 was preferred over S in all tasks and performed better both objectively (FMS and vertical jump) and subjectively (VAS scores). While V1 was typically associated with poorer performance, the impacts of V1 and V2 when compared to each other and S varied depending on the tasks performed. This variation was greater when V1 or V2 were worn with S (SV1 and SV2). Areas of discomfort across all variations was the knees, followed by the thighs. Clothing that has the least impact on, or improves, mobility (especially around the lower limbs) may help reduce firefighter injury and limit subjective discomfort.
1. Introduction
Firefighters perform tasks that can include fire suppression, person rescue, climbing stairs and ladders, and alighting to and from fire vehicles [1,2]. Whilst these tasks can often be performed in confined spaces and poor visibility [3], the firefighter can concurrently be exposed to extreme heat (e.g., 571.5 °C at ceiling height [1]). To protect officers from these austere environmental conditions, personal protective equipment (PPE) is worn. This PPE includes turn-out/bunker clothing, gloves, helmet, and various self-contained breathing apparatus (SCBA) [3] and can weigh between 17 and 25 kg [1,2].
As with other tactical occupations where load carriage is a requirement, such as in law enforcement (10 to 22 kg [4,5]) and the military (up to 45+ kg [6,7]), the loads carried by firefighters can increase their risk of physical injuries [8]. These injuries range from neurological injuries (like meralgias and brachial plexus palsy [9,10]) to the more typical musculoskeletal injuries (like sprains, strains, and fractures [11,12]). Furthermore, for the firefighter, carrying these loads can increase their risk of a slip, trip or fall when conducting fire suppression tasks in urban environments [13]. For example, in a study by Park et al. (2010) where obstacles were used to simulate debris faced by firefighters wearing a 9.1 kg load, 42 % (10 of 24) of participants made contact, at least once, with a 30 cm obstacle while stepping over it. Conversely, in wildland firefighters, a 15 kg pack was found to significantly increase their time to negotiate escape routes during a wilderness fire forced evacuation [14].
In addition to the load weights, the nature of the equipment and clothing worn by firefighters is thought to impact both their performance and injury risk. The bulkiness and rigidity of the PPE clothing worn by firefighters, for example, is known to reduce their mobility and has been considered to increase the risk of injury through increasing the potential for a slip, trip or fall [2,3,15]. SCBA and boot sizes (heights), in particular, have been associated with reducing mobility, increasing physical stress, and increasing the risk of slips, trips, and falls (3). As such, it is not surprising that the wearing of SCBA and boots are major contributors to fireground musculoskeletal injuries [3].
Given that slips, trips, and falls are a common mechanism for firefighter injuries to occur, and that the PPE worn by firefighters can increase their risk of a slip, trip, or fall, research investigating the impacts of different firefighter PPE clothing variations on their mobility may be of value and provide a means of optimising clothing design and development in order to mitigate these injuries. Furthermore, as not all injuries occur while performing fire suppression tasks, the impacts of different firefighter clothing in general (e.g., daily station wear) on mobility may be of value. However, there is no known research comparing different clothing variations and firefighter mobility specifically. As such, the aim of this research was to compare the impacts on firefighter mobility of three different clothing variations against each other and a baseline measure (current daily station wear).
2. Materials and Methods
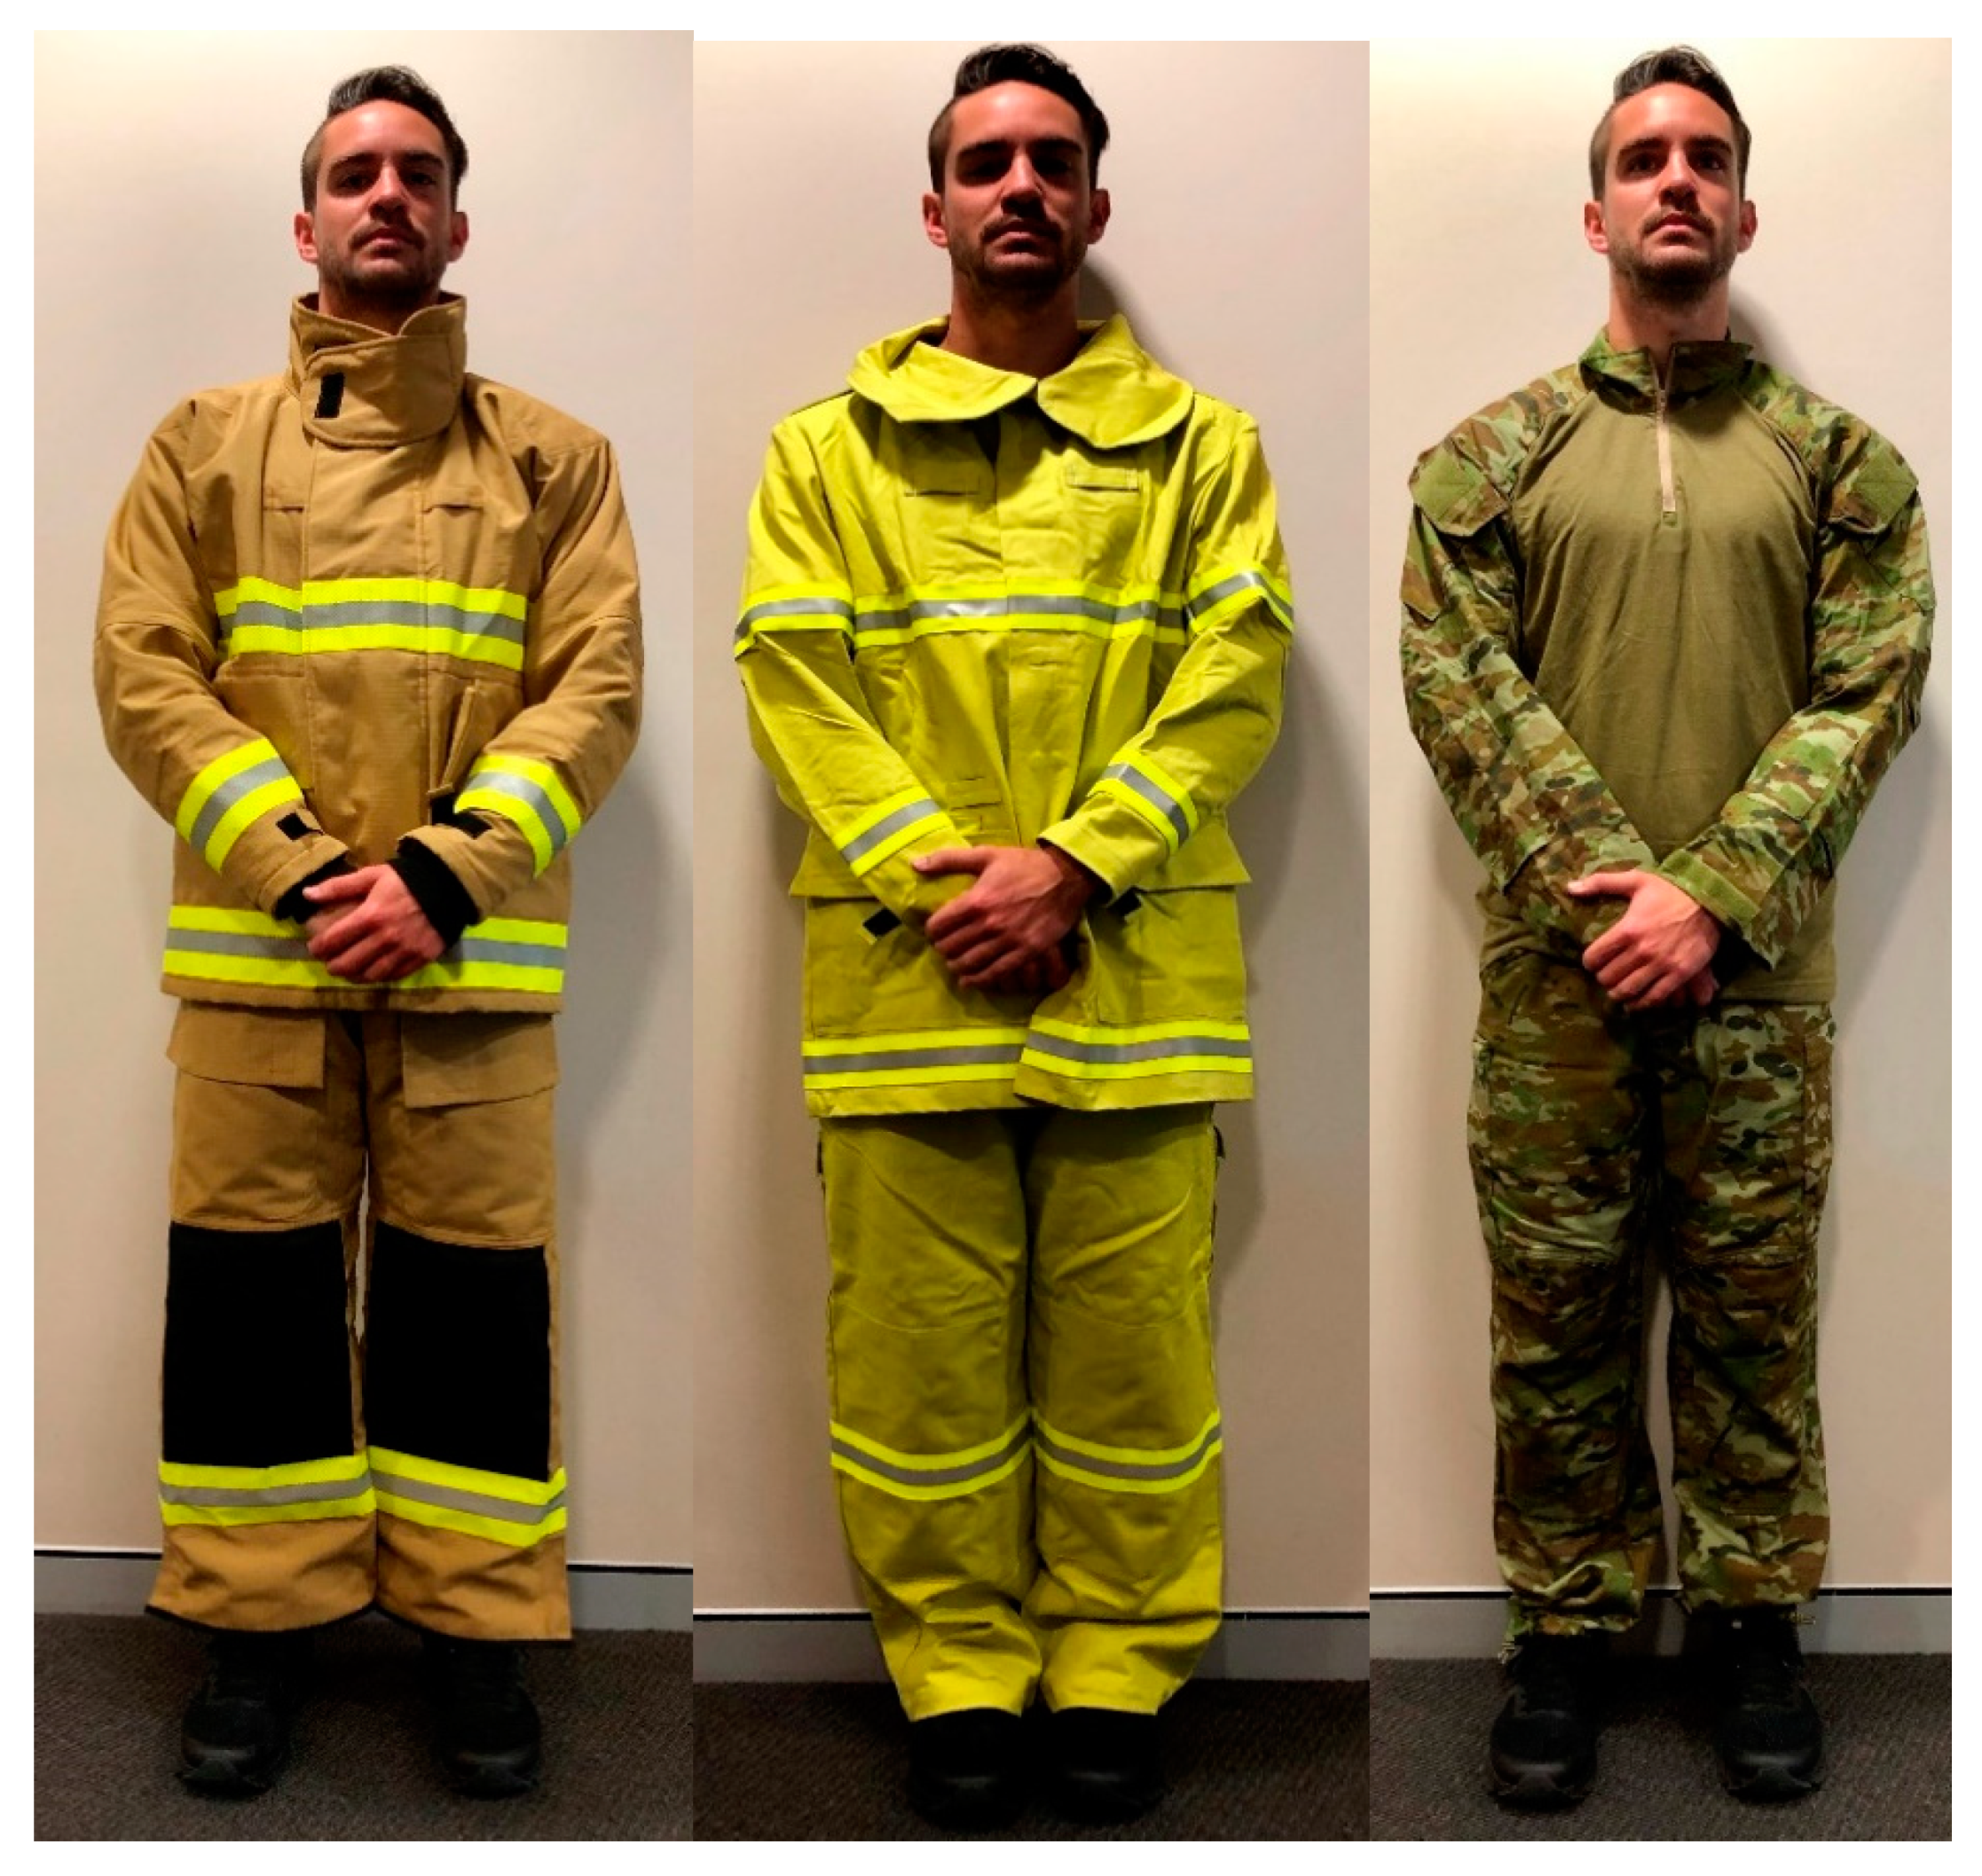
A prospective, within-subjects, repeated measures study design was used. Volunteer firefighters wore their allocated station wear to establish baseline measures before being allocated one of three different clothing variations (Version 1–3 [V1–V3]—see Figure 1). To determine the combined effect of wearing both station wear and Versions 1 and 2, firefighters were then randomly allocated to a combination group of station wear and either Version 1 or 2 (SV1 and SV2) with two firefighters available to complete both combinations (SV1 and SV2—also in a randomized order). Officers wore their allocated clothing ensemble for the duration of a round of assessments, not changing until all assessments with an allocated clothing ensemble was complete. The firefighters wore their standard issued boots with all clothing ensembles for every assessment.
This study design meant that each of the firefighters acted as their own control, mitigating any effects of learning or fatigue by having the firefighters wearing clothing in a counterbalanced design. In this way, if any learning or fatigue effect were derived from one round of assessments the impact of this learning or any fatigue effects would equally affect results for each clothing ensemble, giving no one design an unfair advantage or disadvantage over another. Ethics approval associated with the research methodology was gained from the Bond University Human Research Ethics Committee on 6 September 2018 (protocol number 15803 amendment 3).
2.1. Clothing Variants
The baseline clothing measure was the officer’s current standard issue station wear. This clothing consisted of their currently issued and preferred boots, trousers and short sleeve t-shirt. Station wear can be, and often is, worn underneath their fire suppression clothing, but this may not always be the case. These variations in station wear are dependent on time available to prepare to leave the station, personal preference, and situational requirements. The V1 clothing variant was a structural firefighting ensemble of typical design and comparable with all issued ensembles Australia wide. V1 was constructed from a combination of an aramid outer, a Silicon-based standard moisture barrier, and aramid liner. The V2 variant was a typical ensemble worn by wildland firefighters and was constructed from one fabric substrate using a cotton base with a Proban treatment. The V3 design was similar to a standard military operational combat uniform noting that all materials used in the design were non-melt/non-drip. The trouser base fabric was made from 75% cotton and 25% polyester with a unique secondary stretch base fabric utilised in the crotch and gusset area. This stretch fabric was designed to enable movements in restrictive areas of the trouser. The shirt likewise used a 75% cotton and 25% polyester base fabric with an anti-wicking knit fabric through the body. Given that station wear may or may not be worn underneath the fire suppression clothing (V1 and V2), both conditions were assessed. By assessing both conditions, further insights could be gained as to the impacts of the individual clothing items (station wear, V1 and V2) on mobility as well as the combined effects. V3, was assessed as an initial variant to current station wear given that station wear is typically worn around the station during normal day to day tasks and that these day to day tasks are associated with injuries.
2.2. Participants
Participants (n = 8) were volunteers recruited through a local fire department and fire and rescue training center included firefighter trainees (male: n = 3; mean age = 30.67 ± 9.50 years; mean height = 181.33 ± 7.57cm; mean body mass = 91.67 ± 16.17 kg) and qualified officers (male: n = 4; female n = 1; mean age = 39.40 ± 6.73 years; mean height = 177.20 ± 7.60 cm; mean body mass = 88.20 ± 11.32 kg; mean years’ experience = 8.00 ± 6.96 years). Inclusion criteria were: (a) volunteer had to be a firefighter (trainee or qualified officer) and (b) volunteer had no current injuries. All participants volunteered to participate in the study while they were off-duty, and each participant provided written informed consent to participate prior to any testing. Participants received a $150 gift-voucher as participation gratuity.
2.3. Tasks and Measures
Age, Height, Weight and Years of Experience: Following collection of participant informed consent, self-reported age, height, weight and years of service were obtained. Self-reported height and weight measures are commonly used in the literature for tactical populations [16,17] and have been found to be reliable [18].
2.4. Freedom of Movement: Functional Movement Screen
To determine the officer’s mobility and movement quality while wearing each of the clothing variations, the Functional Movement Screen (FMS) was employed. The FMS assesses seven movement patterns, which include the overhead squat, hurdle step, in-line lunge, shoulder mobility, active straight leg raise, push-up, and rotary stability [19]. Each component of the FMS is scored on a scale of zero to three points. A score of zero is assigned if the participant experiences pain with any portion of the movement pattern, a score of one indicates that the participant does not experience pain but cannot complete the movement pattern as instructed, and a score of two identifies that the participant can complete the movement pattern pain-free but exhibits some type of compensatory movement pattern. A score of three indicates that the participant’s movement pattern is completed as instructed, with no movement compensation noted, and with the movement being pain-free [19]. The total FMS score was calculated by summing the scores of individual elements of the FMS, and therefore the total could range from zero to 21 [19].
The FMS has high inter-rater reliability [20] and intra-rater reliability [21]. Previous research has demonstrated such reliability within the tactical population [20]. This tool was selected due to research in tactical populations linking the movement skills of the FMS and potential for injury, with total FMS scores of below 14 associated with an increased risk of injury [22].
2.5. Reach Height and Vertical Jump
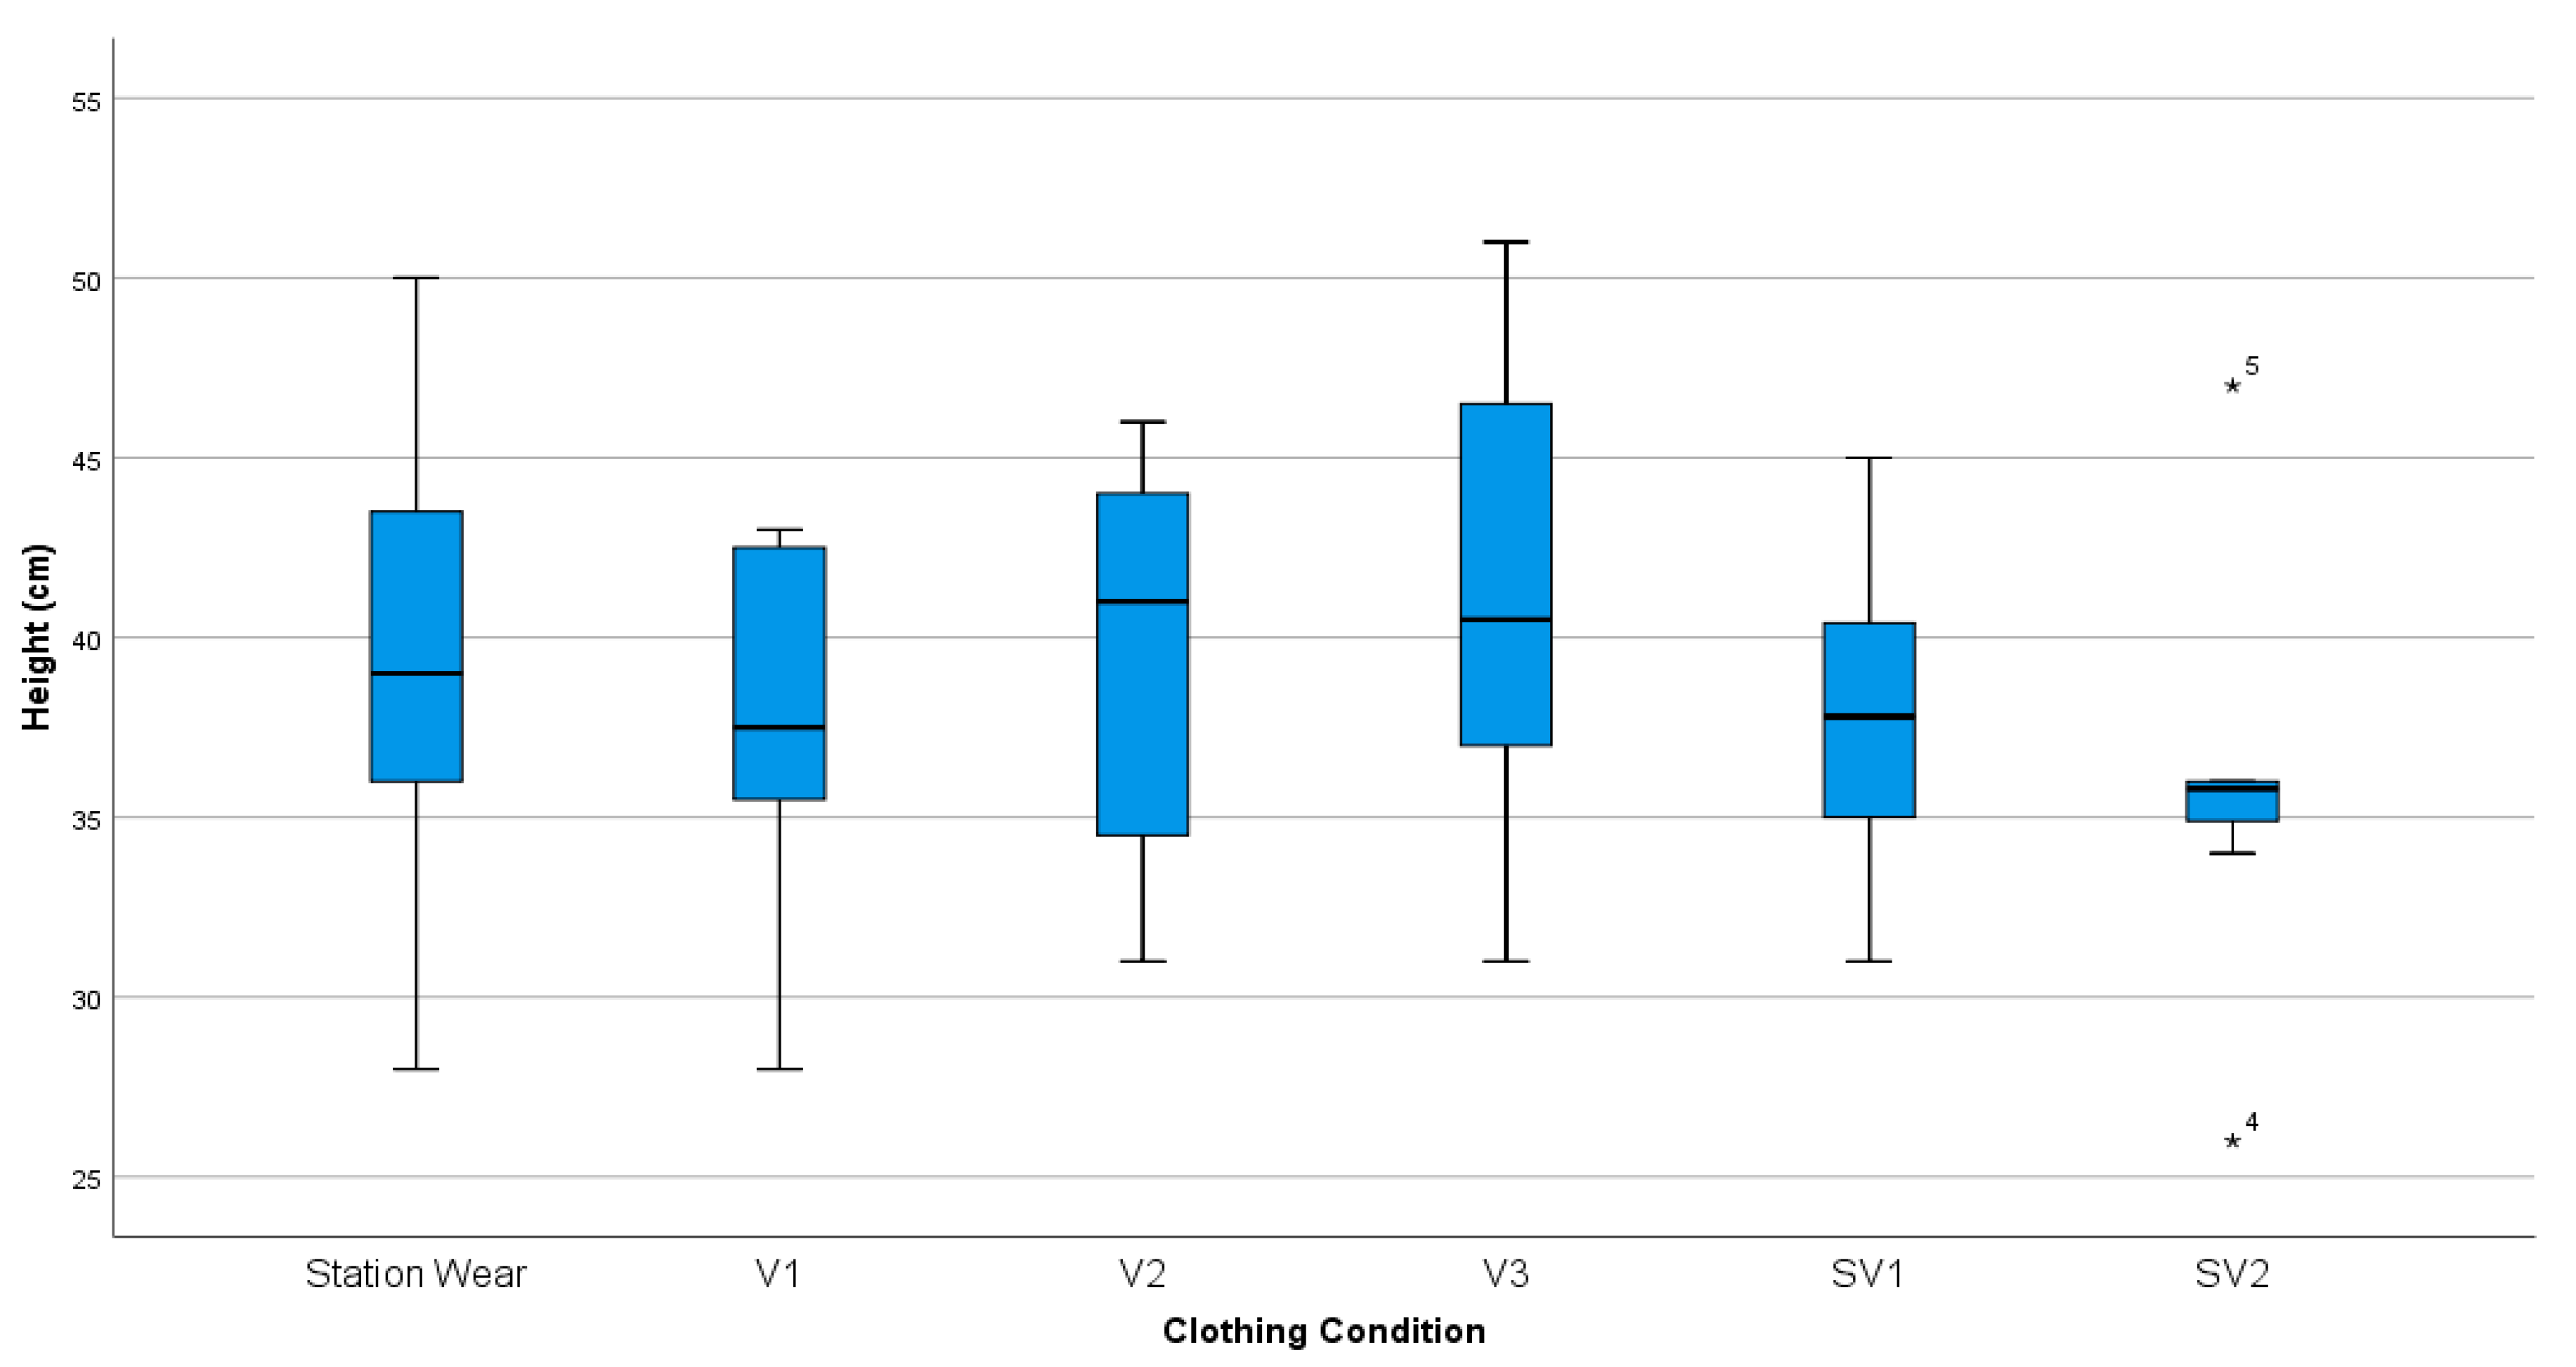
The vertical jump is a valid measure of leg power [23]. However, in this study it was also used to measure reach height as well as comfort when moving through a rapid squat movement. Reach height and vertical jump height were collected using a Vertec™ apparatus (Vertec Scientific Ltd., Aldermaston, UK). Participants were required to reach up with a single arm and displace the highest horizontal plastic fin whilst standing flat footed on the ground. This measure became the reach height. Following this measure, the participants were instructed to perform a rapid countermovement jump with an arm swing and jump as high as possible, dislodging the highest horizontal plastic fin on the device that they could reach. Jump height was calculated by subtracting the jump score from the reach score for each clothing variation and recorded to the nearest centimeter. Changes in reach height were recorded as differences from baseline (dressed in station wear) to the reach height of each clothing variation.
2.6. Simulation Task 1: Stepping Assessment
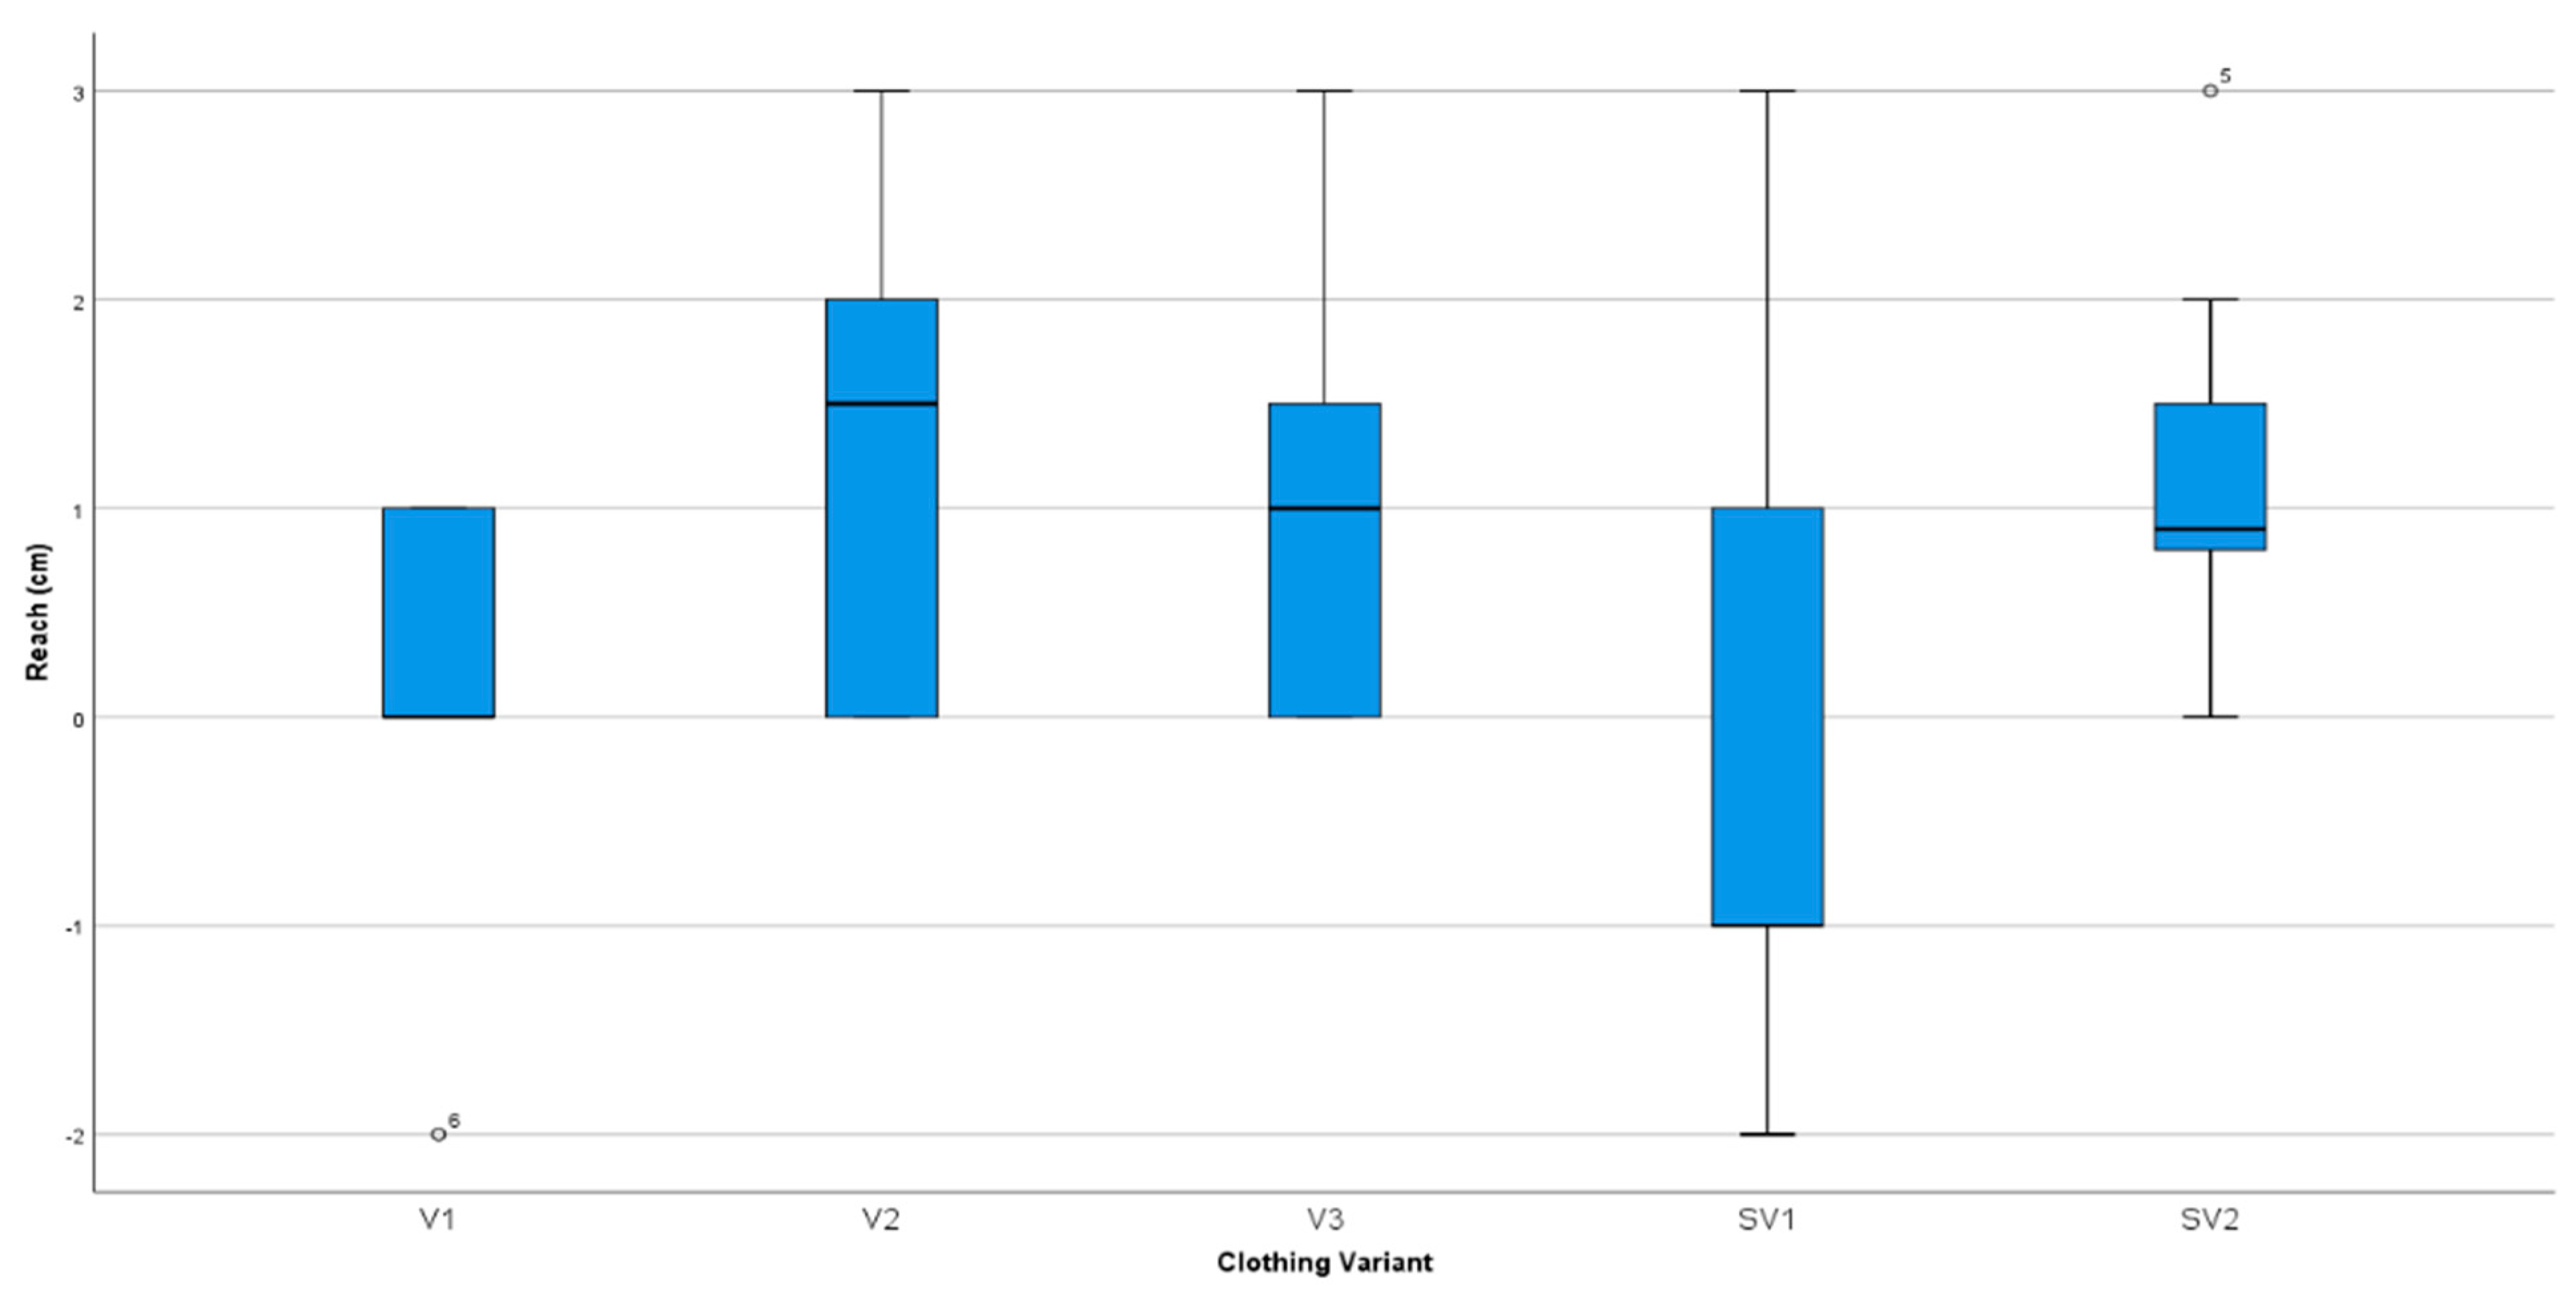
The ability to climb stairs and ladders are typical movement requirements of a firefighter with variations of assessments to measure these movements reported in the literature [2]. Participants were required to step up and down in an up-up-down-down pattern on to, and off a 13 cm high step for 25 repetitions and then a 26 cm step for 25 repetitions. Participants were instructed to maintain a comfortable and continuous pace for the duration of the task. The outcome measure for this task was the subjective effect of the clothing on the stepping action as measured by a visual analogue scale (described below).
2.7. Simulation Task 2: Low Crawl
Firefighters may be required to move through structures with a low profile as such, adequate clothing mobility is required to allow this movement profile. Participants were required to crawl using a three- or four-point movement across a 6 m ramp with an incline of 3.3%. Pace was to be fast, but not maximal, and constant for the duration of task. The outcome measure for this task was the subjective effect of the clothing on the crawling action as measured by a visual analogue scale (described below).
2.8. Subjective Measures: Subjective Effects on Task Performance
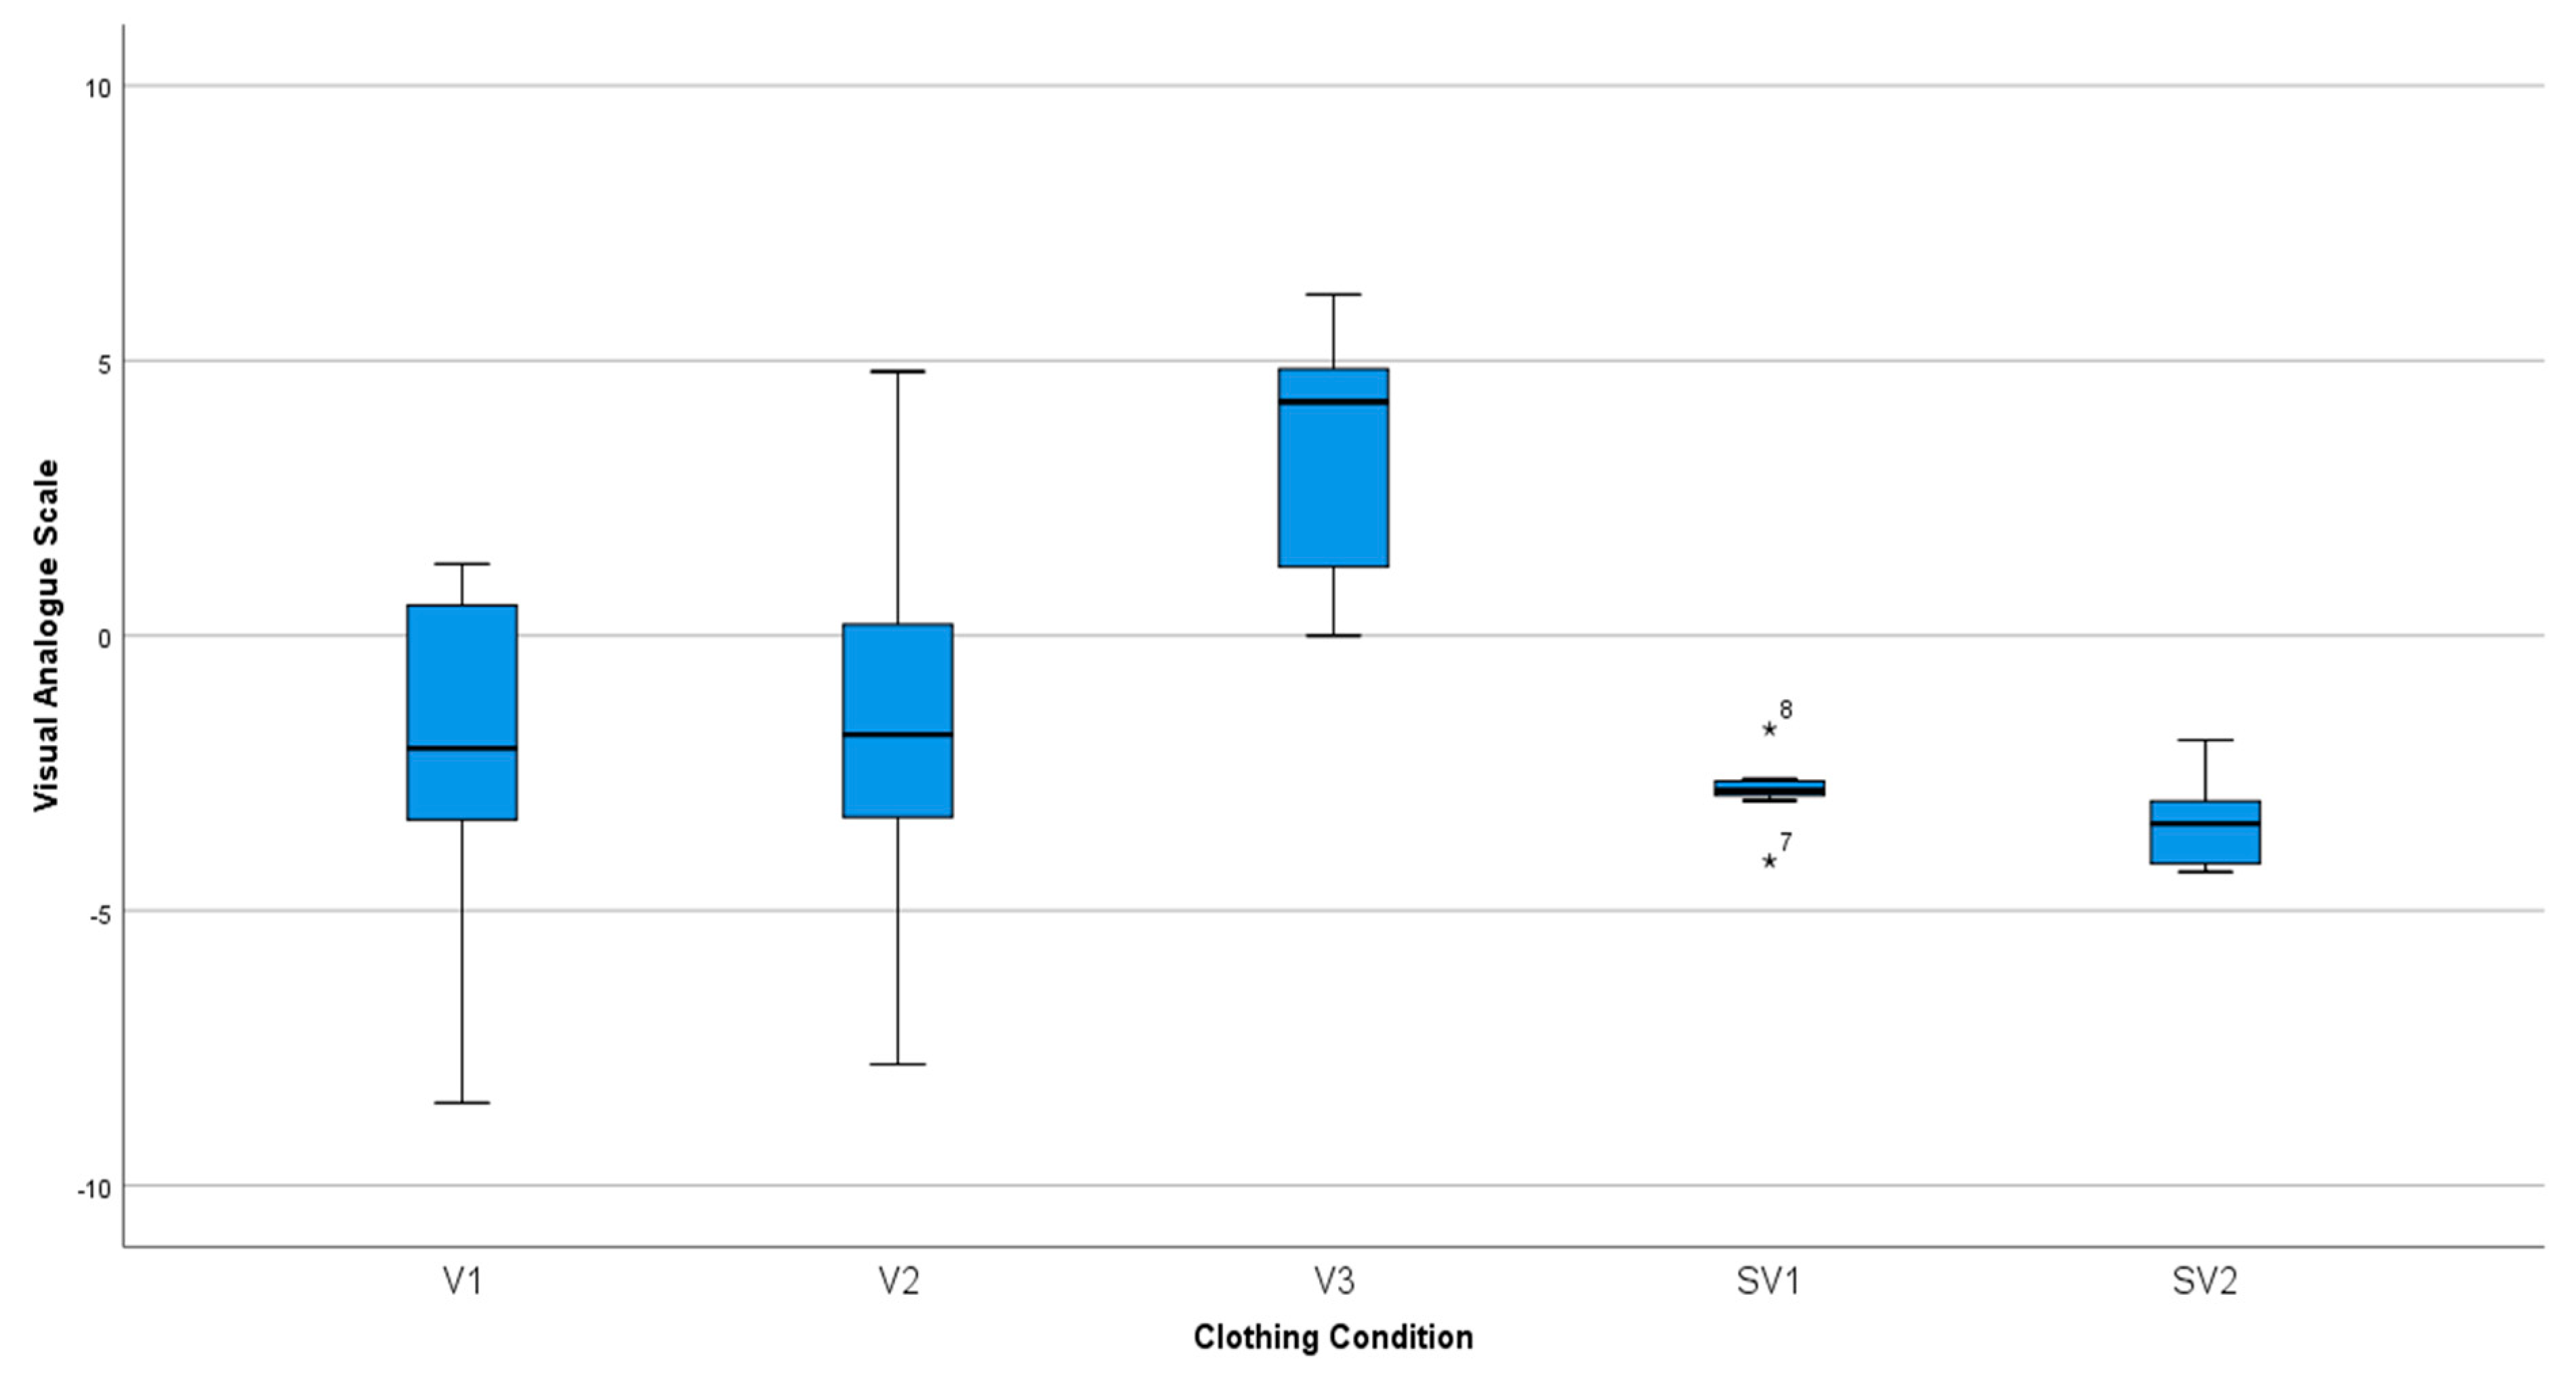
After each of the assessed tasks (FMS, vertical jump, stepping assessment, and crawl) the participants were asked to rate, on a visual analogue scale (Figure 2), the perceived impact of their clothing type on whether they considered the clothing to have impacted their task. Participants were instructed to reflect on improvements or deterioration of performance in comparison to their performance when wearing their normal station wear. This approach has been used in previous research of this nature to inform subjective influences of equipment and clothing on performance [24]. The visual analogue scale was scored from zero to 10 in both a positive and negative direction, along a 200 mm scale. Immediately after each event, participants were asked to mark the scale with a single line. The distance from zero was measured with a ruler and recorded in mm (either positive or negative).
2.9. Subjective Measures: Subjective Comfort
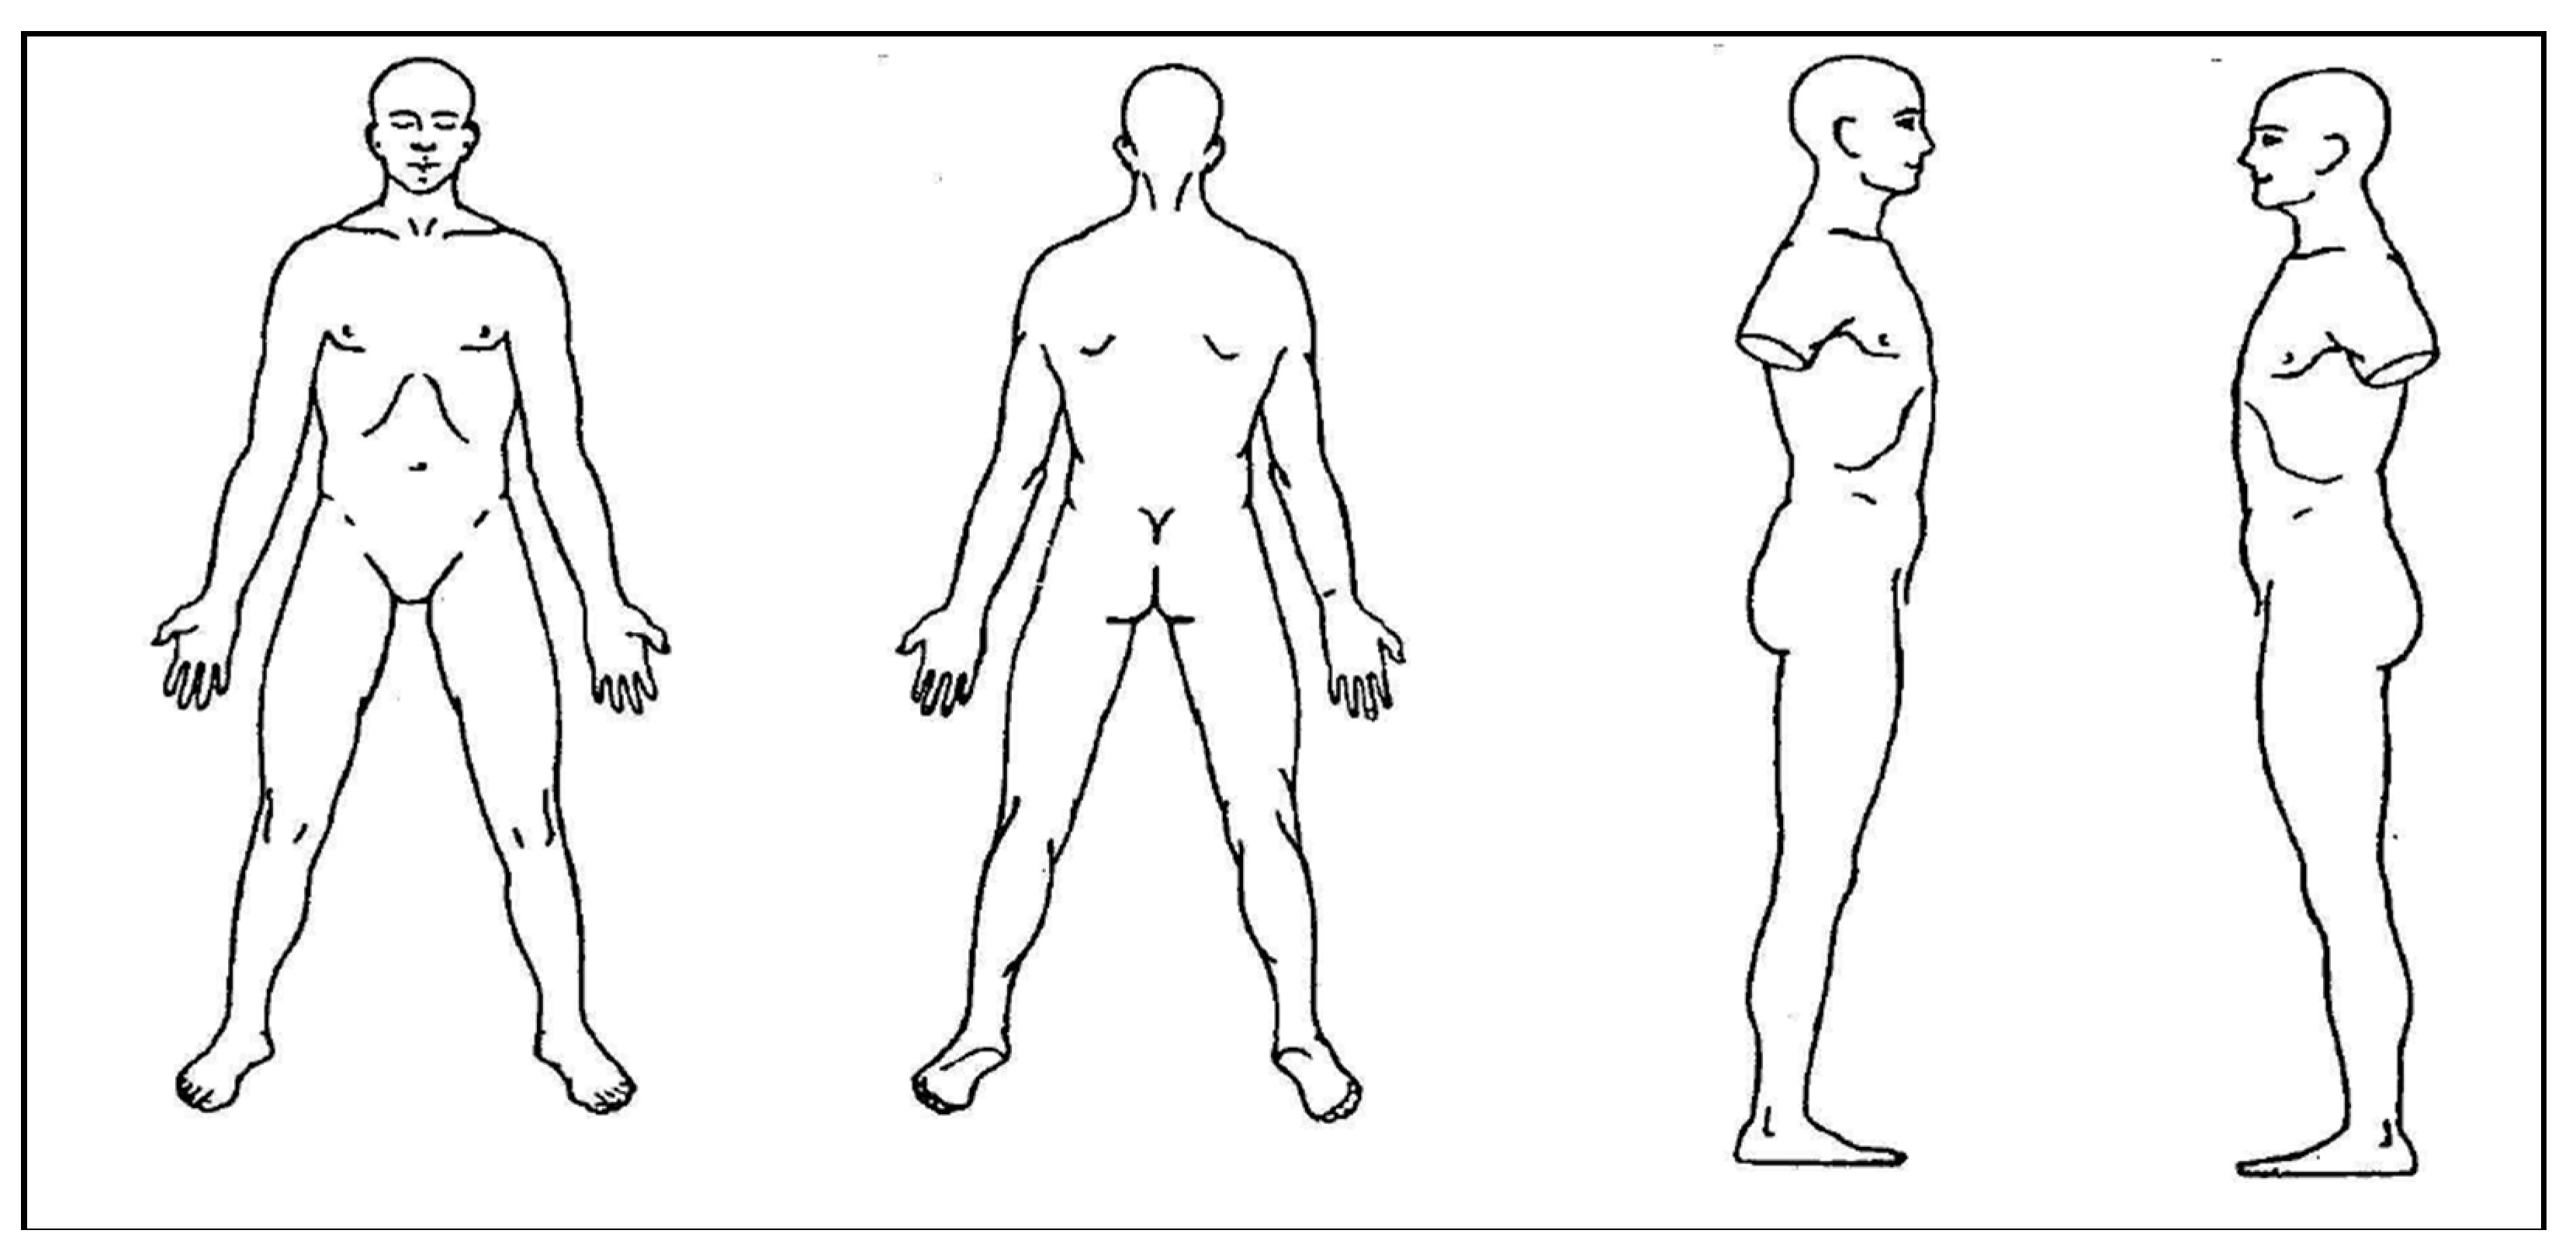
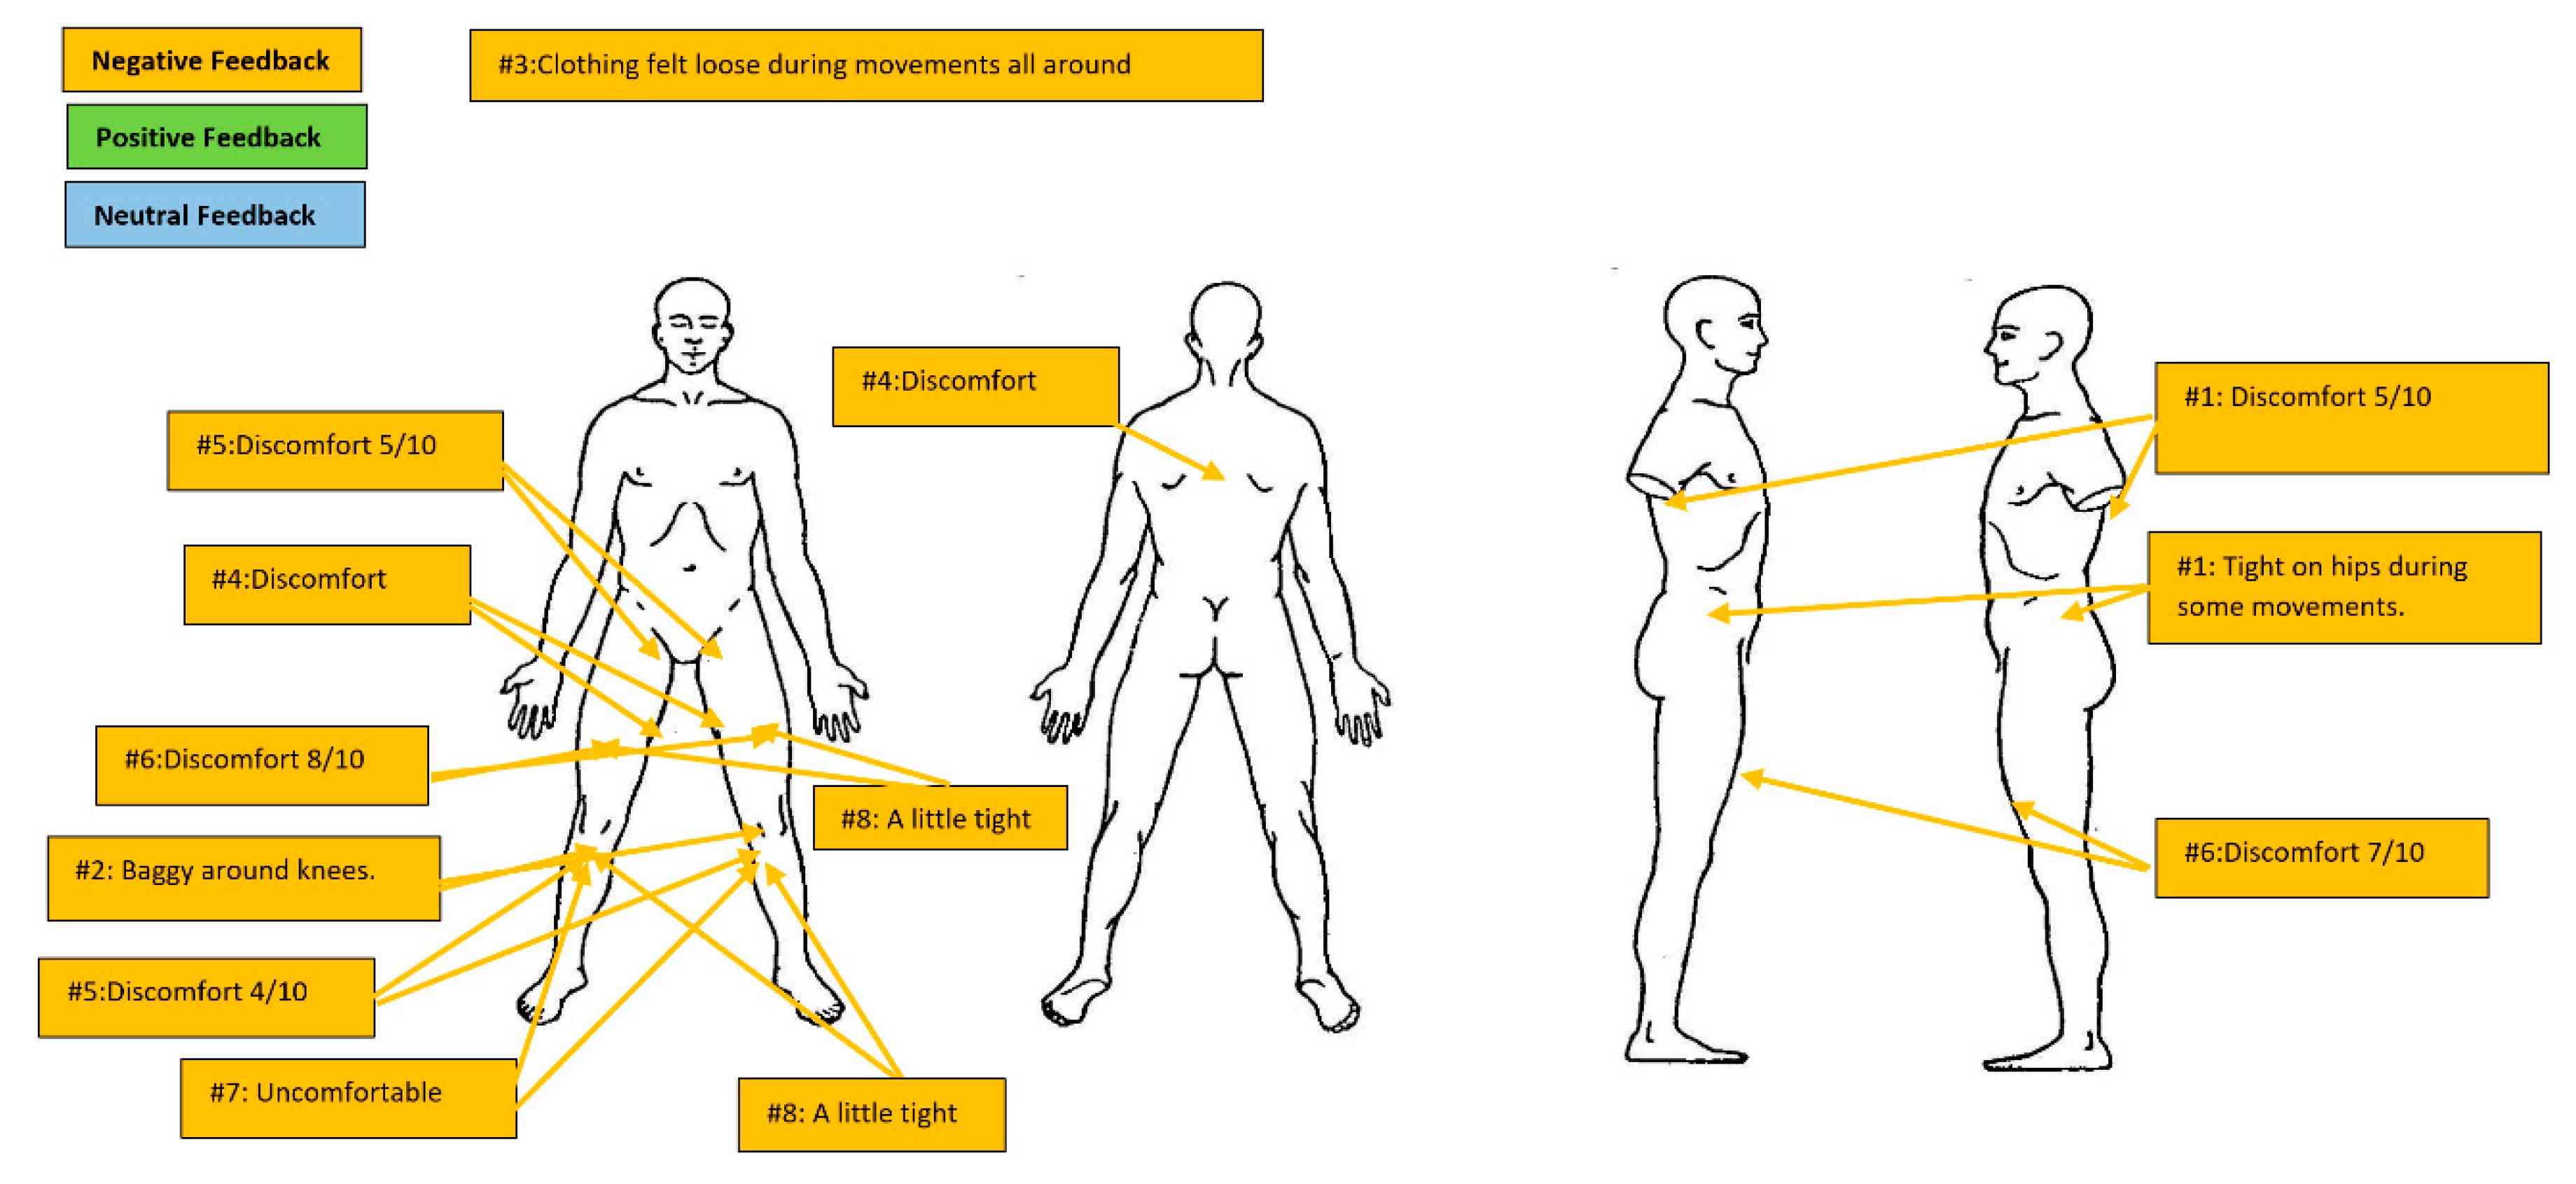
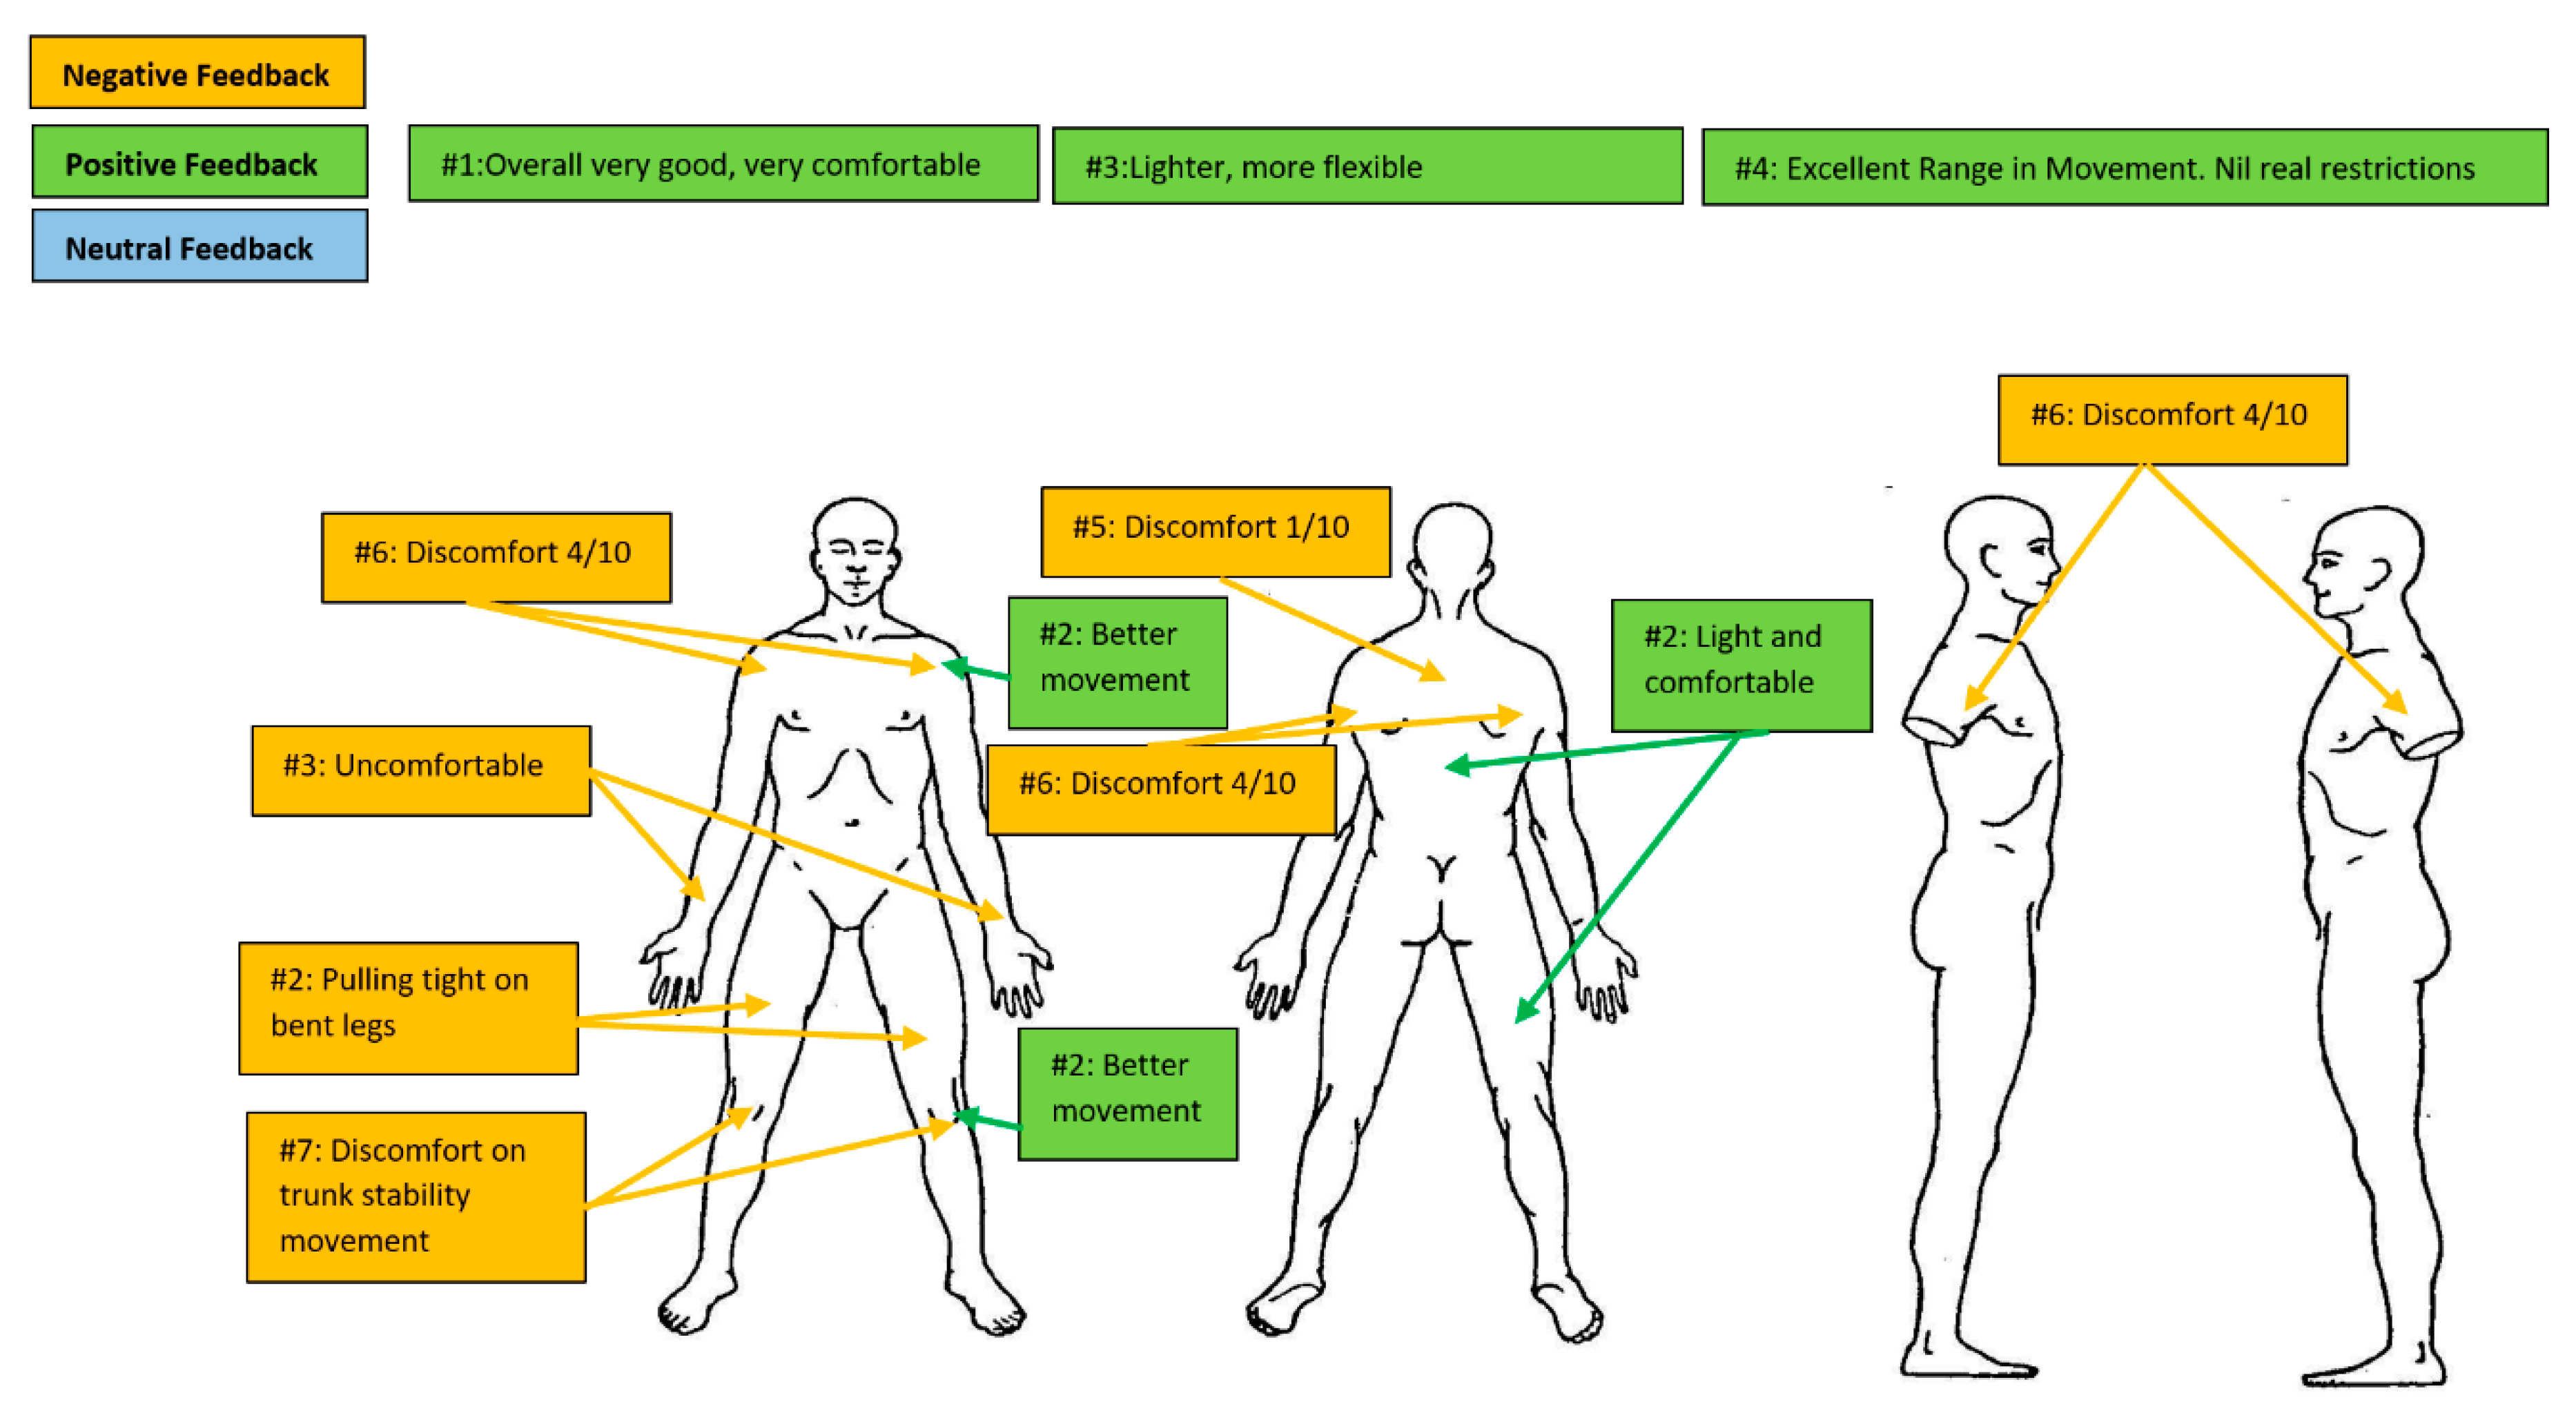
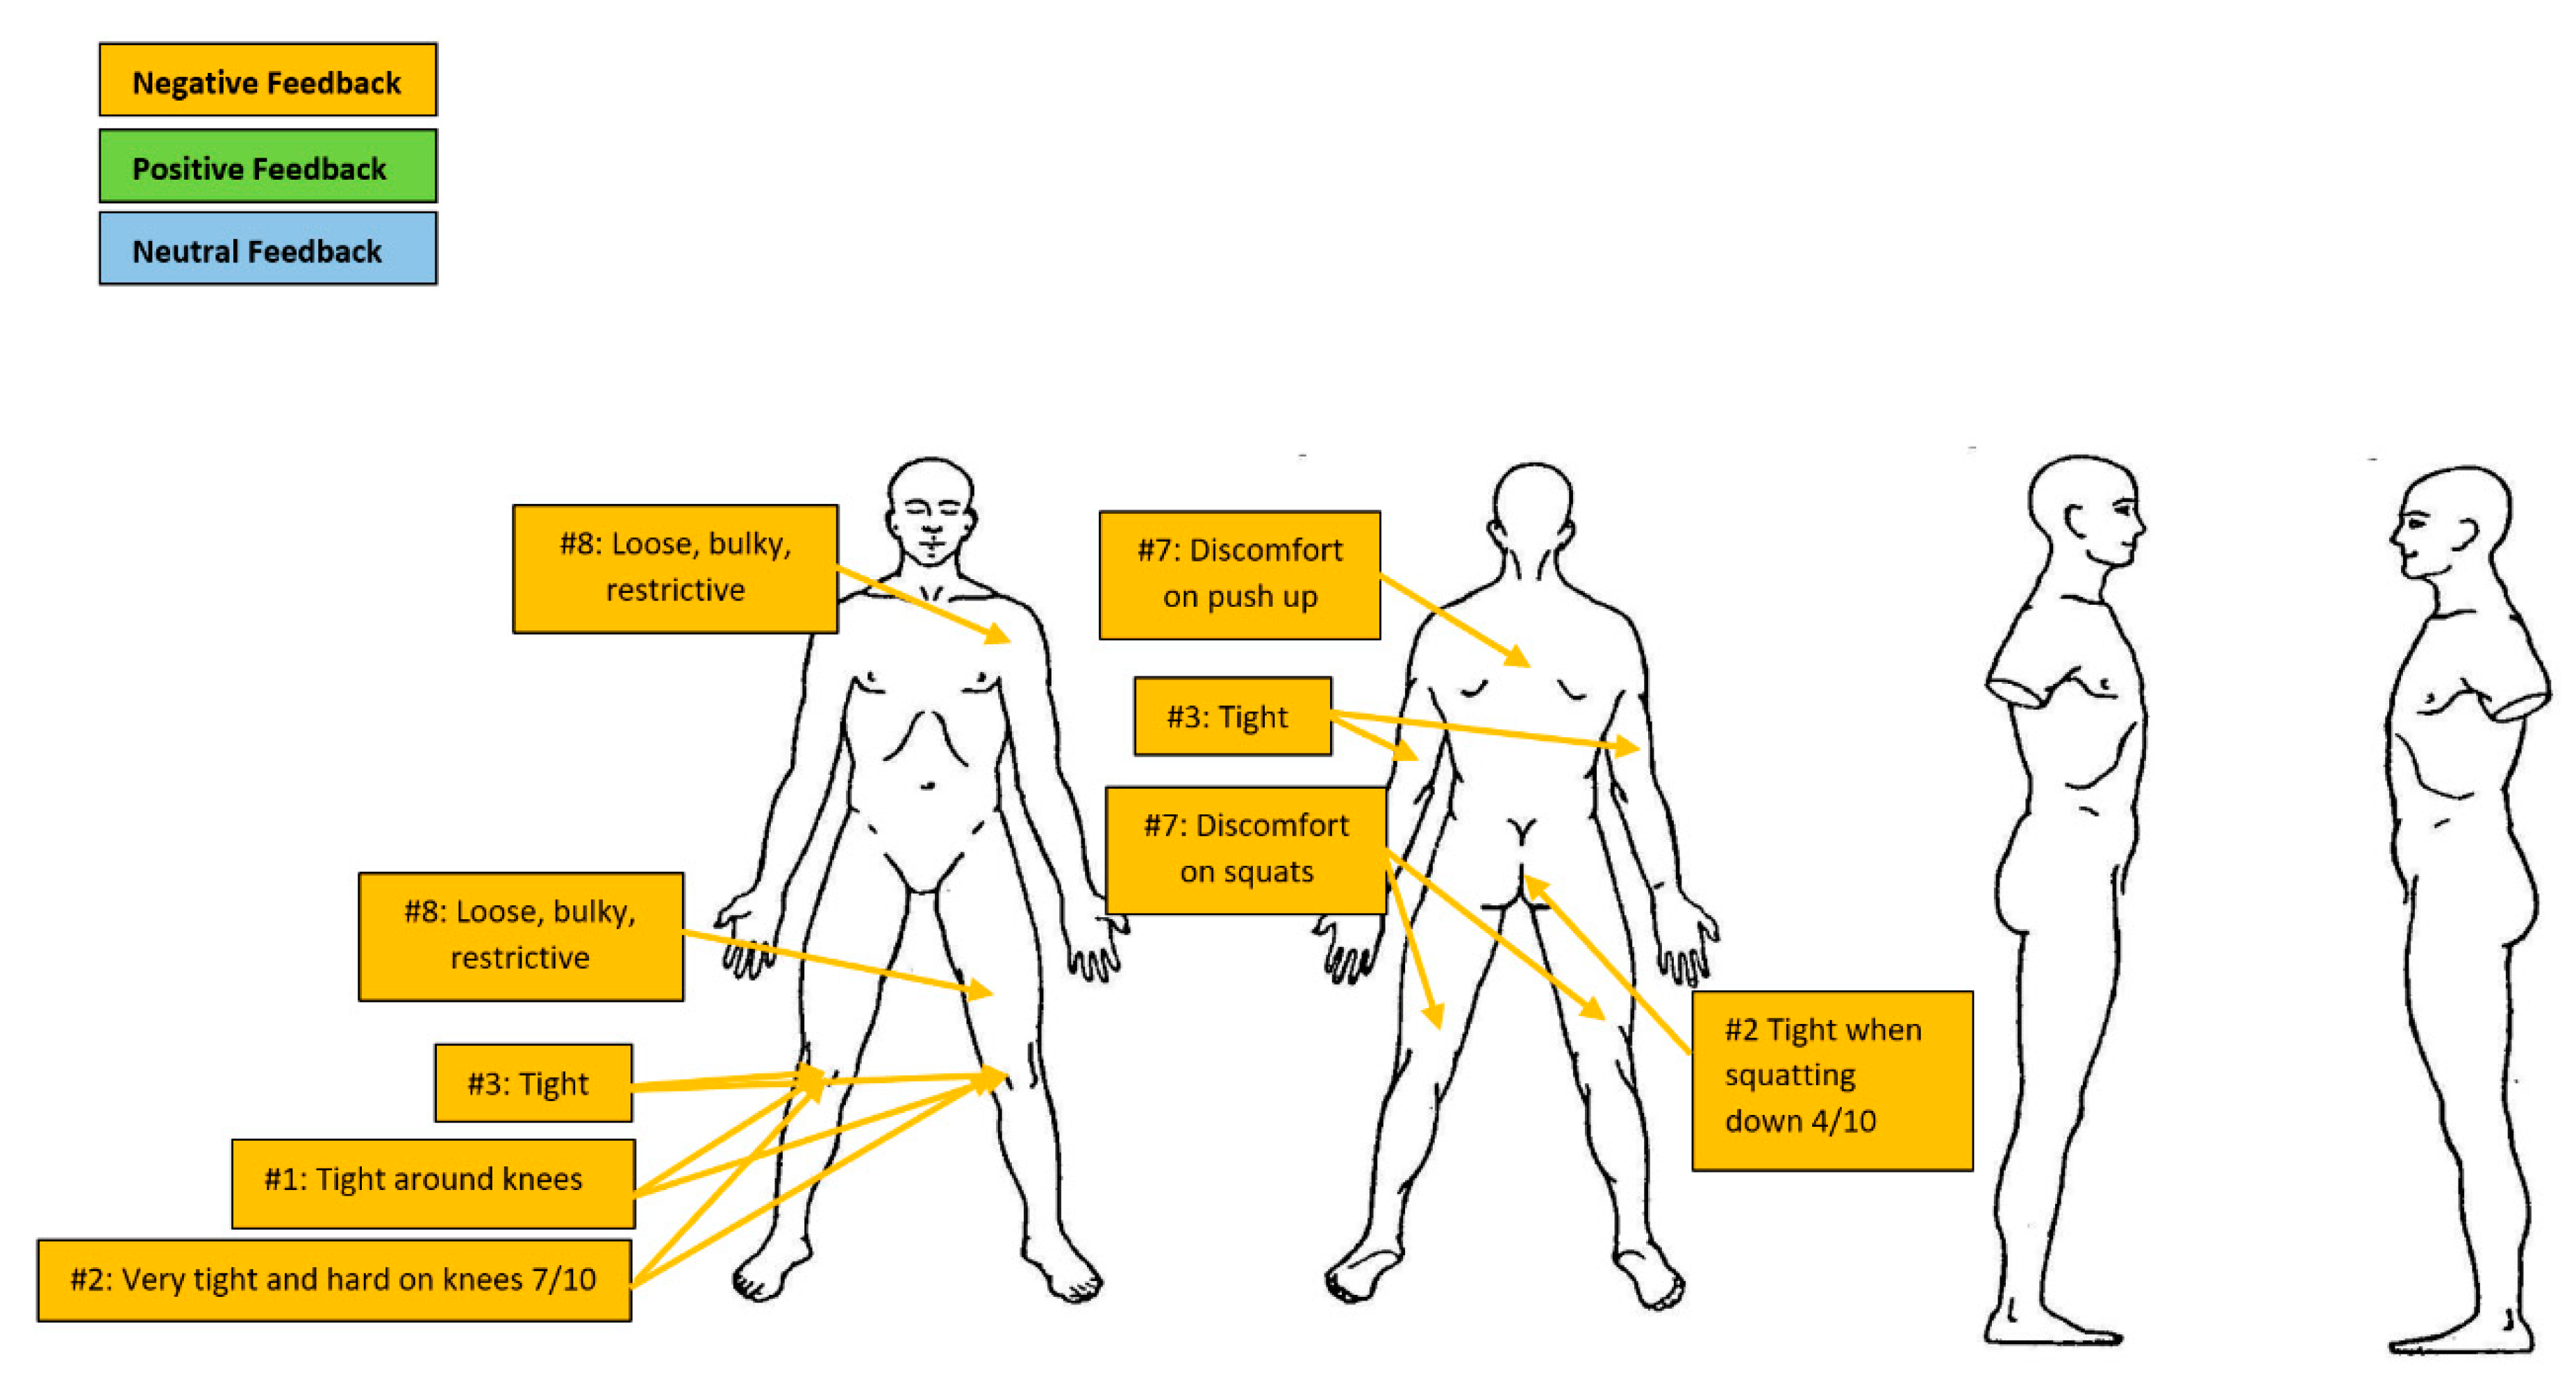
At the completion of the series of tasks forming part of each ensemble round, the participants were asked to indicate on a mannequin sketch (Figure 3) any areas of comfort or discomfort, restriction, etc. they felt from the clothing that they were wearing when performing the tasks in general.
2.10. Data Analysis
All data were entered into a Microsoft Excel data spreadsheet before being transferred into SPSS for analyses (Version 26, IBM, 2018). Demographic data and the performance measure scores for each type of tasks and clothing variants were initially analyzed descriptively to derive means and standard deviations and data was explored. Inferential analyses were then conducted using a Repeated Measures Analysis of Variance (ANOVA) to detect significant differences in performance measures across the clothing variants. If a significant difference was found, a post-hoc pairwise comparison with Bonferroni adjustment was performed to detect where the differences lay. For comparing individual FMS task scores associated with each type of clothing, a Wilcoxon signed rank analysis was performed, consistent with the ordinal nature of the data. The overall level of significance was set a priori at α = 0.05.
3. Results
3.1. FMS Results
The total mean FMS scores are shown in Table 1. A repeated measures ANOVA indicated that the total score of the FMS varied significantly across the station wear and three main apparel variations (F (3, 21) = 7.72, p =0.001, partial ƞ2 = 0.52). Pairwise comparison revealed a significant mean percent increase of 9.5% (p =0.007) and 13.0% (p =0.013) in total FMS score when wearing V2 and V3 compared to wearing V1 (Table 1). No statistically significant differences in total FMS scores were found between the participant’s normal station wear and the three clothing variations.
Comparison of the station wear, V1, V2 and V3 with the combination ensemble SV1, revealed significant variation in FMS total score (F (4, 16) = 6.36, p =0.003, partial ƞ2 = 0.61). Further analysis through pairwise comparison indicated a significant 8.7% (p =0.046) decline in total FMS score when wearing V1 compared to station wear. There was a significant 11% (p =0.028) and 15.1% (p =0.042) increase in total FMS scores when wearing V2 and V3, respectively, compared to V1 (Table 1). Similarly, the repeated measures ANOVA revealed significant variation in FMS score when SV2 was analyzed with station wear, V1, V2 and V3 (F (4, 16) = 3.27, p =0.039, partial ƞ2 = 0.45). Pairwise comparison with Bonferroni adjustment for multiple comparisons, however, did not detect any significant differences between the clothing variations analyzed.
Interestingly, whilst the main effects of the repeated measures ANOVA revealed that the total scores varied significantly based on the clothing ensemble used, the combination of station wear and V1 (SV1) or V2 (SV2) did not significantly influence the total FMS scores (Table 1).
The Wilcoxon Signed Rank test compared the performance in each FMS task based on the clothing ensemble. The deep squat was more significantly affected by V1 than V2 (Z = 2.236 p =0.025) while rotary stability was more affected by the V2 ensemble compared to the participants’ normal station wear (Z = 2.000 p =0.46) (Table 1).
3.2. Reach Height and Vertical Jump Results
The mean results and standard deviations for the reach height and vertical jump assessments are shown in Table 2 and Figure 4, Figure 5 and Figure 6. Within subjects reach height of participants did not differ significantly between clothing variants (F (3, 21) = 4.454, p =0.305, partial ƞ2 = 0.39), or with the addition of SV1 or SV2, (F (4, 16) = 1.321, p =0.305, partial ƞ2= 0.96 and (F (4, 16) = 3.541, p =0.30, partial ƞ2 = 0.47). Vertical Jump height did not differ between the four clothing variants (F (3, 21) = 1.856, p =0.168, partial ƞ2 = 0.21) or SV1 (F (4, 16) = 1.014, p =0.430, partial ƞ2= 0.20) or SV2 (F (4, 16) = 1.793, p =0.180, partial ƞ2 = 0.31).
3.3. Perceptions of Effects of Each Clothing Variant on Task Performance
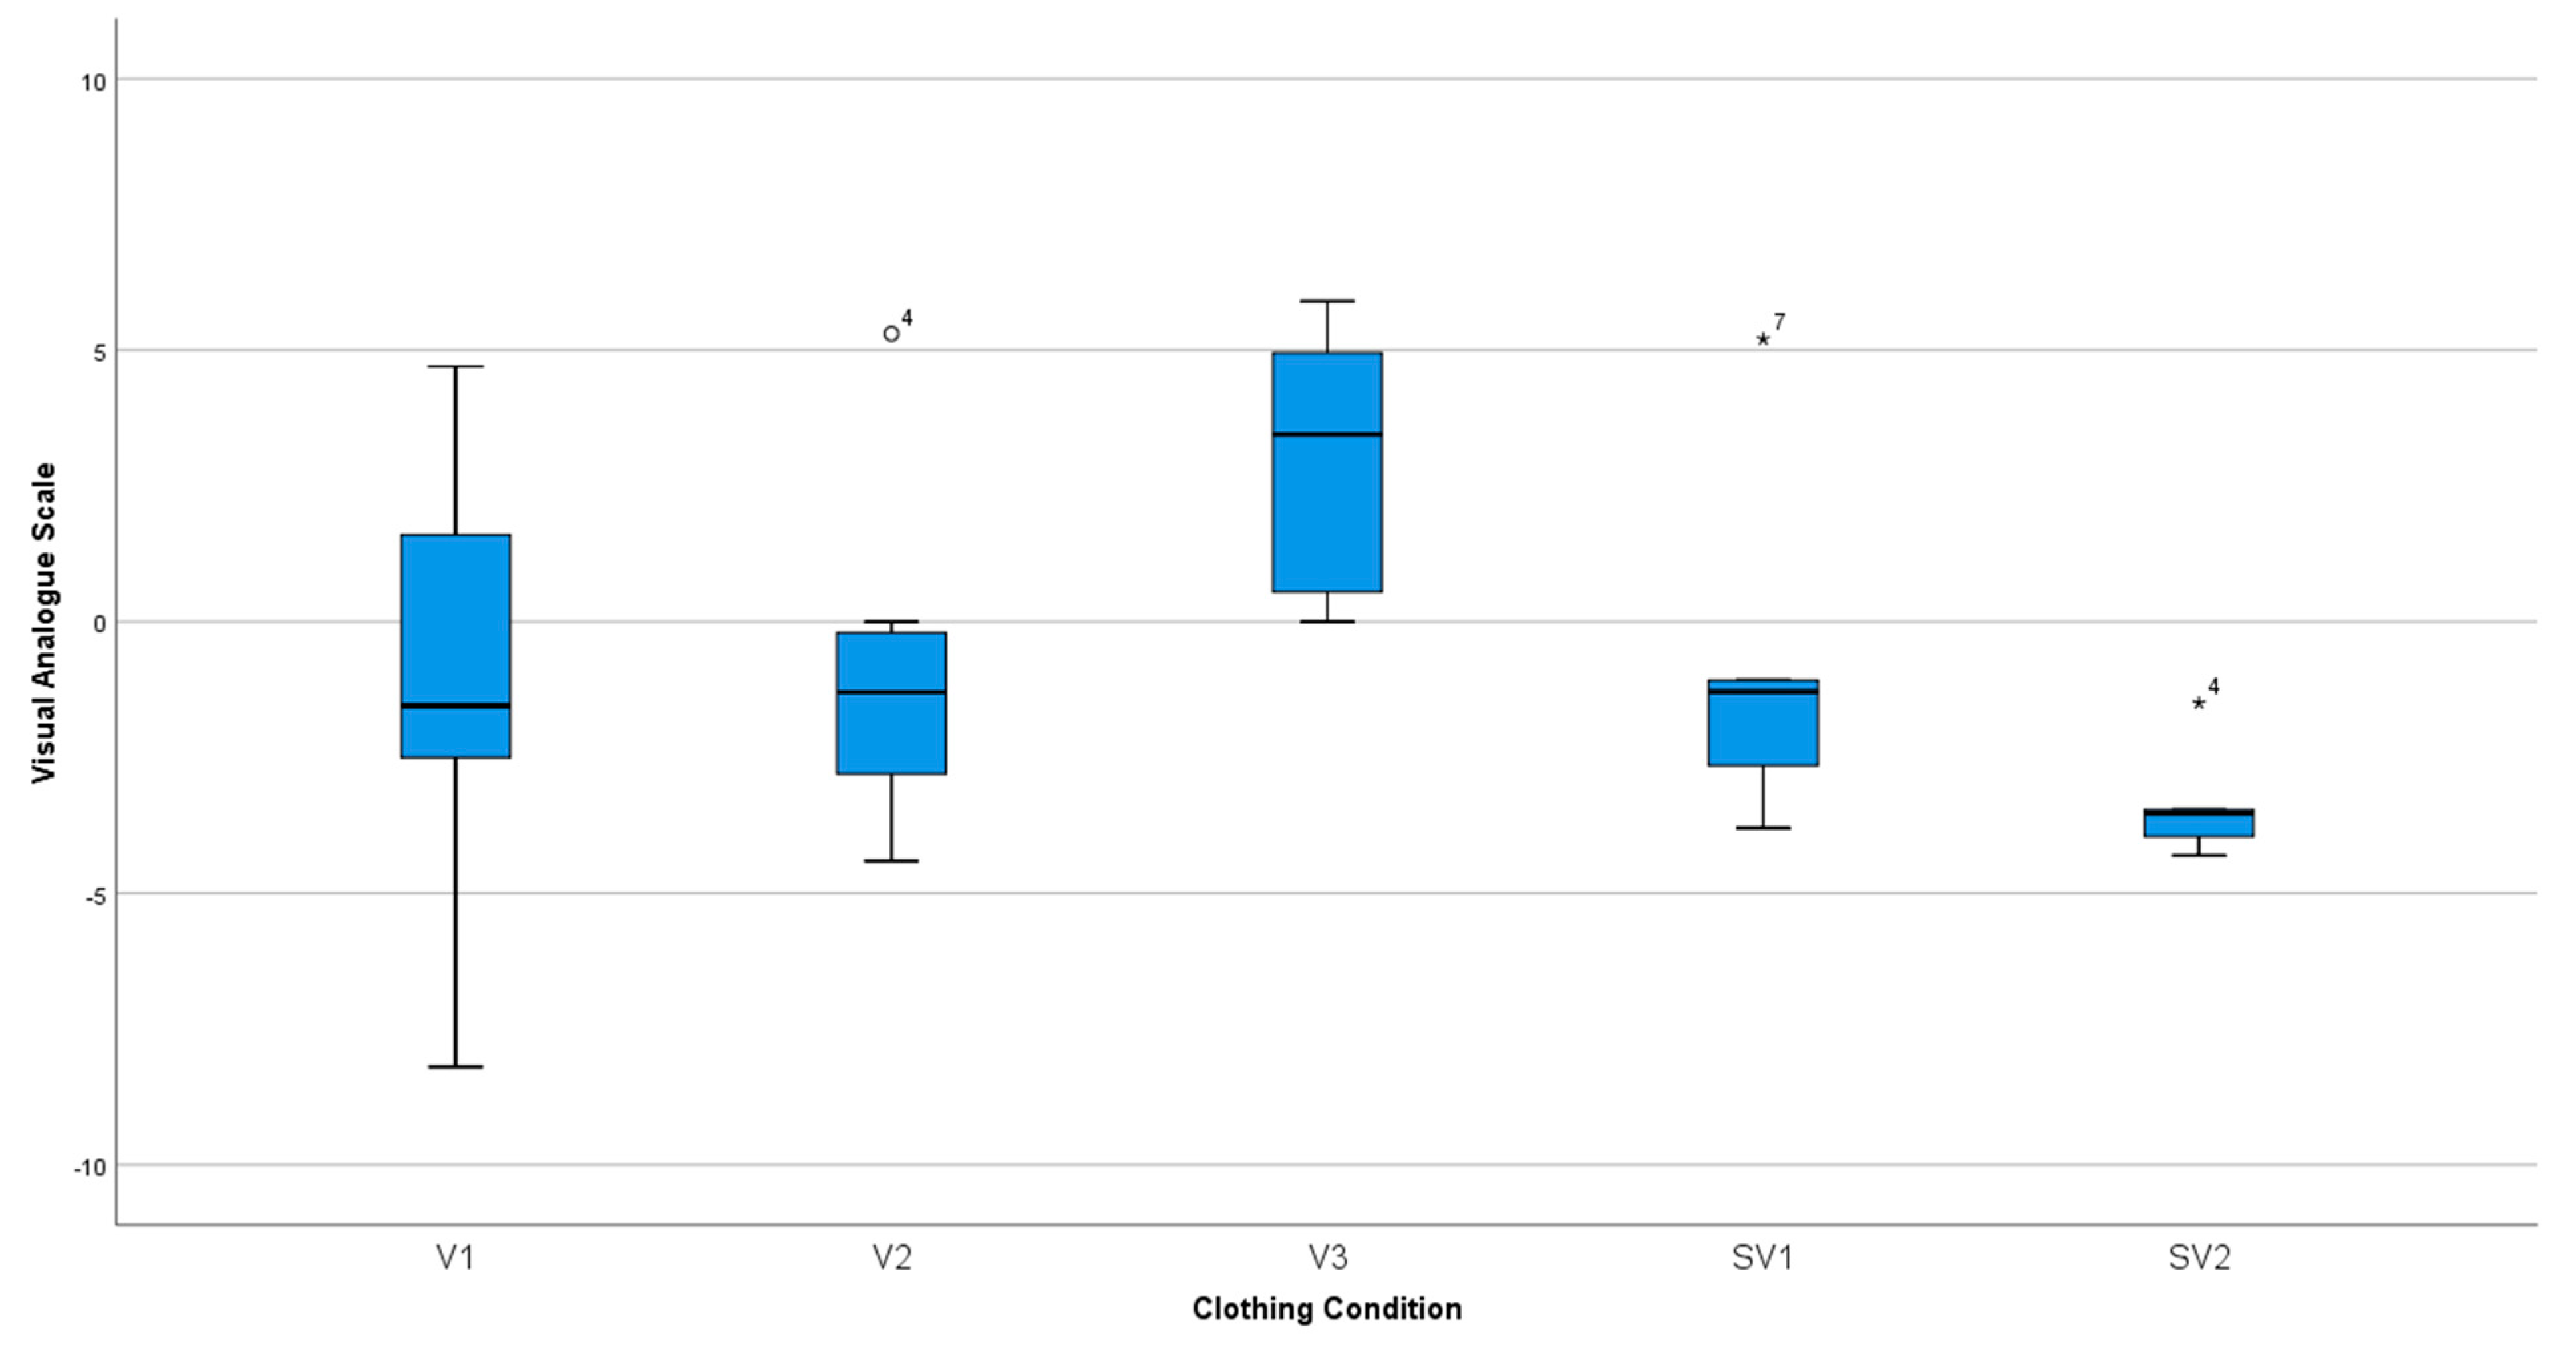
The subjective ratings as measured by the VAS for the four selected tasks (FMS, vertical jump, step ups and crawl) are outlined in Table 3. Ratings ranged from negative comments on the impacts of the clothing on their task performance to positive comments suggesting that, when compared to station wear, the clothing variant was preferable.
There were significant differences in the perceived effects of the clothing variants during the FMS assessment (F(2, 14) = 11.837, p =0.001, partial ƞ2 = 0.63) (Figure 7), with V1 and V2 being rated significantly worse than V3 (mean VAS difference −7.8, p =0.001, 95%CI [−11.79 to −3.81] and mean VAS difference −5.15, p =0.033, 95% CI [−9.86 to −0.44] respectively). There were no significant differences in ratings between V1 and V2. SV1 was also perceived to be significantly worse than V3 (mean VAS difference −5.16, p =0.022, 95% CI [−9.26 to −1.06] while SV2 was not significantly worse than V3 (mean difference −6.125, p =0.528, 95% CI [−21.42 to 9.17]).
There were also significant differences in the perceived effects of the clothing variants in the Vertical Jump assessment (F(2,14) = 6.895, p =0.008, partial ƞ2 = 0.49) (Figure 8). Once again, V1 and V2 were rated significantly worse than V3 (mean VAS difference −1.53 mm, p =0.034, 95% CI [−8.85 to −0.37] and mean VAS difference −3.09 mm, p =0.034, 95% CI = [−5.91 to −0.26] respectively). The SV1 was rated as being worse than V3 (mean VAS difference −4.40 mm, p =0.034, 95% CI [−8.33 to −0.47]) while SV2 was not considered to be significantly worse than V3 (mean VAS difference −3.30 mm, p =0.272, 95% CI [−8.87 to 2.27]).
Significant differences were also found in the perceived effects of clothing variants in the step ups (F(2,14) = 5.462, p =0.018, partial ƞ2 = 0.44) (Figure 9). The V1 variant was reported to be significantly worse than the V3 variant with a mean difference on the VAS of −5.48 mm, p =0.018, 95% CI [−9.88 to −1.07]. The difference between V2 and V3 of −4.96 mm was not a significant difference (p =0.06, 95% CI [−10.13 to 0.21]. SV1 was also perceived to be negatively affecting the stepping task but was not significantly different to the V3 clothing variant (mean VAS difference = −5.360 mm, p =0.055, 95% CI [−10.86 to 0.14]. SV2 was significantly worse than V3 (mean VAS difference = −8.30 mm, p =0.001, 95% CI [−11.46 to −5.14]) and scored the worst overall.
Overall, there were no statistically significant differences in the perceived effects of clothing variants on the crawl assessment (F (1.19,8.31) = 3.425 mm, p =0.096, partial ƞ2 = 0.33) (Figure 10). V3 was rated highest amongst all variations with significantly higher ratings than V2 (mean VAS difference 3.94 mm, p =0.008, 95% CI [1.21 to 6.67]) and SV2 mean VAS difference 7.46 mm, p =0.011, 95% CI [2.53 to 12.39]).
3.4. Subjective Comfort of Clothing Variants
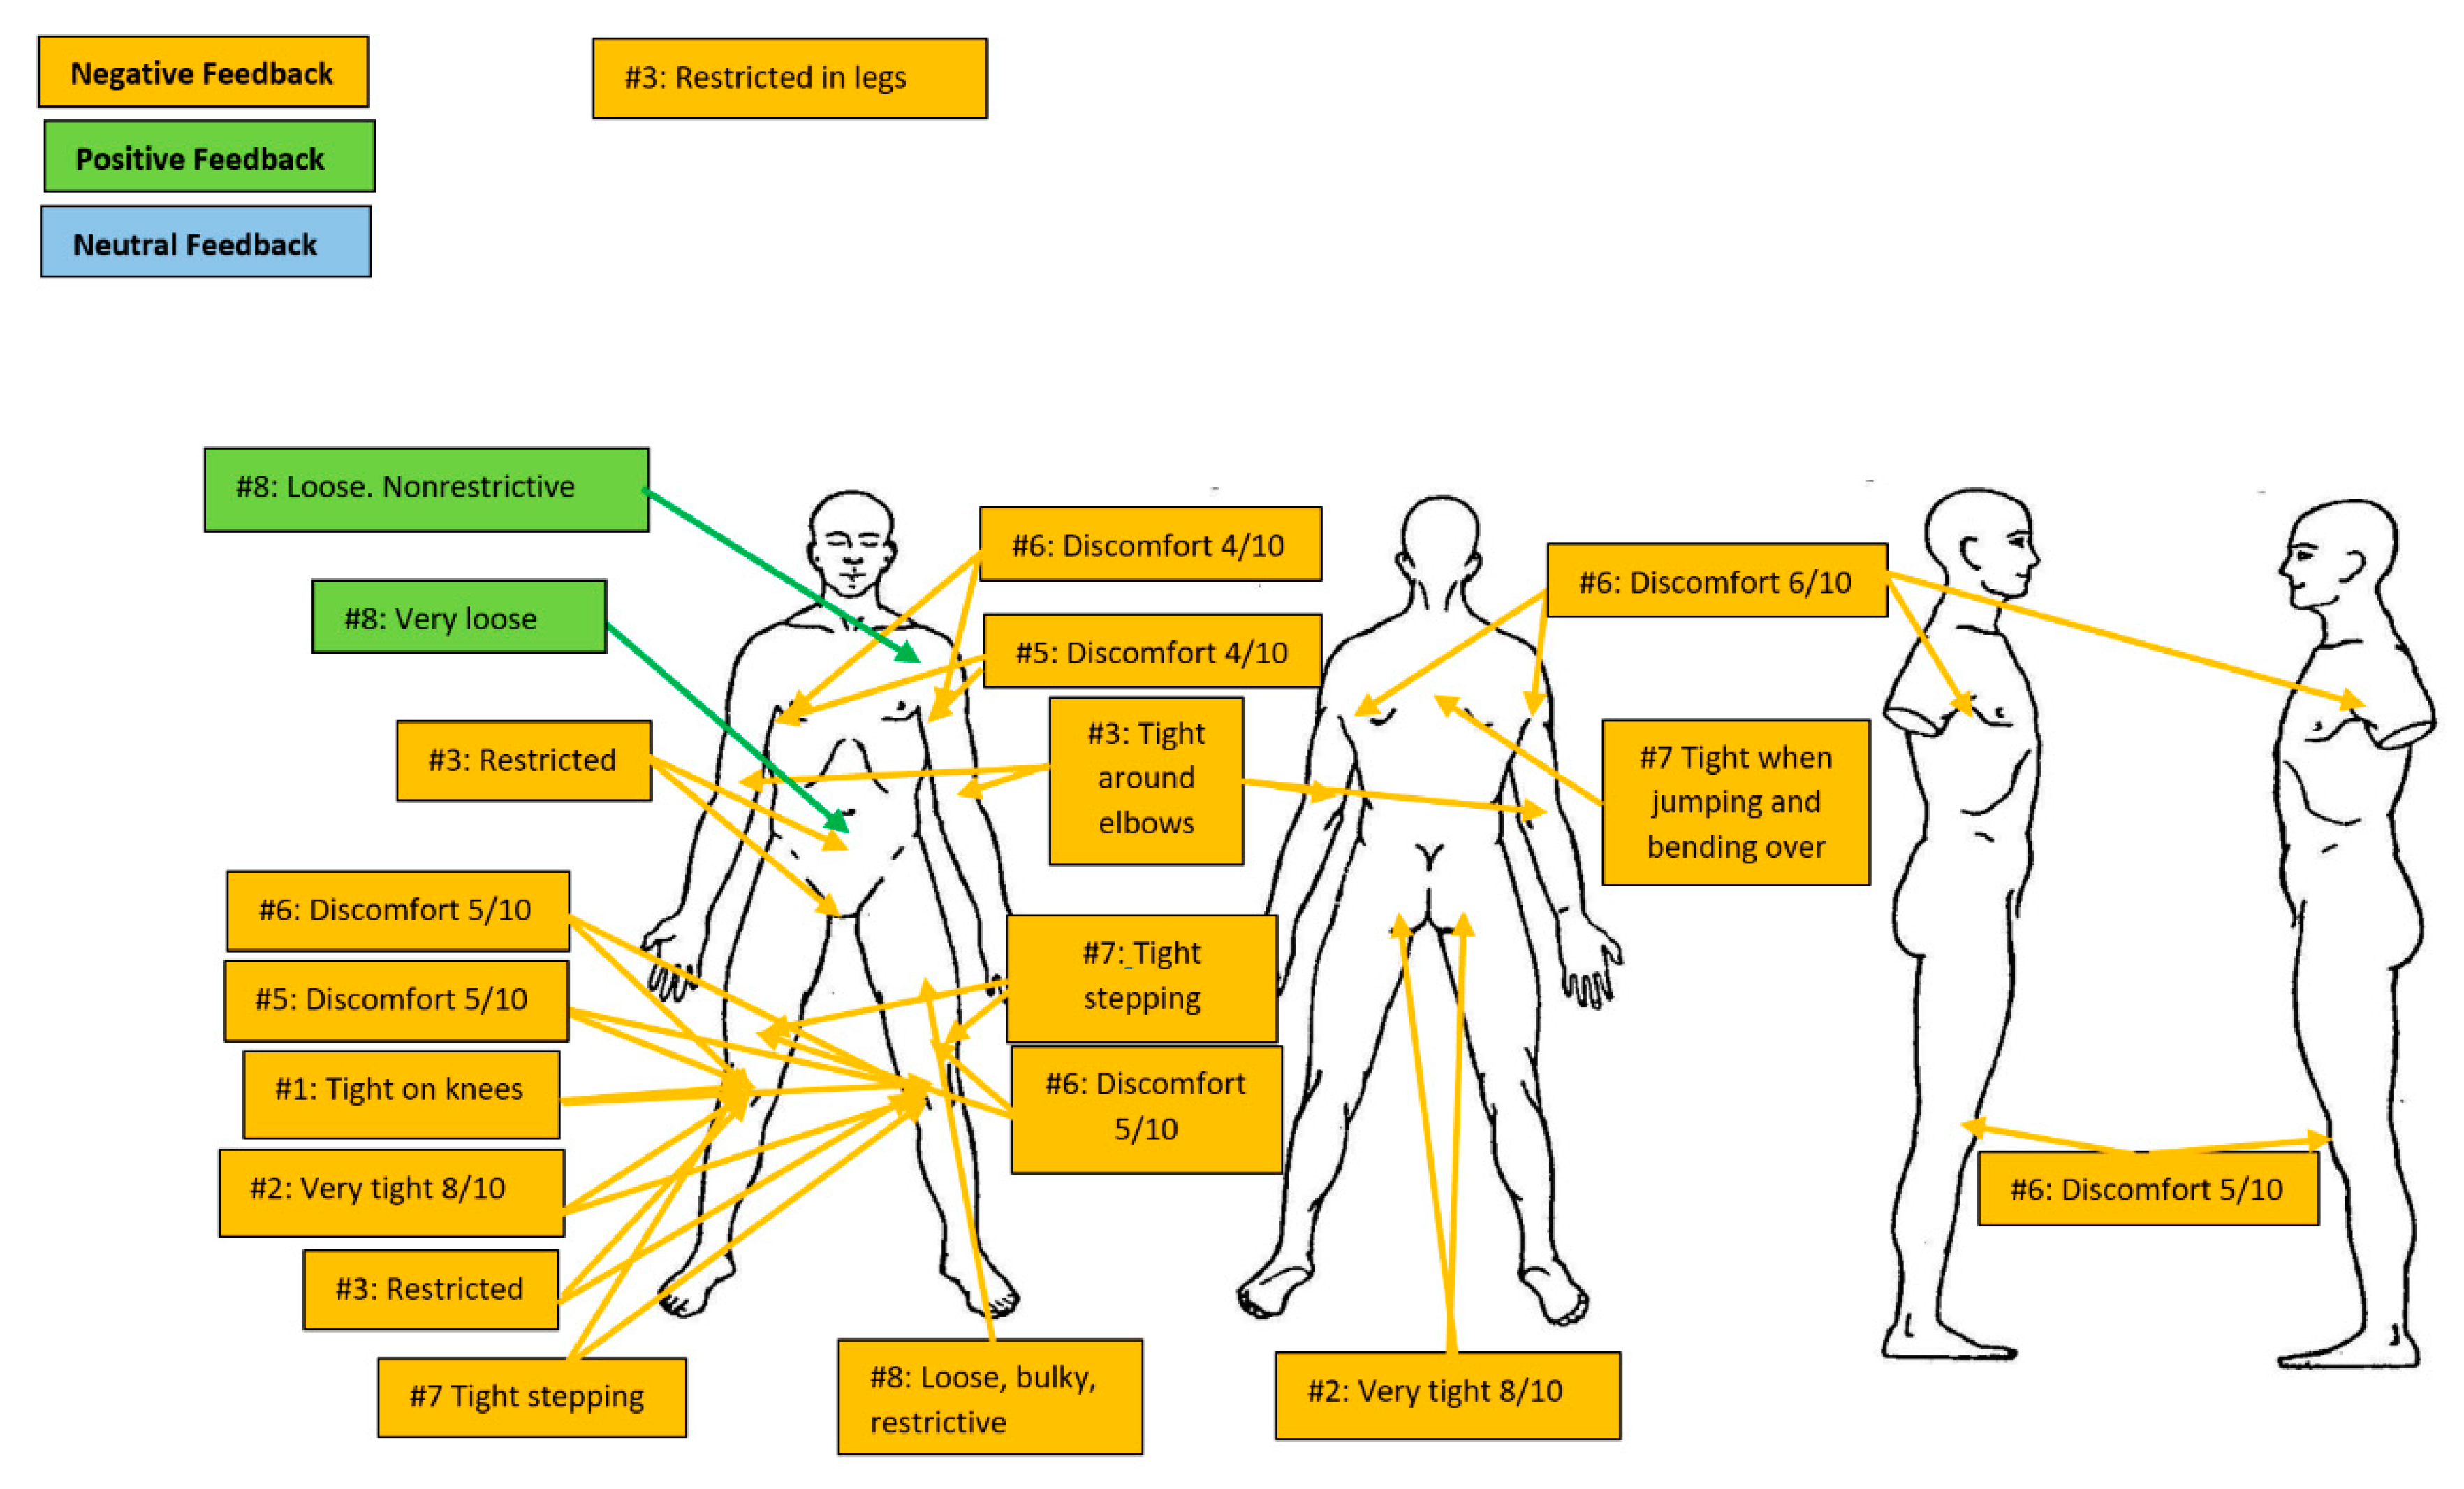
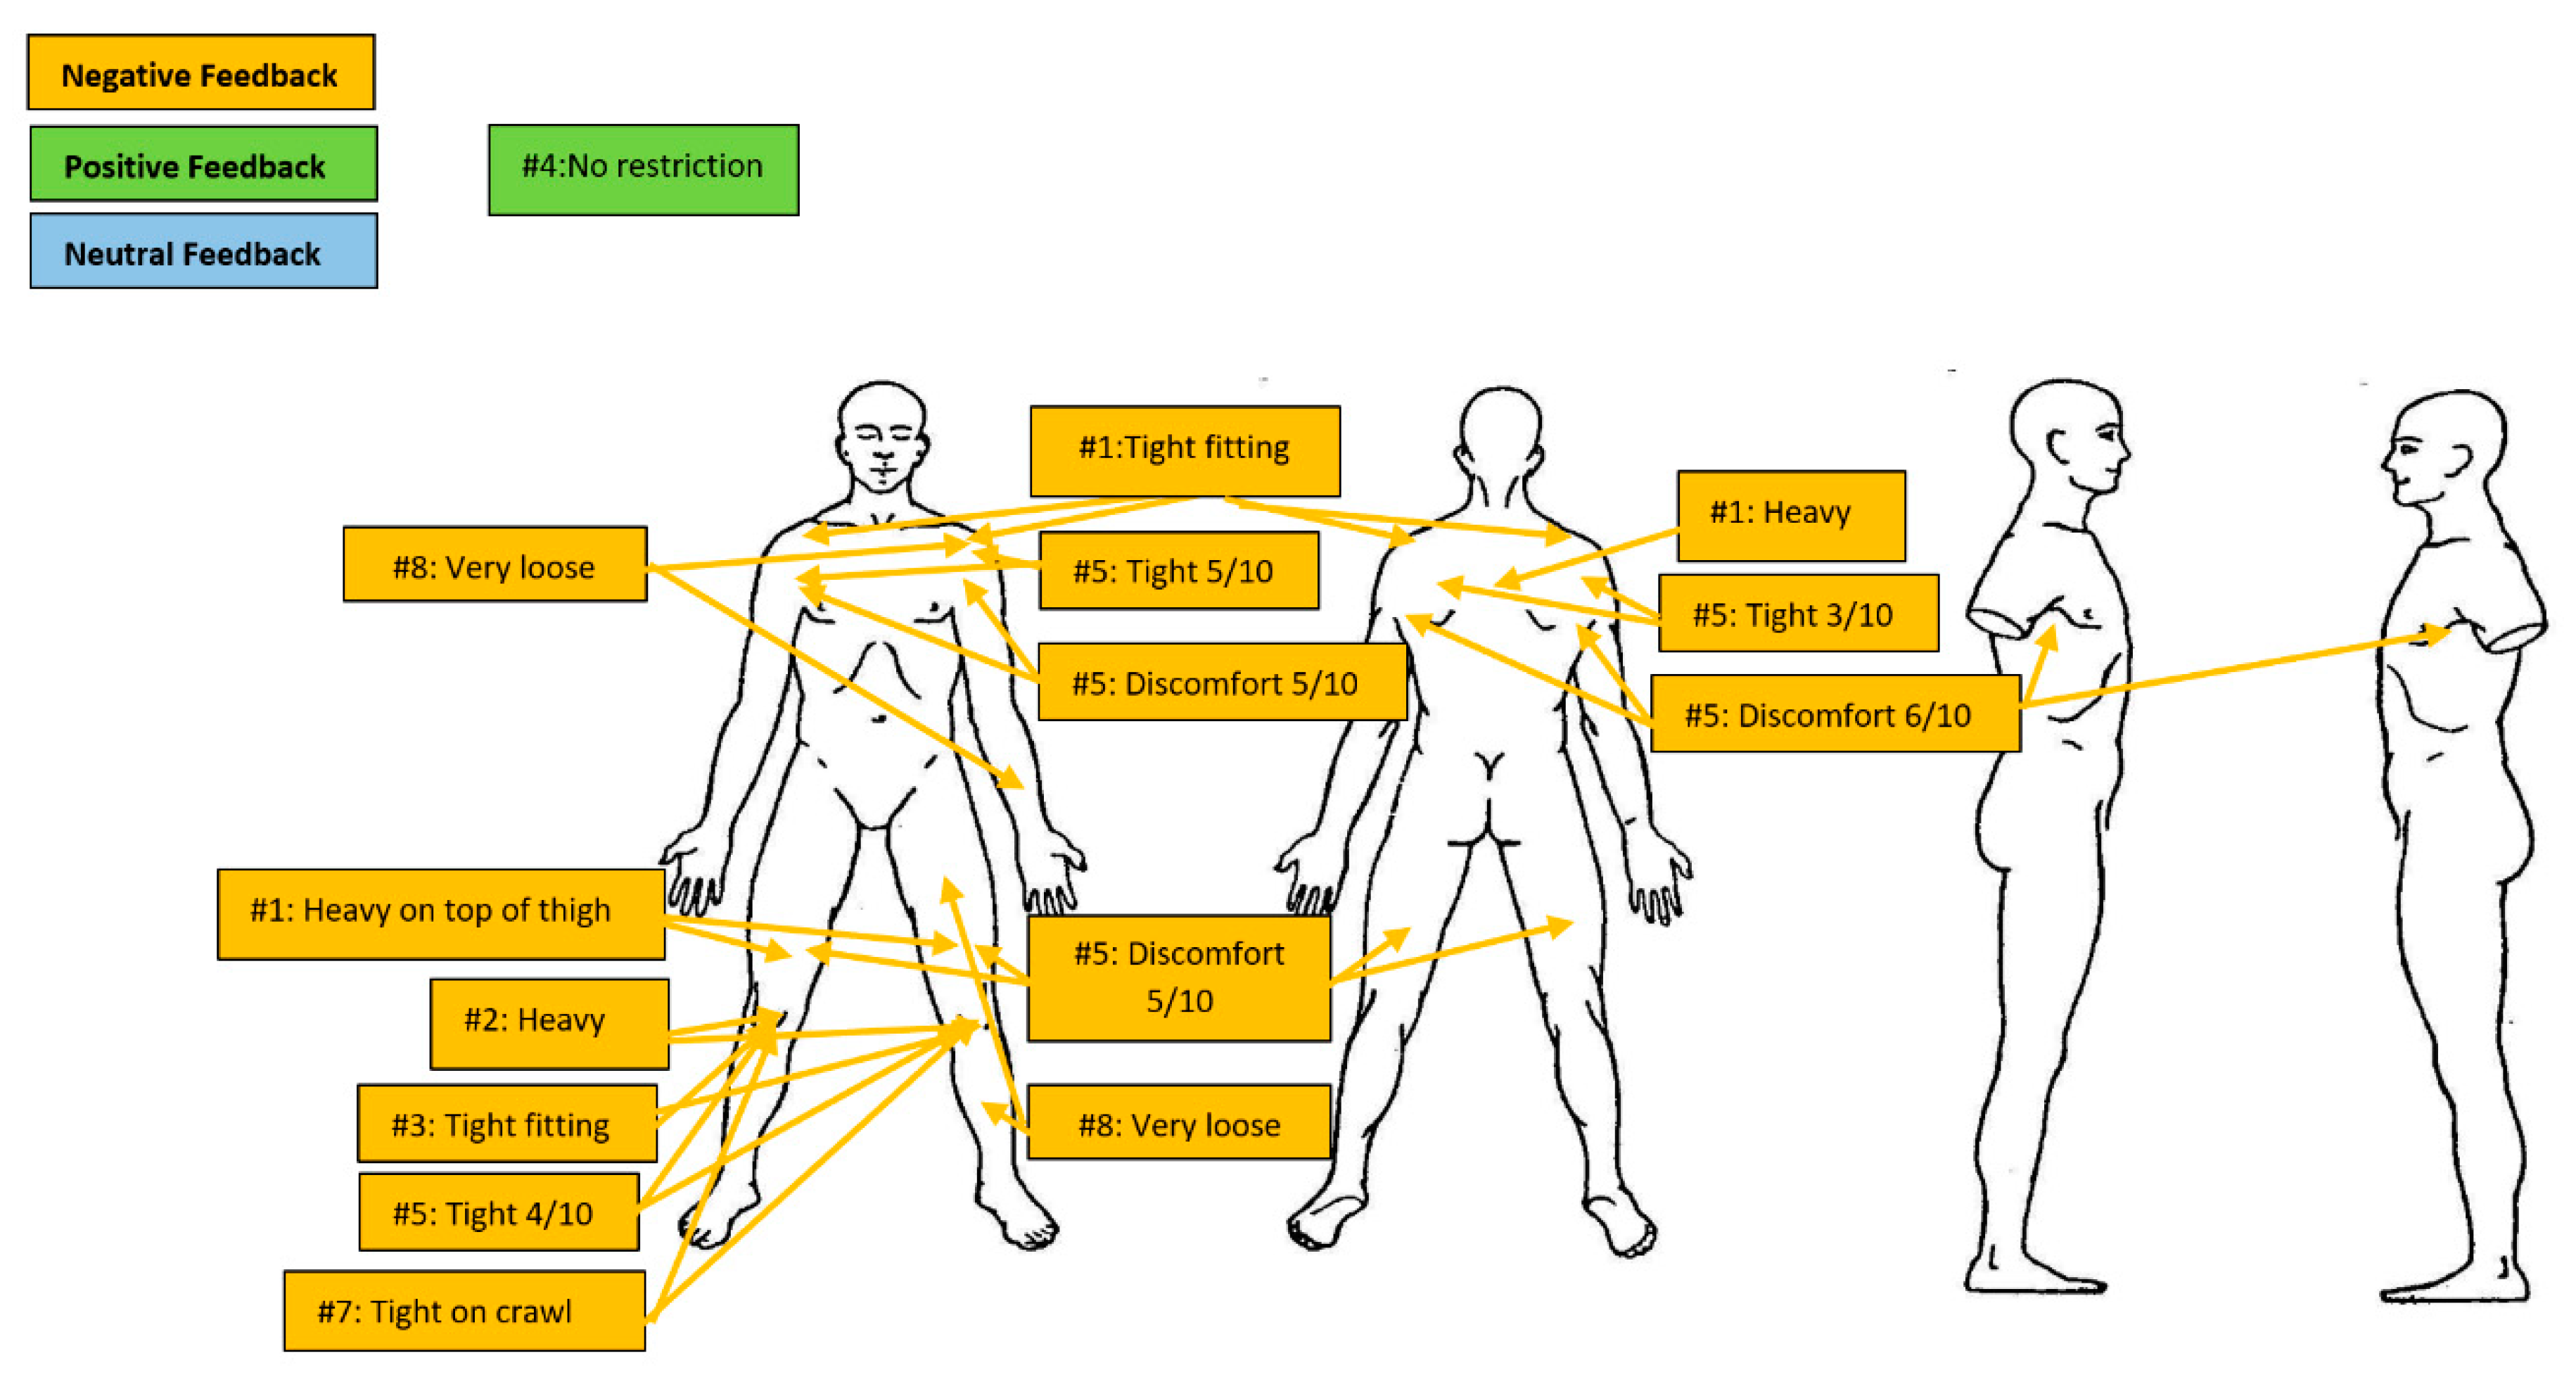
Figure 11, Figure 12, Figure 13, Figure 14 and Figure 15 depict subjective comments made regarding the comfort of each clothing variant. In general, V3 received notably more positive comments than any other variation and when compared to station wear (Figure 14). The negative comments regarding V3 were notably less than all other variations. When considering specific bodily regions, the most commonly commented on site was the knee. Discomfort and tightness around the knees were noted in V1 (7 comments, Figure 12), V2 (4 comments, Figure 13), station wear (4 comments, Figure 11), SV1 (3 comments, Figure 14), SV2 (3 comments, Figure 15), and V3 (1 comment: although V3 also had one positive comment). Restrictions and heaviness on the thighs were also noted in SV2 (5 comments), V2 (4 comments), station wear (3 comments), V1 (3 comments), SV1 (2 comments), SV1 (1 comment), and V3 (1 comment: although V3 also had one positive comment for comfort at back of thigh). Few negative comments were made around discomfort around the hip region with station wear and V1 both receiving 2 negative comments) followed by SV1 (1 comment). Likewise, the shoulder and underarm area received some, but few, negative comments with V2 and SV2 both receiving the most comments (2 comments) while V3 received both a negative and a positive comment. Similarly, across the upper back V2 received the most negative comments (2 comments) followed by the remaining variations (1 comment).
4. Discussion
The aim of this research was to compare the impacts on firefighter mobility of three different clothing variations against each other and a baseline measure (current daily station wear). Wearing V1 and SV1 resulted in significantly poorer FMS scores and poorer subjective ratings of performance and comfort across all tasks when compared to wearing station wear. Wearing V2 and V3 produced mixed results with V3 typically performing better than all other variations, including station wear.
Functional movement performance assessed by the FMS was significantly affected by clothing variation. V1 appears to be the most restrictive clothing variant, followed by the combination ensembles SV1 and SV2. The total FMS score when wearing V3 outperformed all clothing variations, including the participants’ current station wear. Of note, when worn in isolation (i.e., V1 or V2) or in combination with station wear (SV1 and SV2) overall, FMS performances were similar suggesting that V1 and V2 influences on performance were evident regardless of whether the variation was worn with, or without, station wear underneath.
The objective scoring of FMS performance of participants was generally in agreement with their subjective scores. The VAS scores reflecting how clothing impacted on performance found that participants considered V3 to improve their performance even above that of station wear (‘0’ score). V1 and SV1, however, scored poorly and were rated below the station wear score. Interestingly, the participants objectively performed the same, if not better, in V2 and SV2 when compared to station wear, yet, subjectively, rated their performance slightly below station wear.
Placing the FMS results of this study in context, previous research in an active tertiary population (101 male and 108 female adults aged 18–40 years) found a mean score of 15.7 (±1.9) points (25). In a population of 53 firefighter trainees (age = 40.4 ± 8.4 years, height = 178.5 ± 11.2 cm, body mass = 97.6 ± 19.4 kg, 14.8 ± 7.8 years of service) specifically, this score was found to be lower with trainees achieving a mean score of 12.09 (±2.75) points, although this score did increase to 13.66 (±2.28) points following an 8-week intervention program (26). While the FMS scores observed in the current study were higher than those observed in the aforementioned studies (general active population and firefighter trainees), they were nevertheless comparative to those observed in other studies of active duty service members (140 male and 107 female adults, n = 143 < 30 years of age, and n = 104 > 30 years of age) serving in the US military (16.2 ± 2.2 points) (27). On this basis, the impact of the V1 and SV1, in particular, was such that it lowered the mean FMS movement scores to a level approaching that associated with an increased risk of injury (14 points or less) in tactical populations (22).
Considering this, while the mean scores in the current study were still above 14 points, the participants were not wearing additional firefighter clothing (e.g., helmets) or equipment (SCBA) with the load weight associated with the wearing of equipment known to reduce FMS scores (28). As such, the decrease in performance from 15.4 (±1.8) points to 14.5 (±1.6) points may reduce movement performance to the level where just wearing the full clothing alone would increase their risk of injury due to its impact on movement proficiency. Conversely, wearing of clothing that allows for greater movement (e.g., V3 = 16.4 ± 2.5 points) to above that of their current clothing could help mitigate the impacts of their equipment and overall reduce injury risk. It should also be noted that while the mean scores were above 14 points, when individual data were considered, 12.5% of individuals scored 14 points or below in SV3, 25% in station wear and V2, and 37.5% in V1. When wearing SV1 20% of participants scored 14 points or below with this percentage increasing to 40% when participants wore SV2.
While only significantly different to V2 in both instances, both deep squat performance and rotatory stability, were worse in the V1 variation than any other clothing variation. This finding is of note given that these two movement patterns are associated with ankle, knee (deep squat) and trunk (rotary stability) range of motion and movement proficiency. These anatomical sites (knee, ankle and back) are leading sites of injury in firefighters (29, 30). Furthermore, seven of the eight participants specifically noted restriction around the knees when wearing V1, a figure higher than any of the other variations. The number of participants identifying restrictions in V1 reduced to three of eight participants when wearing SV1. This performance outcome is noted by the participants subjectively who made specific comments on the mannequin body charts regarding the impacts V1 and SV2 were perceived as having on a squatting movement. Furthermore, V1 VAS scored the lowest when compared against all other variations (−3.43 ± 2.70 mm) but improved slightly when combined with station wear (−2.14 ± 0.67 mm). Likewise, the perceived negative impact of clothing on the FMS overall found in V1 could also be influenced by the restriction noted in subjective comments where a participant noted restrictions in their ability to bend over. Given these findings, clothing that has minimal impact or enhances performance in the squat or rotary stability movement patterns may aid in mitigating injury risk, however, further research is required to support this supposition.
When comparing the individual clothing variations (station wear, V1–V3), lower limb power when wearing V1 was lower than that of the other variations, a finding subjectively supported by participants on the VAS (Table 3). Conversely, when compared to station wear, wearing V3 improved jump height, again supported by the positive VAS score. There was little change between V2 and station wear (slight increase in mean jump height by +0.12 cm and decrease in subjective ratings of -0.91 mm). In both instances when station wear was added to V1 and V2 (i.e., SV1 and SV2 variations), performance decreased. This suggests that additional layers of clothing may have impacted on performance to a greater extent that V1 or V2 alone in the production of power but not necessarily in mobility.
The best mean vertical jump height of 41.25 cm (±6.54 cm) when participants in this study were dressed in V3, is comparable to those recorded for 43 male firefighters attending academy training of 41.6 cm (±6.23 cm) (31) and slightly below a group of 145 male and female wildland firefighters (mean ranges 43.0–43.9 cm). As such, the results of the firefighters in this group can be considered typical of a firefighter population, although it should be noted that the firefighters in this study were dressed in V3 and wearing boots, as opposed to wearing gymnasium clothing.
Vertical jump performance has been associated with an increased risk of injury and/or illness in a law enforcement population. Notably, police trainees with lower vertical jump heights (42.03 ± 7.35 cm) were associated with an increased risk of injury when compared to colleagues that jumped higher (44.00 ± 7.56 cm) (32). On this basis, the reduced lower limb power when wearing V1, SV1 and SV2 (as assessed via the vertical jump), may increase firefighter risk of injury. Conversely, clothing that allows for an increase in vertical jump height above that of clothing currently worn, may mitigate current injury risk.
Overall, V3 appeared, subjectively, to be the most preferred type of clothing variation worn by firefighters when compared across all four tasks. Across all four tasks, officers often considered V3 to allow for an increased ability to complete the task above that of other variations including station wear.
When subjective evaluation data from all clothing variations were collated (Figure 11, Figure 12, Figure 13, Figure 14 and Figure 15), it was apparent that the major areas of discomfort for the clothing were in relation to fit around the knees and thighs. Specific comments relating to the impact of the clothing on the knees and thighs were also aligned to the stair climbing, crawling tasks and squatting tasks. While V1 was specifically noted as impacting on the stepping task and was rated by participants as having the greatest negative impact on movement for clothing variations V1–V3, SV2 was considered as having the greatest negative impact on both the step ups and crawl. The perceived impacts of SV2 on the crawl, as graded by the VAS, was supported by comments on the body charts which specifically note the V2 and SV2 variations as having a negative impact on the crawl task.
These results suggest that participants perceived clothing variations to have unique impact on different tasks. For example, V1 was considered to have had the greatest negative impact on the FMS, SV1 on the vertical jump, and SV2 on the step ups and crawl. Likewise, when clothing was combined with station wear, SV1 was considered to have had the greatest negative impact on FMS and vertical jump, while SV2 had the greatest impacts on the step ups and crawl.
5. Conclusions
Overall, participating officers found V3 to be more comfortable than station wear and considered this clothing variation to have improved their ability to perform tasks with these subjective accounts aligning with the objective performance results in the FMS and vertical jump. Generally, V1 had the greatest negative impact on participant performance, comfort and perceived impact on performance. However, this impact was variable and either did not change, as was the case in the FMS, or, in some instances, were compounded, as was the case in the vertical jump, by the addition of the station wear. Based on the perception of clothing impacts on performance, results were more variable, especially between SV1 and SV2 where the task being performed determined the level of discomfort, thus highlighting the potential different impacts of the clothing variations based on the tasks being performed. Given the associations between injuries and both FMS and vertical jump performance, any clothing variation that has the least impact on lower limb power development and ability to perform functional movements may help reduce firefighter injury risk. Furthermore, clothing that allows for better performance than current clothing may provide a risk mitigation to current injury levels especially given that not all injuries to firefighters occur while conducting fire suppression duties. This research supports and expands on the current scientific evidence regarding the impacts of firefighter clothing on mobility and provides avenues for future research to focus on firefighter clothing as an approach to mitigate firefighter injuries through potentially improving movement capacity and comfort.
Author Contributions
Conceptualization, R.O.; methodology, R.O., B.S. and E.C.; ethics, R.O. and B.S.; formal analysis, D.M., E.C. and B.S.; investigation, R.O., E.C., D.M. and B.S.; writing—original draft preparation, R.O. and V.S.; writing—review and editing, V.S., B.S. and E.C.; supervision, R.O.; project administration, B.S., E.C. and D.M.; funding acquisition, R.O.
Funding
This research was funded by Australian Defence Apparel.
Acknowledgments
The authors would like to thank the Australian state firefighter agency that assisted in this research.
Conflicts of Interest
The authors declare no conflict of interest.
References
- Walker, A.; Pope, R.; Schram, B.; Gorey, R.; Orr, R. The Impact of Occupational Tasks on Firefighter Hydration During a Live Structural Fire. Safety 2019, 5, 36. [Google Scholar] [CrossRef]
- Vu, V.; Walker, A.; Ball, N.; Spratford, W. Ankle restrictive firefighting boots alter the lumbar biomechanics during landing tasks. Appl. Ergon. 2017, 65, 123–129. [Google Scholar] [CrossRef] [PubMed]
- Park, H.; Kakar, R.S.; Pei, J.; Tome, J.M.; Stull, J. Impact of Size of Fire boot and SCBA Cylinder on Firefighters’ Mobility. Cloth. Text. Res. J. 2019, 37, 103–118. [Google Scholar] [CrossRef]
- Baran, K.; Dulla, J.; Orr, R.M.; Dawes, J.; Pope, R.R. Duty Loads carried by LA Sheriff’s Department Deputies. J. Aust. Strength Cond. 2018, 26, 34–38. [Google Scholar]
- Carlton, S.D.; Carbone, P.D.; Stierli, M.; Orr, R.M. The impact of occupational load carriage on the mobility of the tactical police officer. J. Aust. Strength Cond. 2014, 21, 32–37. [Google Scholar]
- Orr, R.M.; Pope, R.; Coyle, J.; Johnston, V. Occupational loads carried by Australian soldiers on military operations. J. Health Saf. Environ. 2015, 31, 451–467. [Google Scholar]
- Dean, C. Task Force Devil Combined Arms Assessment Team: The Modern Warrior’s Combat Load. In US Army Center for Army Lessons Learned; Center for Army Lessons Learned (CALL): Leavenworth County, KS, USA, 2003. [Google Scholar]
- Taylor, N.A.; Lewis, M.C.; Notley, S.R.; Peoples, G.E. A fractionation of the physiological burden of the personal protective equipment worn by firefighters. Eur. J. Appl. Physiol. 2012, 112, 2913–2921. [Google Scholar] [CrossRef]
- Knapik, J.J.; Reynolds, K.; Orr, R.; Pope, R. Load Carriage-Related Paresthesias (Part 2): Meralgia Paresthetica. J. Spec. Oper. Med. Peer Rev. J. SOF Med. Prof. 2017, 17, 94. [Google Scholar]
- Knapik, J.J.; Reynolds, K.; Orr, R.; Pope, R. Load Carriage-Related Paresthesias (Part 1): Rucksack Palsy and Digitalgia Paresthetica. J. Spec. Oper. Med. Peer Rev. J. SOF Med. Prof. 2016, 15, 37–42. [Google Scholar]
- Orr, R.M.; Pope, R. Gender differences in load carriage injuries of Australian army soldiers. BMC Musculoskelet. Disord. 2016, 17, 488. [Google Scholar] [CrossRef]
- Orr, R.M.; Coyle, J.; Johnston, V.; Pope, R. Self-reported load carriage injuries of military soldiers. Int. J. Injury Control Saf. Promot. 2017, 24, 189–197. [Google Scholar] [CrossRef] [PubMed]
- Park, K.; Hur, P.; Rosengren, K.S.; Horn, G.P.; Hsiao-Wecksler, E.T. Changes in Kinetic and Kinematic Gait Parameters Due To Firefighting Air Bottle Configuration. In Proceedings of the NACOB, Ann Arbor, MI, USA, 5–9 August 2008. [Google Scholar]
- Ruby, B.C.; Leadbetter, G.W., III; Armstrong, D.; Gaskill, S.E. Wildland firefighter load carriage: Effects on transit time and physiological responses during simulated escape to safety zone. Int. J. Wildland Fires 2003, 111–116. [Google Scholar] [CrossRef]
- Park, H.; Kim, S.; Morris, K.; Moukperian, M.; Moon, Y.; Stull, J. Effect of firefighters’ personal protective equipment on gait. Appl. Ergon. 2015, 48, 42–48. [Google Scholar] [CrossRef] [PubMed]
- Myers, C.; Orr, R.; Goad, K.; Schram, B.; Lockie, R.; Dawes, J. Comparing Levels of Fitness of Police Officers Between Two United States Law Enforcement Agencies. Work 2019. [Google Scholar] [CrossRef]
- Dawes, J.J.; Orr, R.M.; Flores, R.R.; Lockie, R.G.; Kornhauser, C.; Holmes, R. A physical fitness profile of state highway patrol officers by gender and age. Ann. Occup. Environ. Med. 2017, 29, 16. [Google Scholar] [CrossRef]
- Dawes, J.; Orr, R.; Lockie, R.; Kornhauser, C.; Holmes, R. The validity of self-reported measures of height, body mass and BMI in a population of police officers. J. Crim. Stud. 2019, 24. [Google Scholar] [CrossRef]
- Cook, G.; Burton, L.; Hoogenboom, B. Pre-participation screening: The use of fundamental movements as an assessment of function—Part 1. N. Am. J. Sports Phy. Ther. 2006, 1, 62–72. [Google Scholar]
- Teyhen, D.S.; Shaffer, S.W.; Lorenson, C.L.; Halfpap, J.P.; Donofry, D.F.; Walker, M.J.; Dugan, J.L.; Childs, J.D. The Functional Movement Screen: A reliability study. J. Orthop. Sports Phys. Ther. 2012, 42, 530–540. [Google Scholar] [CrossRef]
- Gribble, P.A.; Brigle, J.; Pietrosimone, B.G.; Pfile, K.R.; Webster, K.A. Intrarater reliability of the functional movement screen. J. Strength Cond. Res. 2013, 27, 978–981. [Google Scholar] [CrossRef]
- Bock, C.; Orr, R.M. Use of the functional movement screen in a tactical population: A review. J. Mil. Veterans’ Health 2015, 23, 33–42. [Google Scholar]
- Nindl, B.C.; Barnes, B.R.; Alemany, J.A.; Frykman, P.N.; Shippee, R.L.; Friedl, K.E. Physiological consequences of US Army Ranger training. Med. Sci. Sports Exerc. 2007, 39, 1380–1387. [Google Scholar] [CrossRef] [PubMed]
- Schram, B.; Hinton, B.; Orr, R.; Pope, R.; Norris, G. The perceived effects and comfort of various body armour systems on police officers while performing occupational tasks. Ann. Occup. Environ. Med. 2018, 30, 15. [Google Scholar] [CrossRef] [PubMed]
Figure 1.
Clothing variation 1 (V1), variation 2 (V2), and variation 3 (V3).

Figure 2.
Visual Analogue Scale (VAS) rating scoring sheet.
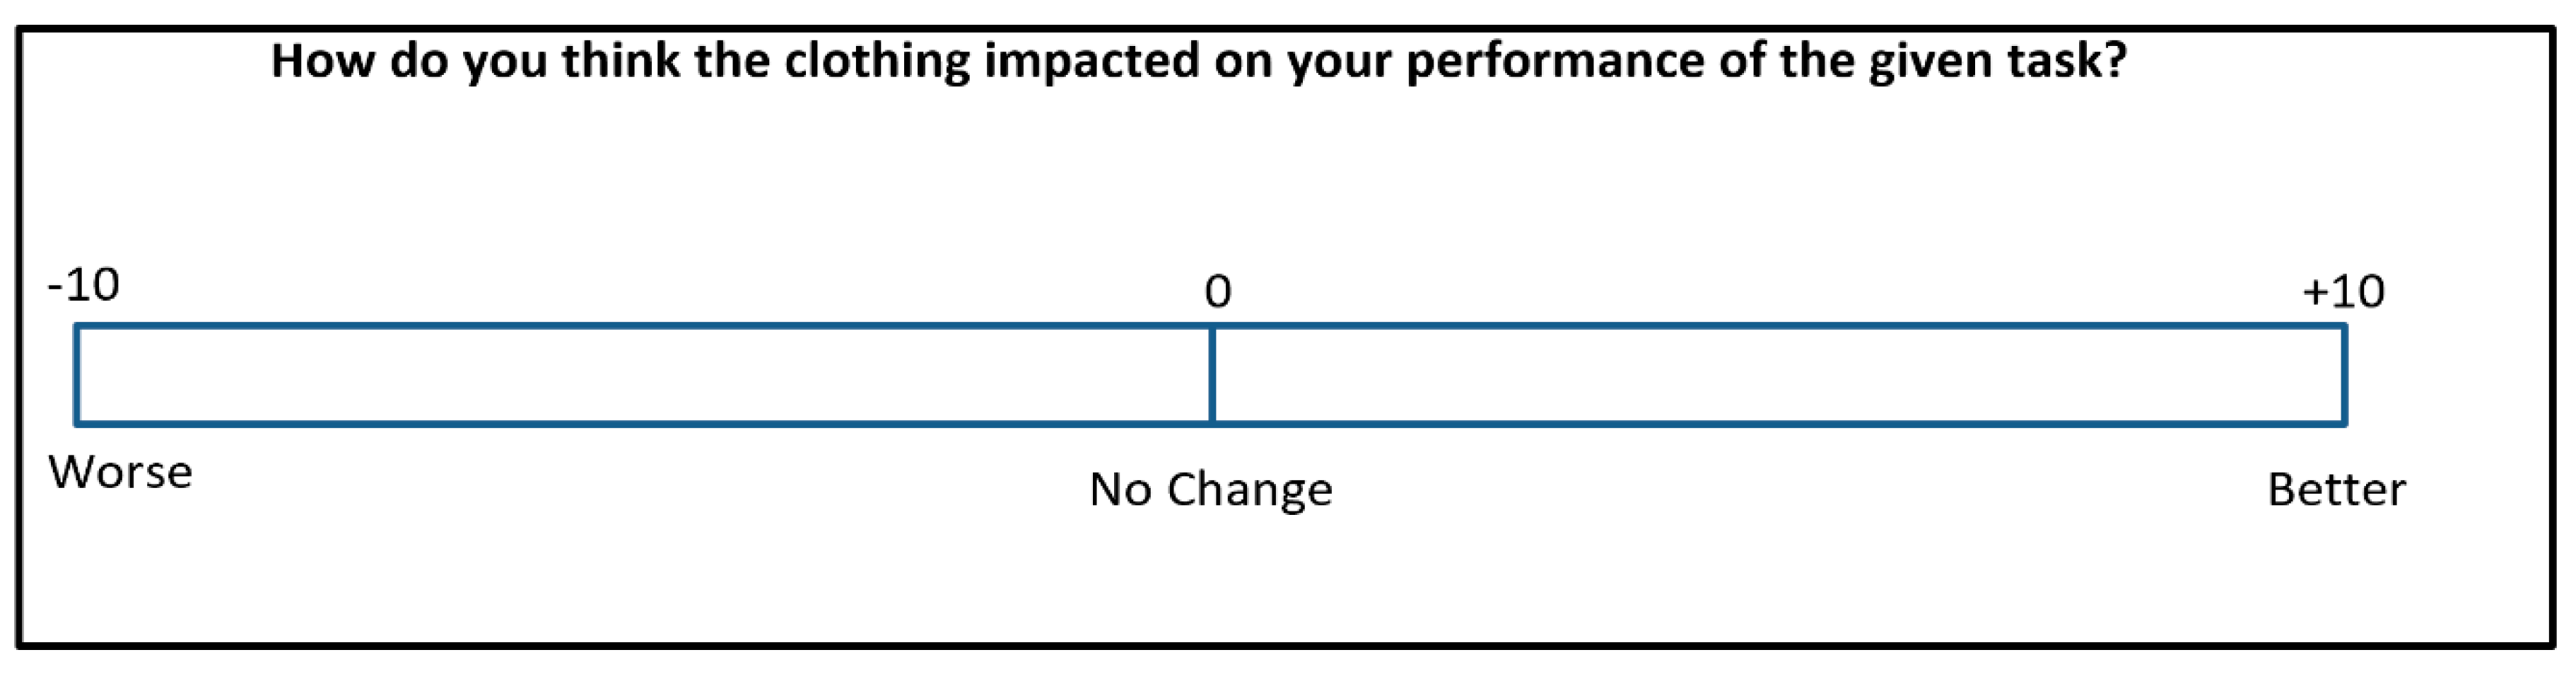
Figure 3.
Mannequin sketch to mark any areas of discomfort.

Figure 4.
Overhead reach when compared to station wear (0 cm).

Figure 5.
Vertical jump results in each clothing variant.

Figure 6.
Change in vertical jump scores from baseline (station wear = 0 cm).
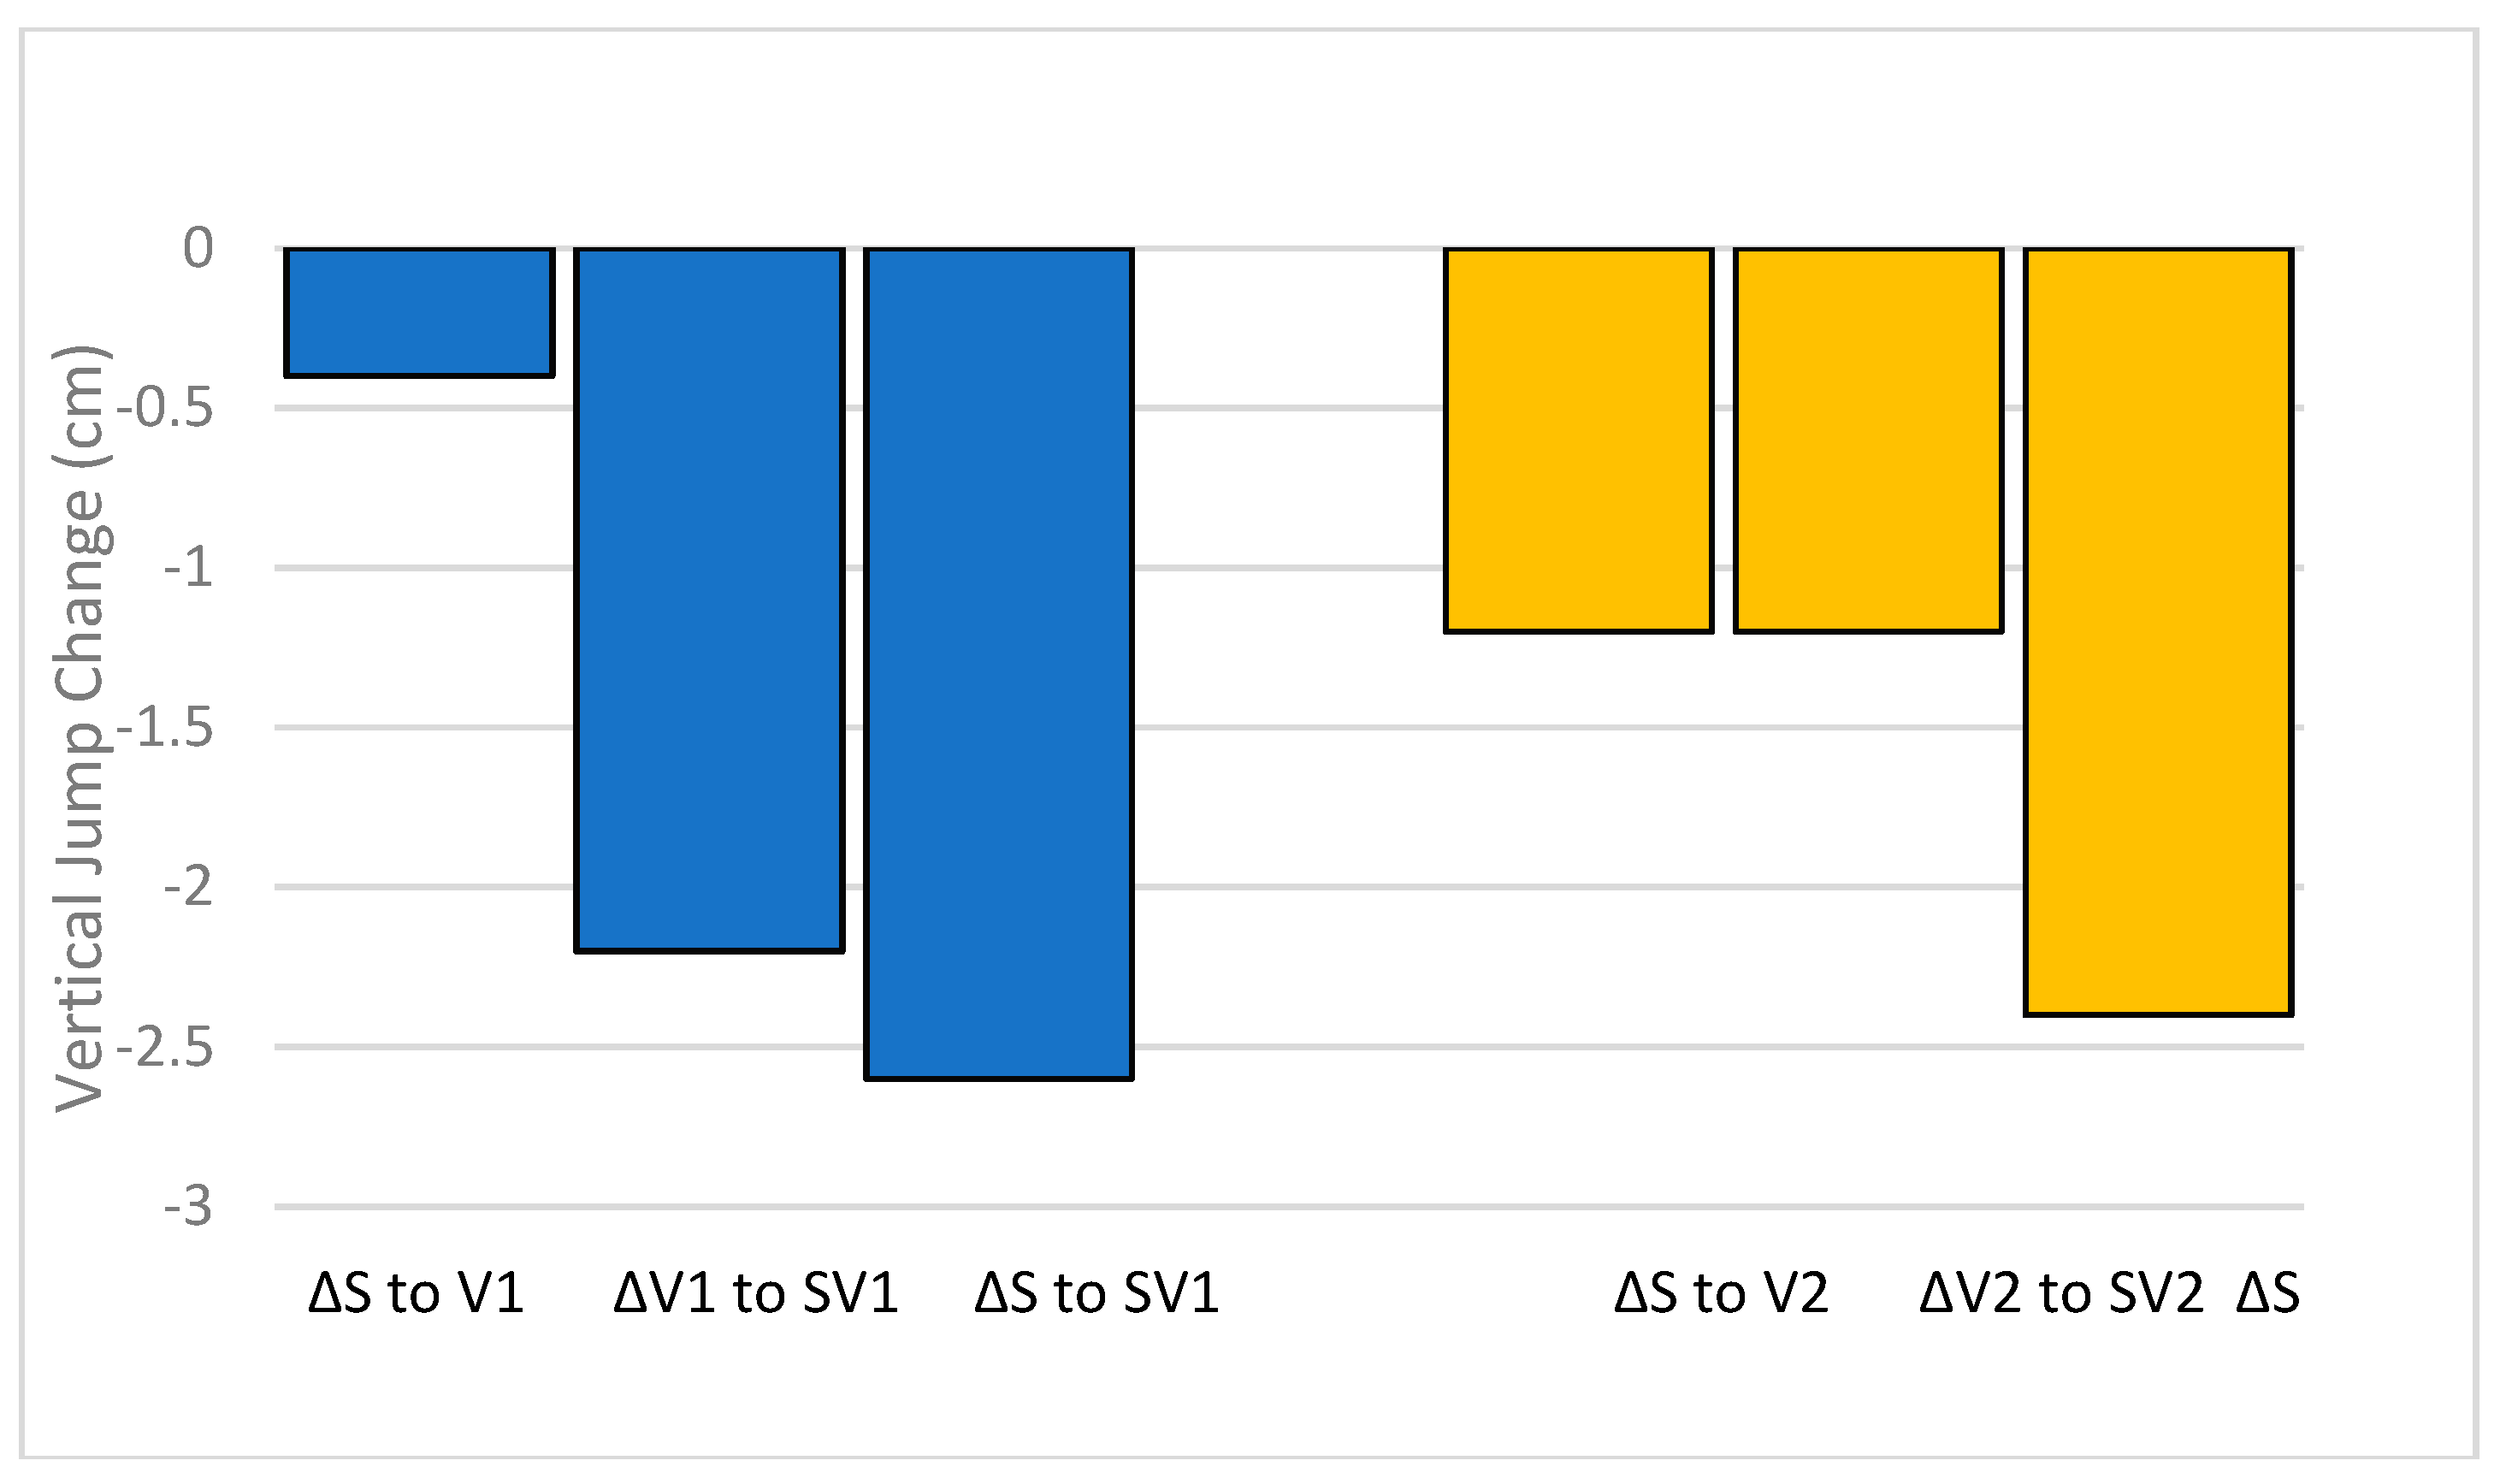
Figure 7.
Subjective results of the FMS when compared to station wear.
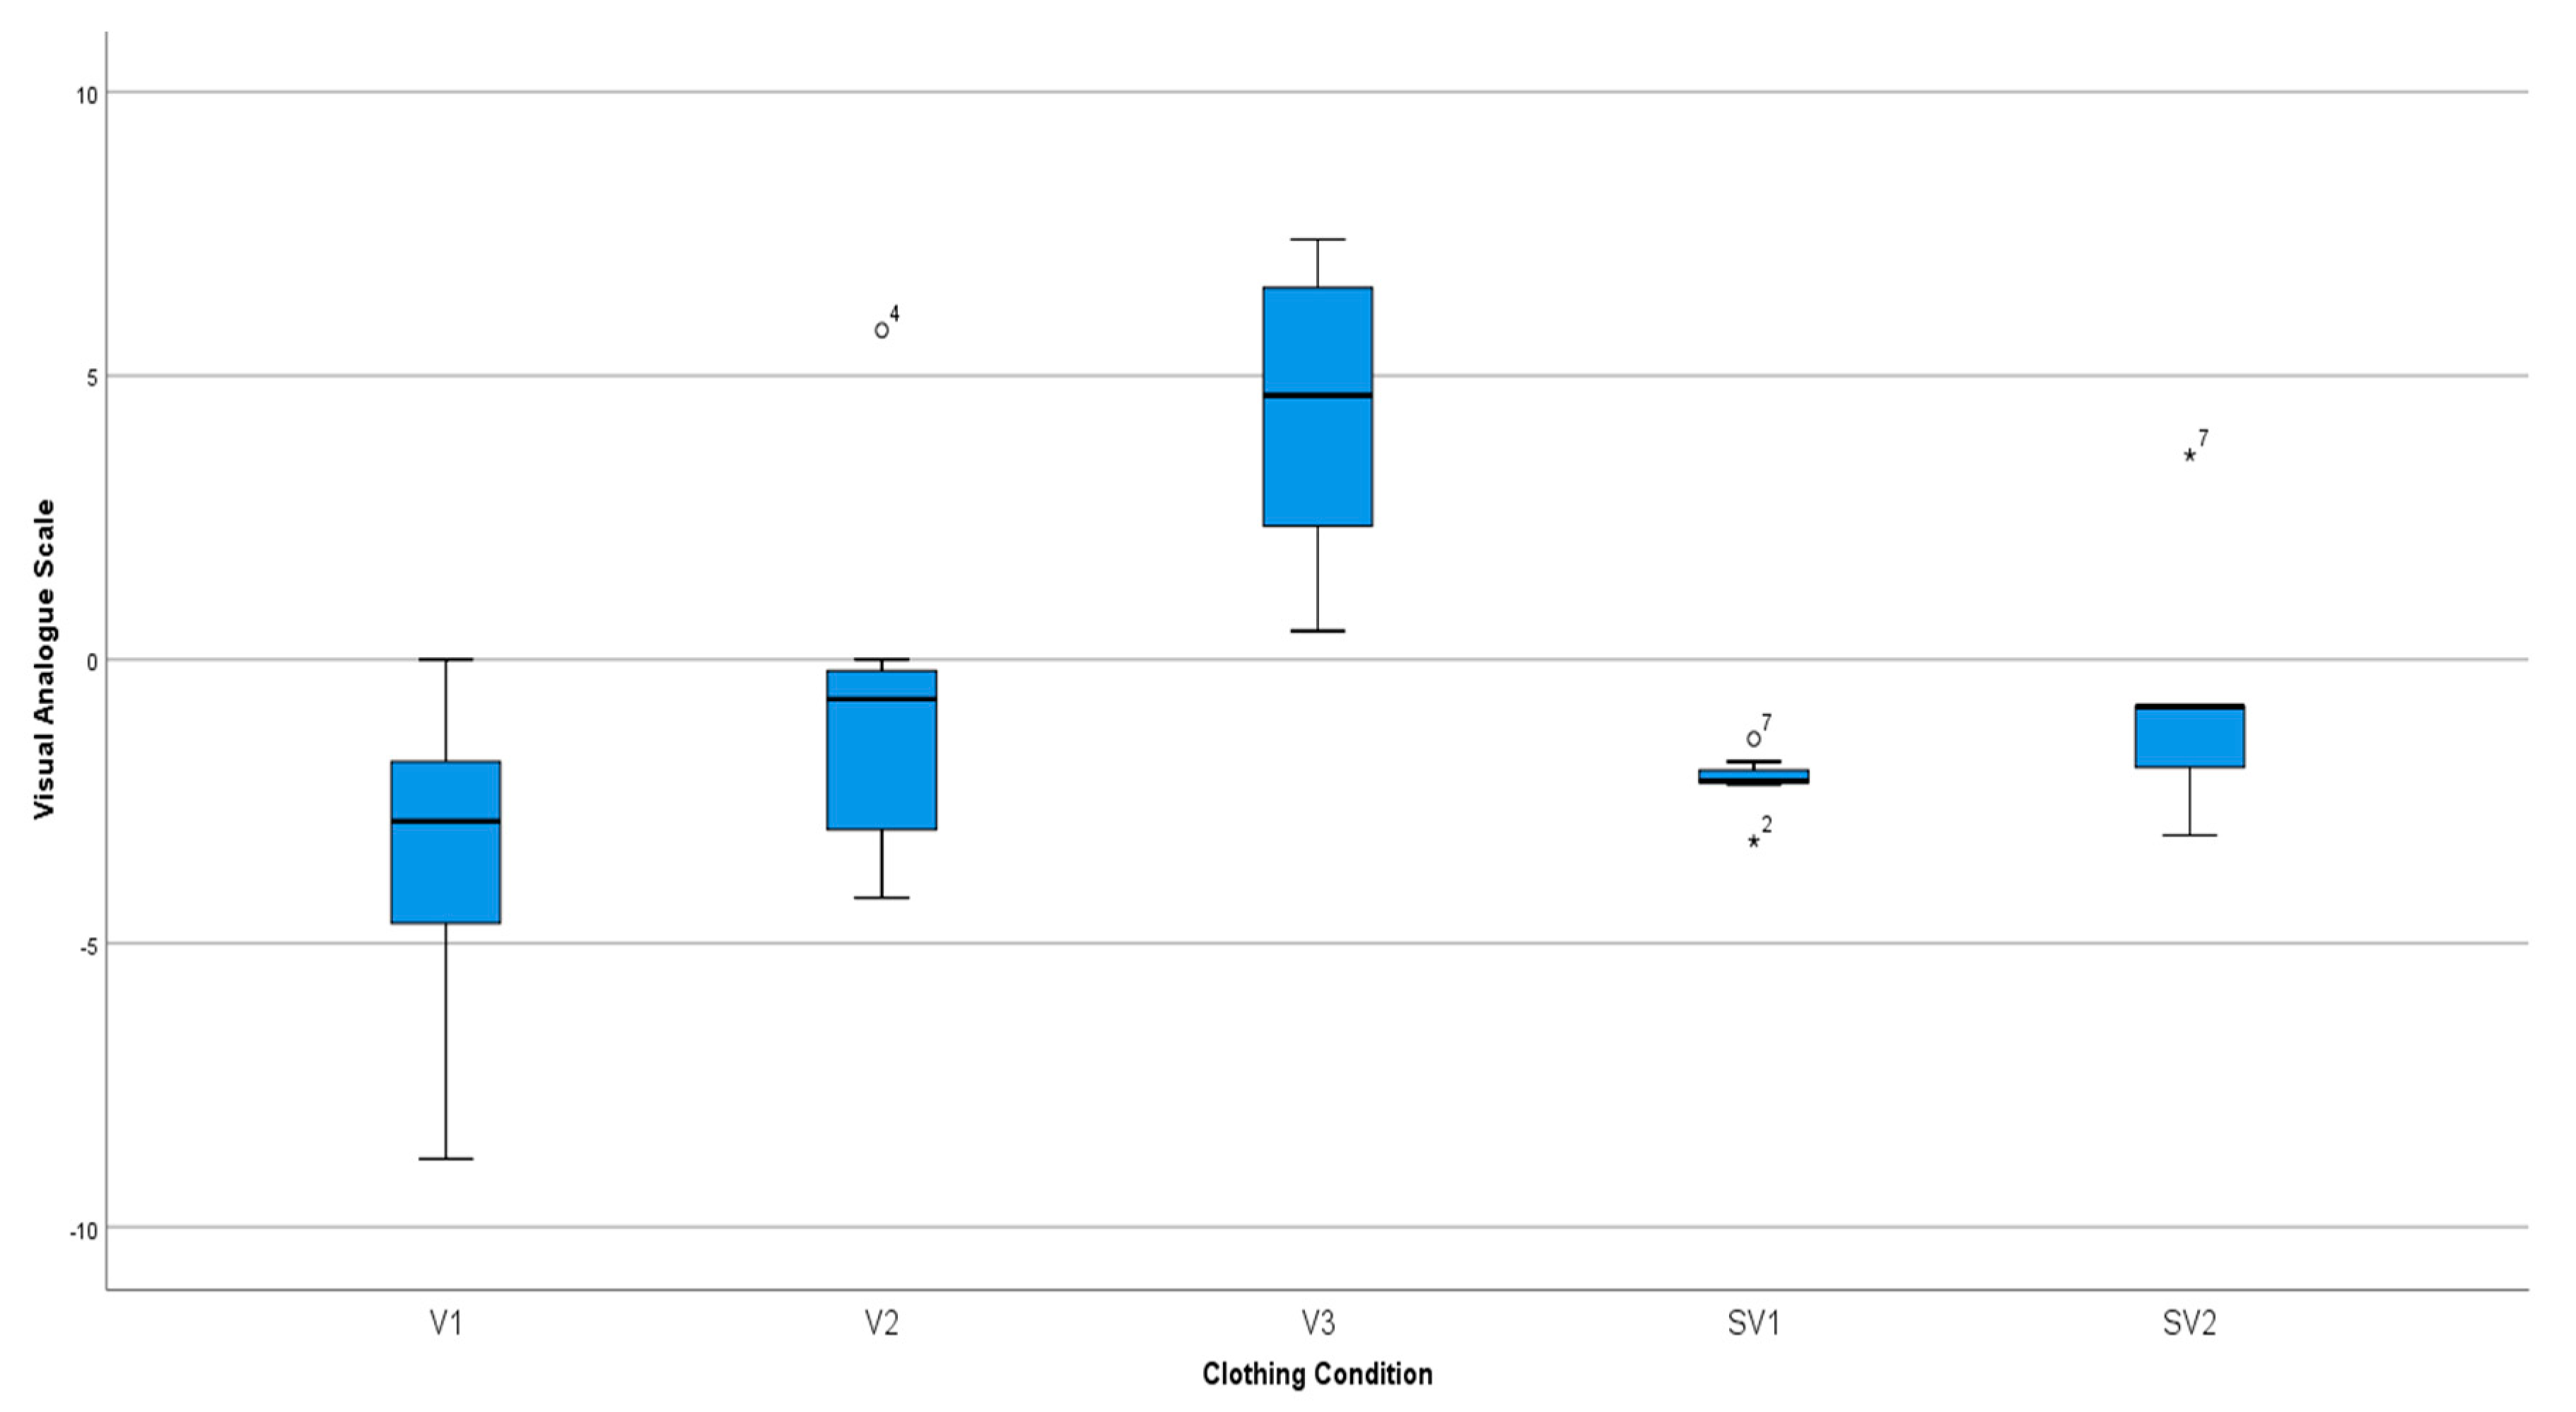
Figure 8.
Subjective results of the Vertical Jump when compared to station wear.

Figure 9.
Subjective results of the Step-up Task compared to station wear.

Figure 10.
Subjective results of the crawl task compared to station wear.

Figure 11.
Subjective feedback (n = 8) on normal station wear (# signifies participant number; scores out of 10 signify discomfort level).
Figure 11.
Subjective feedback (n = 8) on normal station wear (# signifies participant number; scores out of 10 signify discomfort level).

Figure 12.
Subjective feedback on Variant 1 (# signifies participant number; scores out of 10 signify discomfort level).
Figure 12.
Subjective feedback on Variant 1 (# signifies participant number; scores out of 10 signify discomfort level).

Figure 13.
Subjective feedback on Variant 2 (# signifies participant number; scores out of 10 signify discomfort level).
Figure 13.
Subjective feedback on Variant 2 (# signifies participant number; scores out of 10 signify discomfort level).

Figure 14.
Subjective feedback (n = 8) on Variant 3 (#signifies participant number; scores out of 10 signify discomfort level).
Figure 14.
Subjective feedback (n = 8) on Variant 3 (#signifies participant number; scores out of 10 signify discomfort level).

Figure 15.
Subjective feedback (n = 5) on station wear with Variant 2 (SV2) (# signifies participant number; scores out of 10 signify discomfort level).
Figure 15.
Subjective feedback (n = 5) on station wear with Variant 2 (SV2) (# signifies participant number; scores out of 10 signify discomfort level).


Table 1.
FMS results (mean ± SD) by clothing ensembles and Functional Movement Screen (FMS) movement task and overall.
Table 1.
FMS results (mean ± SD) by clothing ensembles and Functional Movement Screen (FMS) movement task and overall.
| FMS Measure | S (n = 8) | V1 (n = 8) | V2 (n = 8) | V3 (n = 8) | SV1 (n = 5) | SV2 (n = 5) |
|---|---|---|---|---|---|---|
| Deep squat | 2.4 ± 0.5 | 2.0 ± 0.8 | 2.6 ± 0.5 a | 2.5 ± 0.5 | 2.2 ± 0.8 | 2.4 ± 0.5 |
| Hurdle step | 1.9 ± 0.4 | 1.9 ± 0.6 | 1.9 ± 0.4 | 2.3 ± 0.7 | 1.6 ± 0.5 | 1.8 ± 0.4 |
| Inline lunge | 2.1 ± 0.4 | 2.1 ± 0.4 | 2.3 ± 0.6 | 2.1 ± 0.6 | 2.0 ± 0.0 | 2.2 ± 0.4 |
| Shoulder mobility | 2.0 ± 0.8 | 1.8 ± 0.9 | 2.0 ± 0.8 | 2.1 ± 0.6 | 2.0 ± 1.0 | 2.0 ± 0.0 |
| Active straight leg raise | 2.6 ± 0.5 | 2.3 ± 0.5 | 2.3 ± 0.5 | 2.8 ± 0.5 | 2.0 ± 0.7 | 2.6 ± 0.5 |
| Trunk stability push-up | 3.0 ± 0.0 | 3.0 ± 0.0 | 3.0 ± 0.0 | 3.0 ± 0.0 | 3.0 ± 0.0 | 3.0 ± 0.0 |
| Rotary stability | 1.4 ± 0.5 | 1.5 ± 0.5 | 1.9 ± 0.4 b | 2.0 ± 0.0 | 1.4 ± 0.5 | 1.6 ± 0.5 |
| Total | 15.4 ± 1.8 | 14.5 ± 1.6 | 15.9 ± 1.6 a | 16.4 ± 2.5 a | 14.6 ± 2.3 | 15.4 ± 1.1 |
a = significantly different to V1 (p < 0.05) b = significantly different to station wear (p < 0.05). S = Station wear. V1–V3 = clothing variations 1–3. SV1–SV2 = combination of station wear and either V1 or V2 variations.
Table 2.
Reach change scores (mean ± SD) and vertical jump results (mean ± SD (range)) by clothing ensemble.
Table 2.
Reach change scores (mean ± SD) and vertical jump results (mean ± SD (range)) by clothing ensemble.
| Measures | S (n = 8) | V1 (n = 8) | V2 (n = 8) | V3 (n = 8) | SV1 (n = 5) | SV2 (n = 5) |
|---|---|---|---|---|---|---|
| Change in Reach (cm) | 0 * | 0.13 ± 0.99 | 1.25 ± 1.16 | 1.00 ± 1.07 | −0.13 ± 1.73 | 1.18 ± 0.92 |
| Vertical Jump (cm) | 39.38 ± 6.70 (28–50) | 37.75 ± 5.06 (28–43) | 39.50 ± 5.90 (31–46) | 41.25 ± 6.54 (31–51) | 37.80 ± 6.10 (31–45) | 35.80 ± 7.50 (26–47) |
* Baseline data. S = Station wear. V1–V3 = clothing variations 1–3. SV1–SV2 = combination of station wear and either V1 or V2.
Table 3.
Subjective results (mean ± SD) between the different assessments.
| Activity | V1 (n = 8) | V2 (n = 8) | V3 (n = 8) | SV1 (n = 5) | SV2 (n = 5) |
|---|---|---|---|---|---|
| FMS | −3.43 ± 2.70 * | −0.78 ± 3.11 * | 4.38 ± 2.51 | −2.14 ± 0.67 * | −0.83 ± 3.01 |
| Vertical jump | −2.44 ± 2.40 * | −0.91 ± 2.41* | 2.18 ± 2.61 | −3.34 ± 1.27 * | −0.88 ± 1.65 |
| Step Ups | −2.11 ± 3.22 * | −1.60 ± 3.64 | 3.36 ± 2.24 | −2.82 ± 0.86 | −3.42 ± 1.10 * |
| Crawl | −1.05 ± 3.85 | −0.96 ± 2.95 | 2.97 ± 2.35 | −1.08 ± 3.68 | −3.46 ± 1.15 * |
Data displayed in millimeters (mm). Negative ratings signify worse score compared to station wear * Significantly worse rating than V3 (p < 0.05). V1–V3 = clothing variations 1–3. SV1–SV2 = combination of station wear and either V1 or V2 variations.
© 2019 by the authors. Licensee MDPI, Basel, Switzerland. This article is an open access article distributed under the terms and conditions of the Creative Commons Attribution (CC BY) license (http://creativecommons.org/licenses/by/4.0/).
Share and Cite
MDPI and ACS Style
Orr, R.; Simas, V.; Canetti, E.; Maupin, D.; Schram, B. Impact of Various Clothing Variations on Firefighter Mobility: A Pilot Study. Safety 2019, 5, 78. https://0-doi-org.brum.beds.ac.uk/10.3390/safety5040078
AMA Style
Orr R, Simas V, Canetti E, Maupin D, Schram B. Impact of Various Clothing Variations on Firefighter Mobility: A Pilot Study. Safety. 2019; 5(4):78. https://0-doi-org.brum.beds.ac.uk/10.3390/safety5040078
Chicago/Turabian StyleOrr, Robin, Vini Simas, Elisa Canetti, Daniel Maupin, and Ben Schram. 2019. "Impact of Various Clothing Variations on Firefighter Mobility: A Pilot Study" Safety 5, no. 4: 78. https://0-doi-org.brum.beds.ac.uk/10.3390/safety5040078
Note that from the first issue of 2016, this journal uses article numbers instead of page numbers. See further details here.