Article

Effect of Road Markings and Traffic Signs Presence on Young Driver Stress Level, Eye Movement and Behaviour in Night-Time Conditions: A Driving Simulator Study

1
Faculty of Transport and Traffic Sciences, University of Zagreb, Zagreb 10000, Croatia
2
Faculty of Mechanical Engineering and Naval Architecture, University of Zagreb, Zagreb 10000, Croatia
3
Department of Neurology, Sveti Duh University Hospital, Zagreb 10000, Croatia
*
Author to whom correspondence should be addressed.
Submission received: 20 March 2020 / Revised: 20 April 2020 / Accepted: 2 May 2020 / Published: 11 May 2020
(This article belongs to the Special Issue Sustainable and Safe Road Design)

Abstract

:
The study investigates how the presence of traffic signalling elements (road markings and traffic signs) affects the behaviour of young drivers in night-time conditions. Statistics show that young drivers (≤30 years old) are often involved in road accidents, especially those that occur in night-time conditions. Among other factors, this is due to lack of experience, overestimation of their ability or the desire to prove themselves. A driving simulator scenario was developed for the purpose of the research and 32 young drivers took two runs using it: (a) one containing no road markings and traffic signs and (b) one containing road markings and traffic signs. In addition to the driving simulator, eye tracking glasses were used to track eye movement and an electrocardiograph was used to monitor the heart rate and to determine the level of stress during the runs. The results show statistically significant differences (dependent samples t-test) between the two runs concerning driving speed, lateral position of the vehicle, and visual scanning of the environment. The results prove that road markings and traffic signs provide the drivers with timely and relevant information related to the upcoming situation, thus enabling them to adjust their driving accordingly. The results are valuable to road authorities and provide an explicit confirmation of the importance of traffic signalling for the behaviour of young drivers in night-time conditions, and thus for the overall traffic safety.

1. Introduction

Night-time driving represents one of the most complex driving conditions. Human eye functions are the best at high levels of illumination, while during night-time our visual field is narrowed and shortened, and the perception of colour, shape, texture, contrast and movement is reduced. This is due to the fact that the vision is progressively mediated by rod photoreceptors (specialised for low lighting) as light levels reduce [1]. Numerous studies have proven that the risk of road accidents increases at night and that the drivers’ ability to avoid a collision is impeded in low visibility conditions [2,3,4,5,6].
Although traffic volume is significantly lower during the night, compared to daytime, more than half of all traffic fatalities occur after dark [1]. The latest EU statistics show that a high number of road fatalities occur at night between Friday and Saturday and between Saturday and Sunday. The peak during weekends is particularly pronounced for the age group between 15 and 30 years old [7]. Young (predominantly male) drivers are more involved in road accidents even though they usually drive less frequently than the older drivers [8,9,10,11]. The causes for such statistics are different and represent a combination of young driver’s personality, driving inexperience, capability to assess the situation and overestimation of their own abilities, social and situational factors (such as the influence of alcohol and opiates, peer pressure, fatigue, socio-economic status, etc.) and other factors (time of the day and week, amount of time on the road, environmental factors etc.) [12,13,14,15,16,17].
Taking into account the complexity of road accidents, modern road safety strategies are based on a comprehensive interdisciplinary approach that simultaneously seeks to improve transport infrastructure, superstructure, legislation and education of traffic participants.
One of the most cost-effective ways to increase road safety is to apply measures related to traffic signalling elements i.e., road markings and traffic signs. Namely, while driving, the driver receives more than 90% of information visually [18], which is why road traffic safety depends mainly on the timeliness of the information the driver gets, which is mostly transmitted by road markings and traffic signs. For that reason, a body of literature has investigated the relationship between traffic signalling elements and driver’s behaviour.
Several studies highlight a correlation between the lateral position of the vehicle within the lanes and road markings. In other words, the drivers change the lateral position of the vehicle and move it closer to the edge of the road, thus reducing the risk of head-on collision, with the increase of the road markings width [19,20,21,22]. A significant reduction in the frequency of centre line crossing was also observed with the use of markers, transverse warning markings, vibration markings, and road curve signs [23]. Other studies have shown a positive influence of road markings as a speed reduction and compliance measure. Daniels et al. presented the results of two evaluation studies that analysed two additional types of road markings in order to support driver decisions regarding speed on 70 km/h roads in Belgium [24]. The first marking type was a white 0.5 m long line painted on the right side of the roadway, close to the existing continuous edge line in longitudinal direction and repeated every 50 m. The second type was a white number ‘7’, marked close to the edge line like the first type and repeated every 50 m. Their impact on driver behaviour was evaluated in two ways: field study on four road segments and evaluation on a driving simulator. The results of the first part of the study did not show a significant impact of additional road markings on the driving speed. However, the evaluation on a driving simulator did report an impact of additional road markings on the lateral positioning of the vehicle. Ding et al. carried out several driving simulator studies on this subject [25,26,27]. The studies were based on an analysis comprising vehicle operations and drivers’ psychological and physical reactions. The results indicated that transverse speed reduction markings could significantly impact driver behaviour (speed and positioning). Charlton, Starkey and Malhotra used a driving simulator to test the potential indicating speed limits with two types of road markings [28]. The first type was designed to provide visually distinct cues to indicate speed limits of 60, 80 and 100 km/h (“Attentional”), while the second type (“Perceptual”) was designed to affect the drivers’ perception of speed. The markings were compared to a standard undifferentiated set of markings. The authors concluded that the association of road markings with specific speed limits may be a useful way to improve speed limit compliance and increase speed homogeneity.
In addition, several other studies also highlighted the potential of different perceptual measures related to road markings and traffic sign on driver’s behaviour in various traffic situations such as curves, gates and intersections [29,30,31,32,33,34,35,36,37,38]. Furthermore, some studies indicate that the quality of traffic signalling may influence the probability of road accidents occurring, especially in the night-time conditions. In other words, with the increase of the road markings and traffic signs retroreflection the number of accidents during night-time would decrease [39,40,41,42,43,44].
Although previous research indicates that traffic signalling has a positive impact on road safety, some pilot projects show that removal of, namely road markings, may reduce the driving speed [45]. In addition, the concept of “shared space” on roads which suggest that in smaller populated area with lower traffic levels, the removal of traffic signalling may influence the drivers to be more attentive and cautious, which results in speed reduction.
From the literature it can be concluded that the effect of traffic signalling on driver behaviour, particularly in night-time conditions, has not been fully explored. In other words, most of the studies investigated the effect of traffic signalling measures on driver’s behaviour in daytime conditions. However, during the night driver’s perceptual capabilities are significantly reduced which is one of the reasons why, as stated earlier, more than a half of all traffic fatalities occur after dark. In addition, little is known about the influence of traffic signalling elements (road markings and traffic signs) on a driver’s road visual scanning behaviour and stress levels.
The aim of this study is to investigate how the presence of traffic signalling influence the behaviour of young drivers, as the most vulnerable driving group, in night-time conditions based on data related to driving speed, acceleration and deceleration, lateral position of the vehicle. Furthermore, using heart rate and eye movement measures we have analysed the driver’s stress level while driving on the scenarios with and without traffic signalling elements. As far as it is known to the authors, this is the first study which used ECG and eye tracker to evaluate effect of traffic signalling measures on driver’s behaviour at night-time.
The more precise objectives will be outlined below.

2. Objectives and Hypotheses

Based on the road accidents statistics and aforementioned gaps in the literature, the main objective of this study is to analyse how the presence of traffic signalling elements (road markings and traffic signs) affect the behaviour of young drivers in night-time conditions in terms of driving speed and the position of the vehicle within the lanes, visual scanning of the road and the environment, and stress levels during driving. Modern research equipment was used for this purpose, namely: driving simulator, eye tracking glasses for the driver and portable electrocardiogram.
The main hypotheses of the study are:
  • Presence of traffic signalling will lead to a decrease in driving speed and to more stable driving of young drivers in night-time conditions;
  • The level of stress of young drivers will be lower during driving in night-time conditions on the road with traffic signalling;
  • Drivers will visually scan the road and the environment more actively if the road contains traffic signalling.
A driving simulator scenario has been developed for the purpose of the study, representing a ride on a two-way rural road passing through smaller settlements. The motive for the study is the statistics that show that the most road accidents (in the EU 55% in 2017) occur precisely on such roads [7]. Moreover, due to limited financial resources available for maintenance, the quality of traffic signalling on rural roads is often not satisfactory.
A more detailed description of the research methodology has been given in the following chapters.

3. Methodology

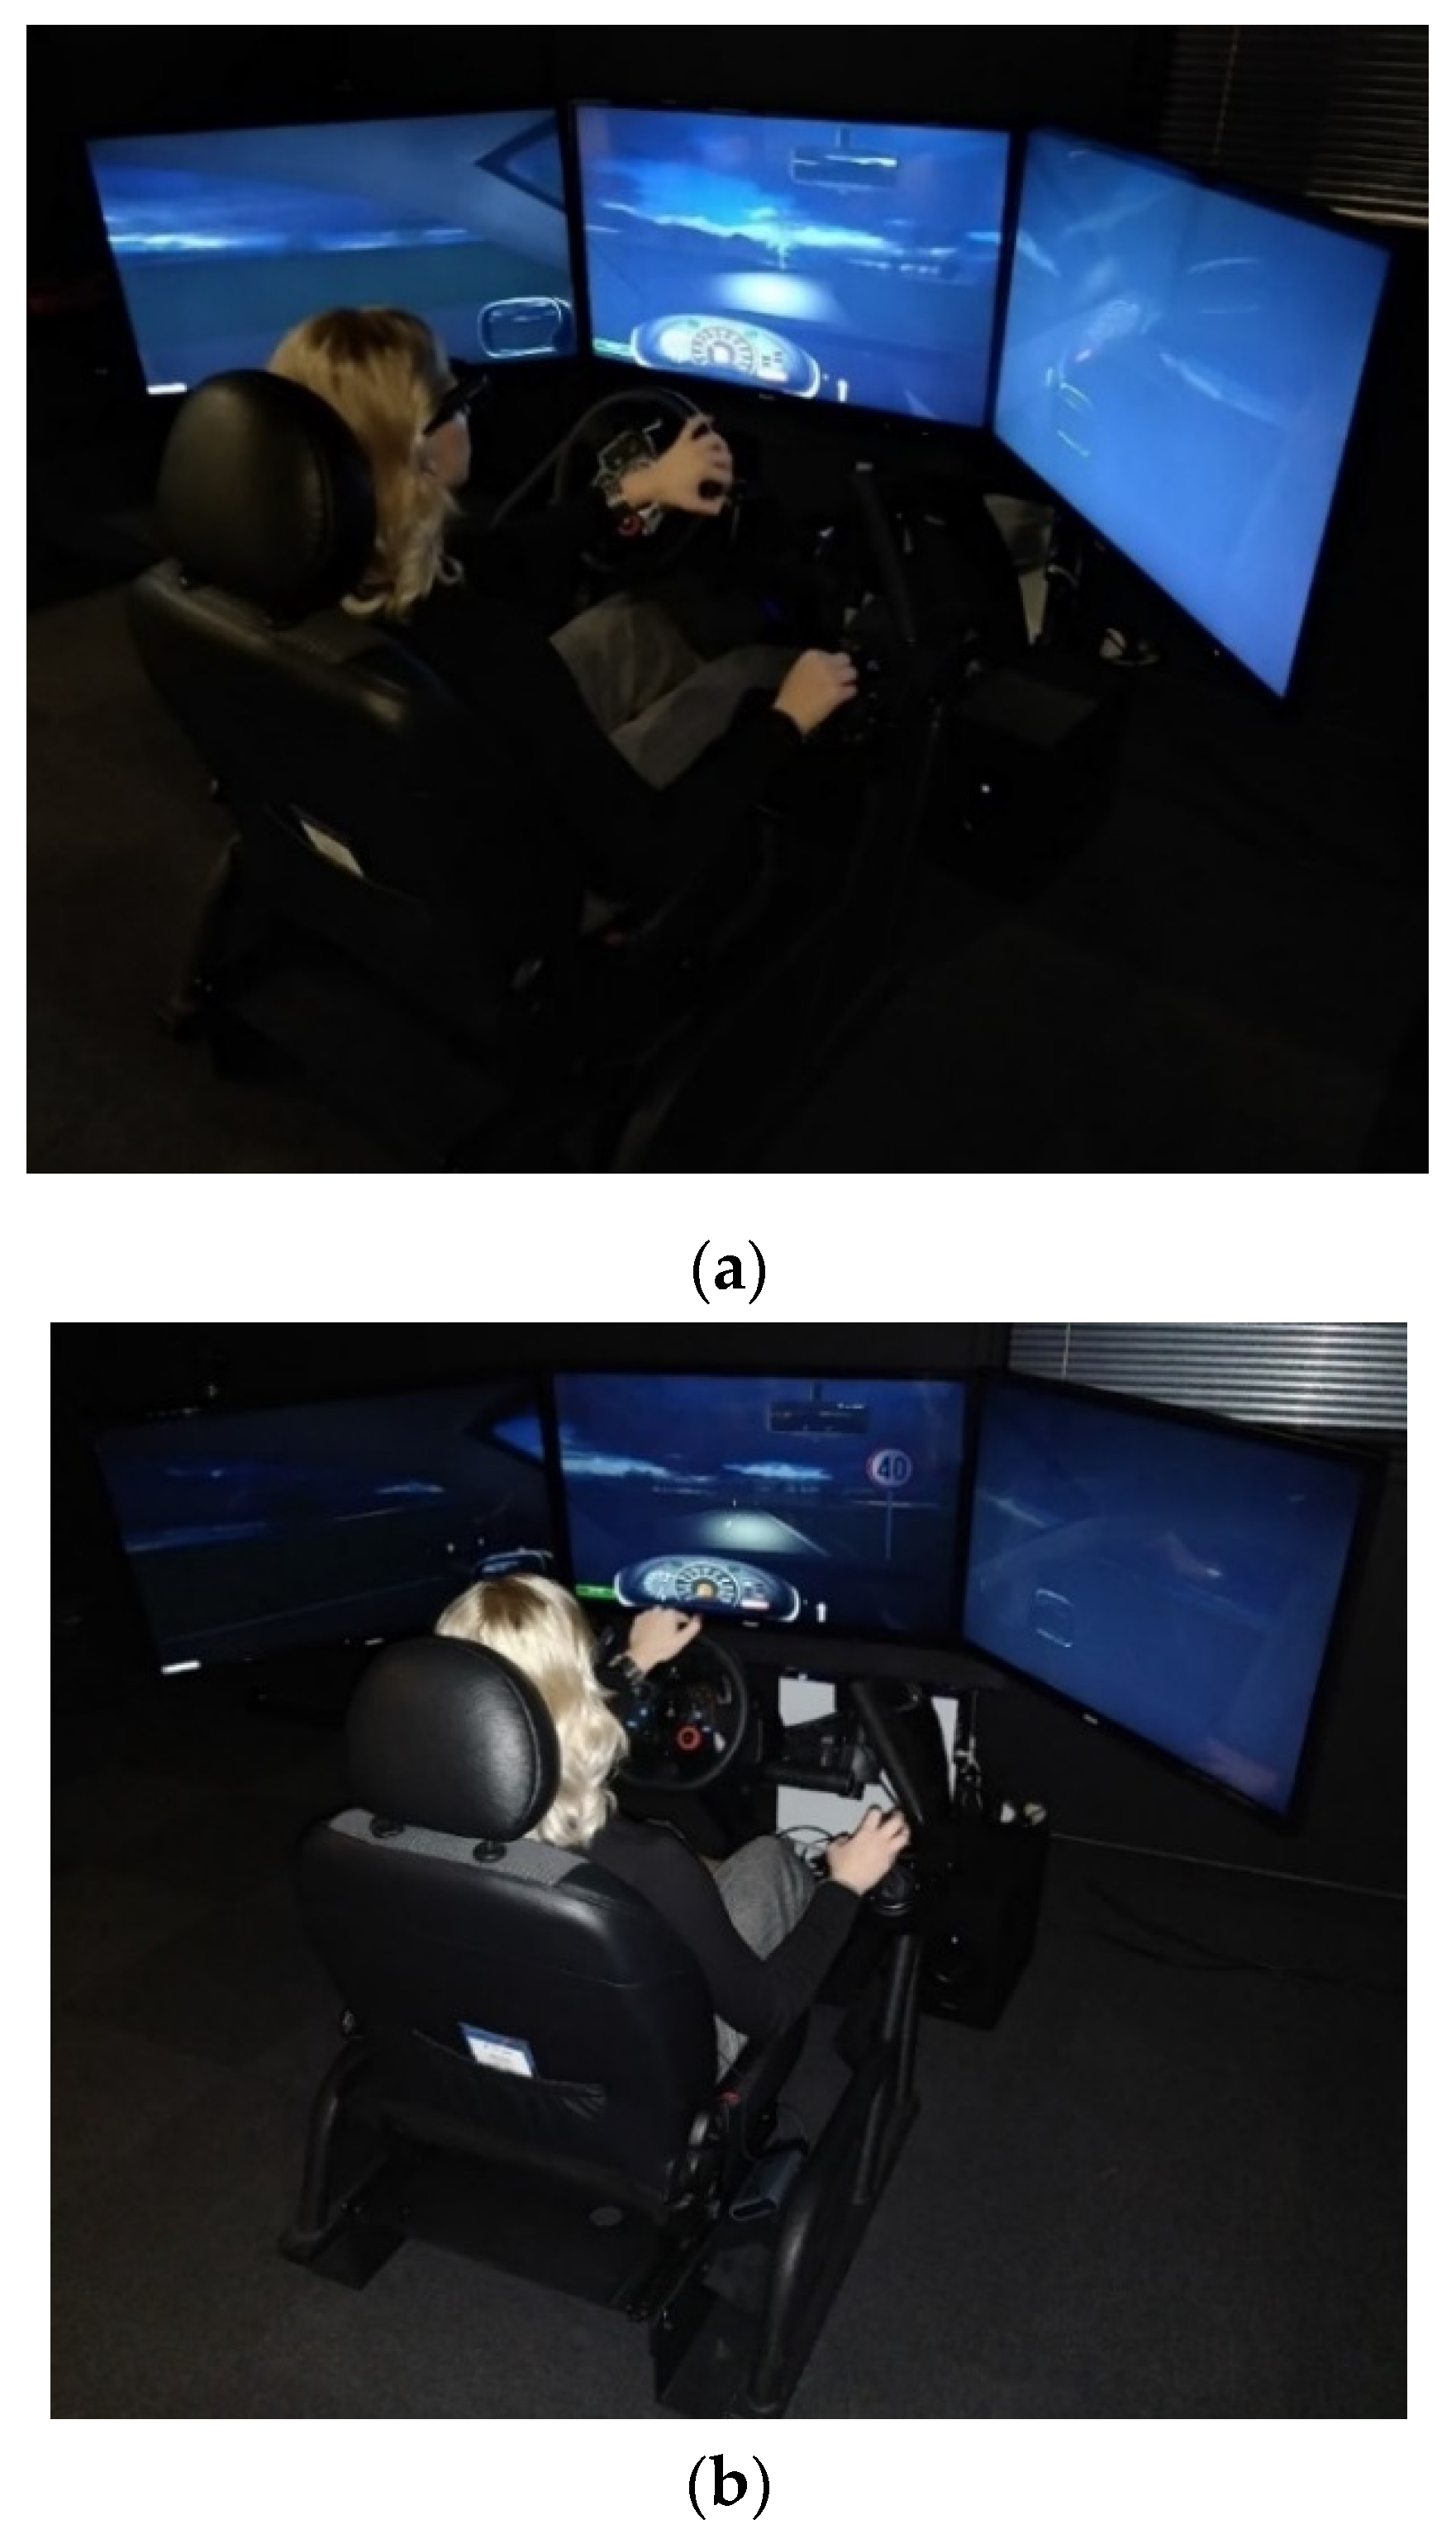
3.1. Research Equipment

As already mentioned in the previous chapter, modern research equipment was used for research purposes, namely: driving simulator, eye tracking glasses for the driver, and portable electrocardiogram.
(a) Driving simulator
The driving simulator used for this research (Carnetsoft B. V.) belongs to a group of static simulators consisting of a driver section (driver seat with pedals, steering wheel and shifter) and three interconnected displays, 30 ‘in size, 5760 × 1080 resolution and 30 Hz frame rate. The hardware is consisted of a computer with a NVidia GeForce GTX 1080 Ti graphics processing unit (GPU) with 3GB of video memory, Intel Core i7 7700K central processor unit (CPU) with 4 cores, 8 threads and frequency of 4,20GHz, 32GB of RAM, 250GB SSD for storage and Windows 10 Pro 64-bit operating system. The simulator provides an interactive display of reality with a 210° environment with over six channels (left, middle and right views plus three rear-view mirrors).
The described simulator has been used in several studies related to the driver’s behaviour which validates its use in this study [46,47,48,49,50].
(b) Eye tracking glasses
Tobii’s mobile and non-invasive glasses (Tobii Pro Glasses 2) were used to track the participant’s eye movement. The glasses are equipped with cameras, recording unit and a computer unit with installed software that records, captures and stores collected data. The glasses are the basic part of the system since their cameras capture every movement of participant’s eyes, and they are designed very similarly to standard prescription glasses. They have four eye tracking cameras (two cameras per eye) and four sensors (gyroscope and accelerometer). The camera installed on the front of the glasses records the space in front of the participant with a 1920 * 1080 pixel HD resolution and a viewing area of 160° horizontally and 70° vertically, while the remaining cameras that record eye movement are placed in eyeglass lenses. Figure 1 shows the eye tracking glasses used in this project.
(c) Electrocardiogram (ECG)
Electrocardiography is the process of recording the electrical activity of the heart by using an electrocardiogram, a device that measures and records electrical signals from the heart via several electrodes attached to the chest. For the purpose of the study, a Holter ECG device was used to record and monitor the operation of the heart while the person is moving and performing other activities. In such a measurement mode, seven electrodes are connected to a smaller portable device, as shown in Figure 1.

3.2. Scenario Design

The scenario has been designed as a two-way road with lanes 3.25 m wide and 6.61 km long, including active traffic in opposite direction. Parts of the section include driving through populated areas with a speed limit of 50 km/h while other parts simulate an open road outside populated areas with a speed limit up to a maximum of 90 km/h in accordance with the legal regulations in the Republic of Croatia. The section includes six four-way intersections with traffic from other directions, two pedestrian crossings with pedestrians crossing them, and ten sharp curves (radius ranging from 50 m to 100 m) marked with chevrons. The section is marked with 15 cm wide white edge and centre lines and contains a total of 55 traffic signs placed in the direction of driving in accordance with the Croatian design standards. Of a total of six intersections, drivers had the right of way on four of them (intersection 1, 2, 3 and 5) while at two intersections (intersection 4 and 6) they had a stop sign i.e., they did not have the right of way. Houses and other environmental elements such as trees were present in the scenario. Both the sound of traffic in the environment and the sound of the participant’s car were included.
The scenario has been developed in the Carnetsoft B. V. Road design tool and is shown in Figure 2.

3.3. Participants

For the purposes of the research, 32 younger participants (volunteers) with a valid driving license were recruited. Of a total of 32 participants, 23 were male (71.88%), while nine were female (28.13%). The average age of participants was 25 years ( x ¯ = 25.11; range = 21.6–29.8; SD = 1.81). The average driving experience of participants was six years ( x ¯ = 6.53; range = 2–11; SD = 2.18).
The sample mentioned above was chosen due to the fact that younger drivers (between the age of 15 and 30), especially males, are more involved in road accidents. One of the reasons is that younger drivers are somewhat inexperienced, reckless, and prone to overestimate and prove themselves, which is why they are more inclined to risky behaviour on the road. This has also been confirmed by the fact that the participants assessed their driving ability with an average grade of 8.22 (from the scale 1–10) although 40.62% of them drove only a few times a week (28.13%) or a few times a month (12.50%). According to their own estimates, the participants drove on average 10,468.75 kilometres a year.
Of 32 participants, nine (28.12%) participated in a traffic accident as drivers (in total they participated in ten accidents). Overall, 40% of them were at fault for the accident. Six participants had a mild eye prescription and wear glasses or lenses when driving.
None of the participants had any significant physical or other impairment, and they gave their consent to participate in this study. In addition, none of the participants reported any sign of driving simulator sickness.
Data on participants are given in Appendix A.

3.4. Research Procedure

The testing room was set up in the Department of Traffic Signalling, Faculty of Transport and Traffic Sciences, University of Zagreb, Croatia. Before the test was conducted, each participant became acquainted with the research equipment and research procedure. Data collection and participant anonymity were ensured to follow the Declaration of Helsinki and the study was approved by the Ethics Board of the Faculty of Transport and Traffic Sciences, University of Zagreb.
The participants were instructed by researchers that their driving knowledge and ability are not being evaluated and that they can freely leave at any given time, especially if they feel some kind of side effects such as simulator sickness. The participants also signed a consent form to take part and filled in a short questionnaire related to certain personal information such as age, gender, date of obtaining the driver’s license, assessment of their own driving ability, number of road accidents in which they participated and in which they were guilty, frequency of driving, own estimate of kilometres per year, and other comments and possible problems related to the visual system.
After that, the participants were equipped with the research equipment (eye-tracking glasses and electrocardiograph) and sat at the driving simulator. Before performing the runs according to the defined scenario, the participants had a warmup session of about 5–10 min to get acquainted with the driving simulator and other research equipment.
The research consisted of two runs per the same scenario in night-time and dry pavement conditions. During one of the runs, traffic signalling elements (road markings and traffic signs) were not present in the scenario, while during other they were “included”. The order of the runs was randomized for each participant in order to counterbalance the order effect. The average total driving time for both runs was 14.25 min (SD = ± 1.16 min). After every run the participants evaluated the stress level and driving complexity on a scale from 1 to 10 (1-extremely demanding; 10-extremely easy). The representation of research implementation is shown on Figure 3.

3.5. Variables Used to Describe the Behaviour of Participants and Data Analysis

In order to validate the defined hypotheses, the data related to driving speed, acceleration and deceleration, lateral position of the vehicle, heart rate and basic eye movements (fixation and seizure) were collected. The names, definitions, and units of the variables used are shown in Table 1.
The above data were extracted from Carnetsoft B. V. “Data Analysis” software, Tobii Pro Analyzer and Holter EKG software and processed with an “R” statistical tool.
The dependent samples t-test was used to test the differences between measured variables between two drives. Correlation analysis (Spearman’s correlation coefficient) was used to test the connection between variables.

4. Results

The results have been described separately for every part of the research equipment.
(a) Driving simulator data
During the run with no traffic signalling elements, the average driving speed of the participants was 58.63 km/h (SD = 8.66) and they have been positioning the vehicle towards the right edge of the road for a longer period (on average 4.11 min of the total driving time). The participants positioned the vehicle closer to the centre of the road for slightly more than 40% of the driving time (2.78 min on average). The average lateral movement towards the centre of the road during this run was 0.59 m and towards the right edge 0.37 m. It may be inferred from the movement mentioned above that the participants had an unstable driving trajectory ranging from almost one meter (0.96 m) left-to-right in the run without traffic signalling elements. The positive correlation between driving speed and deceleration (Spearman’s correlation coefficient with p < 0.05: 0.443) and the lateral position of the vehicle (Spearman’s correlation coefficient with p < 0.05: 0.378) have also confirmed riskier behaviour of the participants while driving on the scenario without traffic signalling. Namely, with the increase in driving speed during this drive, the participants were decelerating more often and more suddenly and positioning the vehicle closer to the centre of the road.
On the other hand, during the run that included traffic signalling elements, the participants drove in a more stable manner, positioning the vehicle in the 0.54 m left-to-right range, although a positive correlation between driving speed, deceleration and the lateral positioning of the vehicle closer to the centre of the road was also confirmed (Spearman’s correlation coefficient with p < 0.05: 0.642 and 0.450, respectively). Driving stability and less risky behaviour of the participants during the run with traffic signalling were also confirmed by the fact that the participants drove closer to the centre of the road and closer to the right edge of the road for approximately the same time. Namely, the participants positioned the vehicle closer to the centre of the road for 4.05 min on average and closer to the right edge of the road for 3.59 min on average which indicate better lateral control of the vehicle. In addition, during this drive, the participants drove slower, averaging 52.49 km/h (SD = 5.90), adjusting their behaviour to the upcoming situation.
The statistical significance of the results obtained in the two drives was tested by using the dependent samples t-test. The t-test results confirmed a statistically significant difference between the driving speed and the lateral position of the vehicle between the scenario with traffic signalling on the road and the one without it. A statistically significant difference in variables acceleration and deceleration were not proved. Table 2 shows the aforementioned results.
Higher speed and unstable trajectory during the run without traffic signalling elements, as well as lack of information provided by traffic signalling, also resulted in more mistakes by the participants. In total 14 road accidents were recorded, categorized as: head-on collision, vehicle collision at junctions, run-off-road on curves and car-pedestrian collision. During the run in which the participants received timely information through traffic signalling, the number of accidents was reduced by 78.57% (a total of three traffic accidents). The three accidents have been categorized as run-off-road on curves.
(b) Eye tracking data
The dependent samples t-test results represented in Table 3 show a statistically significant difference in the number of fixations, the duration of fixations, and the number of saccades between the two drives. The statistically significant difference was not determined only for the saccade duration. The results show that during the drive with traffic signalling the participants had a significantly higher number of eye fixations in relation to the drive without signalling. As the saccades represent eye movements between two fixations, their number was also higher in the scenario with traffic signalling elements. On the other hand, the duration of fixations was significantly longer during the run without traffic signalling, compared to the drive with signalling elements. This indicates that during the run without the traffic signalling the participants focused longer on road and environmental elements that they could see, at least to some extent, in order to gather information on the upcoming situation.
The duration of saccades to a certain extent depends on the velocity of eye movement and the desired point of fixation. Namely, if a person’s gaze is fixed on a certain point on the right side of the visual field and then on a point on the opposite side of the visual field, the duration of the saccade between the two fixations will be longer. Based on the above mentioned fact, the results (absence of significant difference in duration of saccades between two drives) indicate that the drivers principally directed their gaze to roughly the same area within the visual field. In other words, the manner of their visual scanning of the environment did not differ in the two runs.
The analysis of the correlation between the driving speed and the eye movements during the performed runs can lead to a conclusion that the number of fixations during both runs is negatively correlated with the driving speed (Spearman’s correlation coefficient with p < 0.05: drive without signalling = −0.848, drive with signalling = 0.355).
Furthermore, during the run that included traffic signalling, on average, the participants looked at 54.38% (Min = 10.91%, Max = 81.82%, SD = 15.23%) of the total 55 traffic signs set on the route. Although on average the participants directed their gaze at more than half of the signs, this does not mean that they understand their meaning, given that active attention is also required to perceive an object [51]. In order to verify the extent to which the participants are aware of the traffic signs, during the drive they were asked randomly about the meaning of a certain sign (stop sign, sharp curve, speed limit, etc.) or the colour of the sign (e.g., colour of the chevrons). Questions were asked shortly after the participants passed the sign. Of a total of 260 questions asked ( x ¯ = 8.13 questions per participant), the participants responded correctly to 195 or 75% ( x ¯ = 6.09 per participant), which confirms that the participants really perceived the signs.
In addition to the signs, road markings are also an important element of visual guidance for drivers. The analysis of the results of participants’ gaze direction on a longitudinal marking (centre line, right or left edge line) shows that the drivers were mostly oriented by the right edge line and the centre line, and much less by the left edge line (Appendix B). On average, 55.97 times the drivers directed their gaze to the right edge line (45.98% of the total number of views on longitudinal markings), 53.28 times they were looking at the centre line (45.41%), and 12.69 times to the left edge line (10.40%).
(c) Electrocardiographic data
The average heart rate of the participants during the drive without traffic signalling was 89.10 beats per minute (SD = 17.04) and 85.71 (SD = 16.27) during the drive with traffic signalling. Although the average heart rate decreased slightly during the drive with traffic signalling, this difference was too low to be statistically significant, as demonstrated by the t-test (p = 0.41 > 0.05). Ultimately, it can be concluded that the level of stress and driving complexity during both runs did not significantly affect the participants’ heart rate. However, subjective assessments of the complexity of both performed runs suggest that the participants found the drive with traffic signalling as less demanding and stressful. On average, the participants assessed, on the scale from 1 to 10, the run without traffic signalling as moderately demanding ( x ¯ = 5.06), with two participants assessing it as extremely demanding (grade 1). The drive with traffic signalling, participants assessed as easy ( x ¯ = 9.3), with the lowest rating of 5, given by two participants.
The summary of the results is presented in Table 4.

5. Discussion

This study analysed the presence of traffic signalling elements (road markings and traffic signs) on the behaviour of young drivers in night-time conditions. A driving simulator scenario has been developed for this purpose, representing a characteristic two-way rural road which goes through a smaller populated area as well as unpopulated area. In order to determine the impact of traffic signalling on the behaviour and stress level in young drivers, the participants drove the same scenario twice: (a) without traffic signalling elements and (b) with present traffic signalling elements.
The results show a positive impact of traffic signalling on the driving speed and the lateral position of the vehicle. Namely, the average driving speed decreased during the drive with present traffic signalling elements by 10.47% compared to one without them, which is to a certain extent contrary to the previous opinion that the visual guidance provided by adding longitudinal road markings leads to higher speeds [21,52,53]. In addition, while driving on a road without traffic signalling, the participants had an unstable driving trajectory ranging from almost one meter left to right and positioning the vehicle most of the time closer to the centre of the road, thus increasing the risk of head-on collision, which is consistent with the previous knowledge [21]. During the drive with traffic signalling, the participants drove in a more stable manner, positioning the vehicle more evenly within the road lanes, thus reducing the risk of a head-on collision with vehicles from the opposite direction and a run-off-road collision.
Furthermore, it is known that young drivers often misjudge situations and overestimate their own abilities due to inexperience [12,14,15,54]. These results suggest that the lack of visual information provided by signalling elements during the drive without these elements has further influenced the perception of the upcoming situation of young participants, making them drive faster and more unstable which ultimately resulted in a higher number of mistakes. Namely, during the drive without signalling elements, in total 14 road accidents were recorded (head-on collision, vehicle collision at junctions, run-off-road on curves and car-pedestrian collision), while this number was reduced by as much as 78.57% during the drive in which the participants received timely relevant information through road markings and traffic signs.
The presence of traffic signalling also influenced how the participants visually scanned the road and the environment. During the run containing traffic signalling, the participants’ eyes were more active and more fixed to road elements in order to gather as much information as necessary for safe tracking of the road trajectory. A higher number of fixations, i.e., more active visual scanning of the environment, implies more active attention of the participant, which can ultimately positively affect traffic safety [55,56]. Moreover, the duration of fixations during the run without traffic signalling elements was statistically significantly longer compared to the run with signalling elements, indicating that in order to gather information on the upcoming situation the participants focused longer on the road and environment elements that they could see, at least to some extent.
The analysis of the correlation between the driving speed and the eye movements during the performed runs shows that the number of fixations during both runs is negatively correlated with the driving speed. In other words, at greater driving speed, the participants had less time to scan the road and the environment and had to gather enough information on the upcoming situation with fewer fixations. During the run without traffic signalling, the participants could not rely on the signalling for information, which is why they often wrongly assessed the situation, driving at a greater speed compared to the run containing traffic signalling. With the increase in driving speed, the participants’ eye activity slowed down, which, coupled with untimely information, caused the drivers to make frequent mistakes or cause road accidents (14 in total).
Additionally, in the run containing traffic signalling, the participants on average looked at 54.38% of traffic signs on the route and could remember as much as 75% of them, which confirms that they perceived them. Compared to previous studies that did not use the eye tracking method [57,58,59,60,61], the percentage of perceived traffic signs was significantly higher, but was similar to recent research conducted by using the mentioned method [62]. In addition to the signs, the analysis of the results of participants’ gaze direction on a longitudinal marking (centre line, right or left edge line) shows that the drivers were mostly oriented by the right edge line and the centre line, and much less by the left edge line, which is in line with previous literature findings [63,64].
The results of stress level measurement obtained from a portable ECG device did not show any statistically significant differences between the two runs, but the subjective assessment of the complexity or stress level of each run suggests that driving in a scenario with traffic signalling was considerably less demanding and stressful.

6. Conclusions

A limited amount of visual information available to the driver, reduced and narrowed field of vision as well as the impaired ability and accuracy of perception of colour, shape, texture, contrast and movement, result in an increased risk of road accidents during night-time driving. The statistics on accidents show that more than half of all road traffic fatalities occur at night-time, although traffic volume during the night is significantly lower compared to daytime. Young drivers are a particularly vulnerable group because (due to driving inexperience, decreased capability to assess the situation and overestimation of their own abilities, along with social and situational factors, etc.) they often do not perceive and understand the upcoming situation in a timely manner.
Although road markings and traffic signs are known to be the most cost-effective solution, their influence on driver’s stress level, eye movement and overall behaviour at night-time has not been sufficiently studied. For these reasons, this study provides a valuable expansion of the existing knowledge. Based on the obtained results it can be concluded that the hypotheses of the study were confirmed, that is, during the run in a scenario containing traffic signalling elements, the participants:
  • Drove considerably slower and more stably in terms of lateral positioning of the vehicle during driving.
  • More actively visually examined the surroundings of the road, the accompanying road elements and traffic signalling.
  • Adjusted their behaviour to the upcoming situation, i.e., to the information received through traffic signalling.
  • Made significantly less mistakes that resulted in road accidents.
  • Felt less stress during driving, which ultimately resulted in a more comfortable and safer ride.
Considering all the above, this study provides a clear confirmation of the importance of traffic signalling for the behaviour of young drivers in night-time conditions, and thus for the overall traffic safety. Road markings and traffic signs provided the drivers with timely and relevant information related to the upcoming situation, thus enabling them to adjust their driving accordingly. Since the quality of traffic signalling on low-volume rural roads is often not satisfactory due to lack of maintenance, further to the results of this study we advise road authorities to properly and timely maintain the traffic signalling elements in order to increase road safety.
As night-time visibility of road markings and traffic signs depends on their retroreflection, further studies should focus on researching the impact of different levels of road marking and traffic sign retroreflection on driver behaviour, driver level of stress and cognitive load during driving in night-time conditions. In addition, since Advanced Driver-Assistance Systems (ADAS) in modern vehicles to some extent rely on road markings and traffic signs, future studies should be aimed at understanding how different levels of their visibility affect the systems. As the majority of previous studies highlighted the positive effect of different traffic signalling measures on driver behaviour during daytime, further work should focus on evaluating those measures under reduced visibility conditions when they are most needed.
The modern research equipment used in this research has, nonetheless, certain limitations. They are primarily related to the driving simulator where external validation is an often-mentioned issue, even though it has many advantages. Specifically, a fixed-base simulator used in the research does not provide a completely realistic, real-life driving feeling. However, that disadvantage was somewhat reduced by including the sound and by conducting the research in a completely dark environment (in order to get a more realistic feeling of night-time conditions). In addition, the number of participants is also one of the study limitations. Although the number of participants is around the average in the literature (most of the simulator studies have between 30 and 40 participants), a bigger sample size could provide more accurate results. Moreover, this study was focused only on younger drivers (<30 years of age).

Author Contributions

Conceptualization, D.B. (Darko Babić) and D.B. (Dario Babić); Methodology, D.B. (Darko Babić), D.B. (Dario Babić) and M.F.; Investigation, M.F. and A.S.; Data analysis, H.C. and A.S.; Writing—review and editing, D.B. (Dario Babić); project administration, D.B. (Darko Babić). All authors have read and agreed to the published version of the manuscript.

Funding

This research was a part of the project entitled “Analitički postupci utvrđivanja utjecaja čimbenika cesta, čovjek, vozilo na događanje prometnih nesreća” financed by the Ministry of the Interior of the Republic of Croatia.

Acknowledgments

This research was a part of the project entitled “Analitički postupci utvrđivanja utjecaja čimbenika cesta, čovjek, vozilo na događanje prometnih nesreća” financed by the Ministry of the Interior of the Republic of Croatia.

Conflicts of Interest

The authors declare no conflict of interest.

Appendix A

Table A1. Participant Data.
Participant CodeSexAge
(yrs)
Driving
Experience (yrs)
Driving Ability
Assessment
Participated in
An Accident
Guilty Driving FrequencyEstimate of Driven km/yr
S01M29.4115Yes (1)NoA18,000
S02F29.8115NoNoA12,500
S03F25.664NoNoA12,000
S04M22.645Yes (1)NoB1000
S05F27.693NoNoB500
S06M23.965Yes (1)YesA10,000
S07M23.154Yes (2)YesB8000
S08M24.574Yes (1)NoC5000
S09M23.455NoNoA19,000
S010M24.964NoNoB2000
S011M24.965NoNoC5000
S012F24.464NoNoB10,000
S013M24.565Yes (1)NoA16,000
S014M25.064NoNoA15,000
S015M25.384Yes (1)NoA25,000
S016M25.274NoNoA40,000
S017M23.154NoNoA10,000
S018F24.142NoNoB1000
S019M23.254NoNoB5000
S020M25.885NoNoA30,000
S021M25.365NoNoA10,000
S022M26.894NoNoB5000
S023M25.784NoNoA10,000
S024M24.725NoNoA5000
S025F24.063NoNoC5000
S026M23.523NoNoB500
S027F21.643NoNoC2000
S028M27.095NoNoA25,000
S029M25.275NoNoA7000
S030F26.185Yes (1)YesA5000
S031F25.274NoNoA3000
S032M28.1104Yes (1)YesA12,500
A–every day; B–a few times a week; C–a few times a month; 1–very bad; 2–bad; 3–good; 4–very good; 5–great.

Appendix B

Table A2. Number of Times the Participants Viewed the Road Markings and Percentage Share of Viewed Traffic Signs.
Participant CodeNumber of Views Towards the Right Edge lineNumber of Views Towards the Left Edge lineNumber of Views Towards the Center linePercentage Share Of Viewed Traffic Signs (%)
S0177275030.91
S0281454.55
S0315105381.82
S0464165856.36
S055482521.82
S0672209060.00
S0710088054.55
S0828144261.82
S094765278.18
S104644670.91
S1143127065.45
S1263206967.27
S1319067076.36
S1466218945.45
S1585378758.18
S1647216758.18
S174613650.91
S1850117749.09
S19762350.91
S204524434.55
S2147175261.82
S227067761.82
S232821850.91
S241711236.36
S25140449967.27
S2661276760.00
S273011454.55
S285326761.82
S2980165458.18
S301662045.45
S31901811243.64
S32631110.91
Arithmetic mean55.9712.6953.2854.38

References

  1. Plainis, S.; Murray, I.J.; Pallikaris, I.G. Road traffic casualties: Understanding the night-time death toll. Inj. Prev. 2006, 12, 125–128. [Google Scholar] [CrossRef] [Green Version]
  2. Owens, D.A.; Sivak, M. Differentiation of visibility and alcohol as contributors to twilight road fatalities. Hum. Factors 1996, 38, 680–689. [Google Scholar] [CrossRef]
  3. Rice, T.M.; Peek-Asa, C.; Kraus, J.F. Nighttime driving, passenger transport, and injury crash rates of young drivers. Inj. Prev. 2009, 9, 245–250. [Google Scholar] [CrossRef] [PubMed] [Green Version]
  4. Elvik, R.A. Meta-analysis of evaluation of public lighting as an accident countermeasure. J. Transp. Res. Board 1995, 1485, 112–123. [Google Scholar]
  5. Sullivan, J.M.; Flannagan, M.J. The role of ambient light level in fatal crashes: Inferences from daylight saving time transitions. Accid. Anal. Prev. 2002, 34, 487–498. [Google Scholar] [CrossRef]
  6. Li, Z.; Chen, C.; Wu, Q.; Zhang, G.; Liu, C.; Prevedouros, P.D.; Ma, D.T. Exploring driver injury severity patterns and causes in low visibility related single-vehicle crashes using a finite mixture random parameters model. Anal. Methods Accid. Res. 2018, 20, 1–14. [Google Scholar] [CrossRef]
  7. European Commission. Road Safety in the European Union: Trends, Statistics and Main Challenges; European Commission: Brussels, Belgium, 2018. [Google Scholar] [CrossRef]
  8. Gregersen, N.P.; Bjurulf, P. Young novice drivers: Towards a model of their accident involvement. Accid. Anal. Prev. 1996, 28, 229–241. [Google Scholar] [CrossRef] [Green Version]
  9. Bener, A.; Crundall, D. Role of gender and driver behaviour in road traffic crashes. Int. J. Crashworthiness 2008, 13, 331–336. [Google Scholar] [CrossRef]
  10. Gray, R.C.; Quddus, M.A.; Evans, A. Injury severity analysis of accidents involving young male drivers in Great Britain. J. Saf. Res. 2008, 39, 483–495. [Google Scholar] [CrossRef] [Green Version]
  11. Scott-Parker, B.; Oviedo-Trespalacios, O. Young driver risky behaviour and predictors of crash risk in Autralia, New Zealand and Colombia: Same but different? Accid. Anal. Prev. 2017, 99, 30–38. [Google Scholar] [CrossRef] [Green Version]
  12. Kielce, R.J.; Poliak, M.; Jaśkiewicz, M. Young adult drivers: Simulated behaviour in a car-following situation. Traffic Transp. 2017, 29, 381–390. [Google Scholar] [CrossRef]
  13. Topolšek, D.; Areh, I.; Cvahte, T. Examination of driver detection of roadside traffic signs and advertisements using eye tracking. Transp. Res. Part F Traffic Psychol. Behav. 2016, 43, 212–224. [Google Scholar] [CrossRef]
  14. Bates, L.J.; Davey, J.; Watson, B.; King, M.J.; Armstrong, K. Factors contributing to crashes among young drivers. Sultan Qaboos Univ. Med. J. 2014, 14, 297–305. [Google Scholar]
  15. Males, M.A. Poverty as a determinant of young drivers’ fatal crash risks. J. Saf. Res. 2009, 40, 443–448. [Google Scholar] [CrossRef]
  16. Simons-Morton, B.; Lerner, N.; Singer, J. The observed effects of teenage passengers on the risky driving behavior of teenage drivers. Accid. Anal. Prev. 2005, 37, 973–982. [Google Scholar] [CrossRef]
  17. Begg, D.J.; Langley, J.D.; Stephenson, S. Identifying factors that predict persistent driving after drinking, unsafe driving after drinking, and driving after using cannabis among young adults. Accid. Anal. Prev. 2003, 35, 669–675. [Google Scholar] [CrossRef]
  18. Thurston, P. Pavement Markings Role in Enhancing Road Safety Strategies; Roadmarking Industry Association of Australia: Carrum Down, Australia, 2009. [Google Scholar]
  19. Chang, K.; Ramirez, M.V.; Dyre, B.; Mohamed, M.; Abdel-Rahim, A. Effects of longitudinal pavement edgeline condition on driver lane deviation. Accid. Anal. Prev. 2019, 128, 87–93. [Google Scholar] [CrossRef]
  20. Park, E.S.; Carlson, P.J.; Porter, R.J.; Andersen, C.K. Safety effects of wider edge lines on rural, two-lane highways. Accid. Anal. Prev. 2012, 48, 317–325. [Google Scholar] [CrossRef]
  21. Davidse, R.; Driel, C.; Goldenbeld, C. The Effect of Altered Road Markings on Speed and Lateral Position; Institute for Road Safety Research: Leidschendam, the Netherlands, 2004. [Google Scholar]
  22. Lundkvist, S.O.; Ytterbom, U.; Runersjoe, L. Continuous Edgeline on Nine-Meterwide Two-Lane Roads; Swedish Road and Traffic Research Institute: Linkoping, Sweden, 1990. [Google Scholar]
  23. Agent, K.; Creasy, T. Delineation of Horizontal Curves; Kentucky Transportation Research Program: Lexington, Kentucky, 1986. [Google Scholar]
  24. Daniels, S.; Vanrie, J.; Dreesen, A.; Brijs, T. Additional road markings as an indication of speed limits: Results of a field experiment and a driving simulator study. Accid. Anal. Prev. 2010, 42, 953–960. [Google Scholar] [CrossRef] [Green Version]
  25. Ding, H.; Zhao, X.; Rong, J.; Ma, J. Experimental research on the effectiveness of speed reduction markings based on driving simulation: A case study. Accid. Anal. Prev. 2013, 60, 211–218. [Google Scholar] [CrossRef]
  26. Ding, H.; Zhao, X.; Rong, J.; Ma, J. Experimental research on the effectiveness and adaptability of speed reduction markings in downhill sections on urban roads: A driving simulation study. Accid. Anal. Prev. 2014, 75, 119–127. [Google Scholar] [CrossRef]
  27. Ding, H.; Zhao, X.; Ma, J.; Rong, J. Evaluation research of the effects of longitudinal speed reduction markings on driving behavior: A driving simulator study. Int. J. Environ. Res. Public Health 2016, 13, 1170. [Google Scholar] [CrossRef] [PubMed] [Green Version]
  28. Charlton, S.G.; Starkey, N.J.; Malhotra, N. Using road markings as a continuous cue for speed choice. Accid. Anal. Prev. 2018, 117, 288–297. [Google Scholar] [CrossRef] [PubMed]
  29. Awan, H.H.; Pirdavani, A.; Houben, A.; Westhof, S.; Adnan, M.; Brijs, T. Impact of perceptual countermeasures on driving behavior at curves using driving simulator. Traffic Inj. Prev. 2019, 20, 93–99. [Google Scholar] [CrossRef] [PubMed]
  30. Calvi, A. Investigating the effectiveness of perceptual treatments on a crest vertical curve: A driving simulator study. Transp. Res. Part F Traffic Psychol. Behav. 2018, 58, 1074–1086. [Google Scholar] [CrossRef]
  31. Ariën, C.; Brijs, K.; Vanroelen, G.; Ceulemans, W.; Jongen, E.M.; Daniels, S.; Brijs, T.; Wets, G. The effect of pavement markings on driving behaviour in curves: A simulator study. Ergonomics 2016, 60, 701–713. [Google Scholar] [CrossRef] [Green Version]
  32. Montella, A.; Galante, F.; Mauriello, F.; Pariota, L. Effects of traffic control devices on rural curves driving behaviour. J. Transp. Res. Board 2015, 2492, 10–22. [Google Scholar] [CrossRef] [Green Version]
  33. Wu, Q.; Wang, J.J. Exploration on speed-limit signs of traffic accident section on freeways. Appl. Mech. Mater. 2013, 361, 2349–2352. [Google Scholar] [CrossRef]
  34. Coutton-Jean, C.; Mestre, D.R.; Goulon, C.; Bootsma, R.J. The role of edge lines in curve driving. Transp. Res. Part F Traffic Psychol. Behav. 2009, 12, 483–493. [Google Scholar] [CrossRef]
  35. Charlton, S.G. The role of attention in horizontal curves: A comparison of advance warning, delineation, and road marking treatments. Accid. Anal. Prev. 2007, 39, 873–885. [Google Scholar] [CrossRef]
  36. Porter, R.J.; Mahoney, K.M.; Mason, J.M. Seemingly unrelated regression model of car speeds and speed deviations in freeway work zones. J. Transp. Res. Board 2007, 2023, 44–51. [Google Scholar] [CrossRef]
  37. Charlton, S.G. Perceptual and attentional effects on drivers’ speed selection at curves. Accid. Anal. Prev. 2004, 36, 877–884. [Google Scholar] [CrossRef]
  38. Carson, J.; Mannering, F.L. The effects of ice warning signs on accident frequencies and severities. Accid. Anal. Prev. 2001, 33, 99–109. [Google Scholar] [CrossRef]
  39. Smadi, O.; Hawkins, N.; Nlenanya, I.; Aldemir-Bektas, B. Pavement Markings and Safety; Center for Transportation Research and Education: Ames, IA, USA, 2010; Available online: https://intrans.iastate.edu/app/uploads/2018/03/pvmt_markings_safety_report.pdf (accessed on 13 December 2019).
  40. Carlson, P.; Park, E.S.; Kang, D.H. Investigation of Longitudinal Pavement Marking Retroreflectivity and Safety. J. Transp. Res. Board 2013, 2337, 59–66. [Google Scholar] [CrossRef]
  41. Avelar, R.E.; Carlson, P.J. Characterizing the association between nighttime crashes and retroreflectivity of edgelines and centerlines on Michigan rural two-lane highways. In Proceedings of the 93rd Annual Meeting of the Transportation Research Record, Washington, DC, USA, 12–16 January 2014; Available online: https://static.tti.tamu.edu/tti.tamu.edu/documents/TRB-145465.pdf (accessed on 13 December 2019).
  42. Aldemir-Bektas, B.; Gkritza, K.; Smadi, O. Pavement Marking Retroreflectivity and Crash Frequency: Segmentation, Line Type, and Imputation Effects. J. Transp. Eng. 2016, 142, 04016030. [Google Scholar] [CrossRef]
  43. Xu, X.; Šarić, Ž.; Zhu, F.; Babić, D. Accident severity levels and traffic signs interactions in state roads: A seemingly unrelated regression model in unbalanced panel data approach. Accid. Anal. Prev. 2018, 120, 122–129. [Google Scholar] [CrossRef] [PubMed]
  44. Šarić, Ž.; Xu, X.; Duan, L.; Babić, D. Identifying the safety factors over traffic signs in state roads using a panel quantile regression approach. Traffic Inj. Prev. 2018, 19, 607–614. [Google Scholar] [CrossRef]
  45. Transport for London. Centreline Removal Trial; Transport for London: London, UK, 2014. Available online: http://content.tfl.gov.uk/centre-line-removal-trial.pdf (accessed on 18 December 2019).
  46. Van Winsum, W. A threshold model for stimulus detection in the peripheral detection task. Transp. Res. Part F 2019, 65, 485–502. [Google Scholar] [CrossRef]
  47. Van Winsum, W. Optic flow and tunnel vision in the detection response task. Hum. Factors 2019b, 61, 992–1003. [Google Scholar] [CrossRef]
  48. Van Winsum, W. The effects of cognitive and visual workload on peripheral detection in the detection response task. Hum. Factors 2018, 60, 855–869. [Google Scholar] [CrossRef]
  49. Wechsler, K.; Drescher, U.; Janouch, C.; Haeger, M.; Voelcker-Rehage, C.; Bock, O. Multitasking during simulated car driving: A Comparison of young and older persons. Front. Psychol. 2018. [Google Scholar] [CrossRef] [PubMed]
  50. Rodseth, J.; Washabaugh, E.P.; Al Haddad, A.; Kartje, P.; Tate, D.G.; Krishnan, C. A novel low-cost solution for driving assessment in individuals with and without disabilities. Appl. Ergon. 2017, 65, 335–344. [Google Scholar] [CrossRef] [PubMed]
  51. Green, M.; Allen, M.J.; Abrams, B.S.; Weintraub, L. Forensic Vision with Application to Highway Safety, 3rd ed.; Lawyers & Judges Publishing Company: Tuscon, AZ, USA, 2008; ISBN 978-1-933264-54-7. [Google Scholar]
  52. Shinar, D.; Rockwell, T.; Mallecki, J. The effects of changes in driver perception on rural curve negotiation. Ergonomics 1980, 23, 263–275. [Google Scholar] [CrossRef]
  53. Rumar, K.; Marsh, D.K., II. Lane Markings in Night Driving: A Review of Past Research and of the Present Situation; The University of Michigan Transportation Research Institute: Ann Arbor, MI, USA, 1998. [Google Scholar]
  54. McCartt, A.T.; Shabanova, V.I.; Leaf, W.A. Driving experience, crashes and traffic citations of teenage beginning drivers. Accid. Anal. Prev. 2003, 35, 311–320. [Google Scholar] [CrossRef]
  55. Guidetti, G.; Guidetti, R.; Manfredi, M.; Manfredi, M.; Lucchetta, A.; Livio, S. Saccades and driving. Acta Otorhinolaryngol. Ital. 2019, 39, 186–196. [Google Scholar] [CrossRef]
  56. Sun, Q.C.; Xia, J.C.; He, J.; Foster, J.; Falkmer, T.; Lee, H. Towards unpacking older drivers’ visual-motor coordination: A gaze-based integrated driving assessment. Accid. Anal. Prev. 2018, 113, 85–96. [Google Scholar] [CrossRef]
  57. Johansson, G.; Rumark, K. Drivers and road signs: A preliminary investigation of the capacity of car drivers to get information from road signs. Ergonomics 1966, 9, 57–62. [Google Scholar] [CrossRef]
  58. Johansson, G.; Backlund, F. Drivers and Road Signs. Ergonomics 1970, 13, 749–759. [Google Scholar] [CrossRef]
  59. Macdonald, W.A.; Hoffmann, E.R. Drivers’ awareness of traffic sign information. Ergonomics 1991, 34, 585–612. [Google Scholar] [CrossRef]
  60. Milosevic, S.; Gajic, R. Presentation factors and driver characteristics affecting road-sign registration. Ergonomics 1986, 29, 807–815. [Google Scholar] [CrossRef]
  61. Drorya, A.; Shinar, D. The effects of roadway environment and fatigue on sign perception. J. Saf. Res. 1982, 13, 25–32. [Google Scholar] [CrossRef]
  62. Babić, D.; Babić, D.; Ščukanec, A. The Impact of road familiarity on the perception of traffic signs—Eye tracking case study. In Proceedings of the 10th International Conference: “Environmental Engineering”, Vilnius, Litva, 27–28 April 2017; pp. 1–7. [Google Scholar]
  63. Laya, O. Eye movements in actual and simulated curve negotiation task. IATSS Res. 1992, 16, 15–26. [Google Scholar]
  64. Land, M.F.; Lee, D. Where we look when we steer? Nature 1994, 369, 742–744. [Google Scholar] [CrossRef] [PubMed]
Figure 1. Position of the Holter ECG heart rate measurement electrodes.
Safety 06 00024 g001
Figure 2. Representation of driving scenario (green route).
Safety 06 00024 g002
Figure 3. Representation of research implementation: (a) scenario without traffic signalling; (b) scenario with “included” traffic signalling.
Safety 06 00024 g003
Table 1. Names, definitions and units of the variables.
Variable nameDefinitionUnit
Driving speedChange in the position of the vehicle in a unit of time.km/h
Acceleration/decelerationChange in speed in a unit of time.m/s2
Lateral positionThe position of the vehicle determined by the distance from the middle of the front bumper to the middle of the right edge line.
Negative value-vehicle movement is to the right (towards the edge line).
Positive value-vehicle movement is to the centre of the road (towards the centre line).
m
Heart rateRate of cardiac cycle change.bpm
Fixations-number and durationCondition of the eye when it is “motionless”, or when it is temporarily still while observing an object or reading words.N and (ms)
Saccades-number and durationEye movement between two fixations.N and (ms)
Table 2. T-test results for variables obtained from the driving simulator.
VariablepDescription
Driving speed0.001p < 0.05–statistically significant difference
Acceleration0.898p > 0.05–no statistically significant difference
Deceleration0.823p > 0.05–no statistically significant difference
Lateral position of the vehicle towards the left side of the road (centre line)0.000p < 0.05–statistically significant difference
Lateral position of the vehicle towards the right side of the road (edge line)0.000p < 0.05–statistically significant difference
Table 3. T-test results of participants’ eye movement.
VariablepDescription
Number of fixations0.004p < 0.05–statistically significant difference
Duration of fixations0.023p < 0.05–statistically significant difference
Number of saccades0.000p < 0.05–statistically significant difference
Duration of saccades0.085p > 0.05–no statistically significant difference
Table 4. Summary of the results.
Variable nameDriving ConditionMeanSD
Driving speedWithout road markings and traffic signs58.63 km/h8.66 km/h
With road markings and traffic signs52.49 km/h5.90 km/h
Acceleration/decelerationWithout road markings and traffic signsAccel.: 0.67 m/s2Accel.: 0.15 m/s2
Decel.: 1.00 m/s2Decel.: 0.22 m/s2
With road markings and traffic signsAccel.: 0.67 m/s20.09 m/s2
Decel.: 1.02 m/s20.35 m/s2
Lateral positionWithout road markings and traffic signs0.48 m0.21 m
With road markings and traffic signs0.27 m0.09 m
Heart rateWithout road markings and traffic signs89.1 bpm17.04 bpm
With road markings and traffic signs85.71 bpm16.27 bpm
Fixations - number and durationWithout road markings and traffic signsNumber: 16513.844390.07
Duration: 1756.31 ms1242.75 ms
With road markings and traffic signsNumber: 18935.133382.87
Duration: 1421.80 ms721.65 ms
Saccades - number and durationWithout road markings and traffic signsNumber: 1373.90638.70
Duration: 55.56 ms7.43 ms
With road markings and traffic signsNumber: 1785.16649.88
Duration: 57.79 ms6.44 ms

