
Evaluating the Associations between Forward Collision Warning Severity and Driving Context


1
Touchstone Evaluations Inc., Detroit, MI 48202, USA
2
Massachusetts Institute of Technology Center for Transportation & Logistics AgeLab, Cambridge, MA 02142, USA
*
Author to whom correspondence should be addressed.
Safety 2022, 8(1), 5; https://0-doi-org.brum.beds.ac.uk/10.3390/safety8010005
Submission received: 22 November 2021
/
Revised: 24 December 2021
/
Accepted: 13 January 2022
/
Published: 20 January 2022
Abstract
:Forward collision warning (FCW) systems typically employ forward sensing technologies to identify possible forward collisions and provide an alert to the driver in the event they have not recognized a threat. These systems have demonstrated safety benefits. However, because the base rate of collisions is low, sensitive FCW systems can provide a high rate of alarms in situations with no or low probability of collision, which may negatively impact driver responsiveness and satisfaction. We examined over 2000 naturally occurring FCWs in two modern vehicles as a part of a naturalistic driving study investigation into advanced vehicle technologies. Analysts used cabin and forward camera footage, as well as environmental characteristics, to judge the likelihood of a crash during each alert, which were used to model the likelihood of an alert representing a possible collision. Only nine FCWs were considered “crash possible and imminent”. Road-type, speed, traffic density, and deceleration profiles distinguished between alert severity. Modeling outcomes provide clues for reducing nuisance and false alerts, and the method of using subjective video annotation combined with vehicle kinematics shows promise for investigating FCW alerts in the real world.
1. Introduction
1.1. Forward Collision Warning Systems
Rear-end crashes constitute between 20 and 30% of all police-reported crashes in the United States [1] and constitute nearly a third of fatal crashes in environments of speeds over 45 MPH [2]. Forward collision warning (FCW) was the first advanced crash avoidance technology to begin to offer drivers assistance in avoiding these crashes. FCW systems are part of many vehicles’ collision avoidance systems (CAS), which typically employ radar or vision systems to identify possible forward collisions and provide an audible, visual, tactile, or combination of alert modalities to notify the driver in the event they have not recognized a hazard in their forward path [3]. A system may also pre-charge the brakes to facilitate a rapid response to the potential threat or pre-tension the seatbelts to help enhance protection of occupants in the event of a crash. Unlike automatic emergency braking (AEB) or emergency steering function (ESF), both of which were developed and deployed more recently (FCW systems were made widely available on passenger cars and trucks in the mid-2000s), FCW alerts alone do not provide any control input into the vehicle’s steering, throttle, or brakes, but depend upon the driver to respond appropriately to a hazard [3]. FCW alerts are intended to attract the driver’s attention to the forward path of the vehicle so that the driver is better prepared to attend and respond to a possible hazard or threat emerging in that forward path. Because an FCW alert is specifically intended to give the driver time to attend and react, the algorithms which govern the timing of FCW alerts were developed through extensive human factor research and development (e.g., [4]) to accommodate both how long it takes a driver to notice and respond to an alert, as well as the time it takes for a driver to accomplish a braking response [4]. As a result, FCW alerts are issued much earlier than those CAS components (such as AEB) that are designed to respond later in the collision-possible sequence, after the driver has failed to respond to help mitigate or prevent crashes [4]. However, for many of the scenarios in which an FCW can be effective, such as the scenario used in the NHTSA FCW performance test procedure [5], AEB may be ill-suited. In this scenario, in which a driver follows a moving lead vehicle that unexpectedly departs the lane, revealing a stopped lead vehicle, an FCW alert is used with a time-to-collision (TTC) of 2.1 s, to which the driver, who is engaged in a non-driving-related task (NDRT), should respond and avoid or mitigate a collision. While many of the FCW alerts studied did alert drivers to make stopping or evasive maneuvers, the authors note the scenario may not lend itself to effective mitigation via AEB, due to “the combination of short target acquisition time, sensor limitations (e.g., target identification), and system response time (e.g., for algorithm processing and brake system activation) [5] (p. 101)”. Despite the developments of other advanced technologies, FCWs remain an important tool in crash avoidance and mitigation.
1.2. Research into the Strengths and Weaknesses of FCW Systems
Three field operational trials (FOTs) found that FCW reduced the tendency for tailgating (compared to driving with no FCW system in the vehicle) under conditions where tailgating is more prevalent (ACAS FOT [6]; EuroFOT [7]; IVBSS [8]) and reduced the amount of time that drivers spent following a vehicle ahead at short headways. The EuroFOT data also showed that FCW led to an increase in time headways and a reduction in harsh braking incidents across rural and urban conditions. When headways are lengthened during car-following, it has been hypothesized that this may provide drivers with additional time to respond to unexpected rear-end crash conditions that might emerge. It has been further hypothesized that an FCW alert may at times (e.g., when a driver is distracted) alert the driver to an approaching (or closing) conflict earlier than the driver would have otherwise detected it. However, the data from the ACAS and IVBSS FOTs showed that FCW alone did not have a broad effect on reducing conflicts (even though it had effects on reducing tailgating behavior).
Other studies, including on-road and track experiments, have provided evidence that drivers can potentially take advantage of collision warnings to improve safe driving in some situations. In early on-road experimental studies, Dingus et al. [9] employed both visual and auditory warnings to assess distance maintenance and found that visual warnings, in particular, were associated with a significant increase in headway maintenance but auditory warnings alone provided no benefit. Fisher et al. [10] examined headway, FCW, and incident rate for drivers in a 3–12-month field experiment and found no significant change in headway or average speed due to auditory FCW usage over time, but modeling suggested a reduction in incident rate as a result of FCW, possibly due to drivers learning to respond faster to FCW alerts, using them as cues, and as such reducing the likelihood of a conflict. These studies suggest that FCW alerts demonstrate the capacity to be effective at reducing crash and conflict rates.
To that end, historical crash statistics have demonstrated some actual effectiveness of FCW systems. The Highway Loss Data Institute [11] observed a significant reduction in property damage claims associated with the presence of an FCW feature. Cicchino [12] observed a 23% reduction in rear-end striking crash involvement, but no significant reduction in such crashes with injuries (a reduction in injury crashes was observed for FCW alone for multiple car crashes); however, these effects were larger and more consistent for vehicles also equipped with AEB. Cicchino [13] observed a similar 27% reduction in police-reported rear-end striking crash involvement for vehicles equipped with FCW, which was improved to 50% when paired with AEB.
In addition to effectiveness, much of the research on FCWs has concerned driver acceptance. Najm [6] looked comprehensively at driver acceptance of FCW and adaptive cruise control (ACC) systems in a FOT, and observed a relationship between the issuance of FCWs to actual threats and positive attitudes toward the system. Drivers who were alerted to actual threats by the FCW system under study (especially while distracted) were more likely to provide positive feedback across several scales than other drivers, but, because actual threats were rare, most drivers did not view the FCW system positively (ACC, on the other hand, was viewed generally positively). In a Chinese FOT examining FCWs, lane departure warnings (LDWs), and side blind zone alerts (SBZAs), Li et al. [14] found that FCW acceptance trailed SBZA acceptance, and that this trend was even stronger for LDW alerts; this may be in part due to a higher rate of alerts that were not actual threats. The Consumer Reports’ Advanced Safety Systems Survey [15] showed that while 69% of owners of vehicles with FCW systems were very satisfied with the system, only 54% reported that they trusted the system to work every time.
The major technical challenge to maximizing the potential safety benefits from FCWs and improving acceptance has been the handling of “false alarms”. Parasuraman et al. [16] observed that the events that FCW systems are designed to prevent, collisions, have a very low base rate, such that even highly precise alert systems designed to alert a driver to a potential impending collision will likely have many false alarms. Thus, Parasuraman et al. [16] argue that detecting collision-possible events may be more practical (and possibly desirable, as it may be used as a driving aid), but that driver acceptance would require a low false alarm rate (ideally indistinguishable from zero). Unfortunately, in all practicality, the reduction of a false alarm rate this low when the posterior probability of a collision is also low (indeed, for many drivers it may be decades between incidents in which they even need to make a true evasive maneuver) may be impossible without setting a detection threshold so low that it misses key events. Critically, Parasuraman et al. [16] argue for the importance of identifying the posterior probability of collision likelihood to reduce false alarms and to increase FCW acceptance and effectiveness. This may be one path to enhancing driver acceptance of and trust in FCW systems.
1.3. The Current Study
In light of the strong potential benefits of FCW systems and evidence for reduced crash risk associated with FCW systems, both experimentally and on the road, but sub-optimal levels of FCW system acceptance and trust, the current study leverages data from production vehicles in a FOT study in order to identify real world FCW alerts, the contexts in which they occurred, and the apparent necessity of their issuances in two production vehicles with FCW systems: the 2016 Range Rover Evoque and the 2017 Volvo S90. The goals of this study were fourfold: 1. develop a method using subjective video annotation of video of FCW issuances in naturalistic driving to estimate alert severity, and use driving kinematics to validate those estimates; 2. estimate the probability of an FCW in response to imminent collision (i.e., a situation in which a rapid evasive maneuver is required, such as steering or hard braking) versus a collision-impossible event (i.e., a situation in which a forward collision could not happen), which Parasuraman et al. [16] referred to as a “false alarm” in the alerting scenario in which a broad range of crash possibility was considered; 3. demonstrate an association between these probabilities and vehicle dynamic data; 4. model the context under which imminent and collision impossible FCW events are likely to occur to better estimate the posterior probability of collision likelihood (and, conversely, false alarm likelihood) informing the calibration of FCW systems.
2. Materials and Methods
2.1. Participants
The dataset included 37 participants who were recruited to take part in the MIT Advanced Vehicle Technology (MIT-AVT) study. Participants were recruited from the greater Boston, Massachusetts area, and were screened using background and driving record checks to ensure that no drivers had been involved in a police-reported crash or received more than one traffic violation within the past year, as the study involved providing them a research vehicle and institutional review board required some diligence in excluding the highest risk drivers. Participants were also excluded if highway driving was not a reported part of their normal driving routine to ensure that drivers would have some highway exposure in which to consider assistive driving feature usage. Twenty-one participants (11 female, with an average age of 41.3 years [minimum age = 21, maximum age = 65]) were randomly assigned to drive a 2016 Range Rover Evoque (“Evoque” going forward), and 16 participants (8 male, with an average age of 45.8 years [minimum age = 27, maximum age = 66]) were randomly assigned to drive a 2017 Volvo S90 (“S90” going forward). These vehicles were chosen for their semi-autonomous driving capabilities (e.g., adaptive cruise control, lane centering) for other research purposes, but both vehicles also have the FCW functionality that is the focus of this study. As such, this study is not a comprehensive evaluation of current FCW systems, but an application of a novel methodology to two production systems serving only as example implementations using tools available to researchers who do not otherwise have access to algorithm implementation details or on-board sensor output, as typically only the manufacturers of the vehicles or systems have.
2.2. Apparatus and Training
Participants were introduced to their vehicle at MIT and were trained on its various features, including a static introduction to its safety features and instrumentation in the vehicle. They took part in an on-road demonstration session involving several CAS and assistive driving systems, their settings, and possible alerts (e.g., LDW sensitivity settings and alerts, FCW sensitivity settings but not alerts), lasting approximately one hour. After this, participants kept the vehicle for four weeks, during which they drove it as a part of their normal driving routine. To maximize the naturalistic nature of the project, driver familiarization and instruction consisted of information available to purchasers of the vehicles via the operator’s manual or official vehicle website, and drivers could adjust vehicle settings as they wished, including the FCW distance settings (i.e., the threshold at which FCW alerts were issued based on the vehicle’s own algorithm).
Vehicles were instrumented with a custom data acquisition system (RIDER, Real-time Intelligent Driving Environment Recording) which collected, among other information, vehicle kinematic data (via the controller area network (CAN) bus and on-board accelerometer sensors), and video data (via four 720 p video cameras positioned around the cabin to collect views of the driver’s face, the driver’s behavior inside the cabin, the instrument cluster, and the forward roadway). These streams of data were synchronized at the point of data acquisition and stored at 30 Hz; more details on the RIDER data acquisition system can be found in Fridman et al. [17]. The resulting dataset consisted of a synchronized stream of video and kinematic data such as longitudinal acceleration.
2.3. Data Reduction and Annotation
Data for this study came from nearly 6000 trips, comprising over 2200 h and 50,000 m of travel. FCWs in both vehicles were identified using trained computer vision algorithms applied to the video images recorded from the instrument cluster camera, since, in addition to an auditory alert, a visual FCW telltale was presented to drivers by the systems. To do this, a single shot detector was used to detect the FCW icon. A training dataset for a VGG16 convolutional neural network model [18] was built leveraging manual annotation and expanded iteratively based upon high confidence positive detections. While positive algorithmic detections were all manually validated by human coders (mitigating the potential of false positives), the detection routine’s false negative rate is unknown and is to some degree influenced by extrinsic factors such as solar glare and other reflections obscuring the image of the indicator. However, periods of time of high deceleration (>0.3 g) were identified and manually checked for missed FCW issuances (of which zero were found), so it is likely that any missed FCW issuances were of the “nuisance” category, and thus the rates of nuisance alerts described should be potentially viewed as a lower bound.
This analysis consists of 2034 FCW alerts identified in this manner (1790 for the Evoque, and 243 for the S90). For each FCW, a period of time subtending 5 s before to 10 s after the alert issuance was resected from available data for analysis. For this analysis, this data consisted of CAN-based vehicle speed (and derived vehicle acceleration) and the quad-split video from the four cameras (with synchronized audio from inside the cabin). These data were synchronized at the point of capture; the fifteen seconds of video were used by analysts for epoch annotation, and the fifteen seconds of longitudinal acceleration were used to validate severity classifications.
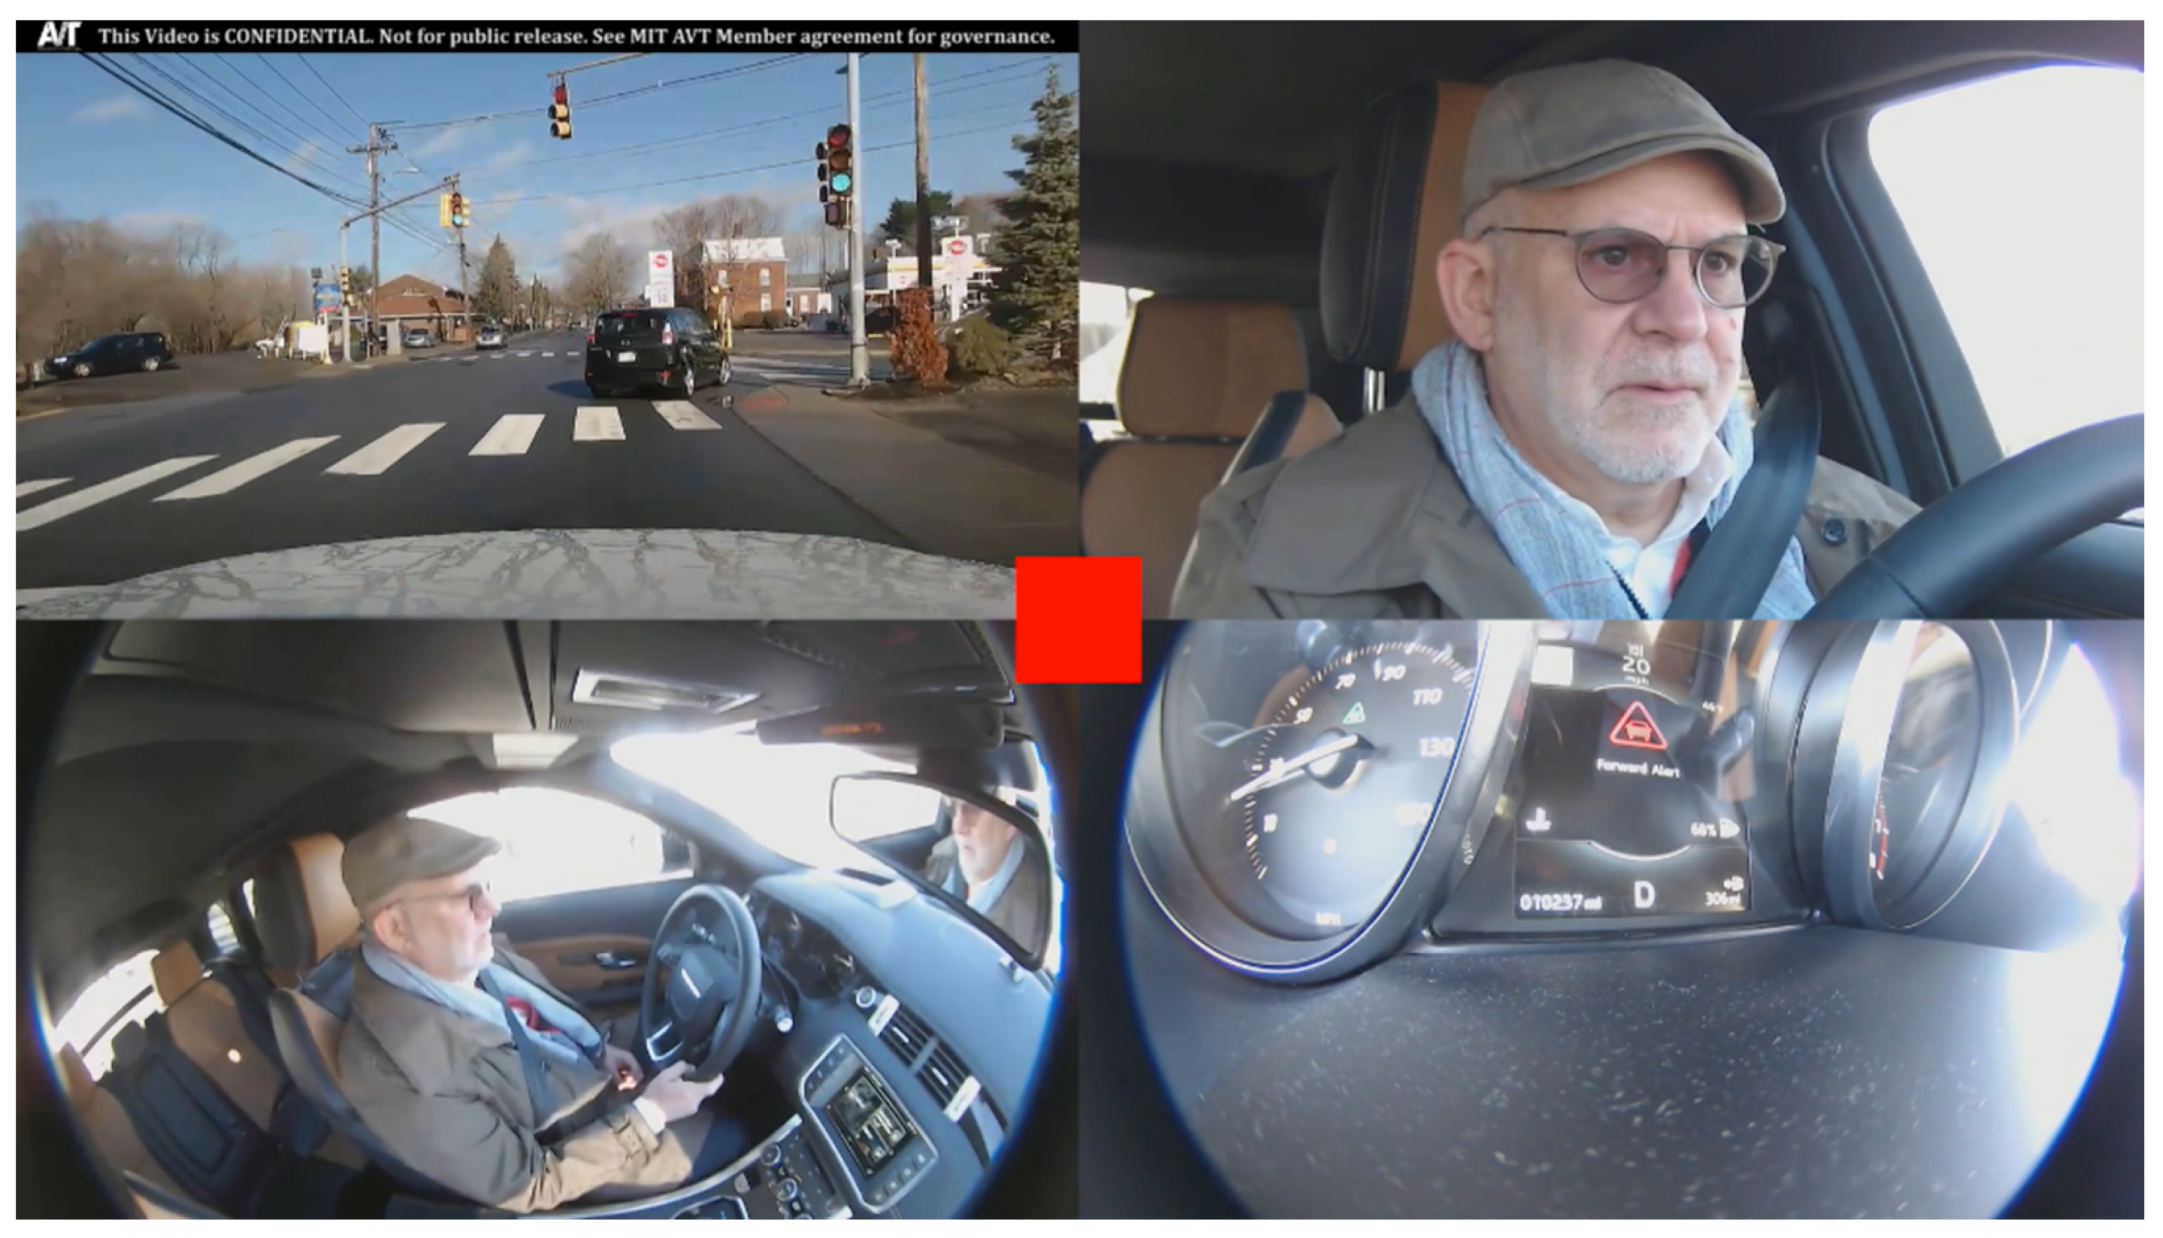
The first pass of video annotation was done on the quad-split video, wherein annotators reviewed each clip for validity (i.e., whether an alert was truly issued) and assigned each FCW issuance a rating based on the likelihood of a crash based only on visual information available in each clip. Ratings and descriptions are shown in Table 1. While the team of analysts viewed each of the nine “crash possible and imminent” FCW epochs and agreed on the categorization, the majority of the other epochs were coded by a single analyst. Thus, while it is unlikely the “crash possible and imminent” epochs do not represent potentially imminent crashes (based on this coding approach), the rate of missed imminent and possible crashes among the other epochs is unknown, and thus the count of nine may represent a lower-bound estimate. Videos were additionally annotated by separate analysts for features of environmental context. Analysts were trained to focus on attributes of the driving scenario and the environment, and based their analyses on the five seconds of video before the issuance of the FCW alert. Attributes included locality, illumination, roadway geometry (curve and grade), divider or barrier presence, the presence and behavior of any lead vehicle, traffic density, and weather. Quality assurance checking was applied to a small percentage of the epochs (15%) that showed high agreement among analysts. Analysts were trained to focus on attributes of the driving scenario and of the environment. This coding was not applied in a frame-by-frame manner; rather, the clip was viewed from start to finish at least once by the video analyst, who then coded the attributes of the scenario as a whole (e.g., what type of road, weather, etc.). Annotations were single-coded, and a formal interrater reliability analysis was not computed. A sample image of video from which analysts based their annotations is displayed in Figure 1.
3. Results
3.1. FCW Severity Ratings
FCW counts and probabilities are displayed for each severity rating and vehicle in Table 2. As can be seen, the FCW alerts issued when an evasive maneuver was likely to be needed—the “Crash possible and imminent” alerts (“imminent alerts” going forward)—were exceedingly rare, comprising between 0.2% (S90) and 2.1% (Evoque) of alerts. Conversely, FCW alerts issued where there is no notable event (observed by the annotator) to which the driver should attend—the “nuisance” alerts (“nuisance alerts” going forward)—were more common, but also rare, comprising between 0.8% (Evoque) and 9.5% (S90) of alerts. These are the two categories of alerts that are of critical interest in this analysis, as they represent either the probability of an alert representing a potential collision (imminent alerts) or the probability of an alert not representing a possible collision (a nuisance alert), which are two facets critically identified by Parasuraman et al. [16] for developing an effective FCW system.
There are major differences in the counts of FCWs observed between the two vehicles, despite similar exposure and random assignment of participants to the two vehicles. Critically, these differences principally occurred in the “crash unlikely” category, and, based on inspection of FCW feature settings upon return, seems to be due to a few participants in the Evoque having set their FCW warning distance threshold to the most conservative setting. Notably, there were not major differences in counts between vehicles in the categories of prime interest: crash possible and imminent and nuisance alert. A follow-up analysis did not find any interactions between contextual attributes and severity ratings between the vehicles or between deceleration profiles and the vehicle type, and so, due to the small amount of imminent and nuisance alerts, the two vehicles were combined for mixed-effects logistic regression analyses and deceleration profile plots. As in Najm et al. [6], no relationship was observed between the distance settings of FCWs, as recorded when vehicles were returned, and the number of imminent alerts experienced by drivers in either vehicle.
3.2. Associating Severity Ratings with Deceleration Profiles
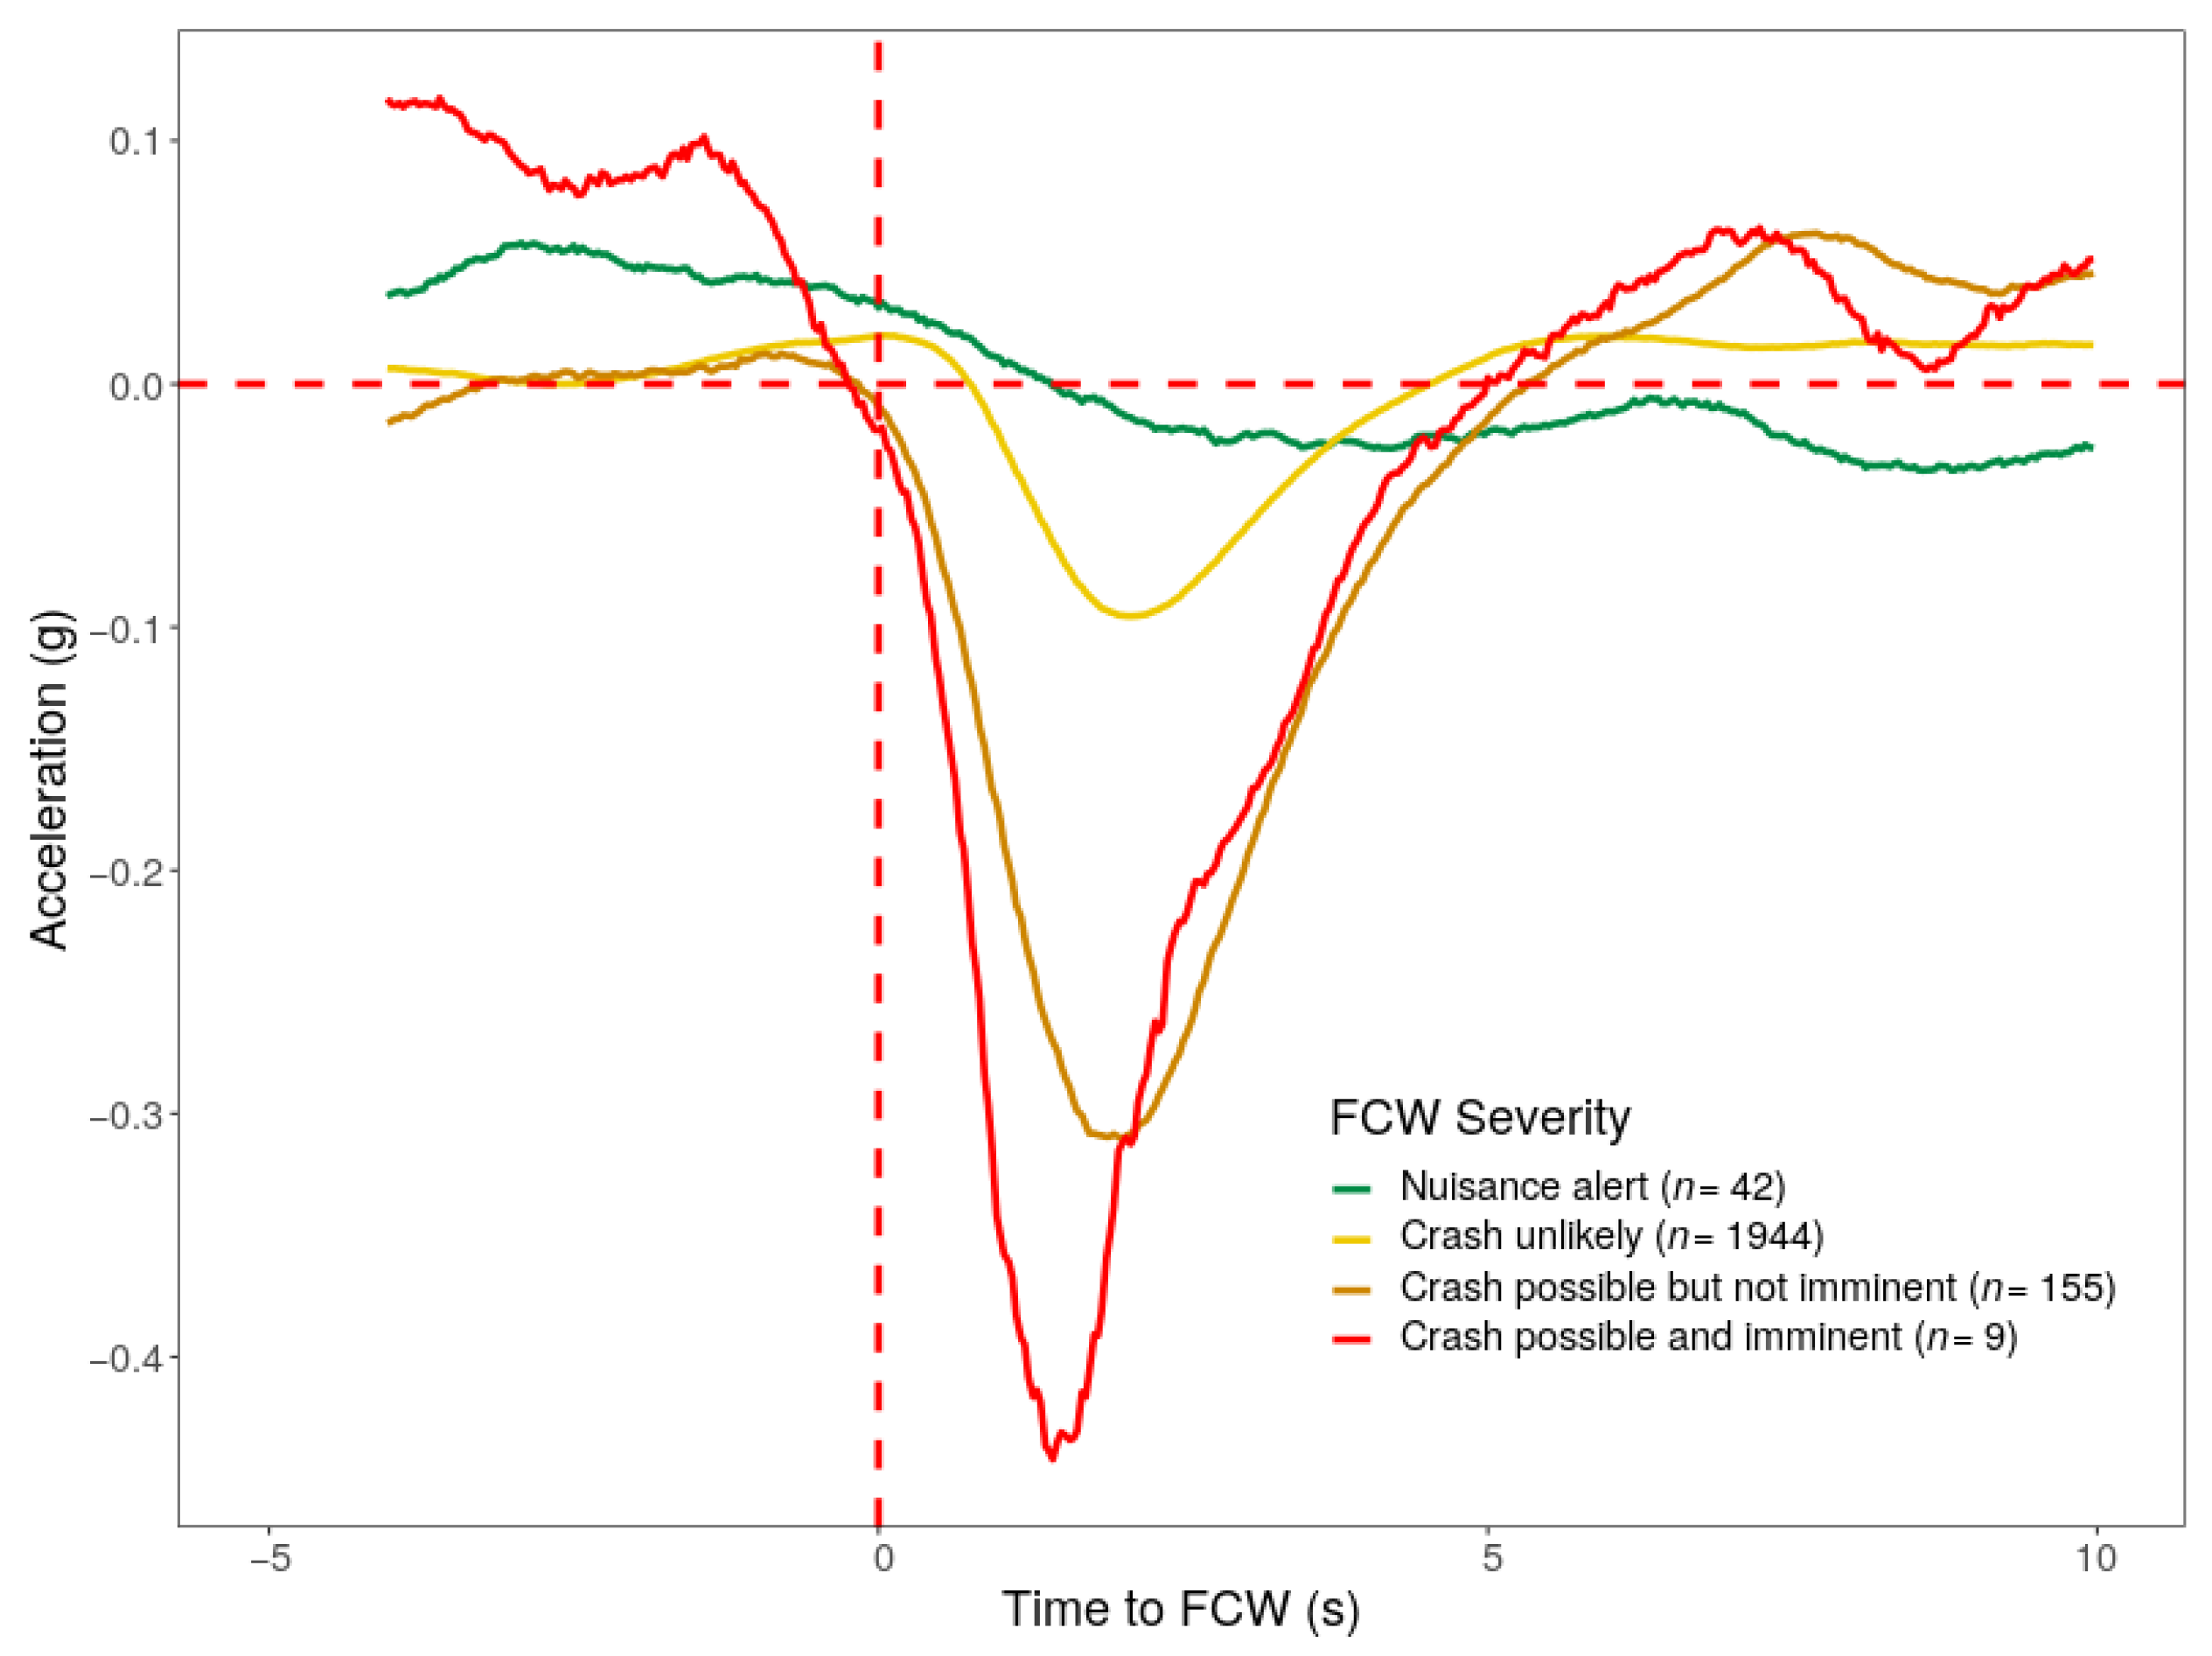
The subjective rating scale for FCW severity is based on video annotation. In addition, we examined the association between FCW ratings and acceleration computed from moment-by-moment changes in vehicle speed (CAN-bus data). It was expected that, for FCWs rated with the highest level of severity (imminent), deceleration would be maximal and possibly start prior to the FCW alert, while nuisance FCWs would have the mildest deceleration occurring only after the alert. Aggregate plots of averaged acceleration (plotted with 1 s rolling means smoothing) are shown in Figure 2.
Figure 2 illustrates that alerts issued to imminent hazards had consistent and the strongest average deceleration for each second between −1.5 (1.5 s before FCW issuance) and +3.7 (3.7 s after FCW) issuance; alerts issued to imminent hazards also showed the earliest average deceleration (−1.5 s before FCW issuance versus −0.27 s for alerts issued to crash possible hazards (which is suggestive of the possibility that crash possible but not imminent hazards may have been associated with frequently evoking a response in drivers, while crash imminent hazards may have been associated with facilitating or encouraging a stronger brake response), +0.7 s for alerts issued to crash unlikely “hazards”, and +1.5 s for nuisance alerts issued under conditions of no discernible hazard). While the number of critical alerts (especially alerts to imminent hazards) is too small for a by-subject analysis of average minimum deceleration by severity, the non-overlapping nature of the aggregate plots at critical time intervals suggests that subjective ratings of FCW severity reflect significant differences in deceleration profiles and support the use of subjective ratings from video FCW epochs to investigate the patterns of FCW issuances in naturalistic driving.
3.3. Severity by Context
We computed the proportion of alerts for imminent hazards and those for “nuisance” conditions by annotated contextual attributes and used logistic mixed effects regressions [19] with driver as a random factor to estimate the odds ratios of each type of alert as a function of each contextual condition (See Table 3). Models were assessed independently to establish univariate estimates of odds ratios of the likelihoods of each type of alert with each level of each factor.
A few notable trends emerged from this analysis. First, FCWs in imminent hazard conditions only occurred in the presence of a lead vehicle. No FCWs in imminent hazard conditions were observed in response to the sudden emergence of a vehicle into the forward roadway from another street, driveway, or parking lot. Conversely, nuisance FCWs were significantly more likely to be observed in the absence of a lead vehicle, or when the lead vehicle appeared to be driving at a steady speed or accelerating. Nuisance FCWs were also significantly less likely to occur on highways (compared to arterial, collector, and local roads), and significantly more likely to occur on local roads (compared to other localities). FCWs in imminent conditions were significantly more likely to occur in high traffic density, while nuisance alerts were significantly more likely to occur in low traffic density. Nuisance alerts were also more likely to occur on undivided roadways and on curved road segments.
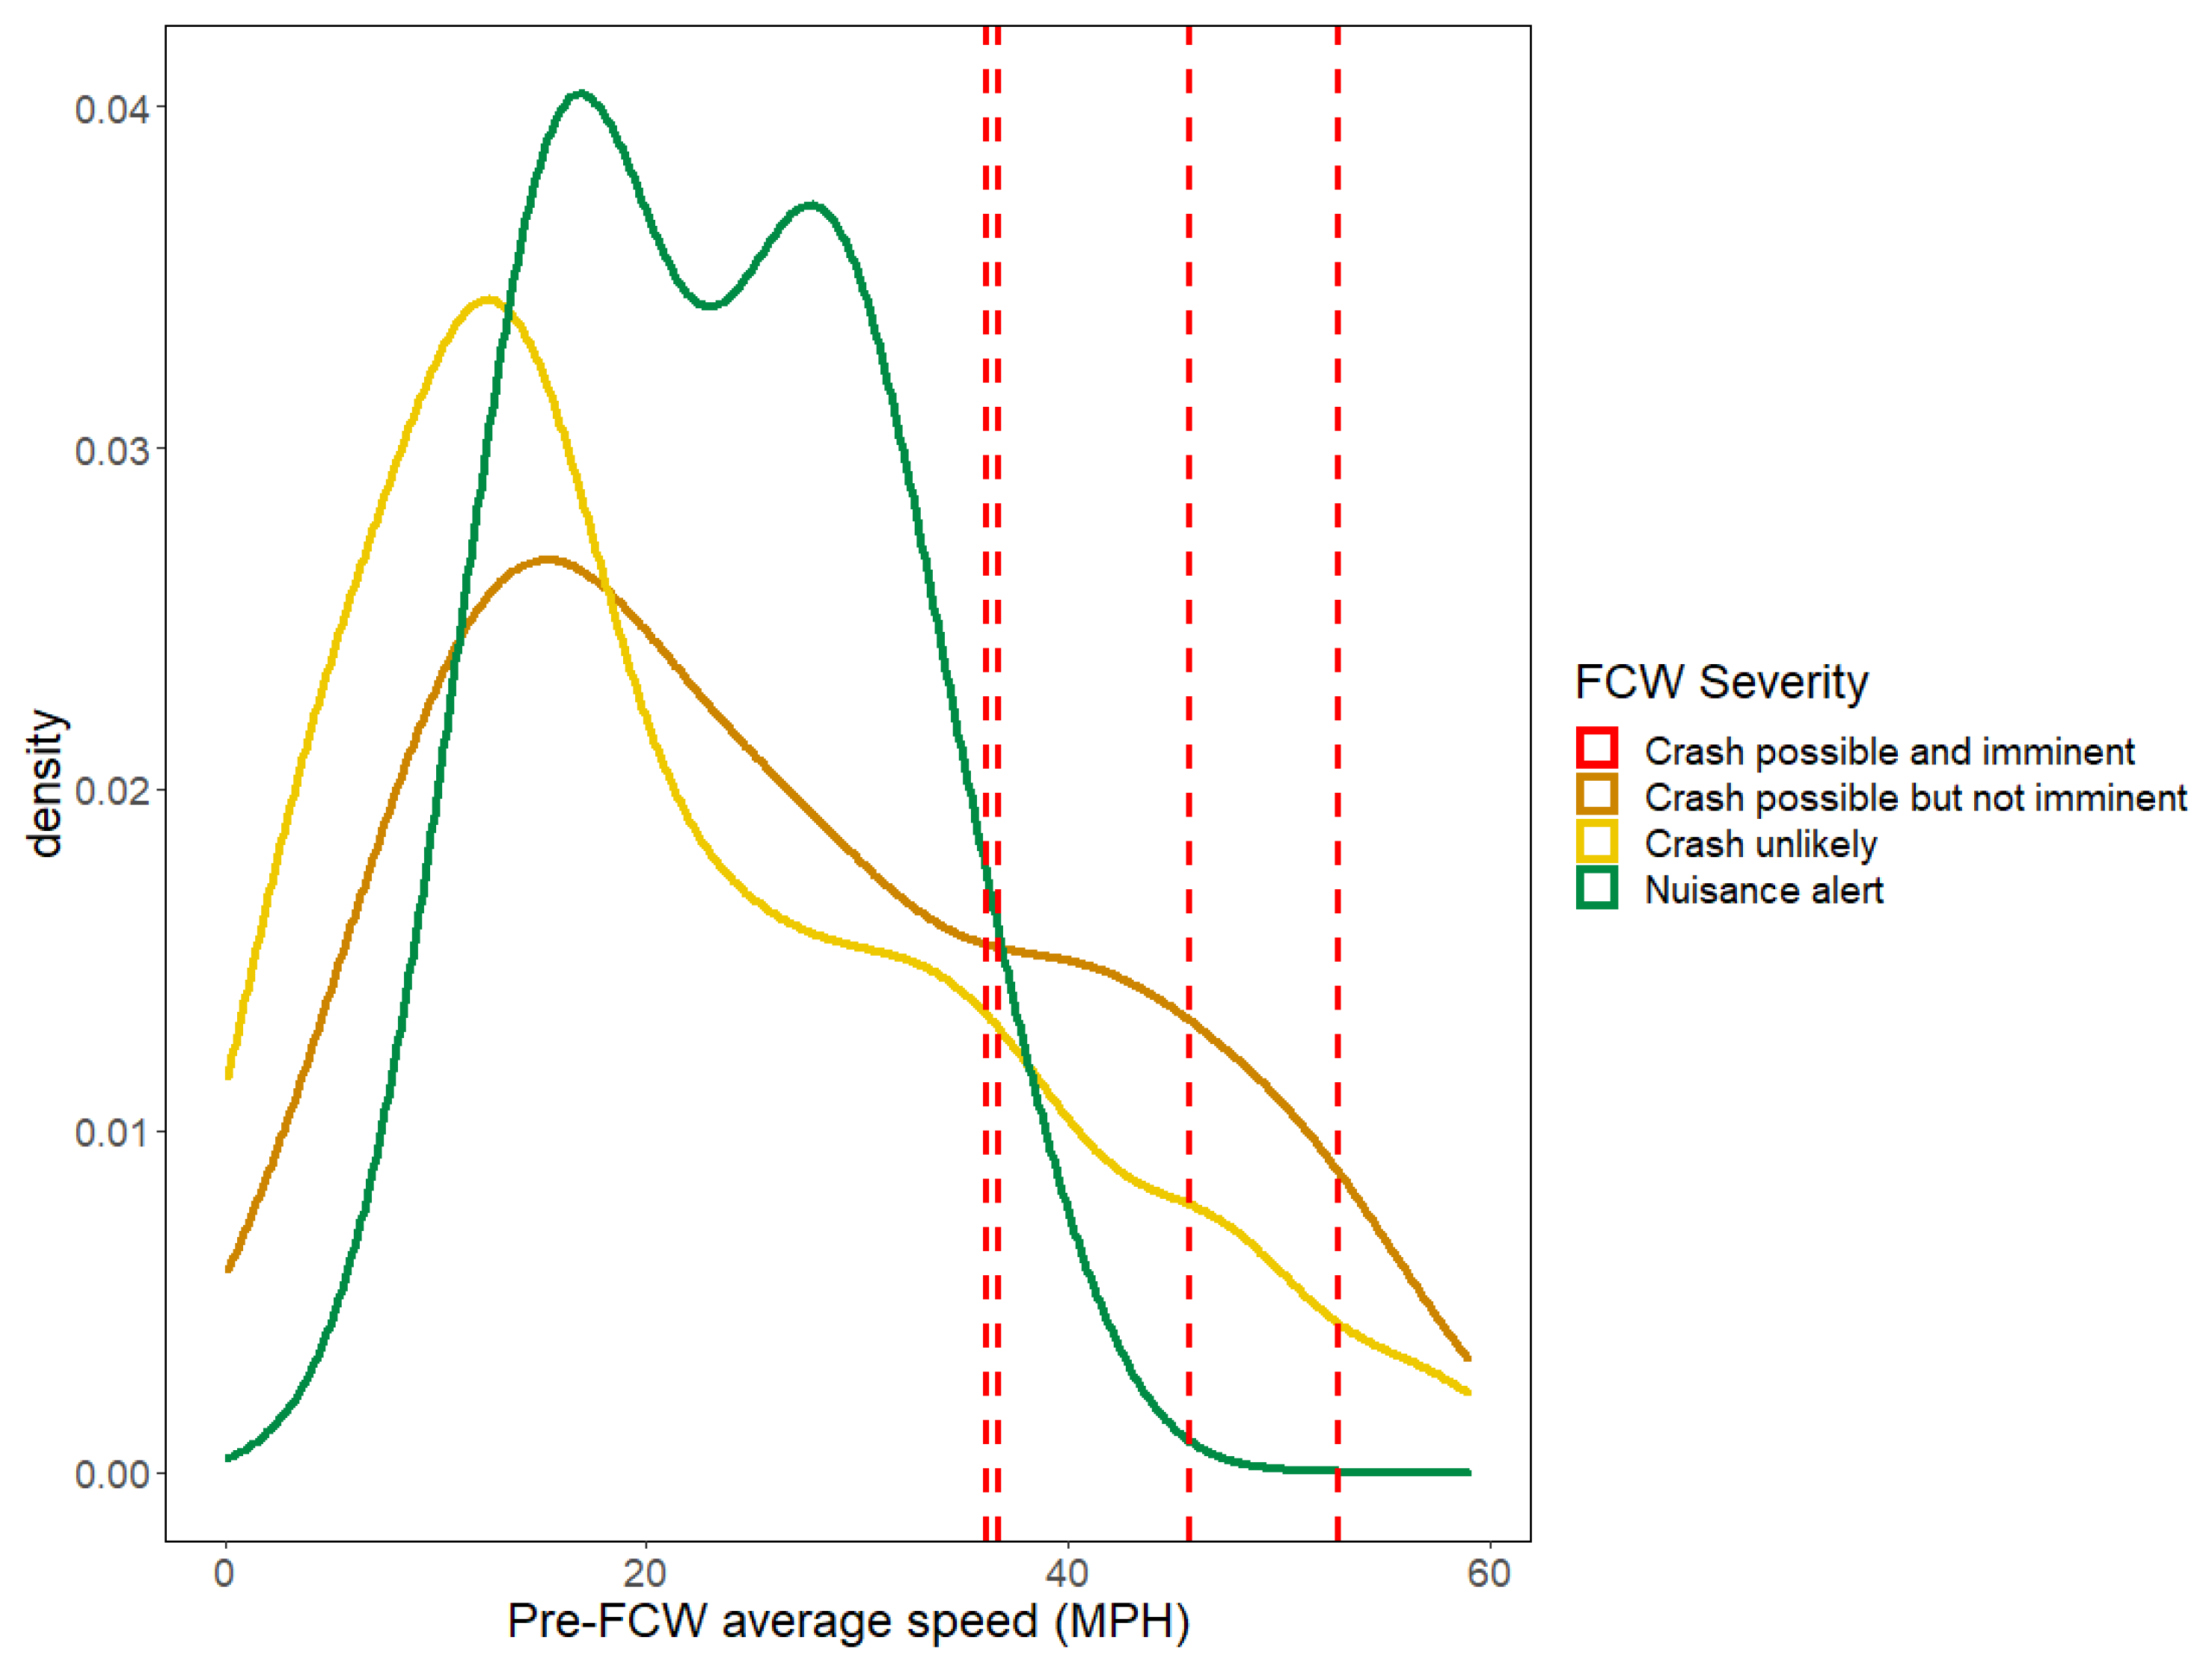
Interactions between factors were also considered. Figure 3 displays the probability density curves for speed (averaged across the 5 s period prior to each FCW) for each level of FCW severity for highway alerts only; because only 4 imminent alerts were available, each alert’s average speed is plotted as a vertical dashed line. All four FCWs in imminent hazard conditions occurred at speeds far greater than most of the speeds observed in the other severity categories but below typical posted highway speed limits, with an average speed of 43 MPH (compared to 24–28 MPH for the other categories). Nearly 75% of FCWs issued in non-imminent conditions on highways were issued at less than the minimum speed (36 MPH) for FCWs in imminent conditions.
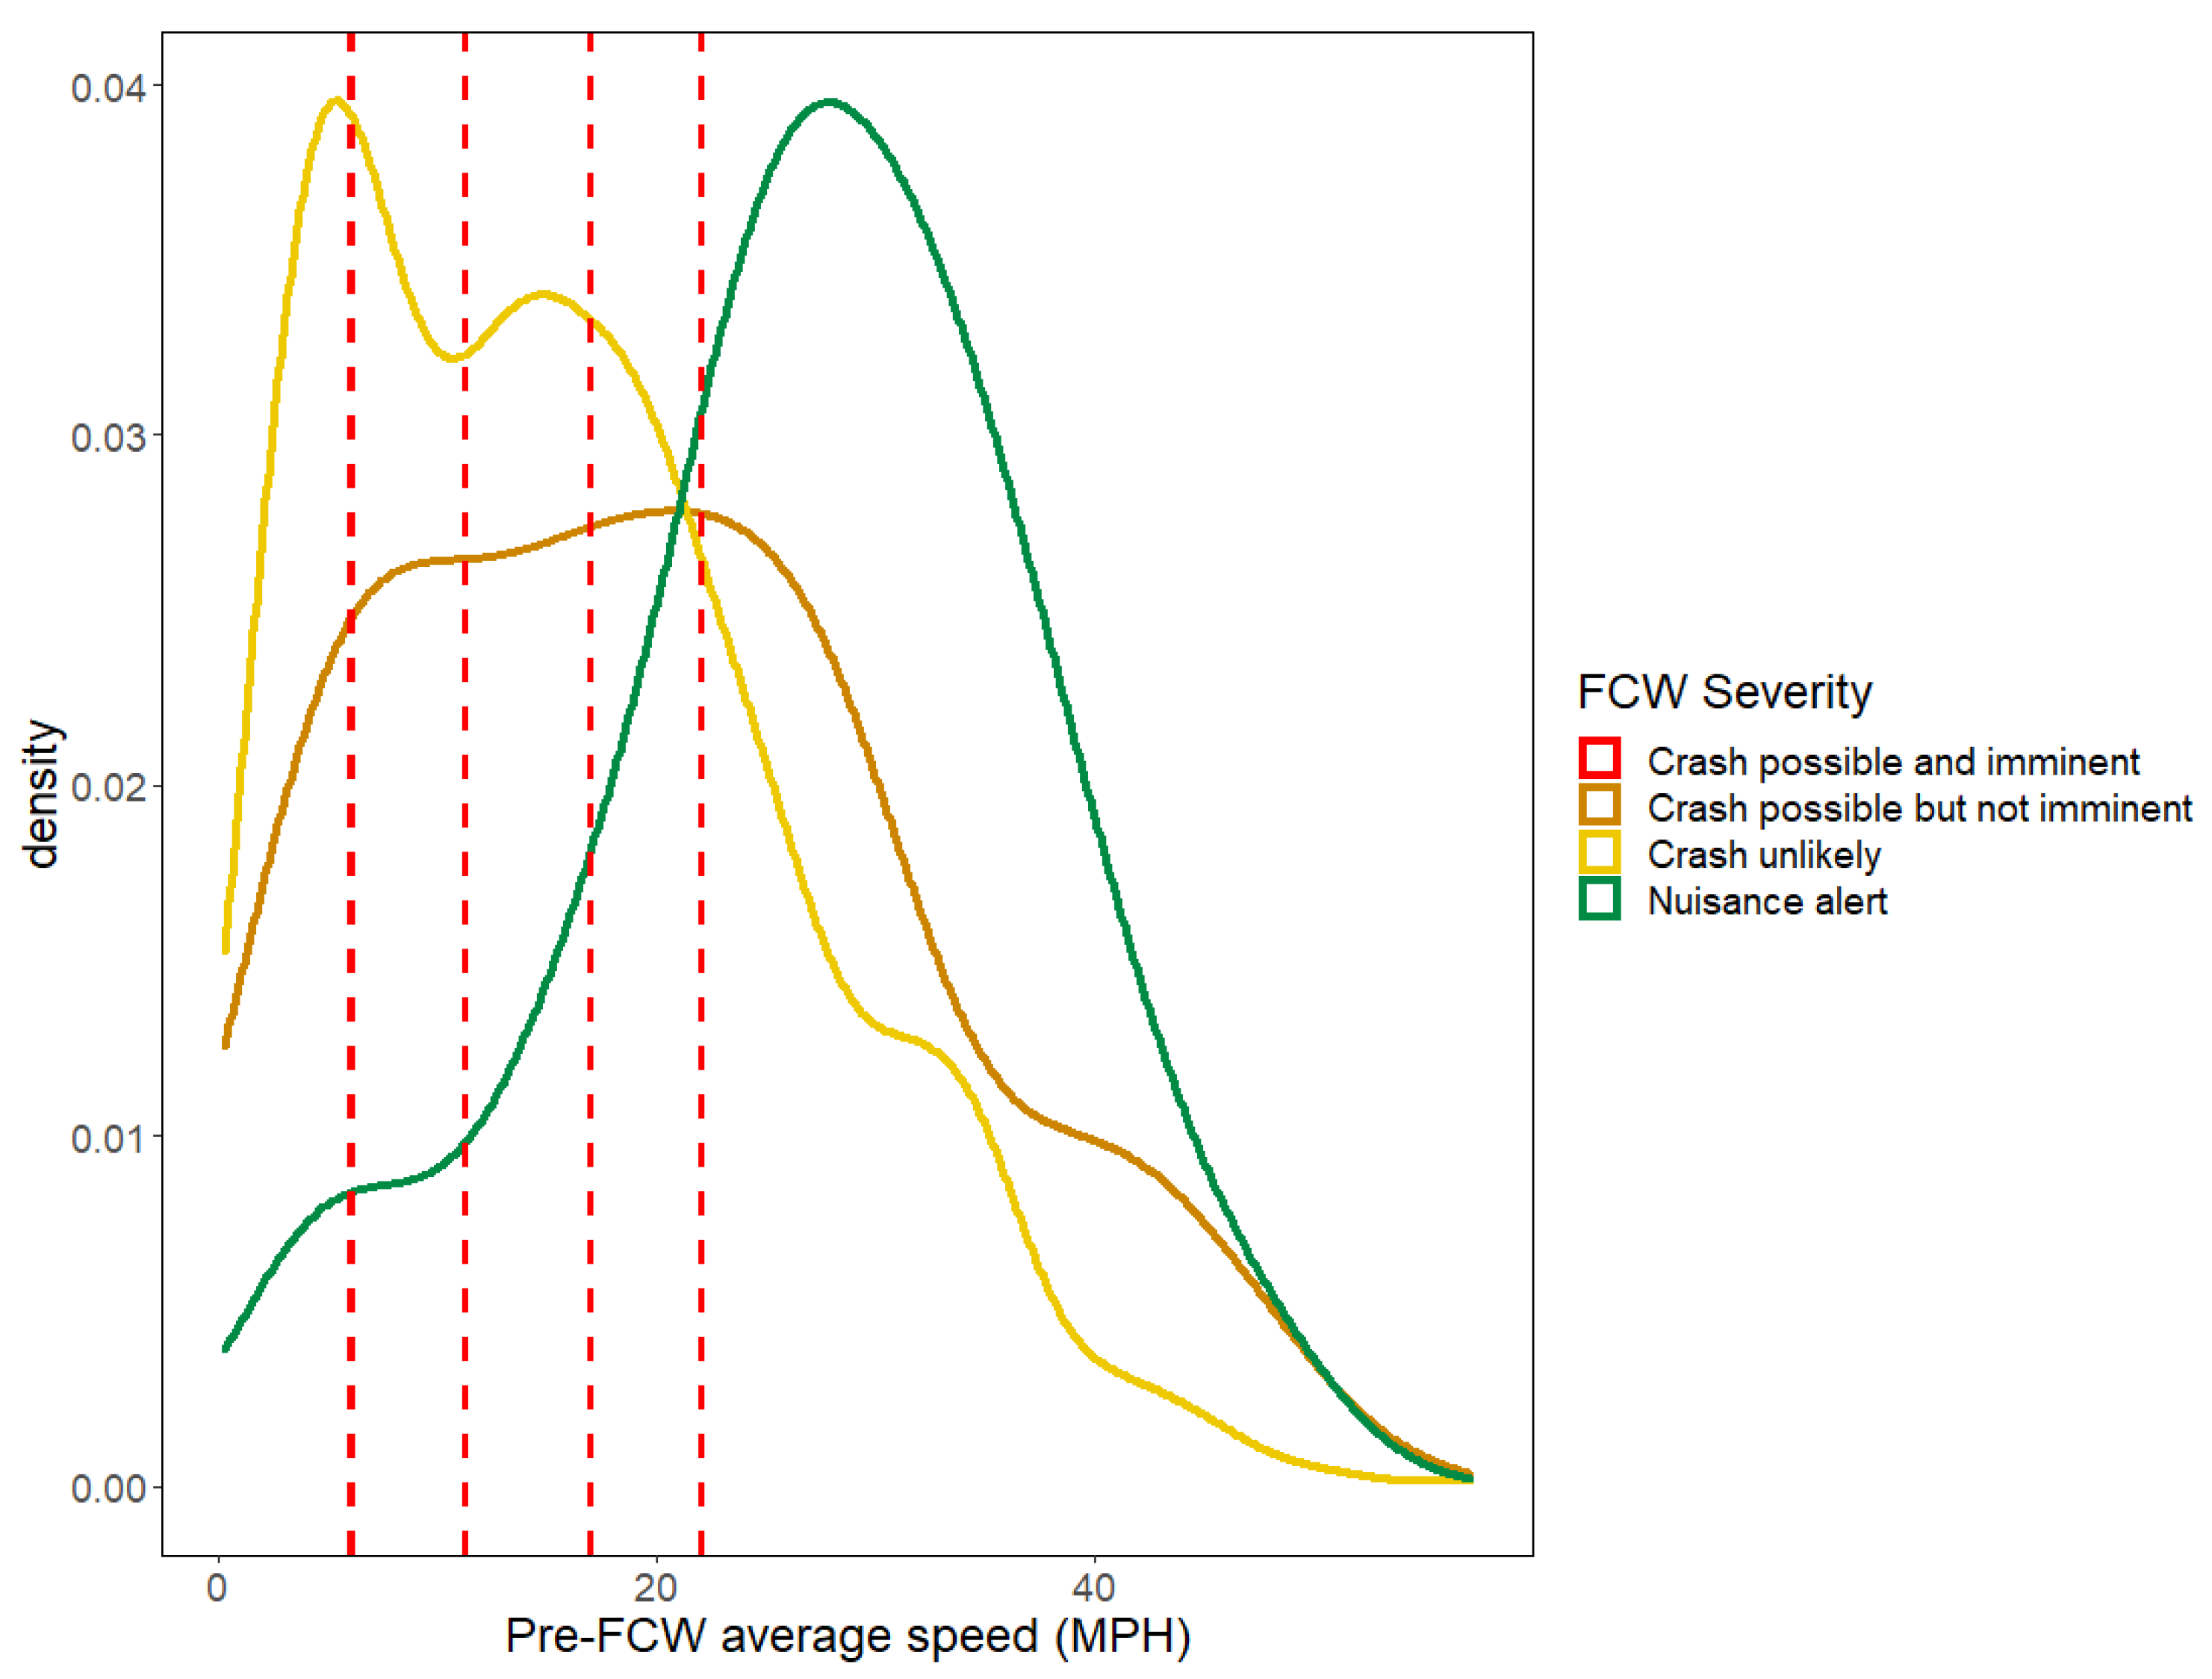
For non-highway FCWs, the relationship between speed and severity is depicted in Figure 4, again with probability density curves for most of the FCW severity categories. For the five alerts in imminent conditions, the average speed of the 5 s pre-FCW period is individually plotted. Here, the trend is reversed, with all five FCWs for imminent hazards occurring at low speeds. Conversely, nuisance alerts off-highway occur at higher speeds than other categories of severity. Over 62% of nuisance alerts occurred at speeds over 23 MPH (the fastest off-highway imminent alert observed), while only 20% of non-nuisance alerts occurred off-highway over 23 MPH. For the participants who experienced a “crash possible and imminent” alert, a mixed-effects logistic regression was computed to assess a potential interaction between road type (highway or not) and pre-FCW speed (square-root transformed due to significant right skew). This interaction was significant (b = −0.95, p = 0.028). Similarly, a mixed-effects logistic regression was computed to assess the influence of the interaction between speed and locality on nuisance likelihood, which was also significant (b = 0.63, p = 0.013), but in the opposite direction. This suggests that the likelihood of an imminent or a nuisance alert depends partly on an interaction between road type and vehicle speed.
4. Discussion
The goals of this study were to develop a method for using subjective video annotation to estimate the probability of an FCW in response to an imminent collision event versus a collision highly unlikely situation, as well as to characterize the vehicle dynamics and contexts associated with each class of event. To this end, over 2000 FCW alerts were identified from over 50,000 miles of travel, which were subjectively sorted into four categories of FCW severity by trained analysts. One of these levels, “crash possible and imminent” represented scenarios most likely to require evasive maneuvers consistent with actual crash avoidance; this score was applied nine times, with a very low overall probability. The level “nuisance alert” represented scenarios in which the alert provided no useful information about the forward scene (in which there was no discernible hazard present). This was the least desirable kind of alert and could be said to represent a false alarm from the perspective of the driver; this category was applied 42 times by analysts. The counts of these categories did not differ markedly between vehicles, despite overall differences in alert rates (with higher rates observed for the Range Rover Evoque). Vehicle deceleration profiles throughout the FCW epochs demonstrated that dynamics, in aggregate, aligned with the subjectively coded FCW severity, providing one form of validation.
Following Parasuraman et al. [16], we identified the probabilities of either: 1. crash imminent alerts (representing likely crashes without immediate driver intervention); 2. nuisance alerts (representing the obverse of a very generally defined “vehicle in forward roadway” alert which can be argued to at least provide the potential for relevant information for the driver, even if they do not need to respond). A helpful FCW system should ideally maximize the probability of imminent alerts and minimize the probability of nuisance alerts. In reality, however, for many sensing systems, raising a threshold to minimize the probability of false alerts will also reduce the probability of correctly detecting the conditions of interest (i.e., reduce the number of hazards that the system detects, and cause the system to erroneously miss more hazards). Therefore, more advanced approaches to filtering out or removing false signals may be advantageous.
By examining the subjectively annotated contexts in which all the alerts occurred, we were able to compute the conditional probabilities of both imminent and nuisance alerts by contextual attribute, as well as their associated odds ratio. This led to the identification of a number of important factors in co-determining the likelihood of either alert. Alerts to imminent hazards were more likely to occur on highways; when on highways, all alerts occurred at speeds over 35 MPH, while only 25% of lower severity alerts occurred at these speeds. However, a simple speed filter would be insufficient (unless only stopping or mitigating high speed collisions were the goal), as, off-highway, alerts to imminent hazards showed the opposite pattern, occurring at very low speeds. In either locale, alerts to imminent hazards tended to occur in medium- or high-density traffic; because these systems are designed to alert drivers to vehicles in their paths, this is expected, as higher traffic density presents higher probabilities of lead vehicles, slowing lead vehicles, and stopped lead vehicles. Nuisance alerts, on the other hand, were more likely to occur without adjacent traffic, on local roads, on curved roads, and without a decelerating or stopped lead vehicle. It is likely that many of these are due to road-adjacent features triggering FCW alerts. It is unknown what specific driver behaviors may be associated with triggering higher rates of both nuisance and imminent FCWs, although routine driving with a short TTC to a lead vehicle is likely to be associated with both.
The identification of these tendencies and probabilities is a step toward identifying the limitations of current production FCW systems and potentially improving their system design to maximize critical alerts and minimize false alarms. However, because only two consumer-available FCW systems were examined in this analysis, and for a short-term exposure, altering design to accommodate the characteristics of the nine imminent alerts observed would likely result in some overfitting and lead to missing some imminent alerts while not benefiting necessarily as much a reduction in false alarms as expected. Furthermore, it is likely that the number of FCWs observed here represents a lower boundary. While each FCW alert issuance that was detected was manually verified from video by two separate coders, the rate of missed FCW alerts is unknown (limitations in the computer vision algorithm discussed earlier), as is the distribution of undetected FCW alerts across the severity categories. In addition, while 15% of the contextual annotations were reviewed by other analysts to examine agreement (which informal appraisal deemed high), and aggregate accelerations of vehicles differed substantially across subjective assessments of severity (suggesting subjective assessments were associated with objective performance differences), a formal interrater reliability analysis would quantify the ability to which coders can identify both the severity of FCW alerts and the attributes of context in which they occur. Further, the overall use of multiple coders to assess each FCW epoch would likely improve the accuracy of the results. Potential next steps might be to adapt this analytic approach to more consumer-available FCW systems, as well as to sample random epochs of driving to estimate the rate of undetected FCW alerts, if any. Future work could benefit from greater availability of vehicle sensor data such that analysts could more comprehensively assess alert triggers and unrelated facets of the scene.
Furthermore, implementing possible design changes of FCW alerts, such as using GPS-based or video-based scene information, to adjust thresholds for alerts first in an experimental context (i.e., simulator or field experiment) may be desirable. For example, the effects of limiting FCW alerts on highways to moderately high-speed contexts could be evaluated experimentally to identify the magnitude of an improved benefit from a higher precision/lower false alarm FCW alerting design in order to estimate expected safety benefits from deploying updated FCW systems. Because such changes are likely to see the greatest effect over longer periods of use (as a result of accumulated nuisance or non-imminent alerts), such evaluation is likely to be observed in longer-term study designs, such as FOT or naturalistic driving studies.
Finally, this study did not look at the changes in FCW issuances over time, which might be expected as a driver experiences more (or fewer) FCW alerts than expected, and either adjusts system settings or adjusts driving habits; thus, the impact of driving context of FCW severity is viewed statically, when it is likely that the patterns observed do change as a driver adjusts their own driving behavior in response to the behavior of an FCW system. In addition, the study views the example FCW systems in a static way, when in the real-world, these systems are often subject to software updates within a vehicle and are subjected to algorithm and sensor updates between vehicles (for example, moving from radar to lidar or camera-based systems). Thus, it is not known how future implementations of FCW systems may operate across contexts.
Overall, the use of video for the annotation of FCW severity in naturalistic driving shows promise, especially when paired with kinematic data for some level of validation. This can be utilized by researchers who do not have access to CAN radar, lidar, or other diagnostic information about FCW system performance, or who have not instrumented test vehicles with other sensors. Additionally, it remains unknown what the relationship between radar-computed metrics, such as time-to-collision (TTC), and subjectively coded severity is, whether or not there is strong linear correspondence, and whether there are incidents with similar TTC that are subjectively interpreted as having different levels of severity, and may have different deceleration profiles. This could be due to contextual factors, such as the behavior of other vehicles, or previous decelerations by the driver; understanding what elements, if any, in addition to TTC are utilized by subjective coders to make severity ratings can be investigated in studies where objective and subjective data can be co-examined. While the combining of subjective assessments with objective multi-sensor time-series data would provide better accuracy and insight, front-facing cameras with some way to identify FCW issuances (such as instrument cluster video) offer investigators a tool for assessing the severity of alerts drivers are receiving in naturalistic studies.
5. Conclusions
Across thousands of FCWs issued, only nine represented alerts to hazards that video analysts considered “imminent,” whereas nearly 40 represented alerts that video analysts considered pure nuisance alerts with no readily identifiable cause. On highways, all the alerts to imminent hazards occurred at or above 36 MPH, whereas 75% of the alerts to non-imminent hazards occurred at speeds lower. Alerts to imminent hazards occurred in high traffic density, and always in response to a slowing or stopped lead vehicle. Barriers, weather, and road grade were unrelated to likelihood of alerts to imminent hazards, while curve presence, lack of roadway division, and low traffic density were associated with nuisance alert likelihood. Overall, it appears that, while FCW alerts are frequent, alerts to imminent hazards are rare, but there are conditions that are highly associated with a much greater likelihood of alerts to imminent hazards, and a much lower likelihood of nuisance alerts. The overall high probability of nuisance alerts and alerts to non-imminent hazards potentially reduce the desirability of FCW systems and the efficacy of FCW systems at alerting drivers to real hazards, as suggested by Parasuraman et al. [16]; while studies have shown safety benefits of FCW systems [12,13], this may be a limiting factor for improving efficacy and acceptance. Future work can explore the use of driving and environmental context in reducing the numbers of unneeded and false alerts while still improving the proportion of valid and safety-positive alerts that will have value for drivers.
Author Contributions
Conceptualization, S.S., P.G., L.A., B.M. and B.R.; methodology, S.S., P.G. and L.A.; formal analysis, S.S. and P.G.; resources, B.R.; validation, L.A.; writing—original draft preparation, S.S.; writing—review and editing, S.S., P.G., L.A., B.M. and B.R.; visualization, S.S. All authors have read and agreed to the published version of the manuscript.
Funding
This work was supported by the Massachusetts Institute of Technology Advanced Vehicle Technology (AVT) Consortium.
Institutional Review Board Statement
The study was conducted according to the guidelines of the of MIT’s Committee on the Use of Humans as Experimental Subjects (COUHES) (protocol # R005), approved on 2016-03-02.
Informed Consent Statement
Informed consent was obtained from all subjects involved in the study. Written informed consent has been obtained from the participants whose images appear in this paper.
Data Availability Statement
Not applicable.
Acknowledgments
Data are from work supported by the Advanced Vehicle Technology (AVT) Consortium. The views and conclusions expressed are those of the authors and have not been sponsored, approved, or endorsed by the Consortium.
Conflicts of Interest
The authors declare no conflict of interest. The funders had no role in the design of the study; in the collection, analyses, or interpretation of data; in the writing of the manuscript, or in the decision to publish the results.
References
- Lee, S.E.; Llaneras, E.; Klauer, S.; Sudweeks, J. Analyses of Rear-End Crashes and Near-Crashes in the 100-Car Naturalistic Driving Study to Support Rear-Signaling Countermeasure Development (DOT HS 810 846); U.S. Department of Transportation: Washington, DC, USA, 2007.
- Hubele, N.; Kennedy, K. Forward collision warning system impact. Traffic Inj. Prev. 2018, 19, S78–S83. [Google Scholar] [CrossRef] [PubMed]
- American Automobile Association. Advanced driver assistance technology names: AAA’s recommendation for common naming of advanced safety systems. AAA News Room 2019, 25, 1–21. [Google Scholar]
- Kiefer, R.J.; LeBlanc, D.; Palmer, M.D.; Salinger, J.; Deering, R.K.; Shulman, M. Development and Validation of Functional Definitions and Evaluation Procedures for Collision Warning/Avoidance Systems (DOT HS 808 964); U.S. Department of Transportation: Washington, DC, USA, 1999.
- Forkenbrock, G.; Heitz, M.; Hoover, R.L.; O’Harra, B.; Vasko, S.; Smith, L. A Test Track Protocol for Assessing forward Collision Warning Driver-Vehicle Interface Effectiveness (DOT HS 811 501); U.S. Department of Transportation: Washington, DC, USA, 2011.
- Najm, W.; Stearns, M.; Howarth, H.; Koopmann, J.; Hitz, J.S. Evaluation of an Automotive Rear-End Collision Avoidance System (JPO 06 055); U.S. Department of Transportation: Washington, DC, USA, 2006.
- Benmimoun, M.; Pütz, A.; Zlocki, A.; Eckstein, L. eurofot: Field operational test and impact assessment of advanced driver assistance systems: Final results. In Proceedings of the FISITA 2012 World Automotive Congress, Beijing, China, 27–30 November 2012; Springer: Berlin/Heidelberg, Germany, 2013; pp. 537–547. [Google Scholar]
- Sayer, J.; LeBlanc, D.; Bogard, S.; Funkhouser, D.; Bao, S.; Buonarosa, M.L.; Blankespoor, A. Integrated Vehicle-Based Safety Systems Field Operational Test: Final Program Report (DOT HS 811 482); U.S. Joint Program Office for Intelligent Transportation Systems: Washington, DC, USA, 2011.
- Dingus, T.A.; McGehee, D.V.; Manakkal, N.; Jahns, S.K.; Carney, C.; Hankey, J.M. Human factors field evaluation of automotive headway maintenance/collision warning devices. Hum. Factors 1997, 39, 216–229. [Google Scholar] [CrossRef] [PubMed]
- Fisher, D.L.; Nodine, E.; Lam, A.; Jerome, C.; Monk, C.; Najm, W. Effects on drivers’ behavior of forward collision warning system alerts. Proc. Hum. Factors Ergon. Soc. Annu. Meet. 2016, 60, 1656–1660. [Google Scholar] [CrossRef]
- Highway Loss Data Institute. Mercedes-Benz Collision Avoidance Features: Initial Results. Highw. Loss Data Inst. Bull. 2012, 29, 1–22. [Google Scholar]
- Cicchino, J.B. Effectiveness of forward collision warning systems with and without autonomous emergency braking in reducing police-reported crash rates. Insur. Inst. Highw. Saf. 2016, 1, 1–22. [Google Scholar]
- Cicchino, J.B. Effectiveness of forward collision warning and autonomous emergency braking systems in reducing front-to-rear crash rates. Accid. Anal. Prev. 2017, 99, 142–152. [Google Scholar] [CrossRef] [PubMed]
- Li, G.; Li, S.E.; Cheng, B. Field operational test of advanced driver assistance systems in typical Chinese road conditions: The influence of driver gender, age and aggression. Int. J. Automot. Technol. 2015, 16, 739–750. [Google Scholar] [CrossRef]
- Consumer Reports Guide to Forward Collision Warning. 2019. Available online: https://www.consumerreports.org/car-safety/forward-collision-warning-guide/ (accessed on 16 November 2021).
- Parasuraman, R.; Hancock, P.A.; Olofinboba, O. Alarm effectiveness in driver-centred collision-warning systems. Ergonomics 1997, 40, 390–399. [Google Scholar] [CrossRef] [PubMed]
- Fridman, L.; Brown, D.E.; Glazer, M.; Angell, W.; Dodd, S.; Jenik, B.; Terwilliger, J.; Patsekin, A.; Kindelsberger, J.; Ding, L.; et al. MIT Advanced Vehicle Technology Study: Large-Scale Naturalistic Driving Study of Driver Behavior and Interaction with Automation. IEEE Access 2019, 7, 102021–102038. [Google Scholar] [CrossRef]
- Simonyan, K.; Zisserman, A. Very deep convolutional networks for large-scale image recognition. In Proceedings of the 3rd International Conference on Learning Representations, ICLR 2015—Conference Track Proceedings, San Diego, CA, USA, 7–9 May 2015; pp. 1–14. [Google Scholar]
- Bates, D.; Mächler, M.; Bolker, B.; Walker, S. Fitting linear mixed-effects models using lme4. J. Stat. Softw. 2015, 67, 1–48. [Google Scholar] [CrossRef]
Figure 1.
An example frame of quad-split video used by analysts to determine FCW severity and contextual attributes. The red square indicated the onset of the issuance of the FCW to the analysts.
Figure 1.
An example frame of quad-split video used by analysts to determine FCW severity and contextual attributes. The red square indicated the onset of the issuance of the FCW to the analysts.

Figure 2.
Average acceleration by rated severity during FCW epochs. The dashed vertical line indicates onset of FCW issuance. The dashed horizontal line indicates 0 average acceleration.
Figure 2.
Average acceleration by rated severity during FCW epochs. The dashed vertical line indicates onset of FCW issuance. The dashed horizontal line indicates 0 average acceleration.

Figure 3.
Probability density curves for pre-FCW vehicle speed by FCW severity for highway driving. Dashed vertical lines indicate individual imminent alert speeds.
Figure 3.
Probability density curves for pre-FCW vehicle speed by FCW severity for highway driving. Dashed vertical lines indicate individual imminent alert speeds.

Figure 4.
Probability density curves for pre-FCW vehicle speed by FCW severity for non-highway driving. Dashed vertical lines indicate individual imminent alert speeds.
Figure 4.
Probability density curves for pre-FCW vehicle speed by FCW severity for non-highway driving. Dashed vertical lines indicate individual imminent alert speeds.


Table 1.
Severity ratings and descriptions for FCWs.
| Severity Rating | Description |
|---|---|
| Nuisance | While an FCW was actually issued to the driver, the cause of this did not appear to be any relevant vehicle in the roadway, in the judgment of the analyst. (Note that this differs from definitions of “nuisance alert” in which whether the driver appears to have noticed the potential hazard is the key criteria). |
| Crash unlikely | When the FCW was issued, a crash with another vehicle appeared unlikely in the judgment of the analyst. |
| Crash possible but not imminent | When the FCW was issued, a crash with another vehicle appeared possible in the judgment of the analyst but the time scale of the possible collision was such that a rapid driver response was not required. |
| Crash possible and imminent | When the FCW was issued, a crash with another vehicle appeared possible in the judgment of the analyst and the time scale of the possible collision was such that a rapid driver response was required. |
Table 2.
FCW counts and probabilities by vehicle and severity rating.
| Alert Severity Rating | Range Rover Evoque | Volvo S90 | ||
|---|---|---|---|---|
| Count | P | Count | P | |
| Nuisance alert | 15 | 0.008 | 23 | 0.095 |
| Crash unlikely | 1696 | 0.95 | 139 | 0.57 |
| Crash possible but not imminent | 75 | 0.042 | 76 | 0.31 |
| Crash possible and imminent | 4 | 0.002 | 5 | 0.021 |
| Total | 1790 | 1.0 | 243 | 1.0 |
Table 3.
Imminent and nuisance alert probabilities and odds ratios. Probabilities (P) are the probability of each combination of alert severity and alert context occurring across all alerts. Each OR was calculated from regression slopes in independent univariate mixed-effects logistic regressions [19], with driver as a random factor, in which the likelihood of an imminent or nuisance alert for each level of context provided was compared to all other levels in that specific context (i.e., “Low density traffic” was contrasted with all traffic that was not annotated as low density). ORs could not be computed for conditions that did not occur (e.g., imminent alerts with no lead vehicle). Lower 2.5% limits (LL) and upper 97.5% limits (UL) for each OR estimate are also provided. ORs significantly greater than 1 indicate this level of this factor was associated with a greater likelihood of this type of alert, and the opposite effect was true for ORs significantly less than 1.
| Attribute | Imminent | Nuisance | ||||||
|---|---|---|---|---|---|---|---|---|
| P | OR | LL | UL | P | OR | LL | UL | |
| Highway | 0.0078 | 2.67 | 0.66 | 11.4 | 0.014 | 0.017 | 0.0074 | 0.033 |
| Local | 0.0024 | 0.38 | 0.019 | 2.37 | 0.041 | 3.6 | 1.6 | 7 |
| No lead vehicle | 0 | N/A | N/A | N/A | 0.17 | 82.2 | 35.5 | 197 |
| Lead vehicle Accel. | 0 | N/A | N/A | N/A | 0.047 | 10.3 | 3 | 32.9 |
| Low traffic density | 0 | N/A | N/A | N/A | 0.065 | 7.63 | 3.73 | 15.9 |
| High traffic density | 0.0067 | 7.22 | 1.21 | 10.3 | 0.0086 | 0.27 | 0.12 | 0.58 |
| Rain or snow | 0 | N/A | N/A | N/A | 0.021 | 1.1 | 0.35 | 2.84 |
| No barrier present | 0.0024 | 0.27 | 0.05 | 1.1 | 0.021 | 1.43 | 0.71 | 3.04 |
| Not divided | 0.0022 | 0.25 | 0.03 | 1.13 | 0.03 | 2.91 | 1.43 | 6.3 |
| Geometry (grade) | 0.011 | 2.2 | 0.11 | 13.8 | 0.021 | 1 | 0.16 | 3.56 |
| Geometry (curve) | 0.0083 | 1.83 | 0.26 | 7.89 | 0.058 | 3.93 | 1.89 | 7.89 |
Publisher’s Note: MDPI stays neutral with regard to jurisdictional claims in published maps and institutional affiliations. |
© 2022 by the authors. Licensee MDPI, Basel, Switzerland. This article is an open access article distributed under the terms and conditions of the Creative Commons Attribution (CC BY) license (https://creativecommons.org/licenses/by/4.0/).
Share and Cite
MDPI and ACS Style
Seaman, S.; Gershon, P.; Angell, L.; Mehler, B.; Reimer, B. Evaluating the Associations between Forward Collision Warning Severity and Driving Context. Safety 2022, 8, 5. https://0-doi-org.brum.beds.ac.uk/10.3390/safety8010005
AMA Style
Seaman S, Gershon P, Angell L, Mehler B, Reimer B. Evaluating the Associations between Forward Collision Warning Severity and Driving Context. Safety. 2022; 8(1):5. https://0-doi-org.brum.beds.ac.uk/10.3390/safety8010005
Chicago/Turabian StyleSeaman, Sean, Pnina Gershon, Linda Angell, Bruce Mehler, and Bryan Reimer. 2022. "Evaluating the Associations between Forward Collision Warning Severity and Driving Context" Safety 8, no. 1: 5. https://0-doi-org.brum.beds.ac.uk/10.3390/safety8010005
Note that from the first issue of 2016, this journal uses article numbers instead of page numbers. See further details here.