
Long COVID in Young Patients: Impact on Lung Volume Evaluated Using Multidetector CT

Abstract
:1. Introduction
2. Material and Methods
2.1. Setting and Participants
2.2. CT Image Acquisition Technique
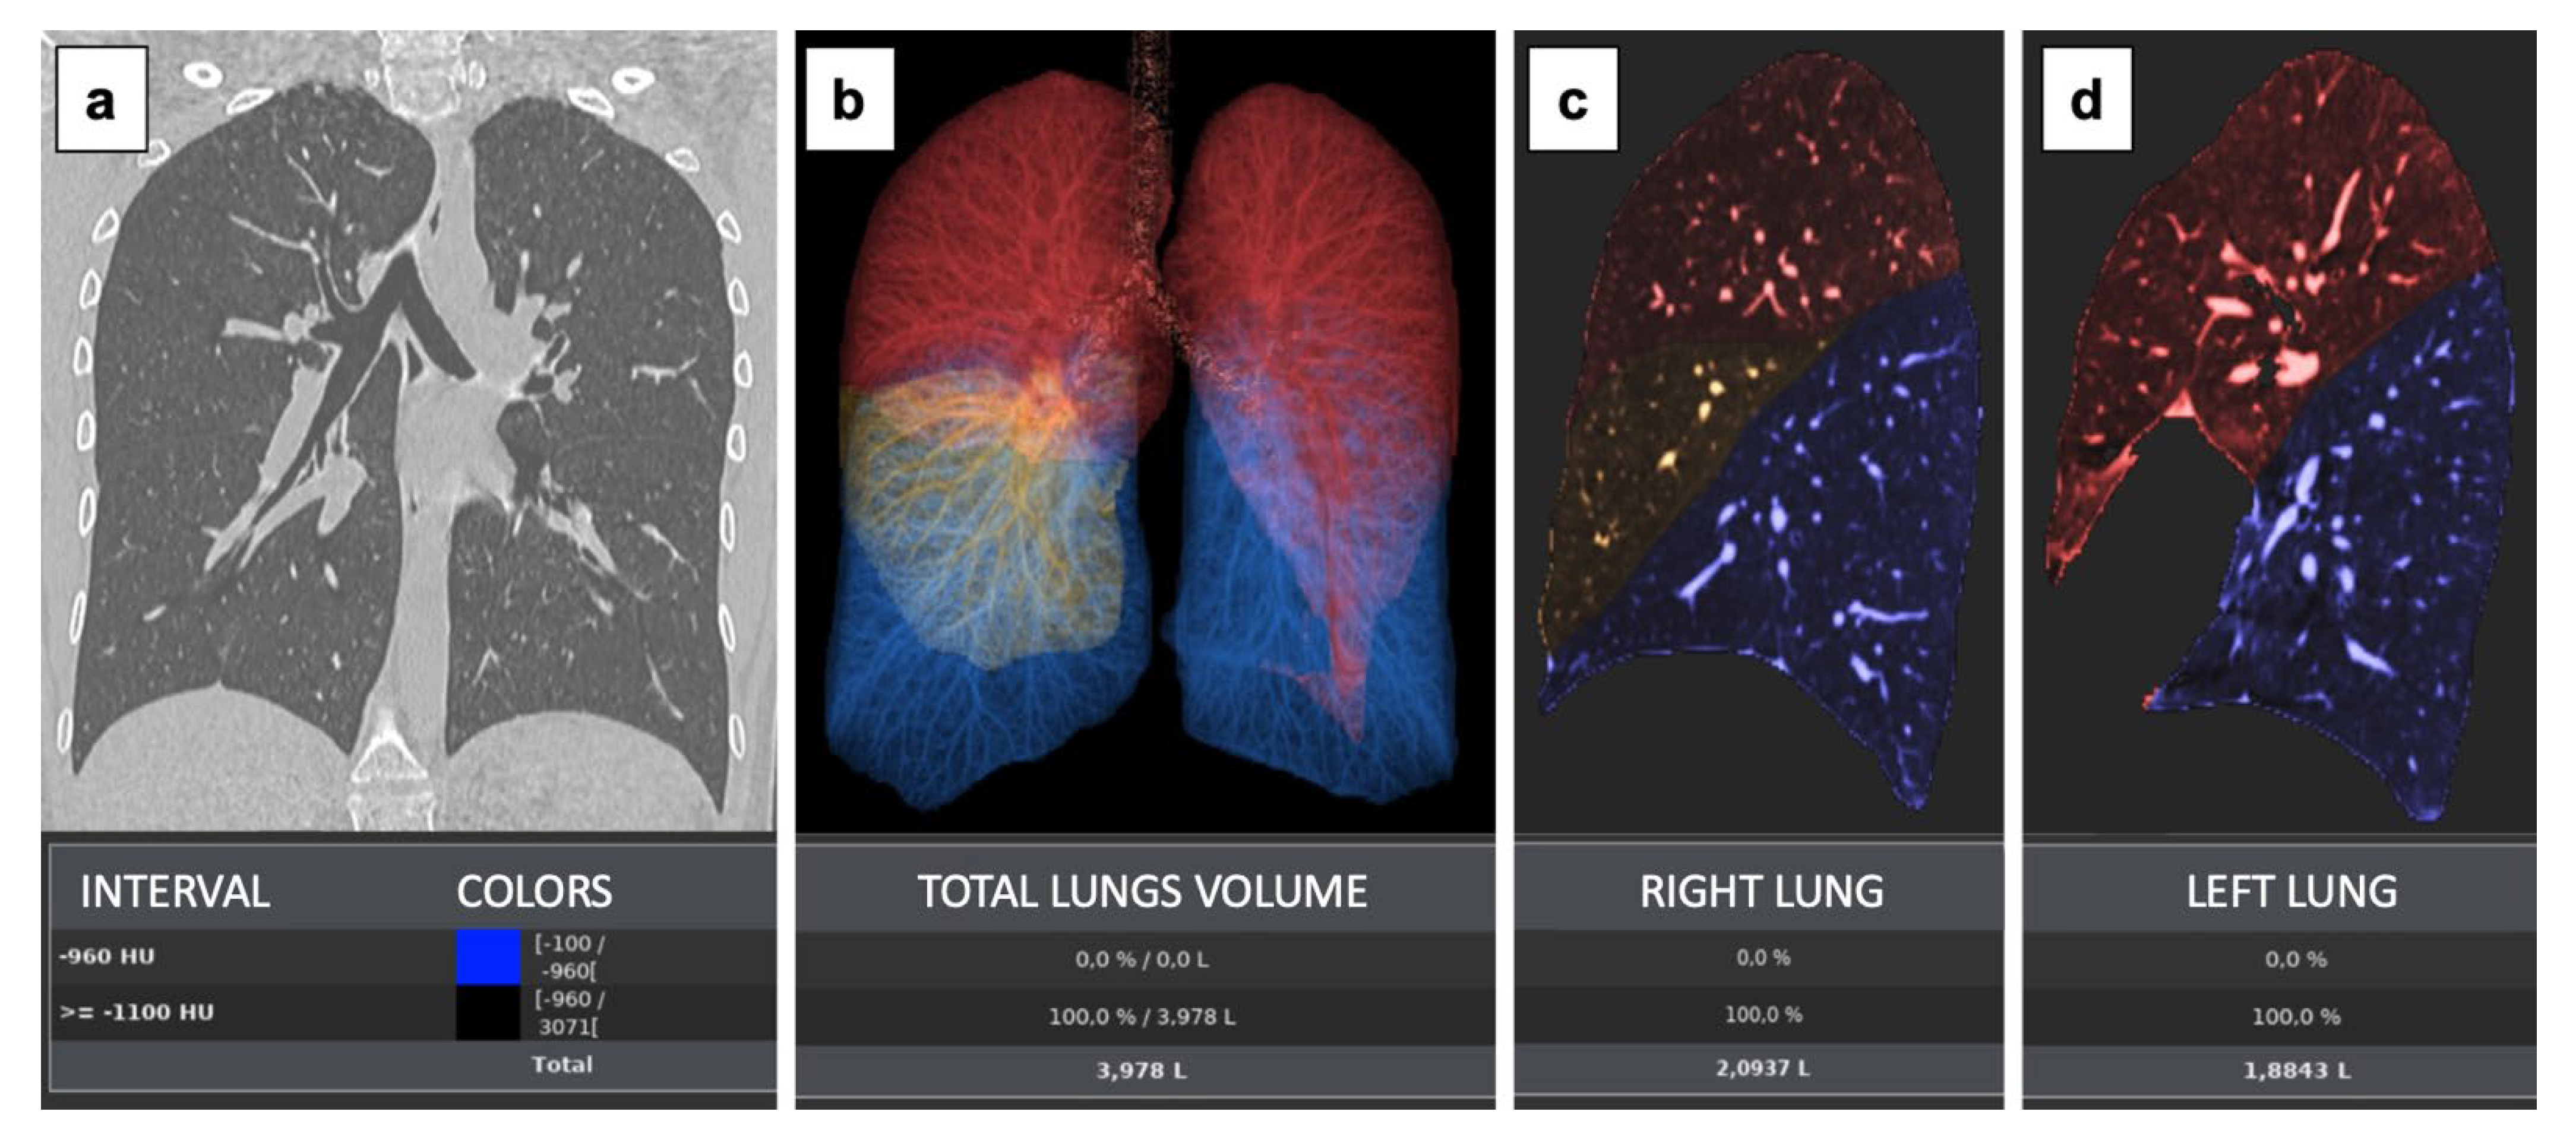
2.3. Image Analysis and CT Lung Volume Measurements
2.4. Statistical Analysis
3. Results
3.1. Participants
3.2. Chest CT Lung Volume Measurements
4. Discussion
Author Contributions
Funding
Institutional Review Board Statement
Informed Consent Statement
Data Availability Statement
Conflicts of Interest
References
- Yong, S.J. Long COVID or post-COVID-19 syndrome: Putative pathophysiology, risk factors, and treatments. Infect. Dis. 2021, 53, 737–754. [Google Scholar] [CrossRef] [PubMed]
- Stephenson, T.; Shafran, R.; De Stavola, B.; Rojas, N.; Aiano, F.; Amin-Chowdhury, Z.; McOwat, K.; Simmons, R.; Zavala, M.; CLoCk Consortium; et al. Long COVID and the mental and physical health of children and young people: National matched cohort study protocol (the CLoCk study). BMJ Open 2021, 11, 52838. [Google Scholar] [CrossRef] [PubMed]
- Huang, Y.; Tan, C.; Wu, J.; Chen, M.; Wang, Z.; Luo, L.; Zhou, X.; Liu, X.; Huang, X.; Yuan, S.; et al. Impact of coronavirus disease 2019 on pulmonary function in early convalescence phase. Respir. Res. 2020, 21, 163. [Google Scholar] [CrossRef] [PubMed]
- Bellini, D.; Lichtner, M.; Vicini, S.; Rengo, M.; Ambrogi, C.; Carbone, I. Spontaneous pneumomediastinum as the only CT finding in an asymptomatic adolescent positive for COVID-19. BJR Case Rep. 2020, 6, 20200051. [Google Scholar] [CrossRef]
- Vicini, S.; Bellini, D.; Iannarelli, A.; Rengo, M.; Pelle, G.; Ruggiero, S.; Fusco, M.; Ambrogi, C.; Carbone, I. Pneumonia Frequency and Severity in Patients With Symptomatic COVID-19: Impact of mRNA and Adenovirus Vector Vaccines. Am. J. Roentgenol. 2022, 219, 752–761. [Google Scholar] [CrossRef]
- Vicini, S.; Panvini, N.; Bellini, D.; Rengo, M.; Ciotola, M.; De Vivo, M.; Gambaretto, C.; Caldon, V.; Panno, S.; Del Borgo, C.; et al. Radiographers COVID-19 pneumonia: Diagnostic performance using, CO-RADS. Radiography 2021, 27, 1078–1084. [Google Scholar] [CrossRef]
- Bellini, D.; Panvini, N.; Rengo, M.; Vicini, S.; Lichtner, M.; Tieghi, T.; Ippoliti, D.; Giulio, F.; Orlando, E.; Iozzino, M.; et al. Diagnostic accuracy and interobserver variability of CO-RADS in patients with suspected coronavirus disease-2019: A multireader validation study. Eur. Radiol. 2020, 31, 1932–1940. [Google Scholar] [CrossRef]
- Shi, H.; Han, X.; Jiang, N.; Cao, Y.; Alwalid, O.; Gu, J.; Fan, Y.; Zheng, C. Radiological findings from 81 patients with COVID-19 pneumonia in Wuhan, China: A descriptive study. Lancet Infect. Dis. 2020, 20, 425–434. [Google Scholar] [CrossRef]
- Pan, F.; Ye, T.; Sun, P.; Gui, S.; Liang, B.; Li, L.; Zheng, D.; Wang, J.; Hesketh, R.L.; Yang, L.; et al. Time Course of Lung Changes at Chest CT during Recovery from Coronavirus Disease 2019 (COVID-19). Radiology 2020, 295, 715–721. [Google Scholar] [CrossRef] [Green Version]
- Xu, Y.-H.; Dong, J.-H.; An, W.-M.; Lv, X.-Y.; Yin, X.-P.; Zhang, J.-Z.; Dong, L.; Ma, X.; Zhang, H.-J.; Gao, B.-L. Clinical and computed tomographic imaging features of novel coronavirus pneumonia caused by SARS-CoV-2. J. Infect. 2020, 80, 394–400. [Google Scholar] [CrossRef] [PubMed] [Green Version]
- Han, X.; Cao, Y.; Jiang, N.; Chen, Y.; Alwalid, O.; Zhang, X.; Gu, J.; Dai, M.; Liu, J.; Zhu, W.; et al. Novel Coronavirus Disease 2019 (COVID-19) Pneumonia Progression Course in 17 Discharged Patients: Comparison of Clinical and Thin-Section Computed Tomography Features During Recovery. Clin. Infect. Dis. 2020, 71, 723–731. [Google Scholar] [CrossRef] [PubMed] [Green Version]
- Baratella, E.; Ruaro, B.; Marrocchio, C.; Poillucci, G.; Pigato, C.; Bozzato, A.M.; Salton, F.; Confalonieri, P.; Crimi, F.; Wade, B.; et al. Diagnostic Accuracy of Chest Digital Tomosynthesis in Patients Recovering after COVID-19 Pneumonia. Tomography 2022, 8, 1221–1227. [Google Scholar] [CrossRef]
- Spogis, J.; Fusco, S.; Hagen, F.; Kaufmann, S.; Malek, N.; Hoffmann, T. Repeated Lung Ultrasound versus Chest X-ray-Which One Predicts Better Clinical Outcome in COVID-19? Tomography 2023, 9, 706–716. [Google Scholar] [CrossRef]
- Wang, Y.; Dong, C.; Hu, Y.; Li, C.; Ren, Q.; Zhang, X.; Shi, H.; Zhou, M. Temporal Changes of CT Findings in 90 Patients with COVID-19 Pneumonia: A Longitudinal Study. Radiology 2020, 296, E55–E64. [Google Scholar] [CrossRef] [PubMed] [Green Version]
- Liu, D.; Zhang, W.; Pan, F.; Li, L.; Yang, L.; Zheng, D.; Wang, J.; Liang, B. The pulmonary sequalae in discharged patients with COVID-19: A short-term observational study. Respir. Res. 2020, 21, 125. [Google Scholar] [CrossRef] [PubMed]
- Zhang, P.; Li, J.; Liu, H.; Han, N.; Ju, J.; Kou, Y.; Chen, L.; Jiang, M.; Pan, F.; Zheng, Y.; et al. Long-term bone and lung consequences associated with hospital-acquired severe acute respiratory syndrome: A 15-year follow-up from a prospective cohort study. Bone Res. 2020, 8, 8. [Google Scholar] [CrossRef] [Green Version]
- Antonio, G.E.; Wong, K.T.; Hui, D.S.C.; Wu, A.; Lee, N.; Yuen, E.H.Y.; Leung, C.B.; Rainer, T.H.; Cameron, P.; Chung, S.S.C.; et al. Thin-Section CT in Patients with Severe Acute Respiratory Syndrome Following Hospital Discharge: Preliminary Experience. Radiology 2003, 228, 810–815. [Google Scholar] [CrossRef] [PubMed]
- Das, K.M.; Lee, E.Y.; Singh, R.; Enani, M.A.; Al Dossari, K.; Van Gorkom, K.; Larsson, S.G.; Langer, R.D. Follow-up chest radiographic findings in patients with MERS-CoV after recovery. Indian J. Radiol. Imaging 2017, 27, 342–349. [Google Scholar] [CrossRef]
- Vandenbroucke, J.P.; von Elm, E.; Altman, D.G.; Gøtzsche, P.C.; Mulrow, C.D.; Pocock, S.J.; Poole, C.; Schlesselman, J.J.; Egger, M.; Strobe Initiative. Strengthening the Reporting of Observational Studies in Epidemiology (STROBE): Explanation and Elaboration. PLoS Med. 2007, 4, e297. [Google Scholar] [CrossRef] [Green Version]
- Jones, R.L.; Nzekwu, M.M. The effects of body mass index on lung volumes. Chest 2006, 130, 827–833. [Google Scholar] [CrossRef]
- Kougias, M.; Vardavas, C.; Anagnostopoulos, N.; Matsunaga, Y.; Tzwrtzi, A.; Lymberi, M.; Connolly, G.N.; Behrakis, P.K. The acute effect of cigarette smoking on the respiratory function and FENO production among young smokers. Exp. Lung Res. 2013, 39, 359–364. [Google Scholar] [CrossRef] [PubMed]
- Barois, A. Les problèmes respiratoires des scolioses graves [Respiratory problems in severe scoliosis]. Bull. Acad. Natl. Med. 1999, 183, 721–730. (In French) [Google Scholar] [PubMed]
- Han, X.; Fan, Y.; Alwalid, O.; Li, N.; Jia, X.; Yuan, M.; Li, Y.; Cao, Y.; Gu, J.; Wu, H.; et al. Six-month Follow-up Chest CT Findings after Severe COVID-19 Pneumonia. Radiology 2021, 299, E177–E186. [Google Scholar] [CrossRef]
- Townsend, L.; Dowds, J.; O’brien, K.; Sheill, G.; Dyer, A.H.; O’kelly, B.; Hynes, J.P.; Mooney, A.; Dunne, J.; Ni Cheallaigh, C.; et al. Persistent Poor Health after COVID-19 Is Not Associated with Respiratory Complications or Initial Disease Severity. Ann. Am. Thorac. Soc. 2021, 18, 997–1003. [Google Scholar] [CrossRef] [PubMed]
- Mohammadi, A.; Balan, I.; Yadav, S.; Matos, W.F.; Kharawala, A.; Gaddam, M.; Sarabia, N.; Koneru, S.C.; Suddapalli, S.K.; Marzban, S. Post-COVID-19 pulmonary fibrosis. Cureus 2022, 14, e22770. [Google Scholar] [CrossRef]
- De Paula, C.B.V.; Nagashima, S.; Liberalesso, V.; Collete, M.; da Silva, F.P.G.; Oricil, A.G.G.; Barbosa, G.S.; da Silva, G.V.C.; Wiedmer, D.B.; Dezidério, F.d.S.; et al. COVID-19: Immunohistochemical Analysis of TGF-beta signaling pathways in pulmonary fibrosis. Int. J. Mol. Sci. 2021, 23, 168. [Google Scholar] [CrossRef]
- Lanza, E.; Muglia, R.; Bolengo, I.; Santonocito, O.G.; Lisi, C.; Angelotti, G.; Morandini, P.; Savevski, V.; Politi, L.S.; Balzarini, L. Quantitative chest CT analysis in COVID-19 to predict the need for oxygenation support and intubation. Eur. Radiol. 2020, 30, 6770–6778. [Google Scholar] [CrossRef]
- Lanza, E.; Muglia, R.; Bolengo, I.; Santonocito, O.G.; Lisi, C.; Angelotti, G.; Morandini, P.; Savevski, V.; Politi, L.S.; Balzarini, L. Radiological Society of North America Expert Consensus Document on Reporting Chest CT Findings Related to COVID-19: En-dorsed by the Society of Thoracic Radiology, the American College of Radiology, and RSNA. Radiol. Cardiothorac. Imaging 2020, 2, e200152. [Google Scholar] [CrossRef] [Green Version]


| Characteristic | All Participants (n = 154) | Post-COVID (n = 77) | Non-COVID (n = 77) | p-Value |
|---|---|---|---|---|
| Age, years | 33 ± 5 (18–40) | 33 ± 6 (18–40) | 33 ± 5 (18–40) | 0.999 |
| Sex | ||||
| Male | 76 (49%) | 38 (49%) | 38 (49%) | 1.000 |
| Female | 78 (51%) | 39 (51%) | 39 (51%) | |
| Symptoms | ||||
| Cough | 66 (43%) | 28 (36%) | 38 (49%) | 0.262 |
| Dyspnea | 54 (35%) | 25 (32%) | 29 (38%) | |
| Chest pain | 38 (25%) | 18 (23%) | 20 (34%) | |
| Fatigue | 55 (36%) | 33 (43%) | 22 (29%) | |
| Factors affecting lung capacity | ||||
| Obesity | 17 (11%) | 8 (10%) | 9 (12%) | 0.952 |
| Thoracic malformations | 5 (3%) | 2 (3%) | 3 (4%) | |
| Smoking habit | 39 (25%) | 17 (22%) | 22 (29%) | |
| Lung Volumes | Post-COVID (n = 77) | Non-COVID (n = 77) | p-Value |
|---|---|---|---|
| Mean Right Lung Volume | 2.76 L (95% CI 2.16–3.36) | 3.00 L (95% CI 2.43–3.57) | 0.017 |
| Mean Left Lung Volume | 2.48 L (95% CI 1.94–3.02 | 2.72 L (95% CI 2.18–3.26) | 0.010 |
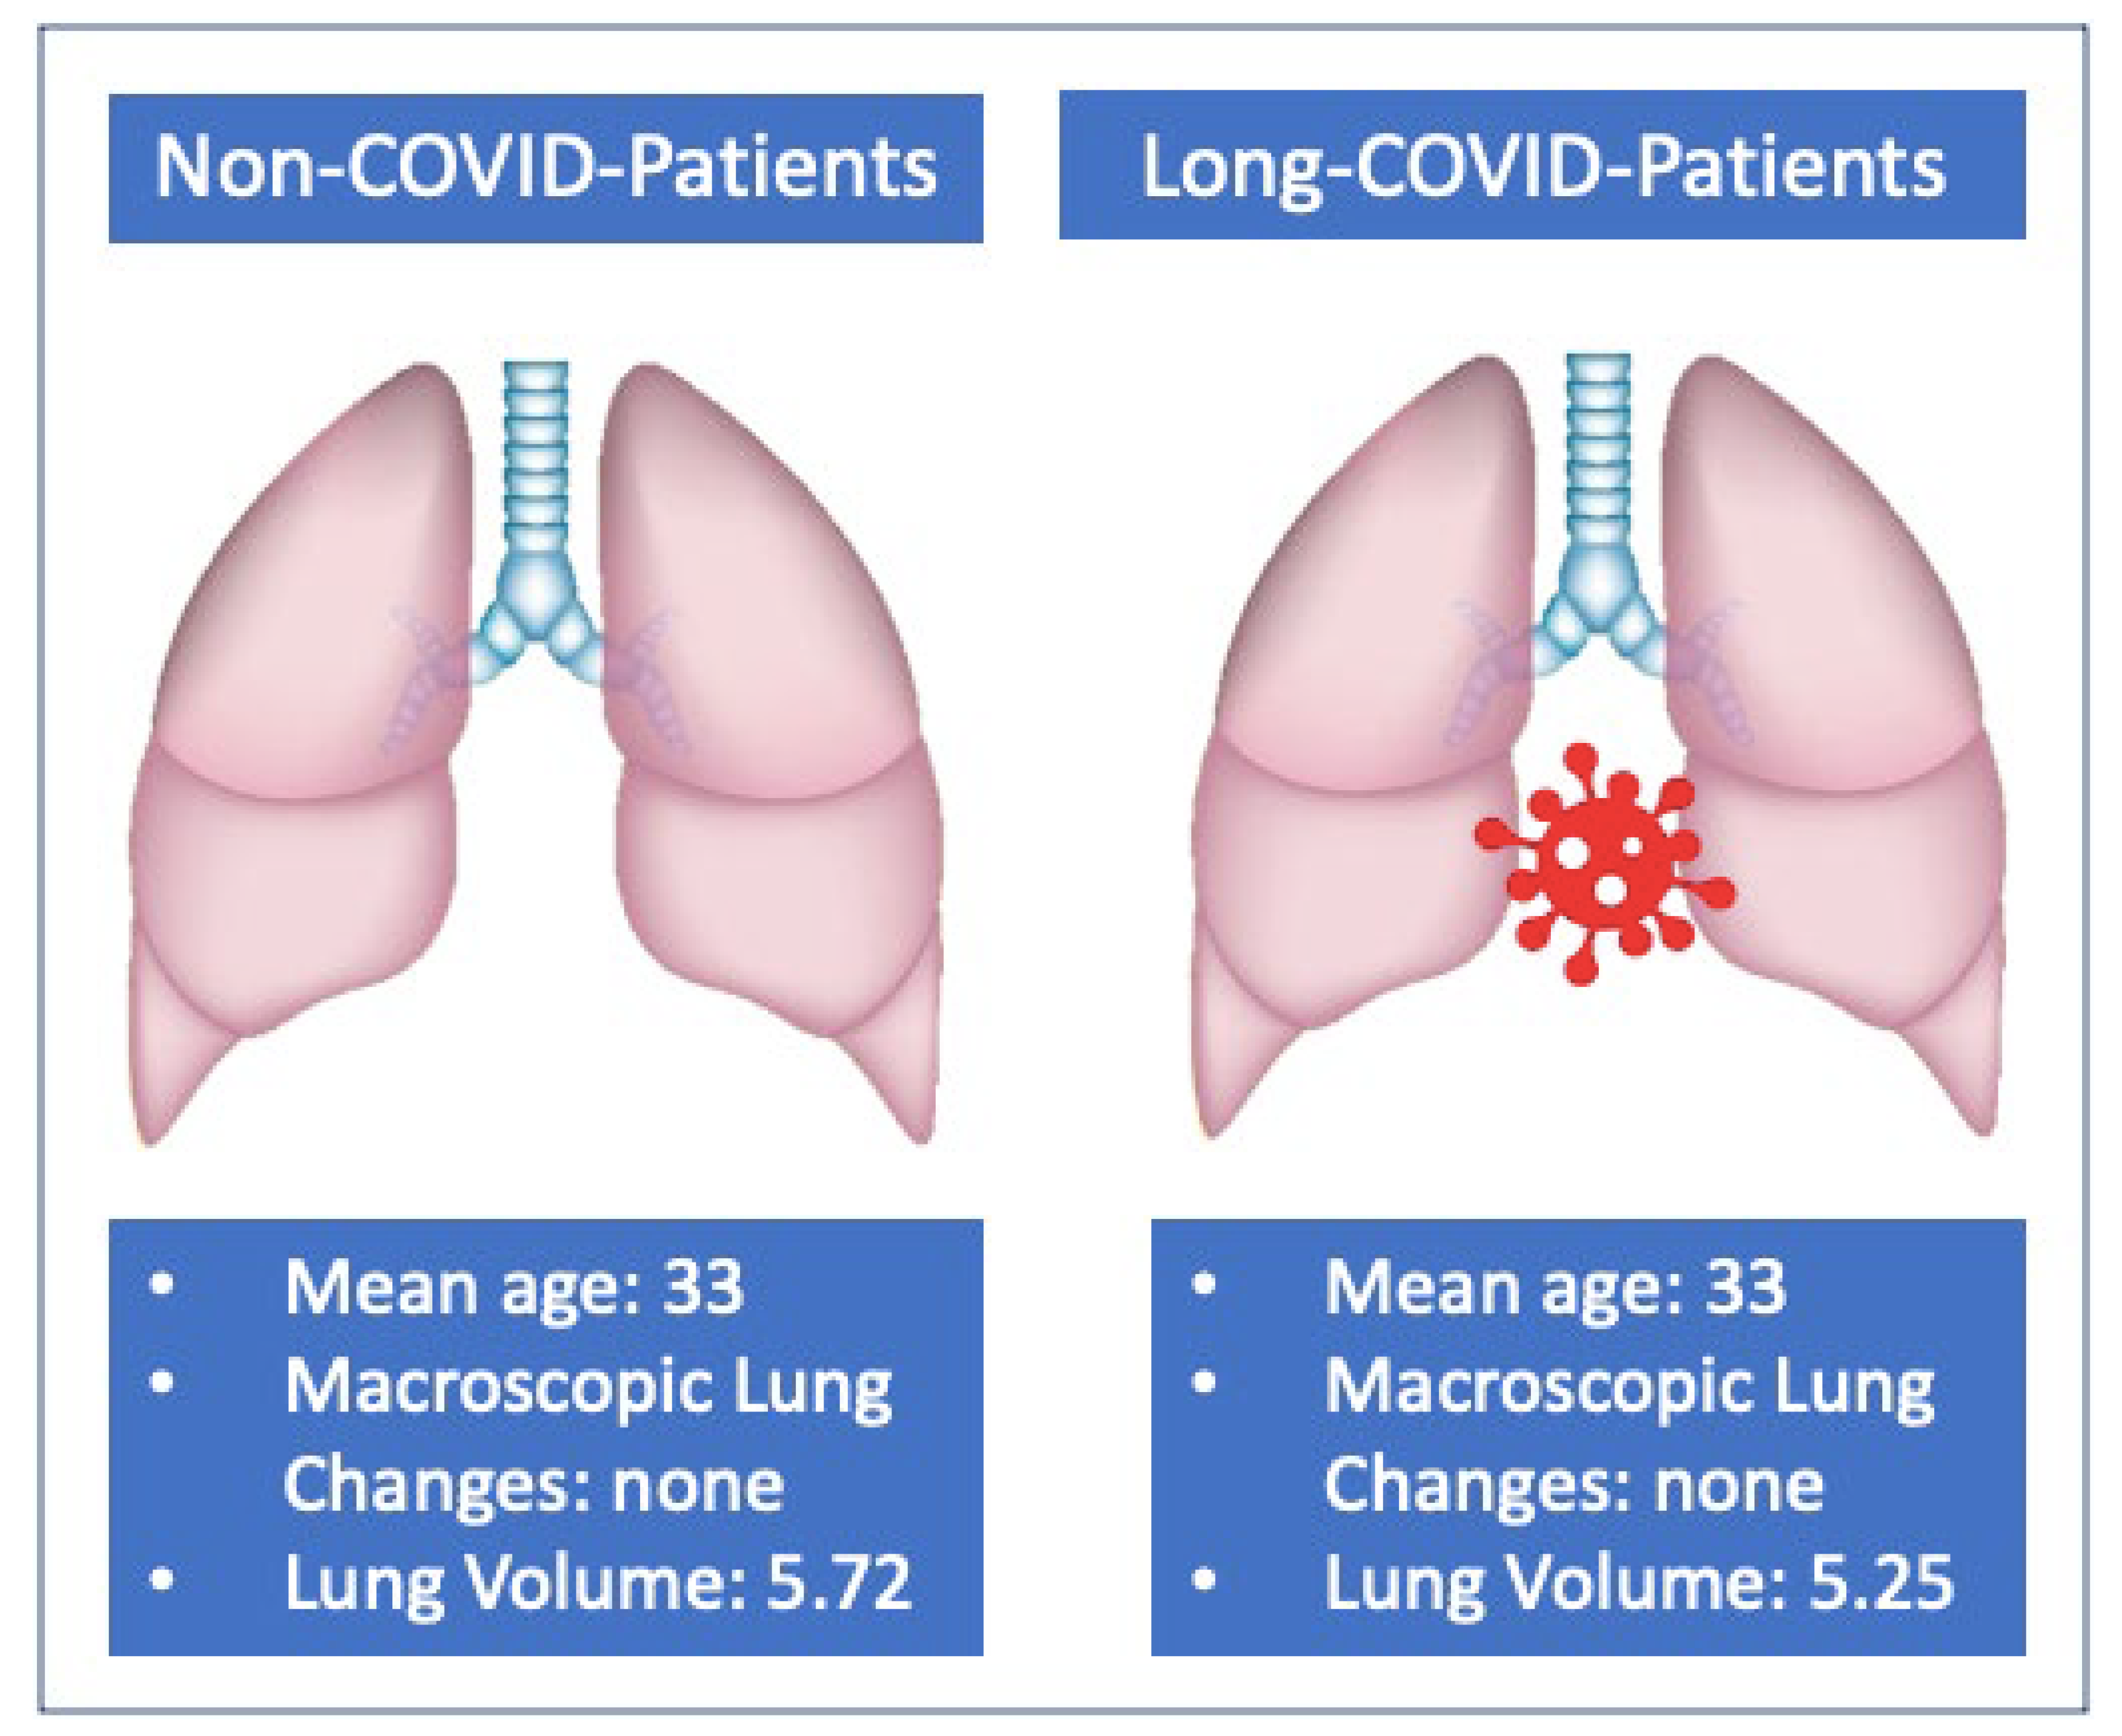
| Mean Total Lung Volume | 5.25 L (95% CI 4.13–6.37 | 5.72 L (95% CI 4.62–6.82) | 0.012 |
Disclaimer/Publisher’s Note: The statements, opinions and data contained in all publications are solely those of the individual author(s) and contributor(s) and not of MDPI and/or the editor(s). MDPI and/or the editor(s) disclaim responsibility for any injury to people or property resulting from any ideas, methods, instructions or products referred to in the content. |
© 2023 by the authors. Licensee MDPI, Basel, Switzerland. This article is an open access article distributed under the terms and conditions of the Creative Commons Attribution (CC BY) license (https://creativecommons.org/licenses/by/4.0/).
Share and Cite
Bellini, D.; Capodiferro, P.; Vicini, S.; Rengo, M.; Carbone, I. Long COVID in Young Patients: Impact on Lung Volume Evaluated Using Multidetector CT. Tomography 2023, 9, 1276-1285. https://0-doi-org.brum.beds.ac.uk/10.3390/tomography9040101
Bellini D, Capodiferro P, Vicini S, Rengo M, Carbone I. Long COVID in Young Patients: Impact on Lung Volume Evaluated Using Multidetector CT. Tomography. 2023; 9(4):1276-1285. https://0-doi-org.brum.beds.ac.uk/10.3390/tomography9040101
Chicago/Turabian StyleBellini, Davide, Paola Capodiferro, Simone Vicini, Marco Rengo, and Iacopo Carbone. 2023. "Long COVID in Young Patients: Impact on Lung Volume Evaluated Using Multidetector CT" Tomography 9, no. 4: 1276-1285. https://0-doi-org.brum.beds.ac.uk/10.3390/tomography9040101