Article

Assessment of Spinal Muscular Atrophy Carrier Status by Determining SMN1 Copy Number Using Dried Blood Spots

by
Yogik Onky Silvana Wijaya
1,
Jamiyan Purevsuren
2,
Nur Imma Fatimah Harahap
3,
Emma Tabe Eko Niba
1,
Yoshihiro Bouike
4,
Dian Kesumapramudya Nurputra
5,
Mawaddah Ar Rochmah
6,
Cempaka Thursina
6,
Sunartini Hapsara
5,
Seiji Yamaguchi
7,
Hisahide Nishio
1,8,* and
Masakazu Shinohara
1
1
Department of Community Medicine and Social Healthcare Science, Division of Epidemiology, Kobe University Graduate School of Medicine, 7-5-1 Kusunoki-cho, Chuo-ku, Kobe 650-0017, Japan
2
Medical Genetics Laboratory, National Center for Maternal and Child Health, Khuvisgalchdyn Street, Bayangol District, Ulaanbaatar 16060, Mongolia
3
Department of Clinical Pathology and Laboratory Medicine, Faculty of Medicine, Universitas Gadjah Mada, Radiopoetro Building 5th floor, Jl. Farmako, Sekip Utara, Yogyakarta 55281, Indonesia
4
Faculty of Nutrition, Kobe Gakuin University, 518 Arise, Ikawadani-cho, Nishi-ku, Kobe 651-2180, Japan
5
Department of Pediatrics, Faculty of Medicine, Universitas Gadjah Mada, Jl. Kesehatan No.1, Sekip, Yogyakarta 55281, Indonesia
6
Department of Neurology, Faculty of Medicine, Universitas Gadjah Mada, Jl. Kesehatan No.1, Sekip, Yogyakarta 55281, Indonesia
7
Department of Pediatrics, Shimane University School of Medicine, 89-1 Enya, Izumo, Shimane 693-8501, Japan
8
Faculty of Rehabilitation, Kobe Gakuin University, 518 Arise, Ikawadani-cho, Nishi-ku, Kobe 651-2180, Japan
*
Author to whom correspondence should be addressed.
Int. J. Neonatal Screen. 2020, 6(2), 43; https://0-doi-org.brum.beds.ac.uk/10.3390/ijns6020043
Submission received: 28 April 2020 / Revised: 23 May 2020 / Accepted: 27 May 2020 / Published: 29 May 2020

Abstract

:
Spinal muscular atrophy (SMA) is a common neuromuscular disease with autosomal recessive inheritance. The disease gene, SMN1, is homozygously deleted in 95% of SMA patients. Although SMA has been an incurable disease, treatment in infancy with newly developed drugs has dramatically improved the disease severity. Thus, there is a strong rationale for newborn and carrier screening for SMA, although implementing SMA carrier screening in the general population is controversial. We previously developed a simple, accurate newborn SMA screening system to detect homozygous SMN1 deletions using dried blood spots (DBS) on filter paper. Here, we modified our previous system to detect the heterozygous deletions of SMN1, which indicates SMA carrier status. The system involves a calibrator-normalized relative quantification method using quantitative nested PCR technology. Our system clearly separated the DBS samples with one SMN1 copy (carrier status with a heterozygous deletion of SMN1) from the DBS samples with two SMN1 copies (non-carrier status with no deletion of SMN1). We also analyzed DBS samples from SMA families, confirmed SMA in the affected children, and determined the carrier status of their parents based on the SMN1 copy number. In conclusion, our system will provide essential information for risk assessment and genetic counseling, at least for SMA families.

Graphical Abstract

1. Introduction

Spinal muscular atrophy (SMA) is an autosomal recessive and progressive neuromuscular disease characterized by muscle weakness and atrophy that results from the degeneration of motor neurons in the spinal cord [1]. The incidence of SMA is 1 in 6000 to 10,000 live births [1], and the carrier frequency is 1 in 40 to 60 in the general population [1]. Survival Motor Neuron 1 (SMN1) has been identified as the SMA-causing gene [2]. SMN1 is absent (or homozygously deleted) in ~95% of SMA patients and deleteriously mutated in some of the remaining patients [2,3]. Thus, a deletion test for SMN1 is the first-tier evaluation for SMA diagnosis.
SMA phenotypes are classified by onset age and achieved motor milestones. Patients with SMA type 1 develop symptoms in the first 6 months after birth, never achieve the motor milestone of sitting independently, and have a life expectancy of less than 2 years without respiratory support [4]. SMA type 1 constitutes the largest group of SMA patients, and it is the most frequent genetic cause of death in infants.
SMA is an incurable disease. However, Spinraza® (nusinersen, an antisense oligonucleotide-based SMN protein-enhancing therapy) and Zolgensma® (onasemnogene abeparvovec-xioi, adeno-associated virus vector-based SMN1-gene therapy) have been approved by regulatory agencies in multiple countries, including the U.S. and Japan, as treatment choices for SMA. According to their clinical trials, these drugs greatly improved the disease severity; more specifically, they facilitated motor milestone achievement and reduced the number of cases requiring respiratory support [5,6].
It should be noted that these drugs achieved a better clinical outcome for SMA patients when initiated in early infancy [5,6,7]. For an early diagnosis and the initiation of treatment, newborn screening or carrier screening may be useful, and they are feasible because the majority of the patients lack SMN1 [8,9]. SMA infants can be detected by having no copies of SMN1 and SMA carriers by having one copy.
Several pilot studies have been reported that describe newborn screening for SMA using dried blood spots (DBS) on filter paper [9,10,11,12,13]. Vill et al. stated, based on their experience of SMA newborn screening and presymptomatic treatment, that newborn screening improved the outcome for children with genetically proven SMA, and concluded that newborn screening for SMA should be introduced in all countries where therapy is available [14].
SMA carrier screening has been widely discussed. The American College of Medical Genetics issued a statement saying that “carrier testing should be offered to all couples” [8,9]. However, population carrier screening for SMA may not be cost-effective [15] and future parents may be unprepared to accept screening results [16]. For families with an SMA patient, especially for couples who desire to bear children in such families, carrier diagnosis is highly useful because carrier screening can inform genetic counseling and reproductive options for high-risk couples.
Early treatment in infancy with newly developed drugs has dramatically improved the disease severity; therefore, there is a strong rationale for newborn screening and carrier screening for SMA. In this study, we developed a new simple, accurate, and inexpensive system for determining the SMN1 copy number and SMA carrier status. This system is, in a sense, a modified version of our system to detect the homozygous deletion of SMN1 [13]. Our current system, which uses a dried blood spot (DBS) on filter paper, may provide critical information to SMA families all over the world.

2. Material and Methods

2.1. Objectives and Ethics

We have established a simple system using DBS for SMA newborn screening [13]. In this study, we aimed to establish another simple system using DBS to screen for SMA carrier status. Our primary objective was to develop a system to detect heterozygous SMN1 deletion using DBS from the parents of SMN1-deleted SMA patients. The second objective was to confirm the practicality of our system to detect homozygous and heterozygous SMN1 deletion using DBS on filter paper in resource-limited scenarios where molecular genetic analysis is not available. This study was approved by the institutional review boards at all participating hospitals, as well as the Ethics Committee of the Kobe University Graduate School of Medicine (reference 1089, approved on 5 October 2018), and was conducted in accordance with the World Medical Association Declaration of Helsinki.

2.1.1. DBS Samples for Validation of SMN1 Copy Number Analysis

As media for DBS, we used FTA (Flinders Technology Associates) Elute Cards® (GE Healthcare, Boston, MA, USA) and Guthrie cards (Toyo Roshi No. 545 filter paper, Toyo Roshi Kaisha, Tokyo, Japan). The FTA Elute Cards® were developed for long-term DNA preservation at room temperature, and Toyo Roshi No. 545 filter paper was used in neonatal screening.
For the validation of the system, we analyzed 98 FTA cards with DBS (44 SMA carriers with one SMN1 copy and 54 controls with two SMN1 copies) and 33 Guthrie cards with DBS (12 SMA carriers with one SMN1 copy and 21 controls with two SMN1 copies) from the sample library of the Division of Epidemiology, Kobe University Graduate School of Medicine.
The SMA carriers in the validation study had been shown to carry one copy of SMN1 using the method of Tran et al. and fresh blood [17]. Similarly, the validation study controls had been determined to carry two copies of SMN1 using fresh blood.

2.1.2. DBS Samples from Mongolian and Indonesian SMA Families

To detect SMN1 deletion, samples from Mongolian and Indonesian SMA patients and their parents were analyzed using the method of Shinohara et al. [13]. Patient 1 was a 21-month-old boy who showed delayed motor milestones and muscle weakness. He was clinically diagnosed as having SMA type 1. Three Guthrie cards with DBS from Patient 1 and his parents were used in this study. Patients 2 and 3 were 7-month-old twin boys who showed muscle weakness at three months old. Their brother, who died at two months old, had already been diagnosed as having SMA by a molecular genetic analysis. These siblings were clinically diagnosed as having SMA type 1. Two Guthrie cards with DBS from Patients 2 and 3 were used in this study. Patient 4 was a 2-year-old girl, who showed muscle weakness and delayed motor milestones. She was clinically diagnosed as having SMA type 2. Three Guthrie cards with DBS from Patient 4 and her parents were used in this study.

2.2. Detection of Homozygous SMN1 Deletion in DBS Samples

We performed SMN1 deletion tests with DBS on FTA cards and Guthrie cards using the previously described procedures [13]. Our procedure outline was: (1) a punched DBS circle was placed directly into conventional PCR reaction mixture, followed by the pre-amplification of the SMN1/SMN2 exon 7-targeted region with 40 cycles (to reach the plateau phase in the first round PCR). (2) The pre-amplification products were diluted 100-fold. (3) SMN1 exon 7 was specifically amplified from the diluted pre-amplified product by 20 cycles of real-time modified competitive oligonucleotide priming-PCR (real-time mCOP-PCR) [18] (to detect the presence or absence of SMN1 in the second round PCR).

2.3. Detection of Heterozygous SMN1 Deletion in DBS Samples
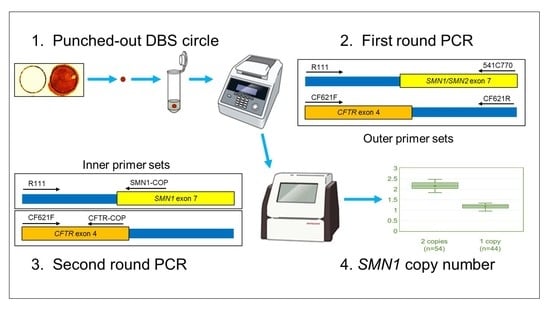
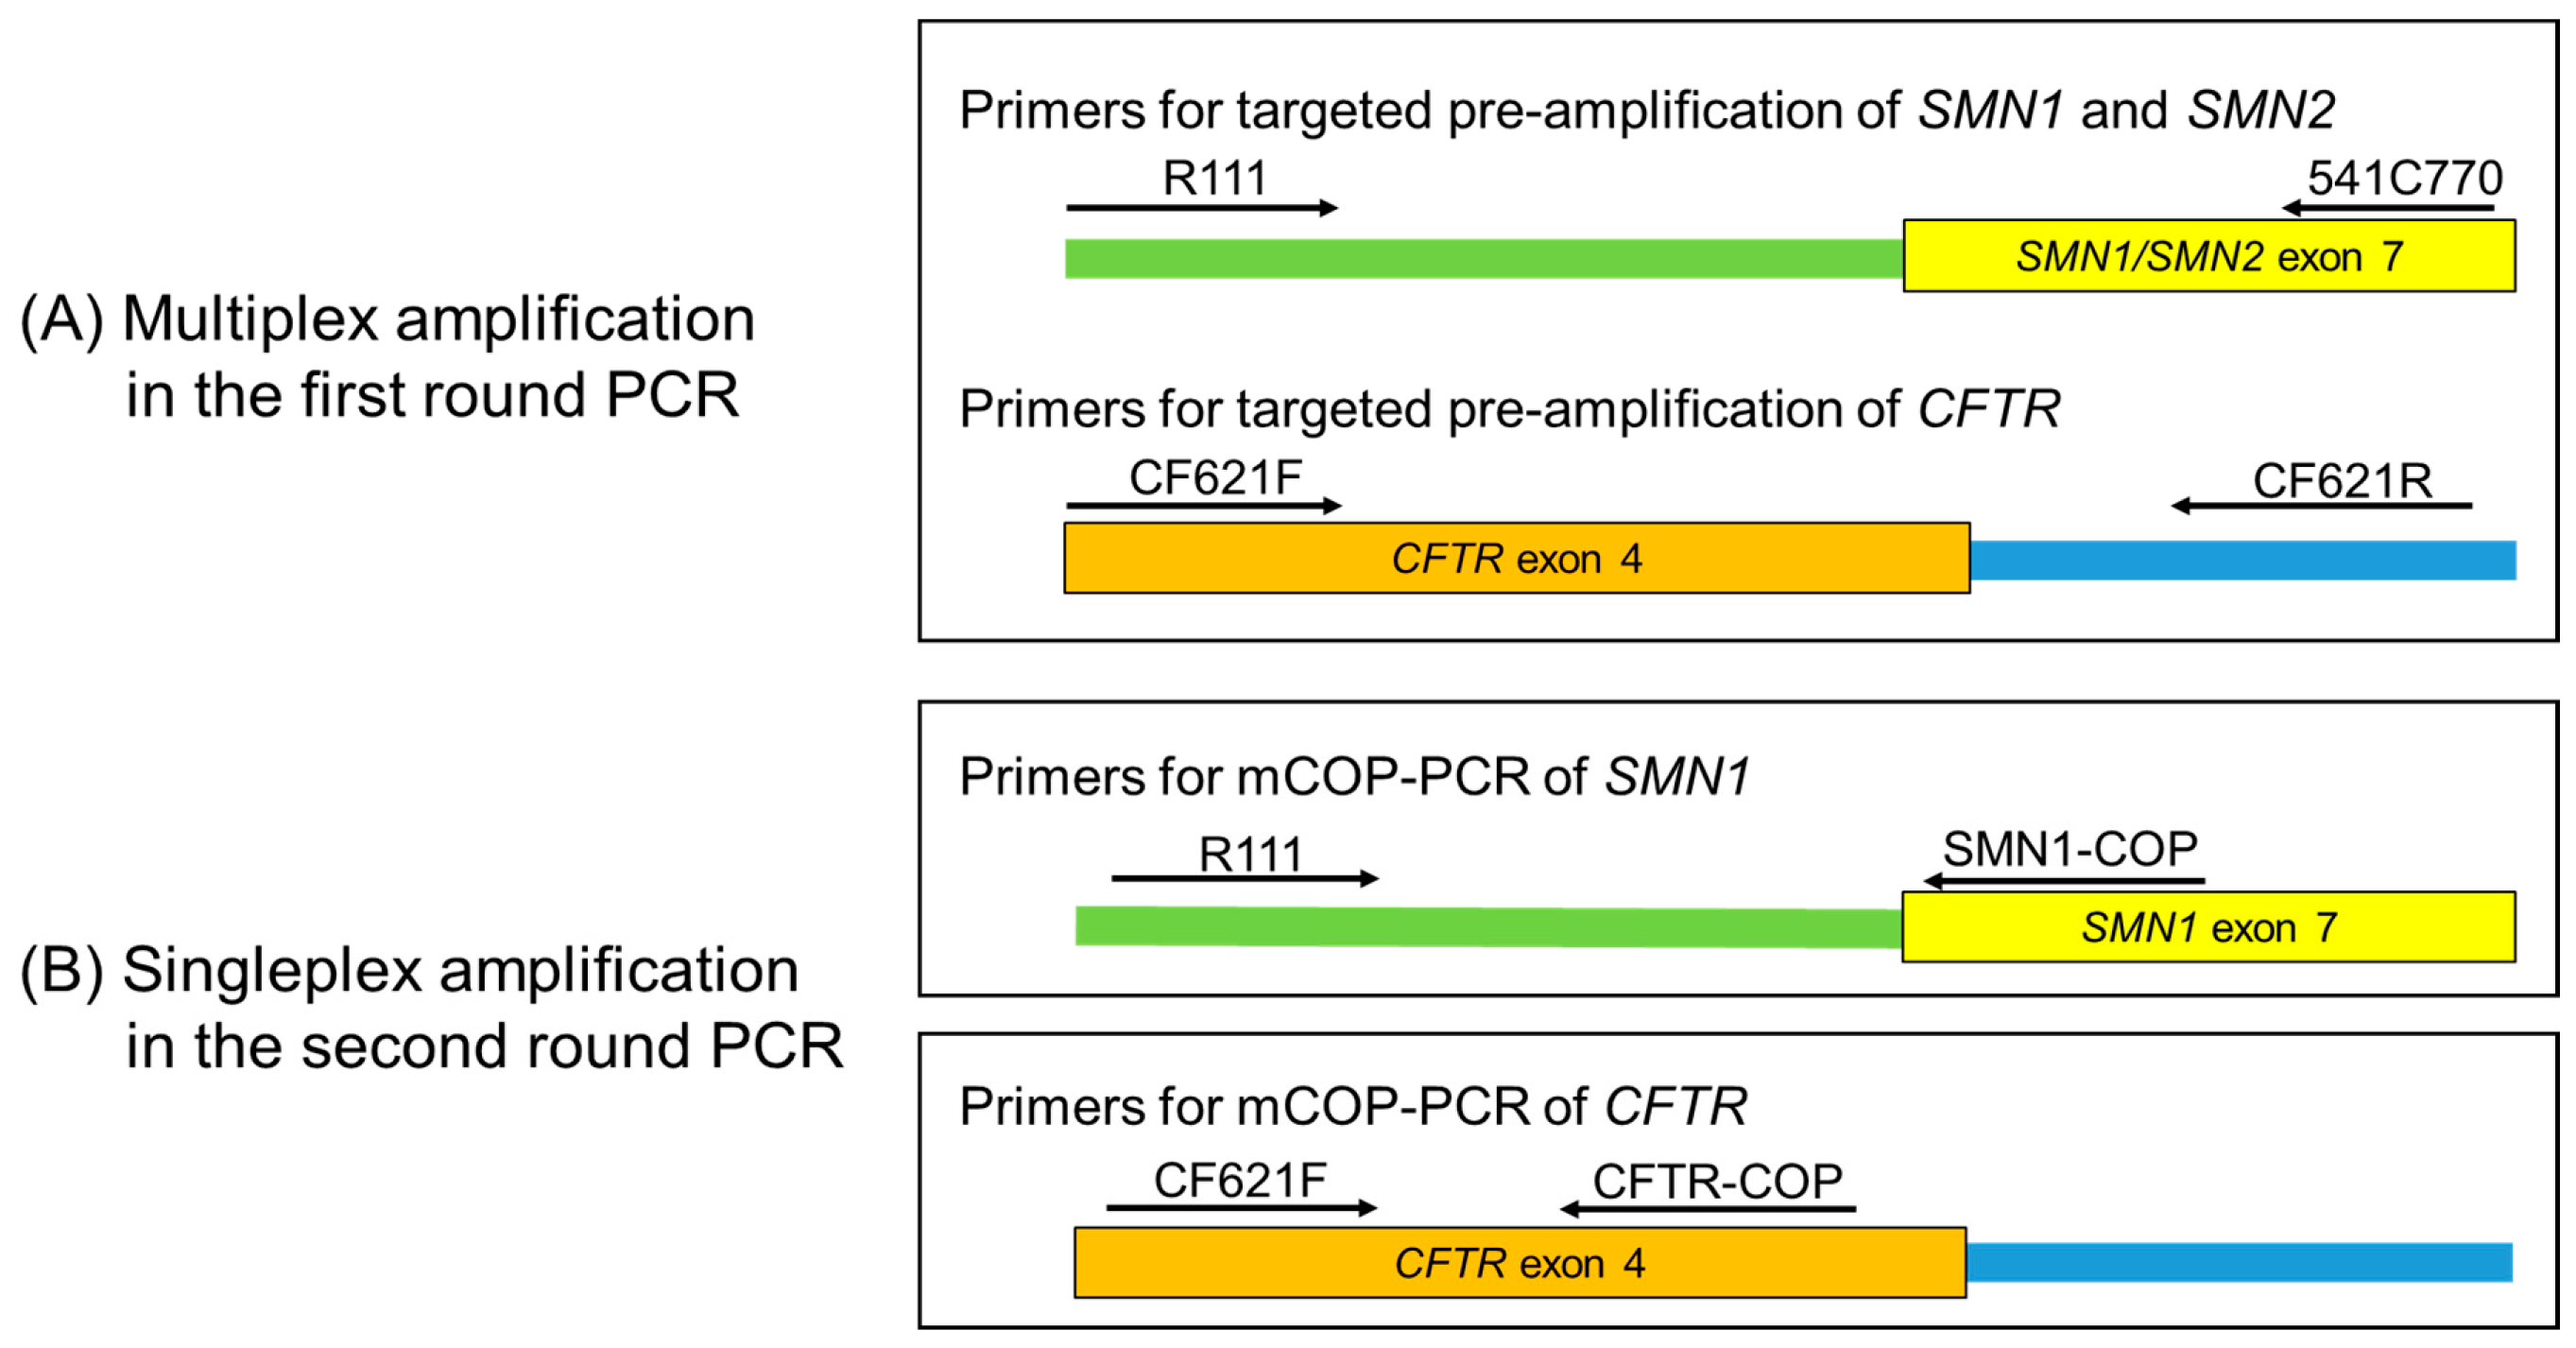
2.3.1. Outline

We performed an SMN1 copy number analysis using DBS on FTA cards and Guthrie cards. To determine the SMN1 copy number, we adopted a “calibrator-normalized relative quantification method”. A sample from a control with two SMN1 copies was used as a calibrator.
Our system involves quantitative nested PCR technology. The procedure for the SMN1 copy number analysis was: (1) a punched DBS circle from an FTA Card or Guthrie Card was placed directly into conventional multiplex PCR mixture, followed by the amplification of the targeted region of the SMN1/SMN2 exon 7 and CFTR exon 4 with 20–23 cycles (to stay within the log-linear phase in the first round conventional PCR). (2) The amplification products of the first round PCR were diluted 100-fold. (3) SMN1/SMN2 exon 7 and CFTR exon 4 were specifically amplified from the diluted product of the first round PCR by real-time mCOP-PCR to calculate the SMN1 copy number based on the quantitation cycle values (Cq values) in the second round of PCR.

2.3.2. First Round PCR

Multiplex PCR of the SMN1/SMN2 exon 7 (target gene) and CFTR exon 4 (reference gene) was performed using the GeneAmp® PCR System 9700 (Applied Biosystems, Foster City, CA, USA). A punched DBS circle of 2 mm in diameter was placed directly into the reaction mixture of 50 µL containing DNA polymerase KOD FX Neo (TOYOBO, Osaka, Japan). The primers for SMN1/SMN2 exon 7, R111 (5′-AGA CTA TCA ACT TAA TTT CTG ATC A-3′), and 541C770 (5′-TAA GGA ATG TGA GCA CCT TCC TTC-3′), were used to amplify the target sequences of SMN1/SMN2 exon 7 (Figure 1a) [2], and the primers for CFTR exon 4, CF621F (5′-AGT CAC CAA AGC AGT ACA GC-3′), and CF621R (5′-GGG CCT GTG CAA GGA AGT GTTA-3′), were used to amplify the target sequence of CFTR exon 4 (Figure 1a) [19]. The PCR conditions for a reaction mixture of 50 µL were: (1) initial denaturation at 94 °C for 7 min; (2) 20–23 cycles of denaturation at 94 °C for 1 min, annealing at 62 °C for 1 min, and extension at 72 °C for 1 min; (3) additional extension at 72 °C for 7 min; and (4) hold at 10 °C.

2.3.3. Second Round PCR

For quantitative analysis, a real-time mCOP-PCR of the SMN1 exon 7 (target gene) and CFTR exon 4 (reference gene) was performed in separate tubes using the LightCycler® 96 system (Roche Applied Science, Mannheim, Germany). Five microliters of 100-fold diluted first round DBS sample PCR product or 5 µL of a serially diluted sample of a calibrator sample was added up to the reaction mixture of 50 µL with DNA polymerase KOD FX Neo (TOYOBO) and EvaGreen® Dye (Biotium, Hayward, CA, USA). The primers for the SMN1-specific amplification were R111 [2] and SMN1-COP (5′-TGT CTG AAA CC-3′) [18] (Figure 1b), and the primers for the CFTR-specific amplification were CF621F [19] and CFTR-COP (5′-GAG CAG TGT CCT-3′) (Figure 1b). The PCR conditions for a reaction mixture of 50 µL were: (1) initial denaturation at 94 °C for 7 min; (2) 40 cycles of denaturation at 94 °C for 30 s, annealing at 37 °C for 30 s, and extension at 72 °C for 30 s; and (3) melting curve analysis. Fluorescence signals were detected at the end of each extension procedure.

2.3.4. Calculation of SMN1 Copy Number

The amount of the first round PCR product reflected the initial number of target gene molecules (SMN1 molecules) and reference gene molecules (CFTR molecules) because the amplification of the first round PCR ended in the log-linear phase. Thus, the initial number of target gene molecules (SMN1 molecules) or reference gene molecules (CFTR molecules) in the second round PCR reflected the initial number of target gene molecules (SMN1 molecules) or reference gene molecules (CFTR molecules) before the first round PCR.
The SMN1 copy number of the sample is calculated through the following formula. The formula is valid, if {ET^CqT(Sample)/ER^CqR(Sample)} is nearly equal to {ET^CqT(Calibrator)/ER^CqR(Calibrator).
Calculated   value   of   SMN1   copy   number = 2 × NTo ( Sample ) / NRo ( Sample )   NTo ( Calibrator ) / NRo ( Calibrator ) = 2 ×   { NTo   ( Sample ) / NRo ( Sample )   } × { ET ^ CqT ( Sample ) / ER ^ CqR ( Sample ) } { NTo   ( Calibrator ) / NRo ( Calibrator )   } × { ET ^ CqT ( Calibrator ) / ER ^ CqR ( Calibrator ) } = 2 ×   { NTo   ( Sample ) ×   ET ^ CqT ( Sample ) } / { NRo ( Sample )   ×   ER ^ CqR ( Sample ) } { NTo   ( Calibrator ) ×   ET ^ CqT ( Calibrator ) } / { NRo ( Calibrator )   ×   ER ^ CqR ( Calibrator ) } = 2 ×   NT   ( Sample ) / NR   ( Sample )   NT   ( Calibrator ) / NR   ( Calibrator )  
Abbreviations are shown below;
NT or NR: number of target gene molecules (SMN1 molecules) or reference gene molecules (CFTR molecules) at the detection threshold in the second round PCR. NTo or NRo: initial number of target gene molecules (SMN1 molecules) or reference gene molecules (CFTR molecules) in the second round PCR. CqT or CqR: cycle number at the target gene (or reference gene) detection threshold in the second round PCR. ET or ER: amplification efficiency of the target gene (or reference gene) in the second round PCR.

2.4. Statistical Analysis

The 95% confidence intervals of the SMN1 copy number values were computed using Microsoft Excel with add-in software, Statcel 3 (The Publisher OMS Ltd., Tokyo, Japan). In this report, the median, 25th percentile (first quartile), and 75th percentile (third quartile) values as well as the mean values were used to show the overlapping status of the SMN1 copy number values between carriers and controls using Microsoft Excel.

3. Results

3.1. Detection of Homozygous SMN1 Deletion in the DBS Samples on Guthrie Cards

We have reported an SMN1 deletion test using a combination method of targeted pre-amplification (first round PCR) and mCOP amplification (second round PCR) to detect SMN1 [13,18]. The starting material in the previous study was DBS on FTA cards. Here, we obtained SMN1 deletion test results using Guthrie cards instead of FTA cards.
The SMN1 amplification curves of Patients 1, 2, 3, and 4 showed no rise before 16 cycles in the second round PCR, while those of the controls rose at a steep rate at ~10 cycles. However, the SMN2 amplification curves of Patients 1, 2, 3, and 4 showed steep rises at ~10 cycles in the second round PCR, similar to the controls (Figure S1). These results indicated that these patients carried homozygous SMN1 deletions, confirming the diagnosis of SMA.
The SMN1 and SMN2 amplification curves of the parents of Patient 1 and 4 showed steep rises at ~10 cycles in the second round PCR, which was the same as the controls. We show the amplification curves and melting peak analysis of Patient 1’s father, which are representative of all parents (Figure S2). These data showed that the father and mother were not affected by SMA, but the data did not indicate whether they were SMA carriers or not. To determine this, it is necessary to determine the SMN1 copy number.

3.2. Detection of Heterozygous SMN1 Deletion in the DBS Samples

We used a quantitative nested real-time PCR assay for a copy number analysis of SMN1. If the amplification of the first round PCR ended in the log-linear phase, the amount of first round PCR product reflected the initial number of target gene molecules (SMN1 molecules) or reference gene molecules (CFTR molecules). Similarly, if the amplification of the second round PCR ended in the log-linear phase, the amount of second round PCR product also reflected the initial number of target gene molecules (SMN1 molecules) or reference gene molecules (CFTR molecules). Thus, theoretically, we are able to determine the copy number of SMN1.

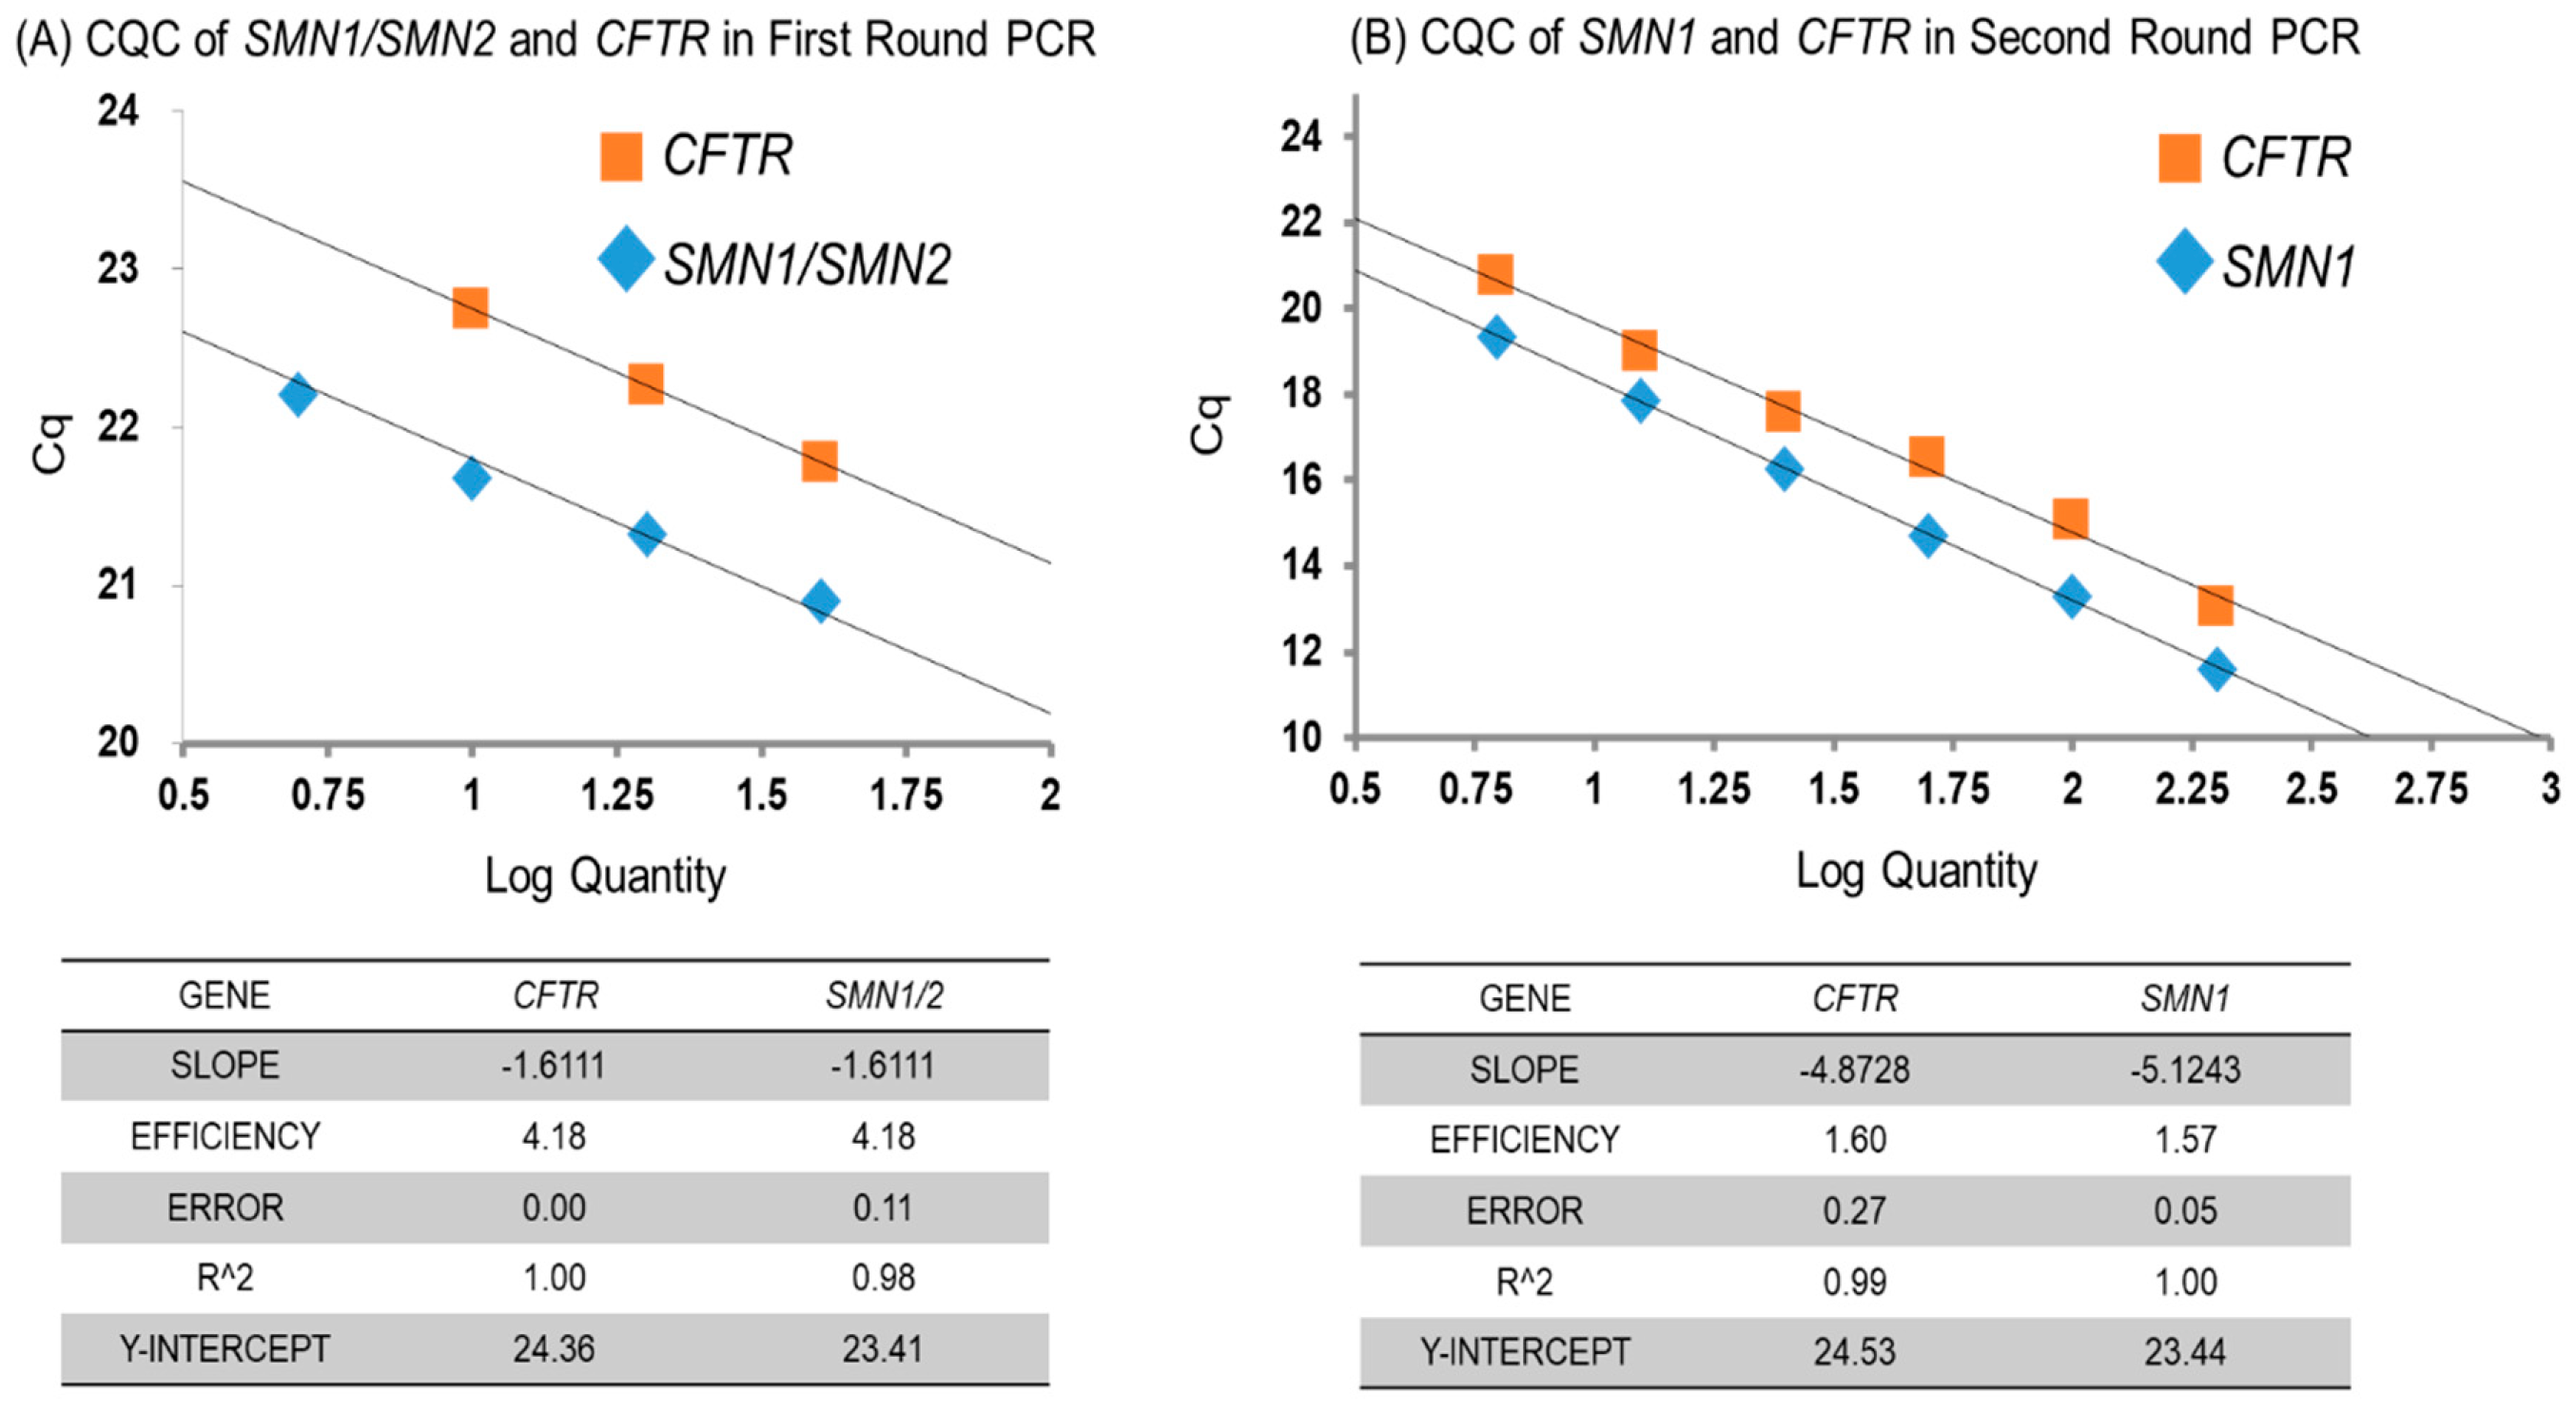
3.2.1. Amplification Efficiency of SMN1 and CFTR Genes

For the copy number analysis of SMN1, we applied a calibrator-normalized relative quantification assay. Copy numbers were calculated using the target/reference ratio of each sample normalized by the target/reference ratio of the calibrator. The accuracy was dependent on the similar amplification efficiencies of the target and reference genes.
In the first round PCR, we used real time PCR with serial dilution samples of genomic DNA (the starting DNA concentration was 10 ng/μL) to confirm that the amplification efficiencies of the target genes (SMN1/SMN2) and the reference gene (CFTR) were similar (Figure 2a) and to show that the first round PCR products reflected the ratios of the initial gene doses of SMN1/SMN2 and CFTR.
We also confirmed the amplification efficiencies of the second round PCR using real time PCR with serial dilution samples of the first round PCR product. We also confirmed similar amplification efficiencies for the target (SMN1) and reference (CFTR) genes (Figure 2b) to show that the second round PCR products also reflected the ratios of the initial SMN1 and CFTR gene doses.

3.2.2. Calculated SMN1 Copy Number Values Using DBS on FTA Cards

Fifty-four DBS samples from controls with two SMN1 copies and 44 DBS samples from SMA carriers with one SMN1 copy were analyzed by a nested real-time PCR assay for a calibrator-normalized relative quantification. The results are shown with a box-and-whisker plot (Figure 3).
The ranges of the calculated SMN1 copy number values for the 54 controls with two SMN1 copies and the 44 SMA carriers with one SMN1 copy were 2.12 ± 0.28 (mean ± SD) and 1.20 ± 0.15, respectively. The 95% confidence intervals were [2.11–2.20] and [1.13–1.20], respectively. In the present study with FTA cards, if the calculated SMN1 copy number value was less than 1.40, then the SMN1 copy number was determined as “one”.

3.2.3. Calculated SMN1 Copy Number Values Using DBS on Guthrie Cards

Twenty-one DBS samples from controls with two SMN1 copies and 12 DBS samples from SMA carriers with one SMN1 copy were analyzed by the same method described above, and the results are shown with a box-and-whisker plot (Figure 4).
The ranges of the calculated SMN1 copy number values of the 21 controls with two SMN1 copies and the 12 SMA carriers with one SMN1 copy were 2.00 ± 0.20 (mean ± SD) and 1.15 ± 0.25, respectively. The 95% confidence intervals were [1.91–2.09] and [0.99–1.31], respectively. In the present study with Guthrie cards, if the calculated SMN1 copy number value was less than 1.40, then the SMN1 copy number was determined as “one”.

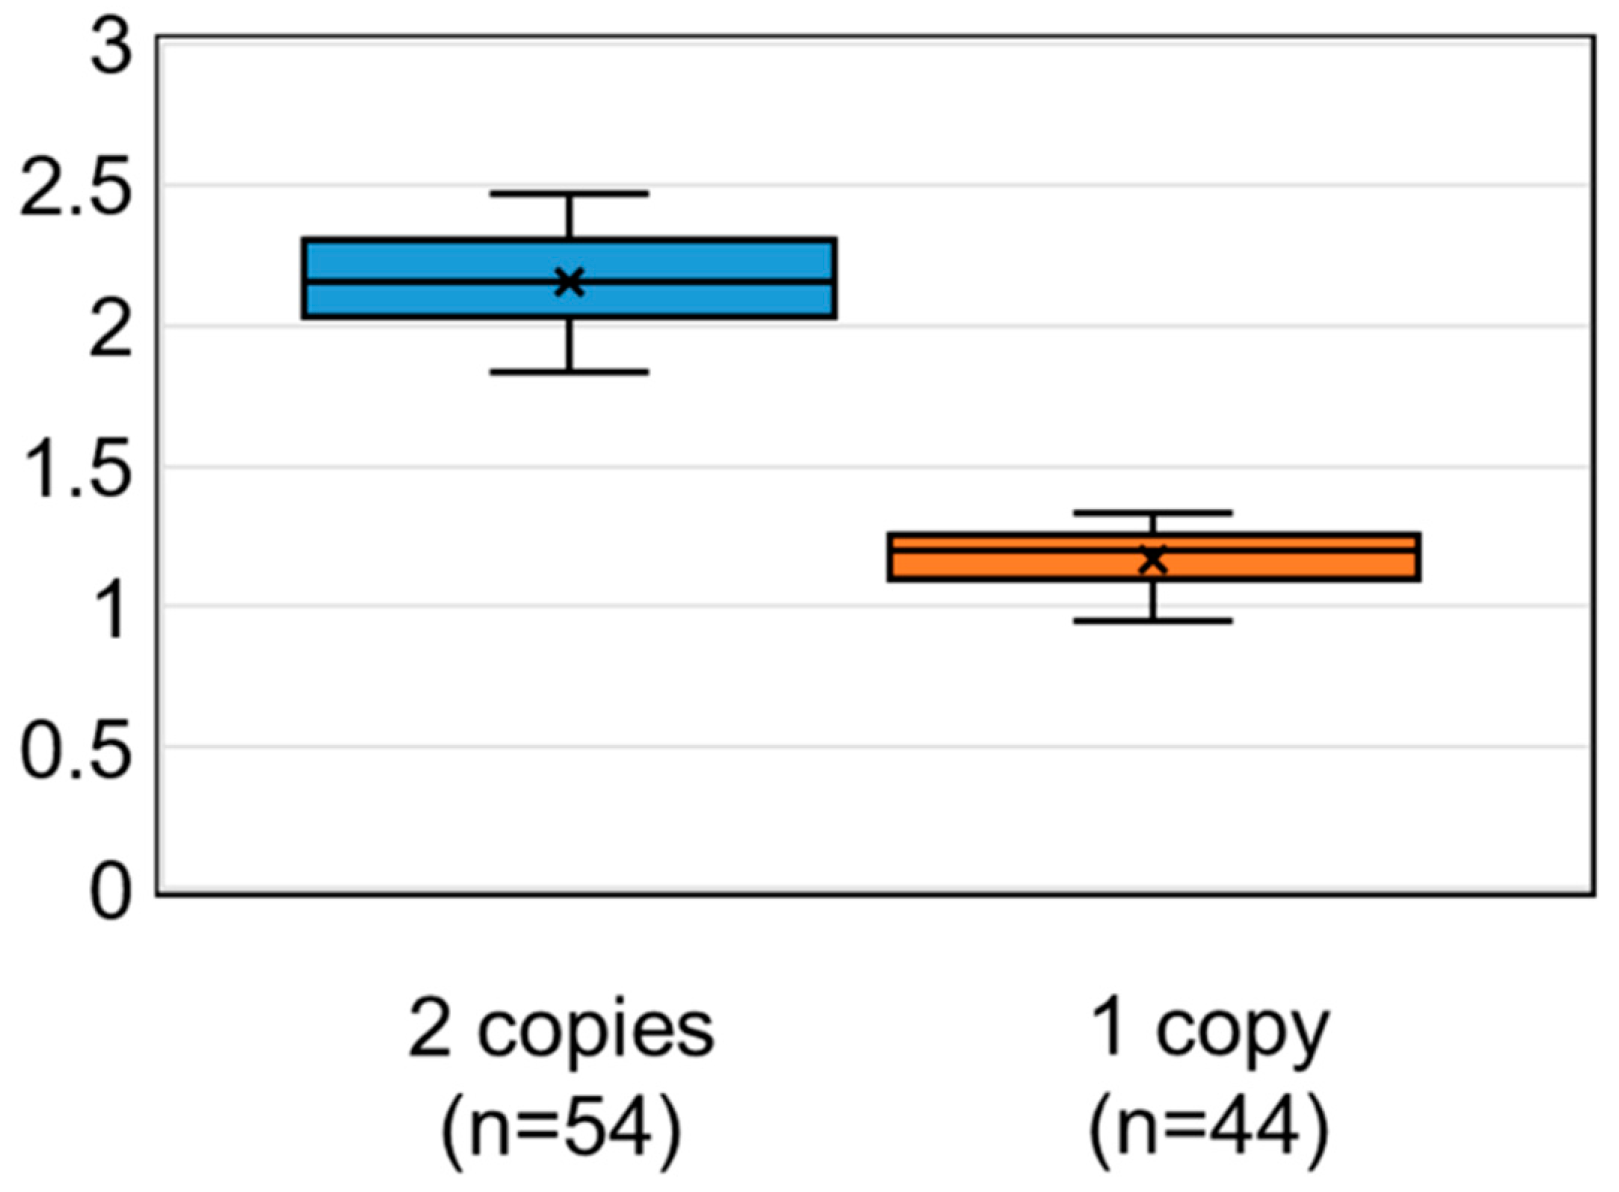
3.3. Determination of SMA Carrier Status from Analysis of SMN1 Copy Number

We determined the SMN1 copy number in the parents of Patient 1 (Mongolian) and Patient 4 (Indonesian) using DBS samples on Guthrie cards. The calculated SMN1 copy numbers for the father and mother of Patient 1 were 1.16 and 1.07, respectively (Figure 4). Thus, the parents were shown to be SMA carriers by molecular analysis as well as by clinical information.
The calculated SMN1 copy number for the father of Patient 4 was 1.25 (Figure 4), indicating that he was an SMA carrier with one copy of SMN1. However, the mother’s calculated SMN1 copy number was 2.09. We confirmed the presence of two SMN1 copies in this mother with her fresh blood.

4. Discussion

4.1. Simple Method: Using Filter Paper Commonly Used for Newborn Screening

In this study, we showed that DBS on Guthrie cards can be used for the detection of both the homozygous and heterozygous deletion of SMN1. We had already shown that FTA cards, which are designed for the collection and storage of DNA in blood, are useful for the analysis of SMN genes, but we had not shown the applicability of Guthrie cards for the DNA analysis and diagnosis of genetic disorders.
Guthrie cards (we used Toyo Roshi No. 545) are well-known for blood collection and are widely used for newborn screening for inborn errors of metabolism, including thyrotropin, phenylalanine, and 17a-hydroxyprogesterone [20], and are much cheaper than FTA cards. FTA cards are able to safely store DNA for more than 10 years, but it is not known how long Guthrie cards can be reliably kept for. The oldest DBS samples on Guthrie cards in our study were 3 years old, but we were able to determine the presence or absence of SMN1 and the copy number of SMN1. DBS on Guthrie cards can be reliable genetic test samples that can be sent from anywhere to anywhere on earth at normal ambient temperatures to enable genetic testing.
However, the most distinctive feature of our system is the simple handling of DBS from FTA or Guthrie cards. All that is required is for a circle to be punched out and placed in a PCR tube; no DNA extraction procedure is necessary. In addition, the quantity and quality of DNA from DBS does not matter, which we discuss further in the next subsection.

4.2. Robust Method: Adopting Nested Quantitative PCR Technology

The quantity and quality of DNA from DBS varied from card to card. However, our system for the detection of the homozygous or heterozygous deletion of SMN1 can accept low-quantity and poor-quality samples because it is based on nested PCR and a calibrator-normalized relative quantification assay with multiplex PCR.
In our previous investigation of homozygous SMN1 deletion, we showed an example of low-quantity and poor-quality DNA from DBS samples [13]. Targeted pre-amplification by the first round PCR overcame the DNA quantity and quality problem. In our system, it was not necessary for DNA to be abundant or purified to determine the presence or absence of SMN1.
We also determined the gene copy number in DBS samples using nested quantitative PCR. Nested quantitative PCR, in which the product of conventional first round PCR is used as the template for a second round of quantitative real-time amplification, had been successfully used to increase assay sensitivity using DBS for the diagnosis of microorganism infection [21,22]. Nested quantitative PCR is a simple but highly sensitive technology for quantification. We applied this method to DNA from DBS to analyze the gene dosage to determine SMA carrier status.

4.3. Accurate Method: Adopting Calibrator-Normalized Relative Quantification Assay with Multiplex PCR

We applied a calibrator-normalized relative quantification assay to determine the SMN1 copy number. In a calibrator-normalized relative quantification assay, it is not necessary to know the precise copy number of the target and reference genes in the calibrator. The calibrator used in this study was a sample from a control individual with two SMN1 copies and two CFTR copies. Here, only the serial dilution products of the standards from a calibrator need to be prepared; one dilution set for the target gene (SMN1) and one for the reference gene (CFTR) is required.
We adopted a multiplex PCR in the first round PCR because the same DNA should be the template for the PCR amplification of the target and reference genes. When amplifying the target gene and the reference gene in separate tubes, the DNA should be extracted in a uniform way, accurately quantitated, and precisely added to tubes to get reliable quantification results [23]. However, such procedures are almost impossible. In addition, in our method with no DNA extraction procedures, the multiplex PCR methodology in the first round PCR was absolutely needed.
In our current method, we amplified SMN1/SMN2 and CFTR in the first round PCR using the primer sets designed by Lefebvre et al. and McAndrew et al. [2,19]. We have already known the highly efficient and highly accurate amplification of SMN1/SMN2 and CFTR using these “canonical” primer sets. Actually, we applied the methods of McAndrew et al. for the determination of the SMN2 copy numbers with some modifications—for example, radioisotope-labeled primers were replaced by fluorescence-labeled primers in 2002 [24]. In those days, a large amount of pure DNA extracted from fresh blood was required for the copy number analysis of the SMN genes, and radioisotope-labeled or fluorescence-labeled primers were essential. In our updated methodology, a small amount of crude DNA trapped in the filter paper can be used for a gene dosage analysis, and neither radioisotope-labeled primers nor fluorescence-labeled primers are required anymore. The method described here may be in no way inferior to any methods reported previously.

4.4. Inexpensive Method: No Requirement for DNA Extraction or Fluorescence-Labeled Probes

Many methods for SMN1-specific detection have been reported [23,25,26,27,28,29,30] that can be broadly divided into two methodological groups, A and B. Methods in group A are based on the co-amplification of SMN1 and SMN2 with common primers, and the presence of SMN1 is determined by an SMN1-specific binding of a fluorescence-labeled oligonucleotide probe [23,25,26,27,28,29]. Methods in group B are based on amplification with SMN1-specific primers and the detection of the amplified SMN1 by a fluorescence-labeled oligonucleotide probe that commonly binds to SMN1/SMN2 [30]. However, the fluorescence-labeled oligonucleotide probes in these methodologies may be expensive and their design may not be trivial.
Our methods in previous studies [13,18] and in this study do not belong to groups A or B but to a third group. To determine the presence or absence of SMN1, we amplified the gene with SMN1-specific primers and detected its amplification by the DNA intercalation of EvaGreen® Dye, which is similar to SYBR Green® Dye. Our methods do not use fluorescence-labeled oligonucleotide probes, which reduces the cost. The relative cost of fluorescence-labeled oligonucleotide probes vs. the cost of EvaGreen® Dye was 10:1, according to our calculation.
The results in this study are of equal or greater accuracy compared with the methods using fluorescence-labeled oligonucleotide probes. In one study using a fluorescence-labeled probe, there was a large overlap in the ratio between normal individuals (with two SMN1 copies) and heterozygous individuals (with one SMN1 copy) [31]. In our study, there was no overlap in the ratio between the controls with two SMN1 copies and SMA carriers with one SMN1 copy (Figure 3 and Figure 4).

4.5. Limitation of Assigning SMA Carrier Status Based on the SMN1 Copy Number Assay

Although we are confident that our system determines accurate SMN1 copy numbers, we also experienced a limitation encountered by other studies [9], which is the presence of SMA carriers with two SMN1 copies. SMA is an autosomal recessive neuromuscular disorder, and ~95% of SMA patients have a homozygous deletion of the SMA-causative gene, SMN1. Thus, SMA carriers are usually diagnosed based on their SMN1 copy number, because one SMN1 copy means the heterozygous deletion of SMN1 ([1 + 0] genotype). However, having two SMN1 copies does not always exclude carrier status [32,33]. Some SMA carriers have two SMN1 copies on one chromosome, with the deletion of SMN1 on the other chromosome ([2 + 0] genotype) [32,33]. Other carriers may be heterozygous for an intragenic SMN1 mutation ([1 + 1d] genotype; “d” denotes the presence of an intragenic mutation) [32,33].
In this study, the parents of Patient 1 and the father of Patient 4 showed one SMN1 copy, indicating that they were SMA carriers with a [1 + 0] genotype. However, the mother of Patient 4 showed two SMN1 copies. Patient 4 was homozygous for SMN1 deletion, which means that she inherited a chromosome with no SMN1 alleles from her mother. Therefore, Patient 4’s mother had two SMN1 copies on one chromosome and no SMN1 copy on the other chromosome, which was inherited by her daughter. These results indicated a limitation of SMA carrier diagnosis based on the gene copy number analysis of SMN1.
The current screening method based on an SMN1 copy number analysis could not detect SMA carriers with a [2 + 0] genotype or [1 + 1d] genotype, although their frequencies are low. The occurrences of [2 + 0] and [1 + 1d] genotypes have been presumed to be of low incidence among SMA carriers. According to a previous report, ~2.4% of carriers showed the [2 + 0] genotype, and ~1.7% of carriers showed the [1 + 1d] genotype [34].
Even so, how to solve the issues regarding SMA carriers with a [2 + 0] or [1 + 1d] genotype should be explored. Some researchers observed that some variants were related to duplications of SMN1 in SMA families [35,36]. The identification of such variants and their haplotype analysis may be helpful for the risk estimation of SMA carriers with [2 + 0] genotype. As for the screening of SMA carriers with [1 + 1d], next generation sequencing has the potential to detect SMN1 point mutations in the newborn or carrier screening programs [37].

5. Conclusions

We developed a new simple, accurate, and inexpensive system for determining the SMN1 copy number and SMA carrier status. The system developed in this study has three main advantages. First, Guthrie cards as well as FTA cards can be used as simple DNA collection and storage media. Guthrie cards are well-known filter papers that are used for screening congenital metabolic disorders. With Guthrie cards, DNA can be delivered from any remote area where genetic analysis is not available to a DNA-analyzing center. Second, the procedures in our system are simple but accurate for determining the SMN1 copy number. This provides critical information for the genetic counselling of SMA families. Finally, our system does not require DNA extraction kits or oligonucleotide probes. Our system is significantly cheaper than other methods, which becomes more important when analyzing large numbers of samples. These characteristics of our system may allow a greater number of SMA families all over the world to receive the correct assessment of the recurrence risk of the disease.

Supplementary Materials

Supplementary materials can be found at https://0-www-mdpi-com.brum.beds.ac.uk/2409-515X/6/2/43/s1.

Author Contributions

Conceptualization, H.N.; methodology, H.N. and Y.O.S.W.; resources, J.P., N.I.F.H., S.H., D.K.N., M.A.R. and C.T.; writing—original draft preparation, H.N. and Y.O.S.W.; writing—review and editing, E.T.E.N., Y.O.S.W., Y.B., S.Y., M.S., and H.N. All authors have read and agreed to the published version of the manuscript.

Funding

This research was supported by the Ministry of Education, Culture, Sports, Science and Technology, Japan, Grant No. 20K08197.

Acknowledgments

We thank the patients and newborn infants who participated in the study; their parents, guardians, and family members; and Chiyo Hayashi, who managed the samples and documents of the patients and newborn infants who participated in this study.

Conflicts of Interest

The authors declare no conflict of interest. The funders had no role in the design of the study; in the collection, analyses, or interpretation of data; in the writing of the manuscript, or in the decision to publish the results.

References

  1. Nurputra, D.K.; Lai, P.S.; Harahap, N.I.F.; Morikawa, S.; Yamamoto, T.; Nishimura, N.; Kubo, Y.; Takeuchi, A.; Saito, T.; Takeshima, Y.; et al. Spinal muscular atrophy: From gene discovery to clinical trials. Ann. Hum. Genet. 2013, 77, 435–463. [Google Scholar] [CrossRef] [PubMed]
  2. Lefebvre, S.; Burglen, L.; Reboullet, S.; Clermont, O.; Burlet, P.; Viollet, L.; Bénichou, B.; Cruaud, C.; Millasseau, P.; Zeviani, M.; et al. Identification and characterization of a spinal muscular atrophy-determining gene. Cell 1995, 80, 155–165. [Google Scholar] [CrossRef] [Green Version]
  3. Wirth, B. An update of the mutation spectrum of the survival motor neuron gene (SMN1) in autosomal recessive spinal muscular atrophy (SMA). Hum. Mutat. 2000, 15, 228–237. [Google Scholar] [CrossRef]
  4. Arnold, W.D.; Kassar, D.; Kissel, J.T. Spinal muscular atrophy: Diagnosis and management in a new therapeutic era. Muscle Nerve 2014, 51, 157–167. [Google Scholar] [CrossRef]
  5. Finkel, R.S.; Mercuri, E.; Darras, B.; Connolly, A.; Kuntz, N.; Kirschner, J.; Chiriboga, C.A.; Saito, K.; Servais, L.; Tizzano, E.; et al. Nusinersen versus sham control in Infantile-Onset spinal muscular atrophy. N. Engl. J. Med. 2017, 377, 1723–1732. [Google Scholar] [CrossRef] [Green Version]
  6. Mendell, J.R.; Al-Zaidy, S.; Shell, R.; Arnold, W.D.; Rodino-Klapac, L.R.; Prior, T.W.; Lowes, L.P.; Alfano, L.; Berry, K.; Church, K.; et al. Single-Dose Gene-Replacement therapy for spinal muscular atrophy. N. Engl. J. Med. 2017, 377, 1713–1722. [Google Scholar] [CrossRef]
  7. De Vivo, D.C.; Bertini, E.; Swoboda, K.J.; Hwu, W.-L.; Crawford, T.O.; Finkel, R.S.; Kirschner, J.; Kuntz, N.L.; Parsons, J.A.; Ryan, M.M.; et al. Nusinersen initiated in infants during the presymptomatic stage of spinal muscular atrophy: Interim efficacy and safety results from the Phase 2 NURTURE study. Neuromuscul. Disord. 2019, 29, 842–856. [Google Scholar] [CrossRef] [Green Version]
  8. Prior, T.W. Carrier screening for spinal muscular atrophy. Genet. Med. 2008, 10, 840–842. [Google Scholar] [CrossRef] [Green Version]
  9. Prior, T.W.; Snyder, P.J.; Rink, B.D.; Pearl, D.K.; Pyatt, R.E.; Mihal, D.C.; Conlan, T.; Schmalz, B.; Montgomery, L.; Ziegler, K.; et al. Newborn and carrier screening for spinal muscular atrophy. Am. J. Med Genet. Part A 2010, 152, 1608–1616. [Google Scholar] [CrossRef]
  10. Chien, Y.-H.; Chiang, S.-C.; Weng, W.-C.; Lee, N.-C.; Lin, C.-J.; Hsieh, W.-S.; Lee, W.-T.; Jong, Y.-J.; Ko, T.-M.; Hwu, W.-L. Presymptomatic diagnosis of spinal muscular atrophy through newborn screening. J. Pediatr. 2017, 190, 124–129.e1. [Google Scholar] [CrossRef]
  11. Kraszewski, J.N.; Kay, D.M.; Stevens, C.F.; Koval, C.; Haser, B.; Ortiz, V.; Albertorio, A.; Cohen, L.L.; Jain, R.; Andrew, S.P.; et al. Pilot study of Population-Based newborn screening for spinal muscular atrophy in New York state. Genet. Med. 2017, 20, 608–613. [Google Scholar] [CrossRef] [PubMed] [Green Version]
  12. Czibere, L.; Burggraf, S.; Fleige, T.; Glück, B.; Keitel, L.M.; Landt, O.; Durner, J.; Röschinger, W.; Hohenfellner, K.; Wirth, B.; et al. High-Throughput genetic newborn screening for spinal muscular atrophy by rapid nucleic acid extraction from dried blood spots and 384-Well qPCR. Eur. J. Hum. Genet. 2019, 28, 23–30. [Google Scholar] [CrossRef] [PubMed]
  13. Shinohara, M.; Niba, E.T.E.; Wijaya, Y.O.S.; Takayama, I.; Mitsuishi, C.; Kumasaka, S.; Kondo, Y.; Takatera, A.; Hokuto, I.; Morioka, I.; et al. A novel system for spinal muscular atrophy screening in newborns: Japanese pilot study. Int. J. Neonatal Screen. 2019, 5, 41. [Google Scholar] [CrossRef] [Green Version]
  14. Vill, K.; Kölbel, H.; Schwartz, O.; Blaschek, A.; Olgemöller, B.; Harms, E.; Burggraf, S.; Röschinger, W.; Durner, J.; Gläser, D.; et al. One year of newborn screening for SMA-Results of a german pilot project. J. Neuromuscul. Dis. 2019, 6, 503–515. [Google Scholar] [CrossRef] [PubMed] [Green Version]
  15. Little, S.E.; Janakiraman, V.; Kaimal, A.; Musci, T.; Ecker, J.; Caughey, A.B. The Cost-Effectiveness of prenatal screening for spinal muscular atrophy. Am. J. Obstet. Gynecol. 2010, 202, 253.e1–253.e7. [Google Scholar] [CrossRef] [PubMed]
  16. Burns, J.K.; Kothary, R.; Parks, R.J. Opening the window: The case for carrier and perinatal screening for spinal muscular atrophy. Neuromuscul. Disord. 2016, 26, 551–559. [Google Scholar] [CrossRef] [PubMed] [Green Version]
  17. Tran, V.K.; Sasongko, T.H.; Hong, D.D.; Hoan, N.T.; Dung, V.C.; Lee, M.J.; Takeshima, Y.; Matsuo, M.; Nishio, H. SMN2 and NAIP gene dosages in Vietnamese patients with spinal muscular atrophy. Pediatr. Int. 2008, 50, 346–351. [Google Scholar] [CrossRef] [PubMed] [Green Version]
  18. Rochmah, M.A.; Harahap, N.I.F.; Niba, E.T.E.; Nakanishi, K.; Awano, H.; Morioka, I.; Iijima, K.; Saito, T.; Saito, K.; Lai, P.S.; et al. Genetic screening of spinal muscular atrophy using a Real-Time modified COP-PCR technique with dried Blood-Spot DNA. Brain Dev. 2017, 39, 774–782. [Google Scholar] [CrossRef] [PubMed]
  19. McAndrew, P.; Parsons, D.; Simard, L.; Rochette, C.; Ray, P.; Mendell, J.; Prior, T.; Burghes, A. Identification of proximal spinal muscular atrophy carriers and patients by analysis of SMNT and SMNC gene copy number. Am. J. Hum. Genet. 1997, 60, 1411–1422. [Google Scholar] [CrossRef] [Green Version]
  20. Elvers, B.; Loeber, J.G.; Dhondt, J.-L.; Fukushi, M.; Hannon, W.H.; Torresani, T.; Webster, D. First ISNS reference preparation for neonatal screening for thyrotropin, phenylalanine and 17α-hydroxyprogesterone in blood spots. J. Inherit. Metab. Dis. 2007, 30, 609. [Google Scholar] [CrossRef] [Green Version]
  21. Perrott, P.; Smith, G.; Ristovski, Z.; Harding, R.M.; Hargreaves, M. A nested Real-Time PCR assay has an increased sensitivity suitable for detection of viruses in aerosol studies. J. Appl. Microbiol. 2009, 106, 1438–1447. [Google Scholar] [CrossRef] [Green Version]
  22. Tran, T.M.; Aghili, A.; Li, S.; Ongoiba, A.; Kayentao, K.; Doumbo, S.; Traore, B.; Crompton, P.D. A nested Real-Time PCR assay for the quantification of Plasmodium falciparum DNA extracted from dried blood spots. Malar. J. 2014, 13, 393. [Google Scholar] [CrossRef] [PubMed] [Green Version]
  23. Passon, N.; Pozzo, F.; Molinis, C.; Bregant, E.; Gellera, C.; Damante, G.; Lonigro, R.I. A simple multiplex Real-Time PCR methodology for the SMN1 gene copy number quantification. Genet. Test. Mol. Biomark. 2009, 13, 37–42. [Google Scholar] [CrossRef] [PubMed] [Green Version]
  24. Harada, Y.; Sutomo, R.; Sadewa, A.H.; Akutsu, T.; Takeshima, Y.; Wada, H.; Matsuo, M.; Nishio, H. Correlation between SMN2 copy number and clinical phenotype of spinal muscular atrophy: Three SMN2 copies fail to rescue some patients from the disease severity. J. Neurol. 2002, 249, 1211–1219. [Google Scholar] [CrossRef] [PubMed]
  25. Anhuf, D.; Eggermann, T.; Rudnik-Schöneborn, S.; Zerres, K. Determination of SMN1 and SMN2 Copy Number Using TaqManTM Technology. Hum. Mutat. 2003, 22, 74–78. [Google Scholar] [CrossRef] [PubMed]
  26. Maranda, B.; Fan, L.; Soucy, J.-F.; Simard, L.; Mitchell, G.A. Spinal muscular atrophy: Clinical validation of a Single-Tube multiplex real time PCR assay for determination of SMN1 and SMN2 copy numbers. Clin. Biochem. 2012, 45, 88–91. [Google Scholar] [CrossRef]
  27. E Pyatt, R.; Prior, T.W. A feasibility study for the newborn screening of spinal muscular atrophy. Genet. Med. 2006, 8, 428–437. [Google Scholar] [CrossRef] [Green Version]
  28. Taylor, J.L.; Lee, F.K.; Yazdanpanah, G.K.; Staropoli, J.F.; Liu, M.; Carulli, J.P.; Sun, C.; Dobrowolski, S.F.; Hannon, W.H.; Vogt, R.F. Newborn Blood Spot Screening Test Using Multiplexed Real-Time PCR to simultaneously screen for spinal muscular atrophy and severe combined immunodeficiency. Clin. Chem. 2015, 61, 412–419. [Google Scholar] [CrossRef] [Green Version]
  29. Strunk, A.; Abbes, A.; Stuitje, A.R.; Hettinga, C.; Sepers, E.M.; Snetselaar, R.; Schouten, J.; Asselman, F.-L.; Cuppen, I.; Lemmink, H.; et al. Validation of a Fast, Robust, Inexpensive, Two-Tiered neonatal screening test algorithm on dried blood spots for spinal muscular atrophy. Int. J. Neonatal Screen. 2019, 5, 21. [Google Scholar] [CrossRef] [Green Version]
  30. Strom, C.M.; Anderson, B.; Peng, M.; Patel, U.; Braastad, C.D.; Sun, W. 1000 sample comparison of MLPA and RT-PCR for carrier detection and diagnostic testing for spinal muscular atrophy type 1. Open J. Genet. 2013, 3, 111–114. [Google Scholar] [CrossRef] [Green Version]
  31. Boemer, F.; Caberg, J.-H.; Dideberg, V.; Dardenne, D.; Bours, V.; Hiligsmann, M.; Dangouloff, T.; Servais, L. Newborn screening for SMA in Southern Belgium. Neuromuscul. Disord. 2019, 29, 343–349. [Google Scholar] [CrossRef] [PubMed]
  32. Rochmah, M.A.; Awano, H.; Awaya, T.; Harahap, N.I.F.; Morisada, N.; Bouike, Y.; Saito, T.; Kubo, Y.; Saito, K.; Lai, P.S.; et al. Spinal muscular atrophy carriers with two SMN1 copies. Brain Dev. 2017, 39, 851–860. [Google Scholar] [CrossRef] [PubMed]
  33. Wei, X.; Tan, H.; Yang, P.; Zhang, R.; Tan, B.; Zhang, Y.; Mei, L.; Liang, D.; Wu, L. Notable carrier risks for individuals having two copies of SMN1 in spinal muscular atrophy families with 2-Copy Alleles: Estimation based on chinese meta-analysis data. J. Genet. Couns. 2016, 26, 72–78. [Google Scholar] [CrossRef] [PubMed]
  34. Ogino, S.; Wilson, R.B. SMN dosage analysis and risk assessment for spinal muscular atrophy. Am. J. Hum. Genet. 2002, 70, 1596–1598. [Google Scholar] [CrossRef] [PubMed] [Green Version]
  35. Luo, M.; Liu, L.; Peter, I.; Zhu, J.; Scott, S.A.; Zhao, G.; Eversley, C.; Kornreich, R.; Desnick, R.J.; Edelmann, L. An ashkenazi jewish SMN1 haplotype specific to duplication alleles improves Pan-Ethnic carrier screening for spinal muscular atrophy. Genet. Med. 2013, 16, 149–156. [Google Scholar] [CrossRef] [PubMed] [Green Version]
  36. Alías, L.; Bernal, S.; Calucho, M.; Martínez, E.; March, F.; Gallano, P.; Fuentes-Prior, P.; Abulí, A.; Serra-Juhé, C.; Tizzano, E.F. Utility of two SMN1 variants to improve spinal muscular atrophy carrier diagnosis and genetic counselling. Eur. J. Hum. Genet. 2018, 26, 1554–1557. [Google Scholar] [CrossRef] [PubMed]
  37. Dangouloff, T.; Burghes, A.; Tizzano, E.F.; Servais, L.; Bertini, E.; Boemer, F.; Hiligsmann, M.; Mueller-Felber, W.; Tiziano, D.; Young, P.; et al. 244th ENMC international workshop: Newborn screening in spinal muscular atrophy May 10–12, 2019, Hoofdorp, The Netherlands. Neuromuscul. Disord. 2020, 30, 93–103. [Google Scholar] [CrossRef]
Figure 1. Primer positions used in the quantitative nested PCR. (A) Multiplex PCR in the first round of the nested PCR. Long SMN1, SMN2, and CFTR fragments were co-amplified by outer primers in a multiplex PCR. (B) Singleplex PCR in the second round of the nested PCR. Shorter fragments of SMN1 and CFTR were separately amplified in different tubes. Primer positions and directions are indicated by arrows.
Ijns 06 00043 g001
Figure 2. Cq-Log quantity curves (CQC). (A) Cq-Log quantity curves of SMN1/SMN2 (SMN1 and SMN2 fragments amplified by the same primers) and CFTR in the first round PCR. The amplification efficiencies of the CFTR and SMN1/SMN2 were similar. (B) SMN1 and CFTR in the second round PCR. The amplification efficiencies of the SMN1 and CFTR were also similar.
Ijns 06 00043 g002
Figure 3. Calculated SMN1 copy number values using dried blood spots (DBS) on Flinders Technology Associates (FTA) cards. Box-and-whisker plots of the calculated copy number values were obtained from 54 DBS samples with two SMN1 copies and 44 DBS samples with one SMN1 copy. The x mark indicates the average value of each group.
Ijns 06 00043 g003
Figure 4. Calculated SMN1 copy number values using DBS on Guthrie cards. Box-and-whisker plots of the calculated copy number values were obtained from 21 DBS samples with two SMN1 copies and 12 DBS samples with one SMN1 copy. Patient 1’s parents and Patient 2’s father carried one SMN1 copy, but Patient 2’s mother carried two SMN1 copies. The x mark indicates the average value of each group.
Ijns 06 00043 g004

