Trade-Offs Underwater: Physiological Plasticity of Rainbow Trout (Oncorhynchus mykiss) Confronted by Multiple Stressors

 , , ,
, , ,
Abstract
:
1. Introduction
2. Results
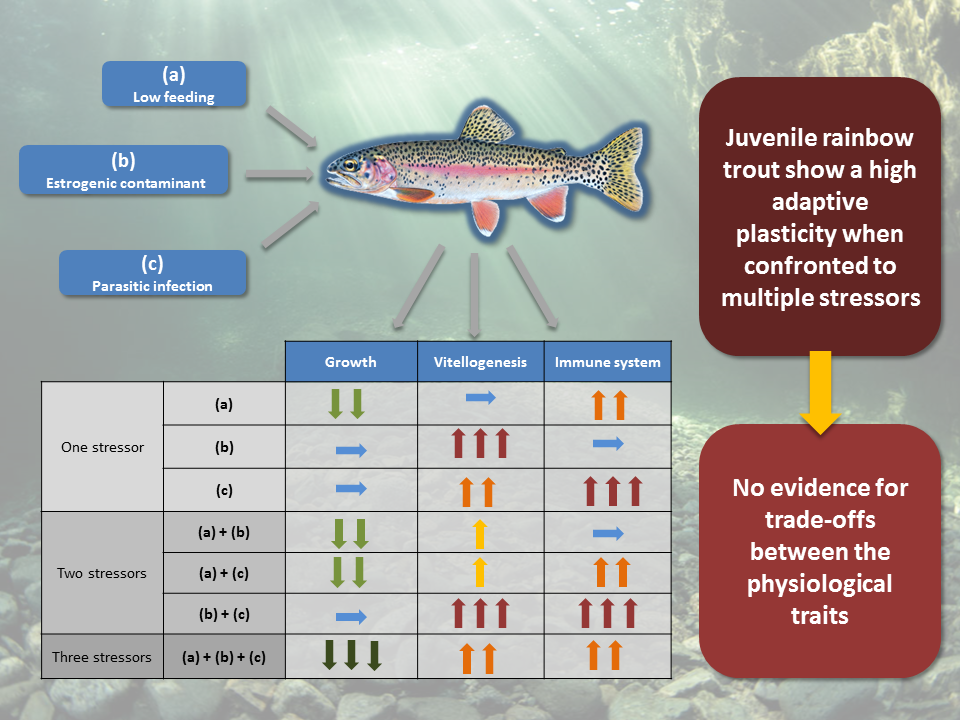
2.1. Body Growth
2.2. Contaminant-Induced Vitellogenesis
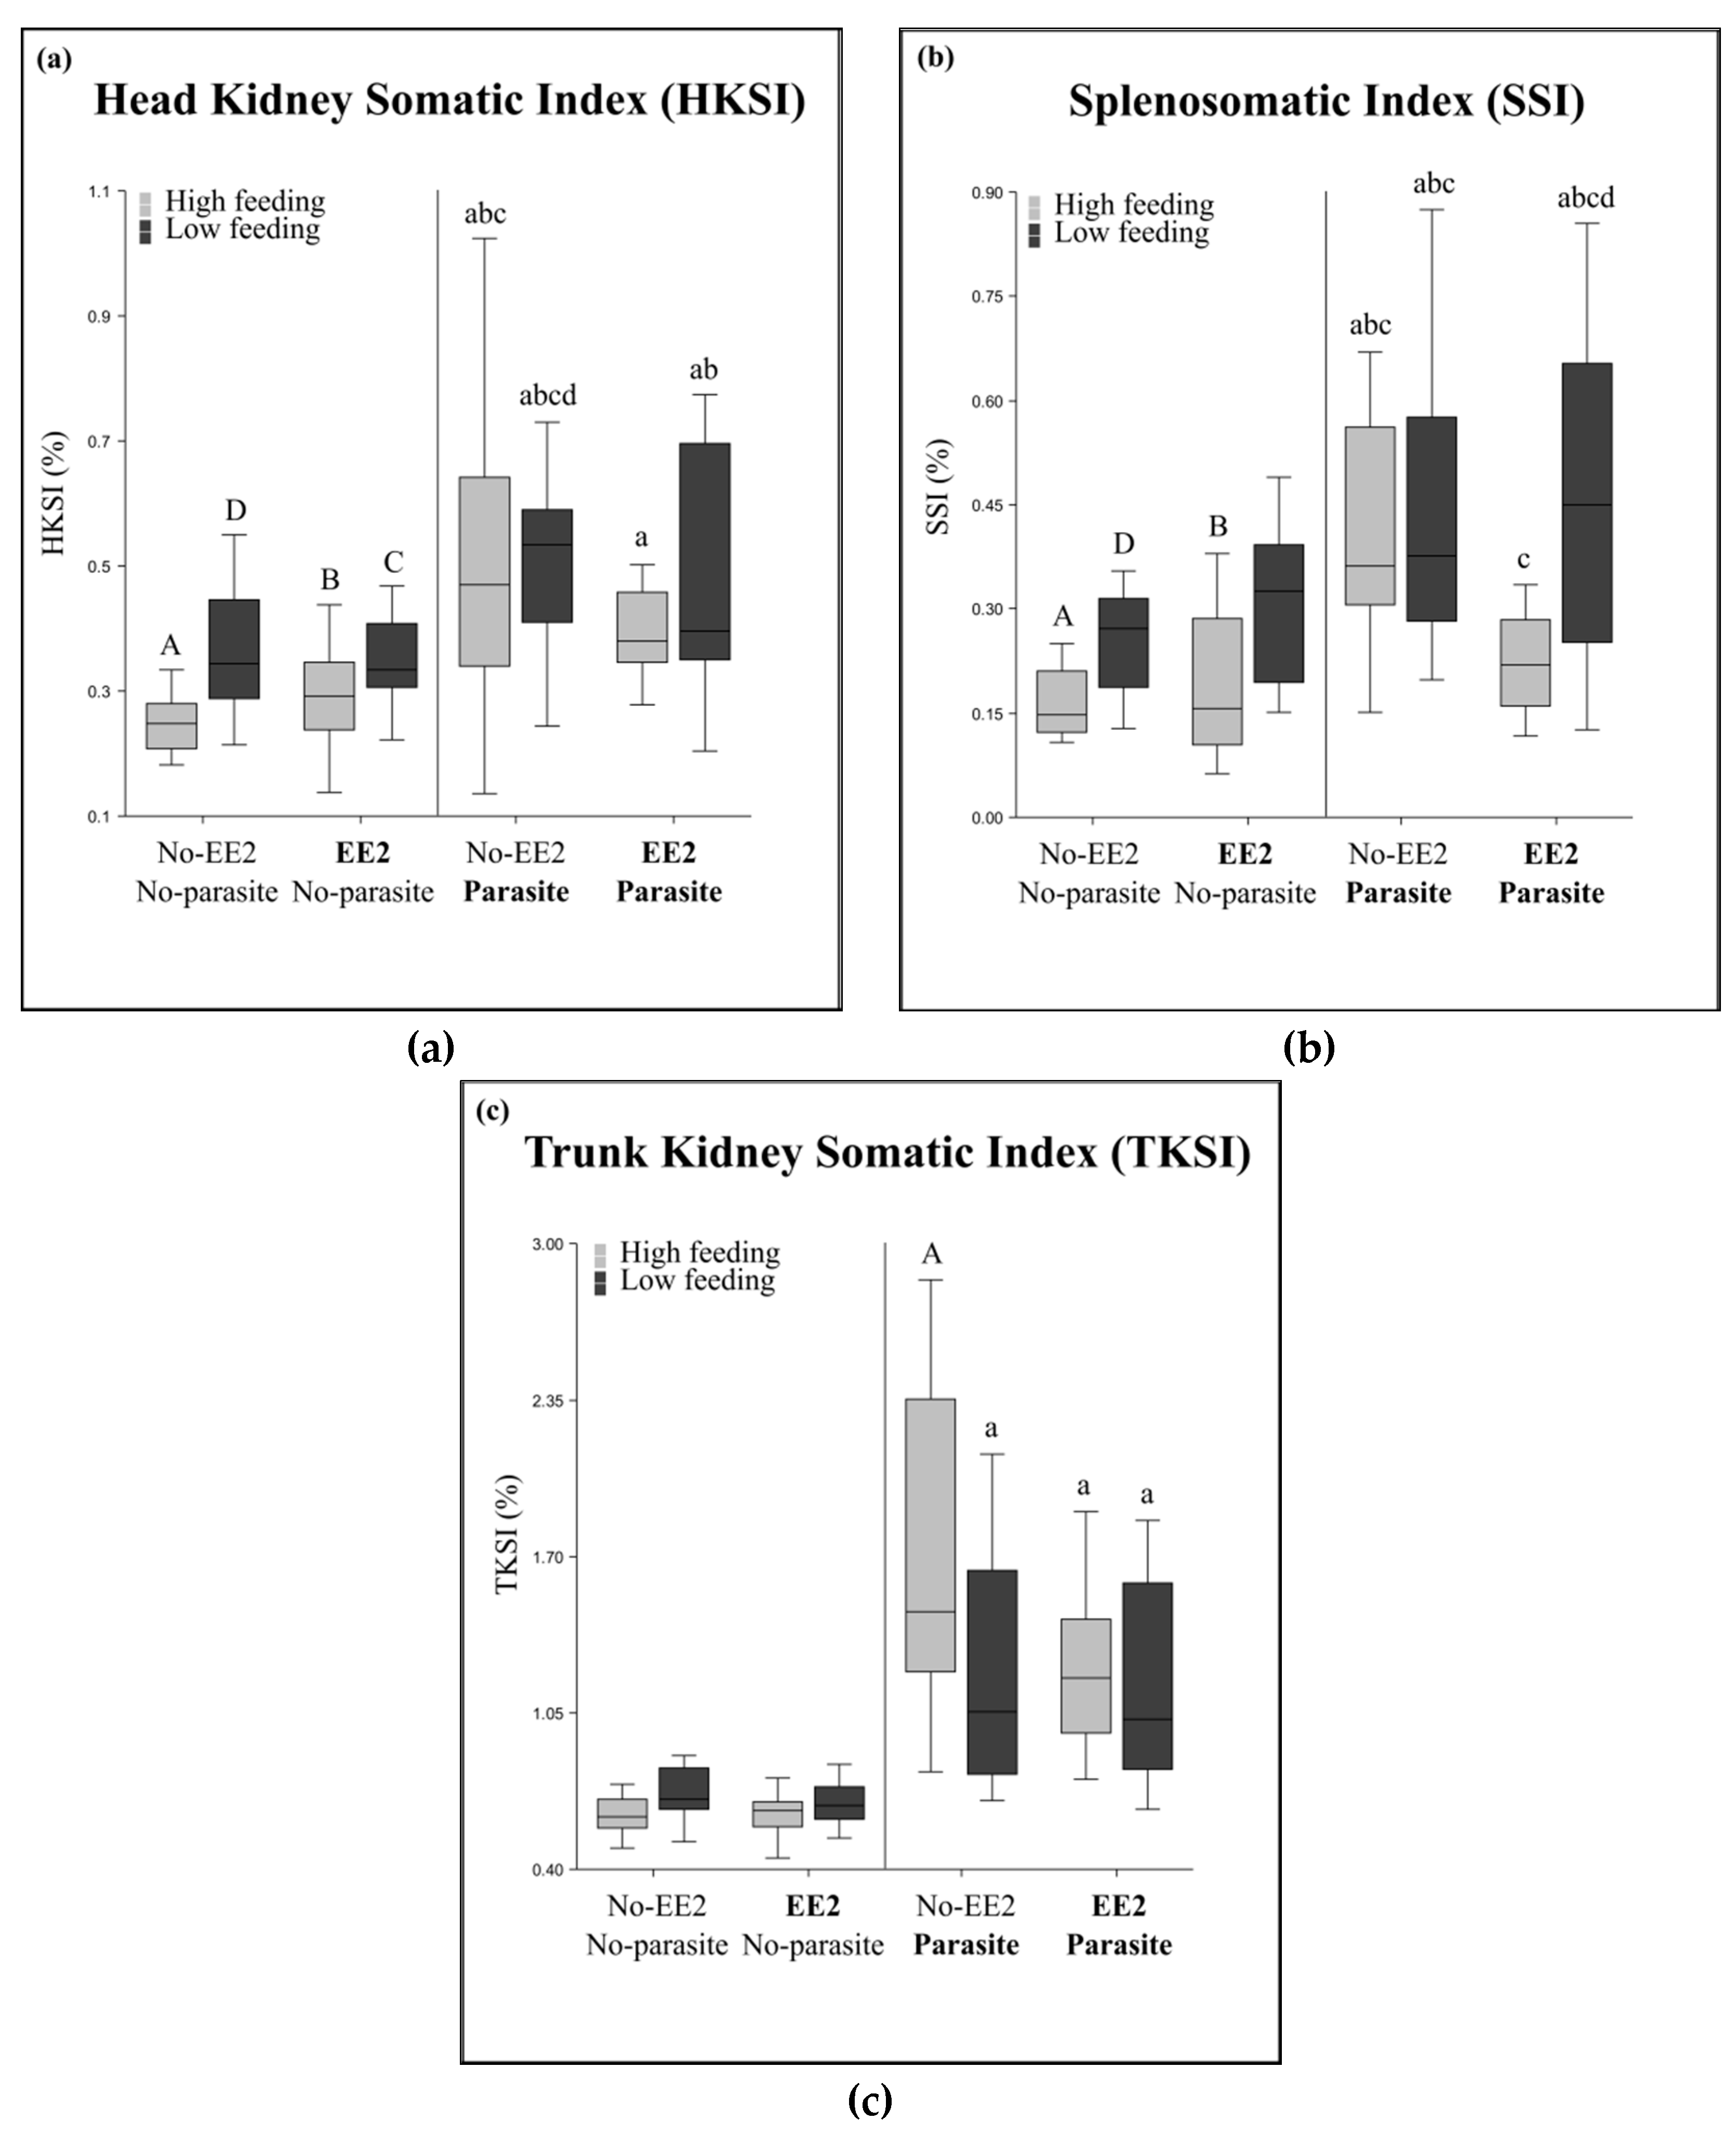
2.3. Immune System and Infection Status
2.4. Analysis of Treatment Effects
2.5. Negative Correlations between the Parameters Related to Growth, Immunity, and Contaminant-Induced Vitellogenesis
2.6. Principal Component Analysis
3. Discussion
3.1. Effects of Reduced Food Availability
3.2. Effects of Parasite Infection
3.3. Effects of the Contaminant Exposure
3.4. Effects of the Combinations of Stressors
4. Materials and Methods
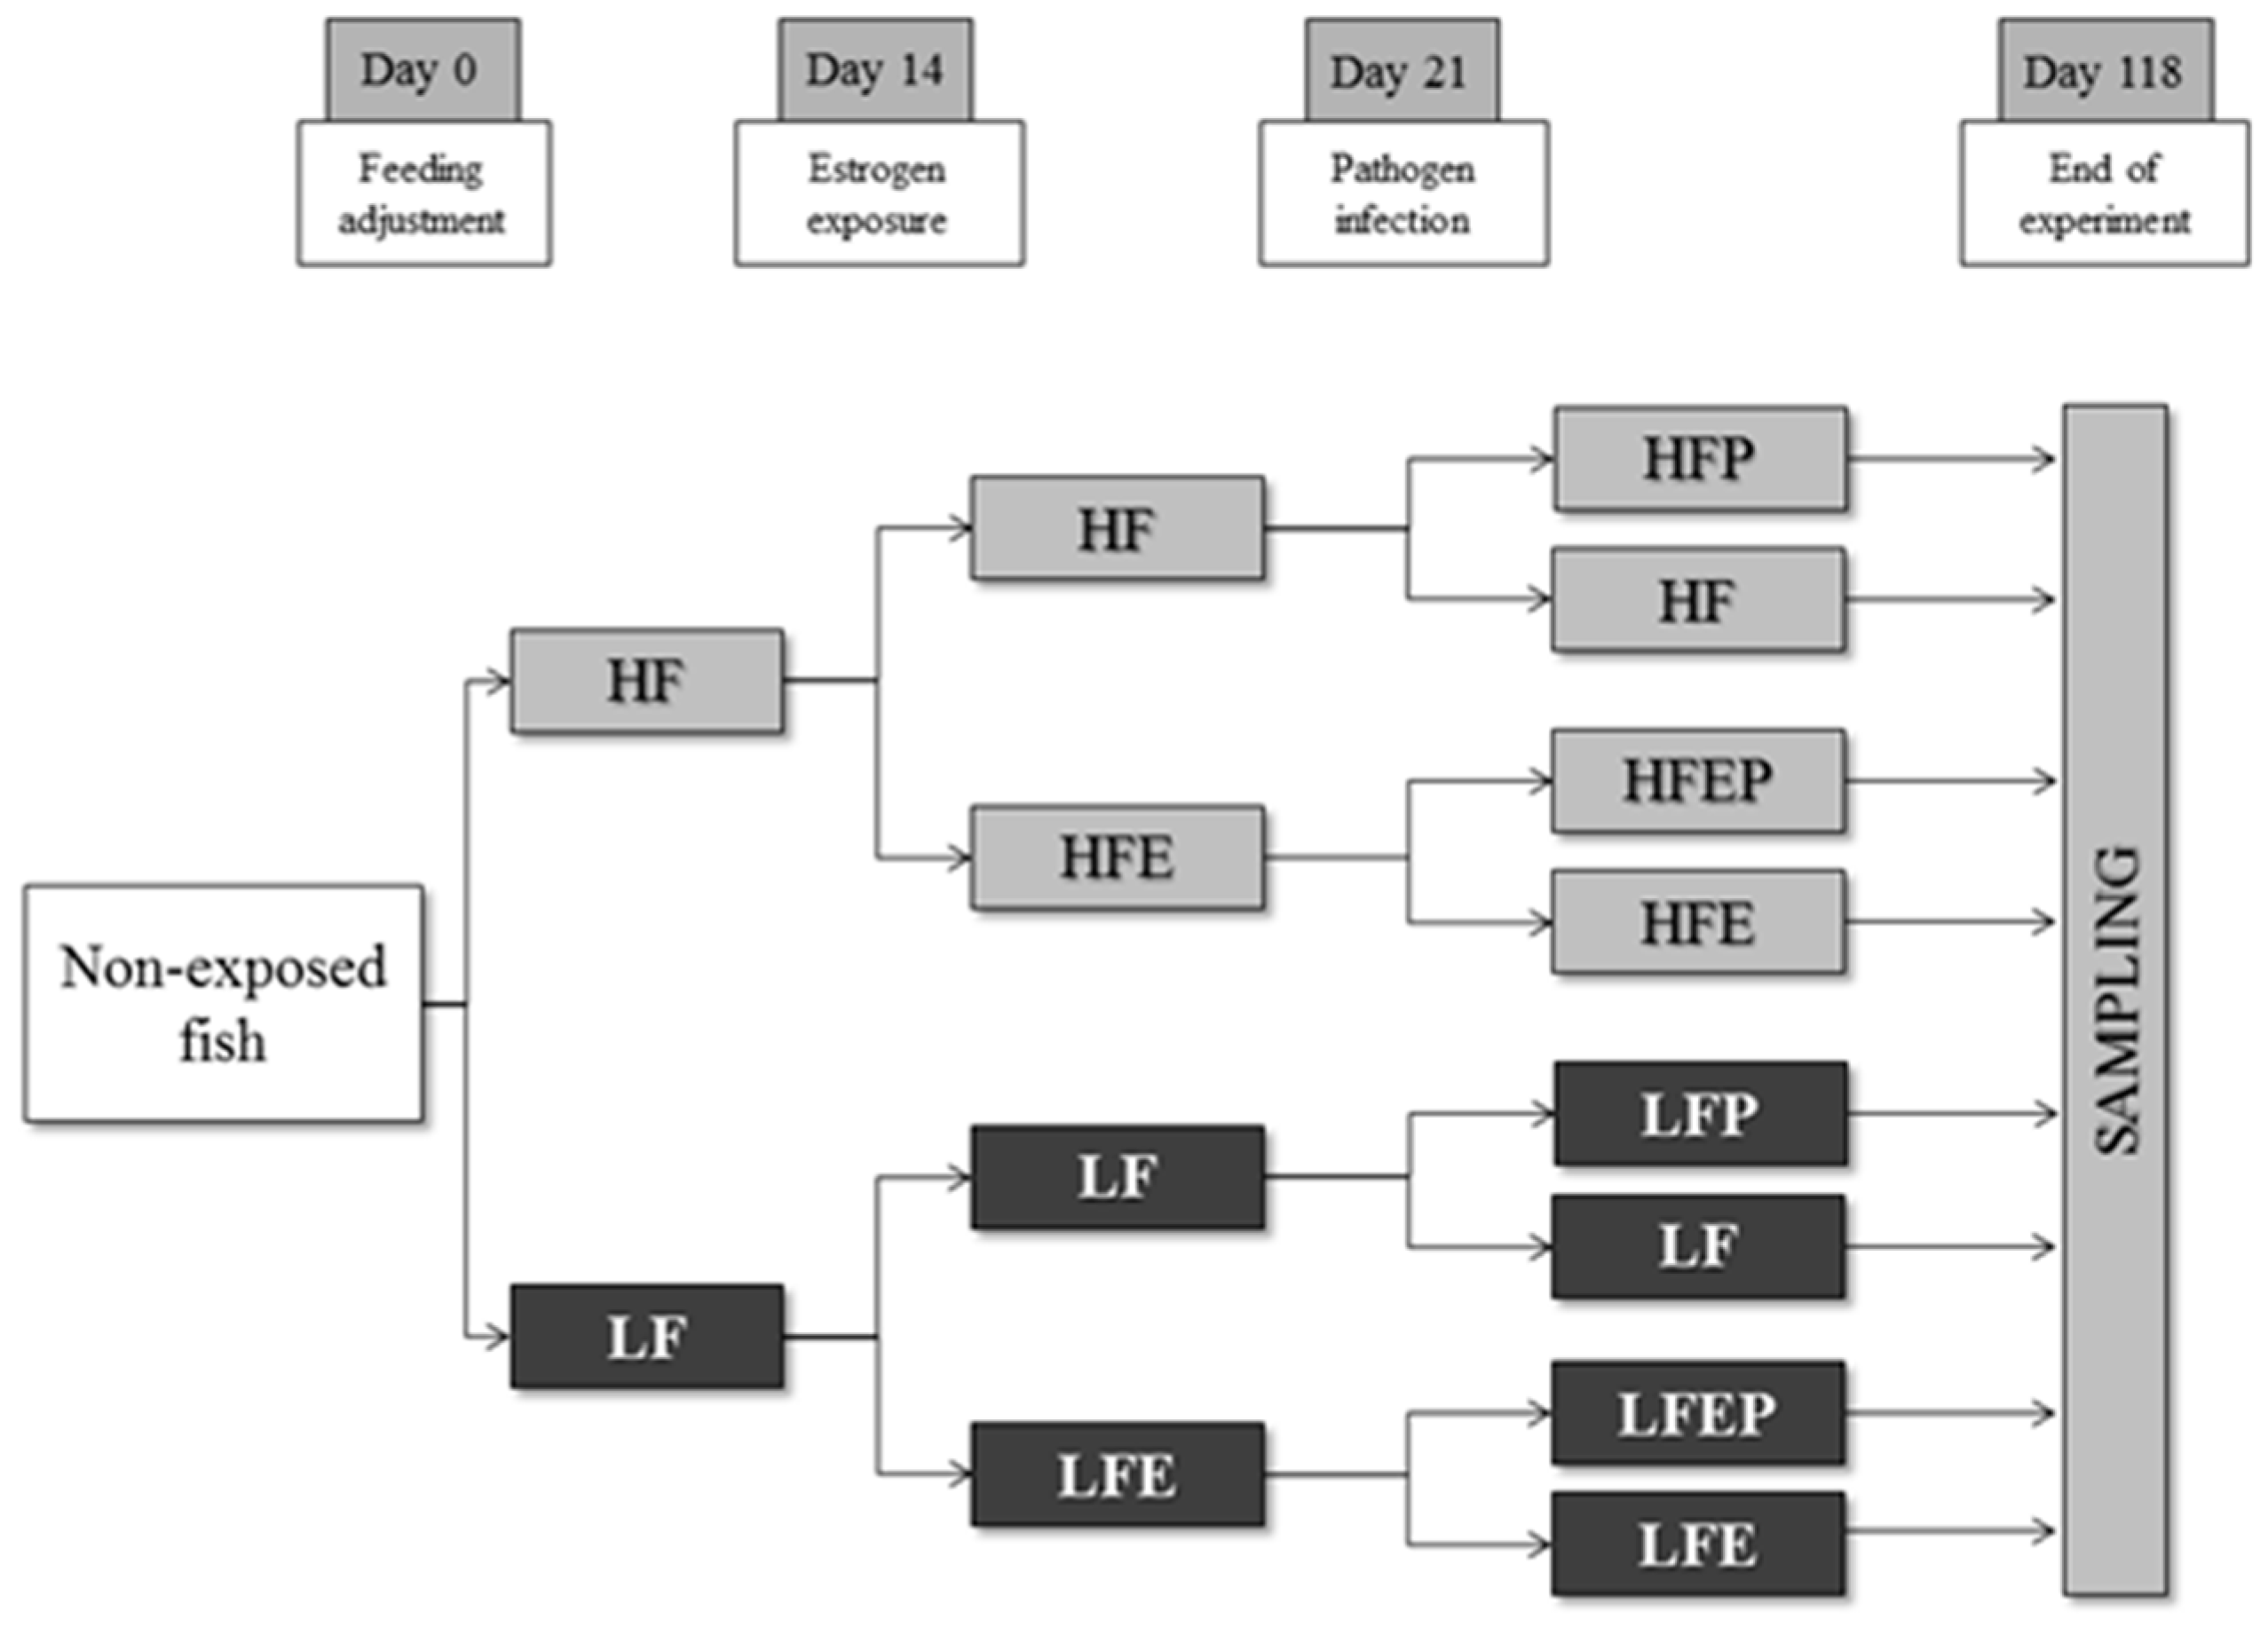
4.1. Experimental Design
4.2. Animal Care
4.3. Feeding Regimes
4.4. Ethinylestradiol (EE2) Exposure
4.5. Analytical Determination of the EE2 Concentrations in the Tank Water
4.6. Parasite Exposure
4.7. Fish Sampling
4.8. Gene Expression of Immune System Related Genes and IGF-1
4.8.1. RNA Isolation
4.8.2. cDNA Synthesis and RT-qPCR Analysis
4.9. Statistics
Supplementary Materials
Author Contributions
Funding
Acknowledgments
Conflicts of Interest
References
- Seebacher, F.; Franklin, C.E. Determining environmental causes of biological effects: The need for a mechanistic physiological dimension in conservation biology. Phil. Trans. R. Soc. B: Biol. Sci. 2012, 367, 1607–1614. [Google Scholar] [CrossRef] [PubMed]
- Jokela, J.; Mutikainen, P. Phenotypic plasticity and priority rules for energy allocation in a freshwater clam: A field experiment. Oecologia 1995, 104, 122–132. [Google Scholar] [CrossRef] [PubMed]
- Murren, C.J.; Auld, J.R.; Callahan, H.; Ghalambor, C.K.; Handelsman, C.A.; Heskel, M.A.; Kingsolver, J.G.; Maclean, H.J.; Masel, J.; Maughan, H.; et al. Constraints on the evolution of phenotypic plasticity: Limits and costs of phenotype and plasticity. Heredity 2015, 115, 293. [Google Scholar] [CrossRef] [PubMed]
- Relyea, R.A. Morphological and behavioural plasticity of larval anurans in response to different predators. Ecology 2001, 82, 523–540. [Google Scholar] [CrossRef]
- DeWitt, T.J.; Sih, A.; Wilson, D.S. Costs and limits of phenotypic plasticity. Trends Ecol. Evol. 1998, 13, 77–81. [Google Scholar] [CrossRef]
- Stearns, S.C. Trade-Offs in Life-History Evolution. Funct. Ecol. 1989, 3, 259–268. [Google Scholar] [CrossRef]
- Martin, L.B.; Weil, Z.M.; Nelson, R.J. Seasonal changes in vertebrate immune activity: Mediation by physiological trade-offs. Phil. Trans. R. Soc. B: Biol. Sci. 2008, 363, 321–339. [Google Scholar] [CrossRef] [PubMed]
- Buehler, D.M.; Encinas-Viso, F.; Petit, M.; Vézina, F.; Tieleman, B.I.; Piersma, T. Limited Access to Food and Physiological Trade-Offs in a Long-Distance Migrant Shorebird. II. Constitutive Immune Function and the Acute-Phase Response. Physiol. Biochem. Zool. 2009, 82, 561–571. [Google Scholar] [CrossRef] [PubMed]
- Sheldon, B.C.; Verhulst, S. Ecological immunology: Costly parasite defences and trade-offs in evolutionary ecology. Trends Ecol. Evol. 1996, 11, 317–321. [Google Scholar] [CrossRef]
- Zera, A.J.; Harshman, L.G. The physiology of life history trade-offs in animals. Annu. Rev. Ecol. Syst. 2001, 32, 95–126. [Google Scholar] [CrossRef]
- Schmid-Hempel, P. Variation in immune defence as a question of evolutionary ecology. Proc. R. Soc. Lond. Ser. B: Biol. Sci. 2003, 270, 357–366. [Google Scholar] [CrossRef] [PubMed] [Green Version]
- Nordling, D.; Andersson, M.; Zohari, S.; Lars, G. Reproductive effort reduces specific immune response and parasite resistance. Proc. R. Soc. Lond. Ser. B: Biol. Sci. 1998, 265, 1291–1298. [Google Scholar] [CrossRef] [Green Version]
- Oppliger, A.; Clobert, J.; Lecomte, J.; Lorenzon, P.; Boudjemadi, K.; John-Alder, H. Environmental stress increases the prevalence and intensity of blood parasite infection in the common lizard Lacerta vivipara. Ecol. Lett. 1998, 1, 129–138. [Google Scholar] [CrossRef]
- Rauw, W. Immune response from a resource allocation perspective. Front. Genet. 2012, 3, 267. [Google Scholar] [CrossRef] [PubMed]
- Hau, M. Regulation of male traits by testosterone: Implications for the evolution of vertebrate life histories. BioEssays 2007, 29, 133–144. [Google Scholar] [CrossRef] [PubMed]
- Finch, C.E.; Rose, M.R. Hormones and the physiological architecture of life history evolution. Q. Rev. Biol. 1995, 70, 1–52. [Google Scholar] [CrossRef] [PubMed]
- French, S.S.; DeNardo, D.F.; Moore, M.C. Trade-offs between the reproductive and immune systems: Facultative responses to resources or obligate responses to reproduction? Am. Nat. 2007, 170, 79–89. [Google Scholar] [PubMed]
- McCallum, M.L.; Trauth, S.E. Physiological trade-offs between immunity and reproduction in the northern cricket frog (Acris crepitans). Herpetologica 2007, 63, 269–274. [Google Scholar] [CrossRef]
- Biro, P.A.; Abrahams, M.V.; Post, J.R.; Parkinson, E.A. Behavioural trade-offs between growth and mortality explain evolution of submaximal growth rates. J. Anim. Ecol. 2006, 75, 1165–1171. [Google Scholar] [CrossRef] [PubMed] [Green Version]
- Billerbeck, J.M.; Lankford, T.E.; Conover, D.O. Evolution of intrinsic growth and energy acquisition rates. I. Trade-offs with swimming performance in Menidia menidia. Evolution 2001, 55, 1863–1872. [Google Scholar] [CrossRef] [PubMed]
- Lea, E.V.; Mee, J.A.; Post, J.R.; Rogers, S.M.; Mogensen, S. Rainbow trout in seasonal environments: Phenotypic trade-offs across a gradient in winter duration. Ecol. Evol. 2015, 5, 4778–4794. [Google Scholar] [CrossRef] [PubMed]
- Handy, R.; Sims, D.; Giles, A.; Campbell, H.; Musonda, M. Metabolic trade-off between locomotion and detoxification for maintenance of blood chemistry and growth parameters by rainbow trout (Oncorhynchus mykiss) during chronic dietary exposure to copper. Aquat. Toxicol. 1999, 47, 23–41. [Google Scholar] [CrossRef]
- Lester, N.; Shuter, B.; Abrams, P. Interpreting the von Bertalanffy model of somatic growth in fishes: The cost of reproduction. Proc. R. Soc. Lond. B: Biol. Sci. 2004, 271, 1625–1631. [Google Scholar] [CrossRef] [PubMed]
- Heino, M.; Kaitala, V. Evolution of resource allocation between growth and reproduction in animals with indeterminate growth. J. Evol. Biol. 1999, 12, 423–429. [Google Scholar] [CrossRef]
- Soler, J.J.; Peralta-Sánchez, J.M.; Martín-Platero, A.M.; Martín-Vivaldi, M.; Martínez-Bueno, M.; Møller, A.P. The evolution of size of the uropygial gland: Mutualistic feather mites and uropygial secretion reduce bacterial loads of eggshells and hatching failures of European birds. J. Evol. Biol. 2012, 25, 1779–1791. [Google Scholar] [CrossRef] [PubMed]
- Mauck, R.; Matson, K.; Philipsborn, J.; Ricklefs, R. Increase in the constitutive innate humoral immune system in Leach’s Storm-Petrel (Oceanodroma leucorhoa) chicks is negatively correlated with growth rate. Funct. Ecol. 2005, 19, 1001–1007. [Google Scholar] [CrossRef]
- Todgham, A.E.; Stillman, J.H. Physiological responses to shifts in multiple environmental stressors: Relevance in a changing world. Integr. Comp. Biol. 2013, 53, 539–544. [Google Scholar] [CrossRef] [PubMed]
- Marteinson, S.C.; Marcogliese, D.J.; Verreault, J. Multiple stressors including contaminant exposure and parasite infection predict spleen mass and energy expenditure in breeding ring-billed gulls. Comp. Biochem. Physiol. Part C: Toxicol. Pharmacol. 2017, 200, 42–51. [Google Scholar] [CrossRef] [PubMed]
- Burki, R.; Krasnov, A.; Bettge, K.; Rexroad, C.E.; Afanasyev, S.; Antikainen, M.; Burkhardt-Holm, P.; Wahli, T.; Segner, H. Molecular crosstalk between a chemical and a biological stressor and consequences on disease manifestation in rainbow trout. Aquat. Toxicol. 2013, 127, 2–8. [Google Scholar] [CrossRef] [PubMed]
- Segner, H.; Schmitt-Jansen, M.; Sabater, S. Assessing the impact of multiple stressors on aquatic biota: The receptor’s side matters. Environ. Sci. Technol. 2014, 48, 7690–7696. [Google Scholar] [CrossRef] [PubMed]
- Jalabert, B. Particularities of reproduction and oogenesis in teleost fish compared to mammals. Reprod. Nutr. Dev. 2005, 45, 261–279. [Google Scholar] [CrossRef] [PubMed] [Green Version]
- Segner, H.; Verburg-van Kemenade, B.L.; Chadzinska, M. The immunomodulatory role of the hypothalamus-pituitary-gonad axis: Proximate mechanism for reproduction-immune trade offs? Dev. Comp. Immunol. 2017, 66, 43–60. [Google Scholar] [CrossRef] [PubMed]
- Rauta, P.R.; Nayak, B.; Das, S. Immune system and immune responses in fish and their role in comparative immunity study: A model for higher organisms. Immunol. Lett. 2012, 148, 23–33. [Google Scholar] [CrossRef] [PubMed]
- Van de Pol, I.; Flik, G.; Gorissen, M. Comparative Physiology of Energy Metabolism: Fishing for Endocrine Signals in the Early Vertebrate Pool. Front. Endocrinol. 2017, 8, 36. [Google Scholar] [CrossRef] [PubMed]
- Cossins, A.; Fraser, J.; Hughes, M.; Gracey, A. Post-genomic approaches to understanding the mechanisms of environmentally induced phenotypic plasticity. J. Exp. Biol. 2006, 209, 2328–2336. [Google Scholar] [CrossRef] [PubMed] [Green Version]
- Neuman-Lee, L.A.; French, S.S. Endocrine-reproductive-immune interactions in female and male Galápagos marine iguanas. Horm. Behav. 2017, 88, 60–69. [Google Scholar] [CrossRef] [PubMed]
- Dudgeon, D.; Arthington, A.H.; Gessner, M.O.; Kawabata, Z.-I.; Knowler, D.J.; Lévêque, C.; Naiman, R.J.; Prieur-Richard, A.-H.; Soto, D.; Stiassny, M.L. Freshwater biodiversity: Importance, threats, status and conservation challenges. Biol. Rev. 2006, 81, 163–182. [Google Scholar] [CrossRef] [PubMed]
- Winfield, I.J.; Baigún, C.; Balykin, P.A.; Becker, B.; Chen, Y.; Filipe, A.F.; Gerasimov, Y.V.; Godinho, A.L.; Hughes, R.M.; Koehn, J.D. International perspectives on the effects of climate change on inland fisheries. Fisheries 2016, 41, 399–405. [Google Scholar] [CrossRef]
- Joy, M.K.; Foote, K.J.; McNie, P.; Piria, M. Decline in New Zealand’s freshwater fish fauna: Effect of land use. Mar. Freshw. Res. 2018, 70, 114–124. [Google Scholar] [CrossRef]
- Cooke, S.J.; Paukert, C.; Hogan, Z. Endangered river fish: Factors hindering conservation and restoration. Endangered Spec. Res. 2012, 17, 179–191. [Google Scholar] [CrossRef]
- Lawrence, K.E.; Leathwick, D.M.; Rhodes, A.P.; Jackson, R.; Heuer, C.; Pomroy, W.E.; West, D.M.; Waghorn, T.S.; Moffat, J.R. Management of gastrointestinal nematode parasites on sheep farms in New Zealand. N. Z. Vet. J. 2007, 55, 228–234. [Google Scholar] [CrossRef] [PubMed]
- Beyers, D.W.; Rice, J.A.; Clements, W.H.; Henry, C.J. Estimating physiological cost of chemical exposure: Integrating energetics and stress to quantify toxic effects in fish. Can. J. Fish. Aquat. Sci. 1999, 56, 814–822. [Google Scholar] [CrossRef]
- Kennedy, C.J.; Tierney, K.B. Xenobiotic Protection xenobiotic protection /Resistance Mechanisms in Organisms. In Encyclopedia of Sustainability Science and Technology; Meyers, R.A., Ed.; Springer: New York, NY, USA, 2012; pp. 12293–12314. [Google Scholar]
- Burki, R.; Krasnov, A.; Bettge, K.; Rexroad, C.E.; Afanasyev, S.; Antikainen, M.; Burkhardt-Holm, P.; Wahli, T.; Segner, H. Pathogenic infection confounds induction of the estrogenic biomarker vitellogenin in rainbow trout. Environ. Toxicol. Chem. 2012, 31, 2318–2323. [Google Scholar] [CrossRef] [PubMed]
- McBride, R.S.; Vidal, T.E.; Cadrin, S.X. Changes in size and age at maturity of the northern stock of Tilefish (Lopholatilus chamaeleonticeps) after a period of overfishing. Fish. Bull. 2013, 111, 161–174. [Google Scholar] [CrossRef]
- Van Dyke, J.U.; Beaupre, S.J. Bioenergetic components of reproductive effort in viviparous snakes: Costs of vitellogenesis exceed costs of pregnancy. Comp. Biochem. Physiol. Part A: Mol. Integr. Physiol. 2011, 160, 504–515. [Google Scholar] [CrossRef] [PubMed]
- Liarte, S.; Chaves-Pozo, E.; Abellán, E.; Meseguer, J.; Mulero, V.; García-Ayala, A. 17β-Estradiol regulates gilthead seabream professional phagocyte responses through macrophage activation. Dev. Comp. Immunol. 2011, 35, 19–27. [Google Scholar] [CrossRef] [PubMed]
- Bazzaz, F.A.; Chiariello, N.R.; Coley, P.D.; Pitelka, L.F. Allocating resources to reproduction and defense. BioScience 1987, 37, 58–67. [Google Scholar] [CrossRef]
- Bettge, K.; Wahli, T.; Segner, H.; Schmidt-Posthaus, H. Proliferative kidney disease in rainbow trout: Time-and temperature-related renal pathology and parasite distribution. Dis. Aquat. Org. 2009, 83, 67–76. [Google Scholar] [CrossRef] [PubMed]
- Ferguson, H. The effects of water temperature on the development of proliferative kidney disease in rainbow trout, Salmo gairdneri Richardson. J. Fish Dis. 1981, 4, 175–177. [Google Scholar] [CrossRef]
- Bailey, C.; Segner, H.; Casanova-Nakayama, A.; Wahli, T. Who needs the hotspot? The effect of temperature on the fish host immune response to Tetracapsuloides bryosalmonae the causative agent of proliferative kidney disease. Fish Shellfish Immunol. 2017, 63, 424–437. [Google Scholar] [CrossRef] [PubMed]
- Bailey, C.; Segner, H.; Wahli, T. What goes around comes around: An investigation of resistance to proliferative kidney disease in rainbow trout Oncorhynchus mykiss (Walbaum) following experimental re-exposure. J. Fish Dis. 2017, 40, 1599–1612. [Google Scholar] [CrossRef] [PubMed]
- Burkhardt-Holm, P.; Giger, W.; GUttinger, H.; Ochsenbein, U.; Peter, A.; Scheurer, K.; Segner, H.; Staub, E.; Suter, M.J.-F. Where have all the fish gone? Environ. Sci. Technol. 2005, 39, 441–447. [Google Scholar] [CrossRef]
- Demas, G.E.; Zysling, D.A.; Beechler, B.R.; Muehlenbein, M.P.; French, S.S. Beyond phytohaemagglutinin: Assessing vertebrate immune function across ecological contexts. J. Anim. Ecol. 2011, 80, 710–730. [Google Scholar] [CrossRef] [PubMed]
- Beamish, R.J.; Mahnken, C.; Neville, C. Evidence that reduced early marine growth is associated with lower marine survival of coho salmon. Trans. Am. Fish. Soc. 2004, 133, 26–33. [Google Scholar] [CrossRef]
- Hurst, T.P. Causes and consequences of winter mortality in fishes. J. Fish Biol. 2007, 71, 315–345. [Google Scholar] [CrossRef]
- Gorgoglione, B.; Wang, T.; Secombes, C.J.; Holland, J.W. Immune gene expression profiling of proliferative kidney disease in rainbow trout Oncorhynchus mykiss reveals a dominance of anti-inflammatory, antibody and T helper cell-like activities. Vet. Res. 2013, 44, 55. [Google Scholar] [CrossRef] [PubMed]
- Bruneaux, M.; Visse, M.; Gross, R.; Pukk, L.; Saks, L.; Vasemägi, A. Parasite infection and decreased thermal tolerance: Impact of proliferative kidney disease on a wild salmonid fish in the context of climate change. Funct. Ecol. 2017, 31, 216–226. [Google Scholar] [CrossRef]
- Gimbo, R.Y.; Fávero, G.C.; Franco Montoya, L.N.; Urbinati, E.C. Energy deficit does not affect immune responses of experimentally infected pacu (Piaractus mesopotamicus). Fish Shellfish Immunol. 2015, 43, 295–300. [Google Scholar] [CrossRef] [PubMed]
- Jolly, C.A. Dietary Restriction and Immune Function. J. Nutr. 2004, 134, 1853–1856. [Google Scholar] [CrossRef] [PubMed]
- Fernandes, G.; Venkatraman, J.T.; Turturro, A.; Attwood, V.G.; Hart, R.W. Effect of food restriction on life span and immune functions in long-lived Fischer-344 x Brown Norway F1 rats. J. Clin. Immunol. 1997, 17, 85–95. [Google Scholar] [CrossRef] [PubMed]
- Messaoudi, I.; Warner, J.; Fischer, M.; Park, B.; Hill, B.; Mattison, J.; Lane, M.A.; Roth, G.S.; Ingram, D.K.; Picker, L.J.; et al. Delay of T cell senescence by caloric restriction in aged long-lived nonhuman primates. Proc. Natl. Acad. Sci. USA 2006, 103, 19448–19453. [Google Scholar] [CrossRef] [PubMed] [Green Version]
- Fedorka, K.M. Reproductive and immune system interactions in the context of life history and sexual selection theory. Eco-Immunology 2014, 3, 49–72. [Google Scholar]
- Lochmiller, R.L.; Deerenberg, C. Trade-offs in evolutionary immunology: Just what is the cost of immunity? Oikos 2000, 88, 87–98. [Google Scholar] [CrossRef]
- Kekäläinen, J.; Pirhonen, J.; Taskinen, J. Do highly ornamented and less parasitized males have high quality sperm?—An experimental test for parasite-induced reproductive trade-offs in European minnow (Phoxinus phoxinus). Ecol. Evol. 2014, 4, 4237–4246. [Google Scholar] [CrossRef] [PubMed]
- Ollion, E.; Ingrand, S.; Delaby, L.; Trommenschlager, J.M.; Colette-Leurent, S.; Blanc, F. Assessing the diversity of trade-offs between life functions in early lactation dairy cows. Livest. Sci. 2016, 183, 98–107. [Google Scholar] [CrossRef]
- Mills, S.C.; Grapputo, A.; Jokinen, I.; Koskela, E.; Mappes, T.; Poikonen, T. Fitness trade-offs mediated by immunosuppression costs in a small mammal. Evolution 2010, 64, 166–179. [Google Scholar] [CrossRef] [PubMed]
- Zysling, D.A.; Garst, A.D.; Demas, G.E. Photoperiod and food restriction differentially affect reproductive and immune responses in Siberian hamsters Phodopus sungorus. Funct. Ecol. 2009, 23, 979–988. [Google Scholar] [CrossRef]
- Hicks, O.; Burthe, S.J.; Daunt, F.; Newell, M.; Butler, A.; Ito, M.; Sato, K.; Green, J.A. The energetic cost of parasitism in a wild population. Proc. R. Soc. B: Biol. Sci. 2018, 285, 20180489. [Google Scholar] [CrossRef] [PubMed] [Green Version]
- Viney, M.E.; Riley, E.M. From immunology to eco-immunology: More than a new name. Eco-Immunology 2014, 1, 1–19. [Google Scholar]
- King, M.O.; Swanson, D.L. Activation of the immune system incurs energetic costs but has no effect on the thermogenic performance of house sparrows during acute cold challenge. J. Exp. Biol. 2013, 079574. [Google Scholar] [CrossRef] [PubMed]
- Williams, T.D.; Christians, J.K.; Aiken, J.J.; Evanson, M. Enhanced immune function does not depress reproductive output. Proc. R. Soc. Lond. Ser. B: Biol. Sci. 1999, 266, 753–757. [Google Scholar] [CrossRef] [Green Version]
- Garland, T., Jr. Trade-offs. Curr. Biol. 2014, 24, R60–R61. [Google Scholar] [CrossRef] [PubMed]
- Tschirren, B.; Saladin, V.; Fitze, P.S.; Schwabl, H.; Richner, H. Maternal yolk testosterone does not modulate parasite susceptibility or immune function in great tit nestlings. J. Anim. Ecol. 2005, 74, 675–682. [Google Scholar] [CrossRef] [Green Version]
- Agrawal, A.A. Phenotypic Plasticity in the Interactions and Evolution of Species. Science 2001, 294, 321–326. [Google Scholar] [CrossRef] [PubMed] [Green Version]
- Bonnet, X.; Bradshaw, D.; Shine, R. Capital versus Income Breeding: An Ectothermic Perspective. Oikos 1998, 83, 333–342. [Google Scholar] [CrossRef]
- Venesky, M.D.; Wilcoxen, T.E.; Rensel, M.A.; Rollins-Smith, L.; Kerby, J.L.; Parris, M.J. Dietary protein restriction impairs growth, immunity, and disease resistance in southern leopard frog tadpoles. Oecologia 2012, 169, 23–31. [Google Scholar] [CrossRef] [PubMed]
- Strepparava, N.; Segner, H.; Ros, A.; Hartikainen, H.; Schmidt-Posthaus, H.; Wahli, T. Temperature-related parasite infection dynamics: The case of proliferative kidney disease of brown trout. Parasitology 2018, 145, 281–291. [Google Scholar] [CrossRef] [PubMed]
- Schmittgen, T.D.; Livak, K.J. Analyzing real-time PCR data by the comparative C T method. Nat. Protoc. 2008, 3, 1101. [Google Scholar] [CrossRef] [PubMed]
- Kropf, C.; Segner, H.; Fent, K. ABC transporters and xenobiotic defense systems in early life stages of rainbow trout (Oncorhynchus mykiss). Comp. Biochem. Physiol. Part C: Toxicol. Pharmacol. 2016, 185–186, 45–56. [Google Scholar] [CrossRef] [PubMed]
- Díaz-Rosales, P.; Bird, S.; Wang, T.H.; Fujiki, K.; Davidson, W.S.; Zou, J.; Secombes, C.J. Rainbow trout interleukin-2: Cloning, expression and bioactivity analysis. Fish Shellfish Immunol. 2009, 27, 414–422. [Google Scholar] [CrossRef] [PubMed]
- Zhang, H.; Evenhuis, J.P.; Thorgaard, G.H.; Ristow, S.S. Cloning, characterization and genomic structure of the natural killer cell enhancement factor (NKEF)-like gene from homozygous clones of rainbow trout (Oncorhynchus mykiss). Dev. Comp. Immunol. 2001, 25, 25–35. [Google Scholar] [CrossRef]
- Chauvigné, F.; Gabillard, J.C.; Weil, C.; Rescan, P.Y. Effect of refeeding on IGFI, IGFII, IGF receptors, FGF2, FGF6, and myostatin mRNA expression in rainbow trout myotomal muscle. Gen. Comp. Endocrinol. 2003, 132, 209–215. [Google Scholar] [CrossRef]


| Stressor | Life-History Trait | Parameters |
|---|---|---|
| Food availability | Growth | Condition factor, IGF-1 expression |
| Toxicant (EE2) exposure | Induced protein synthesis costs (vitellogenesis) | Hepatic vitellogenesis, liver somatic index |
| Parasitic infection | Immune parameters | Head kidney somatic index, trunk kidney somatic index, splenosomatic index, expression of immune genes |
| EE2 Exposure | Parasitic Infection | EE2 Exposure x Parasitic Infection | Feeding Level | EE2 Exposure x Feeding Level | Parasitic Infection x Feeding level | EE2 Exposure x Parasitic Infection x Feeding Level | |||||||||||||||
|---|---|---|---|---|---|---|---|---|---|---|---|---|---|---|---|---|---|---|---|---|---|
| PARAMETER | DF | F-Ratio | Prob Level | DF | F-Ratio | Prob Level | DF | F-Ratio | Prob Level | DF | F-Ratio | Prob Level | DF | F-Ratio | Prob Level | DF | F-Ratio | Prob Level | DF | F-Ratio | Prob Level |
| Condition factor (K) | 1 | 0.12 | 0.73 | 1 | 1.18 | 0.28 | 1 | 0.29 | 0.59 | 1 | 35.53 | 0.00 * | 1 | 1.55 | 0.22 | 1 | 1.79 | 0.18 | 1 | 0.87 | 0.35 |
| HKSI (%) | 1 | 1.18 | 0.28 | 1 | 47.22 | 0.00 * | 1 | 2.97 | 0.09 | 1 | 7.05 | 0.01* | 1 | 0.01 | 0.91 | 1 | 0.5 | 0.48 | 1 | 2.37 | 0.13 |
| TKSI (%) | 1 | 4.71 | 0.03* | 1 | 113.63 | 0.00 * | 1 | 3.54 | 0.06 | 1 | 2.98 | 0.08 | 1 | 2.01 | 0.16 | 1 | 8.36 | 0.00* | 1 | 3.57 | 0.06 |
| LSI (%) | 1 | 30.26 | 0.00* | 1 | 39.05 | 0.00 * | 1 | 0.65 | 0.42 | 1 | 8.14 | 0.01 * | 1 | 6.44 | 0.01 * | 1 | 0.18 | 0.67 | 1 | 3.49 | 0.06 |
| SSI (%) | 1 | 1.09 | 0.29 | 1 | 32.46 | 0.00 * | 1 | 3.61 | 0.06 | 1 | 21.81 | 0.00 * | 1 | 3.55 | 0.06 | 1 | 0 | 0.95 | 1 | 3.61 | 0.06 |
| Liver IGF-1 (-ddCt) | 1 | 33.87 | 0.00* | 1 | 10.37 | 0.00* | 1 | 0.31 | 0.57 | 1 | 41.69 | 0.00 * | 1 | 0.17 | 0.68 | 1 | 1.03 | 0.31 | 1 | 12.91 | 0.00* |
| Liver vtg (-ddCt) | 1 | 4794.73 | 0.00* | 1 | 2.07 | 0.15 | 1 | 1.35 | 0.24 | 1 | 10.73 | 0.00 * | 1 | 4.66 | 0.03* | 1 | 0.33 | 0.56 | 1 | 0.04 | 0.83 |
| NKEF(-ddCt) | 1 | 0.68 | 0.41 | 1 | 51.73 | 0.00 * | 1 | 0.32 | 0.57 | 1 | 0.49 | 0.48 | 1 | 4.15 | 0.04 * | 1 | 0.01 | 0.92 | 1 | 1.11 | 0.29 |
| Blimp-1(-ddCt) | 1 | 0.18 | 0.67 | 1 | 171.88 | 0.00 * | 1 | 1.18 | 0.28 | 1 | 0.23 | 0.62 | 1 | 0.67 | 0.41 | 1 | 4.92 | 0.02* | 1 | 0.86 | 0.35 |
| IgM-sec (-ddCt) | 1 | 4.15 | 0.04* | 1 | 17.34 | 0.00 * | 1 | 3.02 | 0.08 | 1 | 0.04 | 0.83 | 1 | 0.2 | 0.65 | 1 | 0.71 | 0.40 | 1 | 1.83 | 0.17 |
| IL-10 (-ddCt) | 1 | 3.72 | 0.06 | 1 | 169.91 | 0.00 * | 1 | 0.5 | 0.48 | 1 | 0.01 | 0.93 | 1 | 0.03 | 0.86 | 1 | 9.49 | 0.00 * | 1 | 0.15 | 0.69 |
| Condition Factor (K) | HKSI (%) | TKSI (%) | LSI (%) | SSI (%) | Liver IGF-1 mRNA (-ddCt) | Liver vtg mRNA (-ddCt) | NKEF mRNA (-ddCt) | Blimp-1 mRNA (-ddCt) | IgM-sec mRNA (-ddCt) | IL-10 mRNA (-ddCt) | ||
|---|---|---|---|---|---|---|---|---|---|---|---|---|
| Condition Factor (K) | Correlation | 1.00 | −0.10 | 0.06 | 0.387 * | −0.235 * | 0.458 * | −0.02 | −0.17 | −0.05 | 0.05 | −0.03 |
| Significance | 0.00 | 0.25 | 0.54 | 0.00 | 0.01 | 0.00 | 0.87 | 0.06 | 0.60 | 0.59 | 0.72 | |
| n | 128.00 | 128.00 | 128.00 | 127.00 | 128.00 | 128.00 | 106.00 | 128.00 | 128.00 | 128.00 | 128.00 | |
| HKSI (%) | Correlation | −0.10 | 1.00 | 0.702 * | 0.274 * | 0.580 * | −0.291 * | 0.08 | 0.530 * | 0.693 * | 0.463 * | 0.658 * |
| Significance | 0.25 | 0.00 | 0.00 | 0.00 | 0.00 | 0.00 | 0.44 | 0.00 | 0.00 | 0.00 | 0.00 | |
| n | 128.00 | 128.00 | 128.00 | 127.00 | 128.00 | 128.00 | 106.00 | 128.00 | 128.00 | 128.00 | 128.00 | |
| TKSI (%) | Correlation | 0.06 | 0.702 * | 1.00 | 0.363 * | 0.569 * | −0.11 | −0.02 | 0.538 * | 0.792 * | 0.483 * | 0.744 * |
| Significance | 0.54 | 0.00 | 0.00 | 0.00 | 0.00 | 0.22 | 0.83 | 0.00 | 0.00 | 0.00 | 0.00 | |
| n | 128.00 | 128.00 | 128.00 | 127.00 | 128.00 | 128.00 | 106.00 | 128.00 | 128.00 | 128.00 | 128.00 | |
| LSI (%) | Correlation | 0.387 * | 0.274 * | 0.363 * | 1.00 | 0.10 | −0.10 | 0.444 * | 0.229 * | 0.358 * | 0.198 * | 0.408 * |
| Significance | 0.00 | 0.00 | 0.00 | 0.00 | 0.24 | 0.29 | 0.00 | 0.01 | 0.00 | 0.03 | 0.00 | |
| n | 127.00 | 127.00 | 127.00 | 127.00 | 127.00 | 127.00 | 106.00 | 127.00 | 127.00 | 127.00 | 127.00 | |
| SSI (%) | Correlation | −0.235 * | 0.580 * | 0.569 * | 0.10 | 1.00 | −0.302 * | 0.00 | 0.390 * | 0.542 * | 0.339 * | 0.516 * |
| Significance | 0.01 | 0.00 | 0.00 | 0.24 | 0.00 | 0.00 | 0.99 | 0.00 | 0.00 | 0.00 | 0.00 | |
| n | 128.00 | 128.00 | 128.00 | 127.00 | 128.00 | 128.00 | 106.00 | 128.00 | 128.00 | 128.00 | 128.00 | |
| Liver IGF-1 mRNA (-ddCt) | Correlation | 0.458 * | −0.291 * | −0.11 | −0.10 | −0.302 * | 1.00 | −0.356 * | −0.310 * | −0.360 * | −0.10 | −0.348 * |
| Significance | 0.00 | 0.00 | 0.22 | 0.29 | 0.00 | 0.00 | 0.00 | 0.00 | 0.00 | 0.27 | 0.00 | |
| n | 128.00 | 128.00 | 128.00 | 127.00 | 128.00 | 128.00 | 106.00 | 128.00 | 128.00 | 128.00 | 128.00 | |
| Liver vtg mRNA (-ddCt) | Correlation | −0.02 | 0.08 | −0.02 | 0.444 * | 0.00 | −0.356 * | 1.00 | −0.05 | 0.10 | −0.09 | 0.18 |
| Significance | 0.87 | 0.44 | 0.83 | 0.00 | 0.99 | 0.00 | 0.00 | 0.59 | 0.31 | 0.37 | 0.07 | |
| n | 106.00 | 106.00 | 106.00 | 106.00 | 106.00 | 106.00 | 106.00 | 106.00 | 106.00 | 106.00 | 106.00 | |
| NKEF mRNA (-ddCt) | Correlation | −0.17 | 0.530 * | 0.538 * | 0.229 * | 0.390 * | −0.310 * | −0.05 | 1.00 | 0.656 * | 0.458 * | 0.641 * |
| Significance | 0.06 | 0.00 | 0.00 | 0.01 | 0.00 | 0.00 | 0.59 | 0.00 | 0.00 | 0.00 | 0.00 | |
| n | 128.00 | 128.00 | 128.00 | 127.00 | 128.00 | 128.00 | 106.00 | 128.00 | 128.00 | 128.00 | 128.00 | |
| Blimp-1 mRNA (-ddCt) | Correlation | −0.05 | 0.693 * | 0.792 * | 0.358 * | 0.542 * | −0.360 * | 0.10 | 0.656 * | 1.00 | 0.615 * | 0.888 * |
| Significance | 0.60 | 0.00 | 0.00 | 0.00 | 0.00 | 0.00 | 0.31 | 0.00 | 0.00 | 0.00 | 0.00 | |
| n | 128.00 | 128.00 | 128.00 | 127.00 | 128.00 | 128.00 | 106.00 | 128.00 | 128.00 | 128.00 | 128.00 | |
| IgM-sec mRNA (-ddCt) | Correlation | 0.05 | 0.463 * | 0.483 * | 0.20 | 0.339 * | −0.10 | −0.09 | 0.458 * | 0.615 * | 1.00 | 0.500 * |
| Significance | 0.59 | 0.00 | 0.00 | 0.03 | 0.00 | 0.27 | 0.37 | 0.00 | 0.00 | 0.00 | 0.00 | |
| n | 128.00 | 128.00 | 128.00 | 127.00 | 128.00 | 128. 128 | 106.00 | 128.00 | 128.00 | 128.00 | 128.00 | |
| IL-10 mRNA (-ddCt) | Correlation Significance n | −0.03 | 0.66 | 0.74 | 0.41 | 0.52 | 22120.35 | 0.18 | 0.641* | 0.888* | 0.500* | 1.00 |
| 0.72 | 0.00 | 0.00 | 0.00 | 0.00 | 0.00 | 0.07 | 0.00 | 0.00 | 0.00 | 0.00 | ||
| 128.00 | 128.00 | 128.00 | 127.00 | 128.00 | 128.00 | 106.00 | 128.00 | 128.00 | 128.00 | 128.00 | ||
| Body Growth PC1 | Vitellogenesis PC1 | Immune System and Disease Status PC1 | ||
|---|---|---|---|---|
| Body growth PC1 | Correlation | 1 | ||
| Significance | 0 | |||
| n | 128 | |||
| Vitellogenesis PC1 | Correlation | −0.01609 | 1 | |
| Significance | 0.869965 | 0 | ||
| n | 106 | 106 | ||
| Immune system PC1 | Correlation | 0.231636 * | −0.232971 * | 1 |
| Significance | 0.008517 | 0.016247 | 0 | |
| n | 128 | 106 | 128 | |
| Gene | Acc. Number | FWD Primer (5-3) | REV Primer (5-3) | BP | References |
|---|---|---|---|---|---|
| Ef-1α | AF498320 | TGCCCCTGGACACAGAGATT | CCCACACCACCAGCAACAA | 90 | [80] |
| IgM sec | X65261 | TACAAGAGGGAGACCGGAGGAGT | CTTCCTGATTGAATCTGGCTAGTGGT | 221 | [57] |
| Blimp-1 | NA XM 014204594.1 | AGCTGTCCAACCTCAAGGTCC | TTGCGGCACACCTGGGCATTC | NA | [81] |
| NKEF | NM_001124277.1 | TGCCGAGGAGTTTAGGAAGA | AATCTTCATGGCACCCAGAC | 62 | [82] |
| IL-10 | NM_001245099.1 | CTGCTGCTCCTTCGTAGAGG | CTCGTCATTAGCCTCGTAGTAGTCTC | 94 | [51] |
| IGF-1 | not available | TGGACACGCTGCAGTTTGTGTGT | CACTCGTCCACAATACCACGGT | 120 | [83] |
| vtg | XM_021599796 | CGCAGTTAAATGTAGCATGGTC | TTGAGCTCTGTGGTGCAATC |
© 2018 by the authors. Licensee MDPI, Basel, Switzerland. This article is an open access article distributed under the terms and conditions of the Creative Commons Attribution (CC BY) license (http://creativecommons.org/licenses/by/4.0/).
Share and Cite
Wernicke von Siebenthal, E.; Rehberger, K.; Bailey, C.; Ros, A.; Herzog, E.L.; Segner, H. Trade-Offs Underwater: Physiological Plasticity of Rainbow Trout (Oncorhynchus mykiss) Confronted by Multiple Stressors. Fishes 2018, 3, 49. https://0-doi-org.brum.beds.ac.uk/10.3390/fishes3040049
Wernicke von Siebenthal E, Rehberger K, Bailey C, Ros A, Herzog EL, Segner H. Trade-Offs Underwater: Physiological Plasticity of Rainbow Trout (Oncorhynchus mykiss) Confronted by Multiple Stressors. Fishes. 2018; 3(4):49. https://0-doi-org.brum.beds.ac.uk/10.3390/fishes3040049
Chicago/Turabian StyleWernicke von Siebenthal, Elena, Kristina Rehberger, Christyn Bailey, Albert Ros, Elio L. Herzog, and Helmut Segner. 2018. "Trade-Offs Underwater: Physiological Plasticity of Rainbow Trout (Oncorhynchus mykiss) Confronted by Multiple Stressors" Fishes 3, no. 4: 49. https://0-doi-org.brum.beds.ac.uk/10.3390/fishes3040049