Diet of European Catfish in a Newly Invaded Region


1
MARE-Centro de Ciências do Mar e do Ambiente, Universidade de Lisboa, 1600-548 Lisboa, Portugal
2
ESA-IPS, Escola Agrária de Santarém, Instituto Politécnico de Santarém, 2001-904 Santarém, Portugal
*
Author to whom correspondence should be addressed.
Fishes 2019, 4(4), 58; https://0-doi-org.brum.beds.ac.uk/10.3390/fishes4040058
Submission received: 4 November 2019
/
Revised: 2 December 2019
/
Accepted: 4 December 2019
/
Published: 8 December 2019
(This article belongs to the Special Issue Selected Papers from the "VII Iberian Congress of Ichthyology - SIBIC2018 Where rivers meet the ocean")
Abstract
:Biological invasions are considered to be one of the leading causes of biodiversity loss worldwide. Freshwater ecosystems are amongst the most biodiverse, containing about 50% of the world’s known fish species but, ironically, are the most invaded ecosystems. In Portuguese freshwaters, there are currently 20 identified non-native fishes, arriving at an unprecedented rate of a new species every two years. A recent non-native is the European catfish Silurus glanis, a top predator native to Central and Eastern Europe, that arrived at the Lower Tagus (Portugal) circa 2006. This study compares the dietary habits of this top predator in two different habitats of the Lower Tagus in order to evaluate its potential impact. The stomach contents of 96 individuals were analyzed, 61 from the lotic environment and 35 from the lentic systems. A total of 66 stomachs contained prey items, 38 from the lotic and 28 from the lentic. Diet varied considerably between habitats, with shrimp and crayfish being the most abundant prey items in the lentic systems and shrimp and fish the most abundant prey items in the lotic section. Tendency to piscivory was observed in large-sized individuals. Overall, the findings in this study provide the first evidence of the potential impacts of European catfish through predation on the fish communities.
1. Introduction
Invasive species are a major source of biodiversity loss impacting multiple levels of ecosystems composition and structure. These impacts include hybridizing with native species, proliferating foreign pathogens, and enacting competitive displacement of native species, with the most visible impact being, perhaps, predation [1]. The introduction of top predators in freshwater systems has the potential to reduce or extirpate populations of native species at a local level [2]. For Portugal, comprehensive studies focusing on the diet of invading predators are limited to two species, namely, the largemouth bass (Micropterus salmoides, Lacépède, 1802) [3] and the pikeperch (Sander lucioperca, L., 1758) [4]. The rate of fish introduction in Portugal is high, with the most recent introductions related to sport angling with two top fish predators [5,6,7]. It is therefore important to evaluate the impacts of predatory fishes in order to evaluate the direct impact on aquatic organisms, especially species with conservation concerns.
The most recent top predator introduced in Portuguese watersheds, Silurus glanis, was described as a large-sized opportunistic omnivorous predator [8] with acute predatory senses that make it an apex predator [9]. It feeds mostly on benthic organisms and is able to adapt its diet to the available spectrum of prey items found within a system [10,11]. Typically, the predominant prey type found in the S. glanis diet is whichever prey is more abundant in the system, provided its size and habitat use are suitable for S. glanis [12]. Its capacity to adapt to different prey types is remarkable, such as preying on birds found in river banks in regions of France and Spain [13].
Works concerning the European catfish diet habits were mostly done within its native range, where the fish community structure and environmental conditions are very different than those found in Portuguese rivers [14]. For the introduced range, few works are present in the literature, which are either preliminary or based on low sample numbers (e.g., [15,16]); nevertheless, they provide valuable information indicating that, in the invasive context, S. glanis seems to continue to be highly adaptable to the spectrum of prey available and incorporates native species into its diet [17]. In Spain, a study by Carol et al. (2009) [18] focused on reservoir populations and their diets, observing that the basis of the diet consisted of crustaceans, mostly crayfish (Procambarus clarkii, Girard, 1852), with fish prey representing the largest portion of biomass consumed, mostly non-native species. More recently, Guillerault et al. (2017) [16] showed that this species predates in migratory fish, so its impact could be larger than expected. This fact was previously supported by Syväranta et al. (2010) [17], who found evidence of the European eel (Anguilla anguilla, L., 1758) being part of this species’ diet in France.
The previously described S. glanis habits are worrying in the Portuguese context, because this species invaded the Tagus River drainage, arriving to the lower Tagus in 2006 [6,19]. Some threatened native fish, such as the European eel, the long-snouted barbel (Luciobarbus comizo, Steindachner, 1864), and the sea lamprey (Petromyzon marinus, L., 1758), occupy benthic areas, the same spatial niche as S. glanis, making them potential prey for this species and adding to the pressure these species’ populations are already under. In addition, Portuguese watersheds are not home to any native piscivorous fish [20], so the introduction of predators of this kind may have its impacts enlarged by a form of fish naivety [2]. Furthermore, the water temperature in Portugal is generally higher than in its native range, so a higher metabolism, possibly related to higher activity levels, is expected, and associated with a larger impact on aquatic communities in the rivers where it occurs [14].
The Tagus is the longest river in the Iberian Peninsula. A river with great historical importance, it was once one of the main routes for the trade of goods between both Iberian countries. Despite retaining some of its economic importance, traversing the river is now nearly impossible due to the many dams and weirs found along its course, with the main objective of energy production [21]. Due to its great extension, the river crosses many different ecosystems of extreme ecological importance, like the Spanish plateau, the Mediterranean forest valleys, and the marshlands close to its mouth. A place of refuge during the last ice ages, it is home to many endemic species, many of which are threatened, like the long-snouted barbel or the Lisbon arched-mouth nase (Iberochondrostoma olisiponense) [22]. It is also an important habitat for diadromous species like the European eel, the sea lamprey, the Allis shad (Alosa alosa, L. 1758), and the Twait shad (Alosa fallax, Lacépède, 1800). Sadly, in recent years, ever-increasing episodes of severe pollution, drought, and the arrival of invasive species have accentuated the loss of this rich biodiversity [22]. The aim of this work is to describe the dietary habits of S. glanis, an apex predator that recently arrived to this region with a unique fauna. This information is essential to demonstrate the species impact and move forward toward the management of this species.
2. Results
In total, of the 96 fishes captured, 35 were collected in lentic and the remaining 61 in lotic habitats of Tagus River. Fish where no prey was found were discarded for the remaining analysis, leaving us with a final sample size of 28 for lentic habitats and 38 for the lotic habitats (Table 1). Overall, the mean length in each size class presented little variation between environments (Table 1).
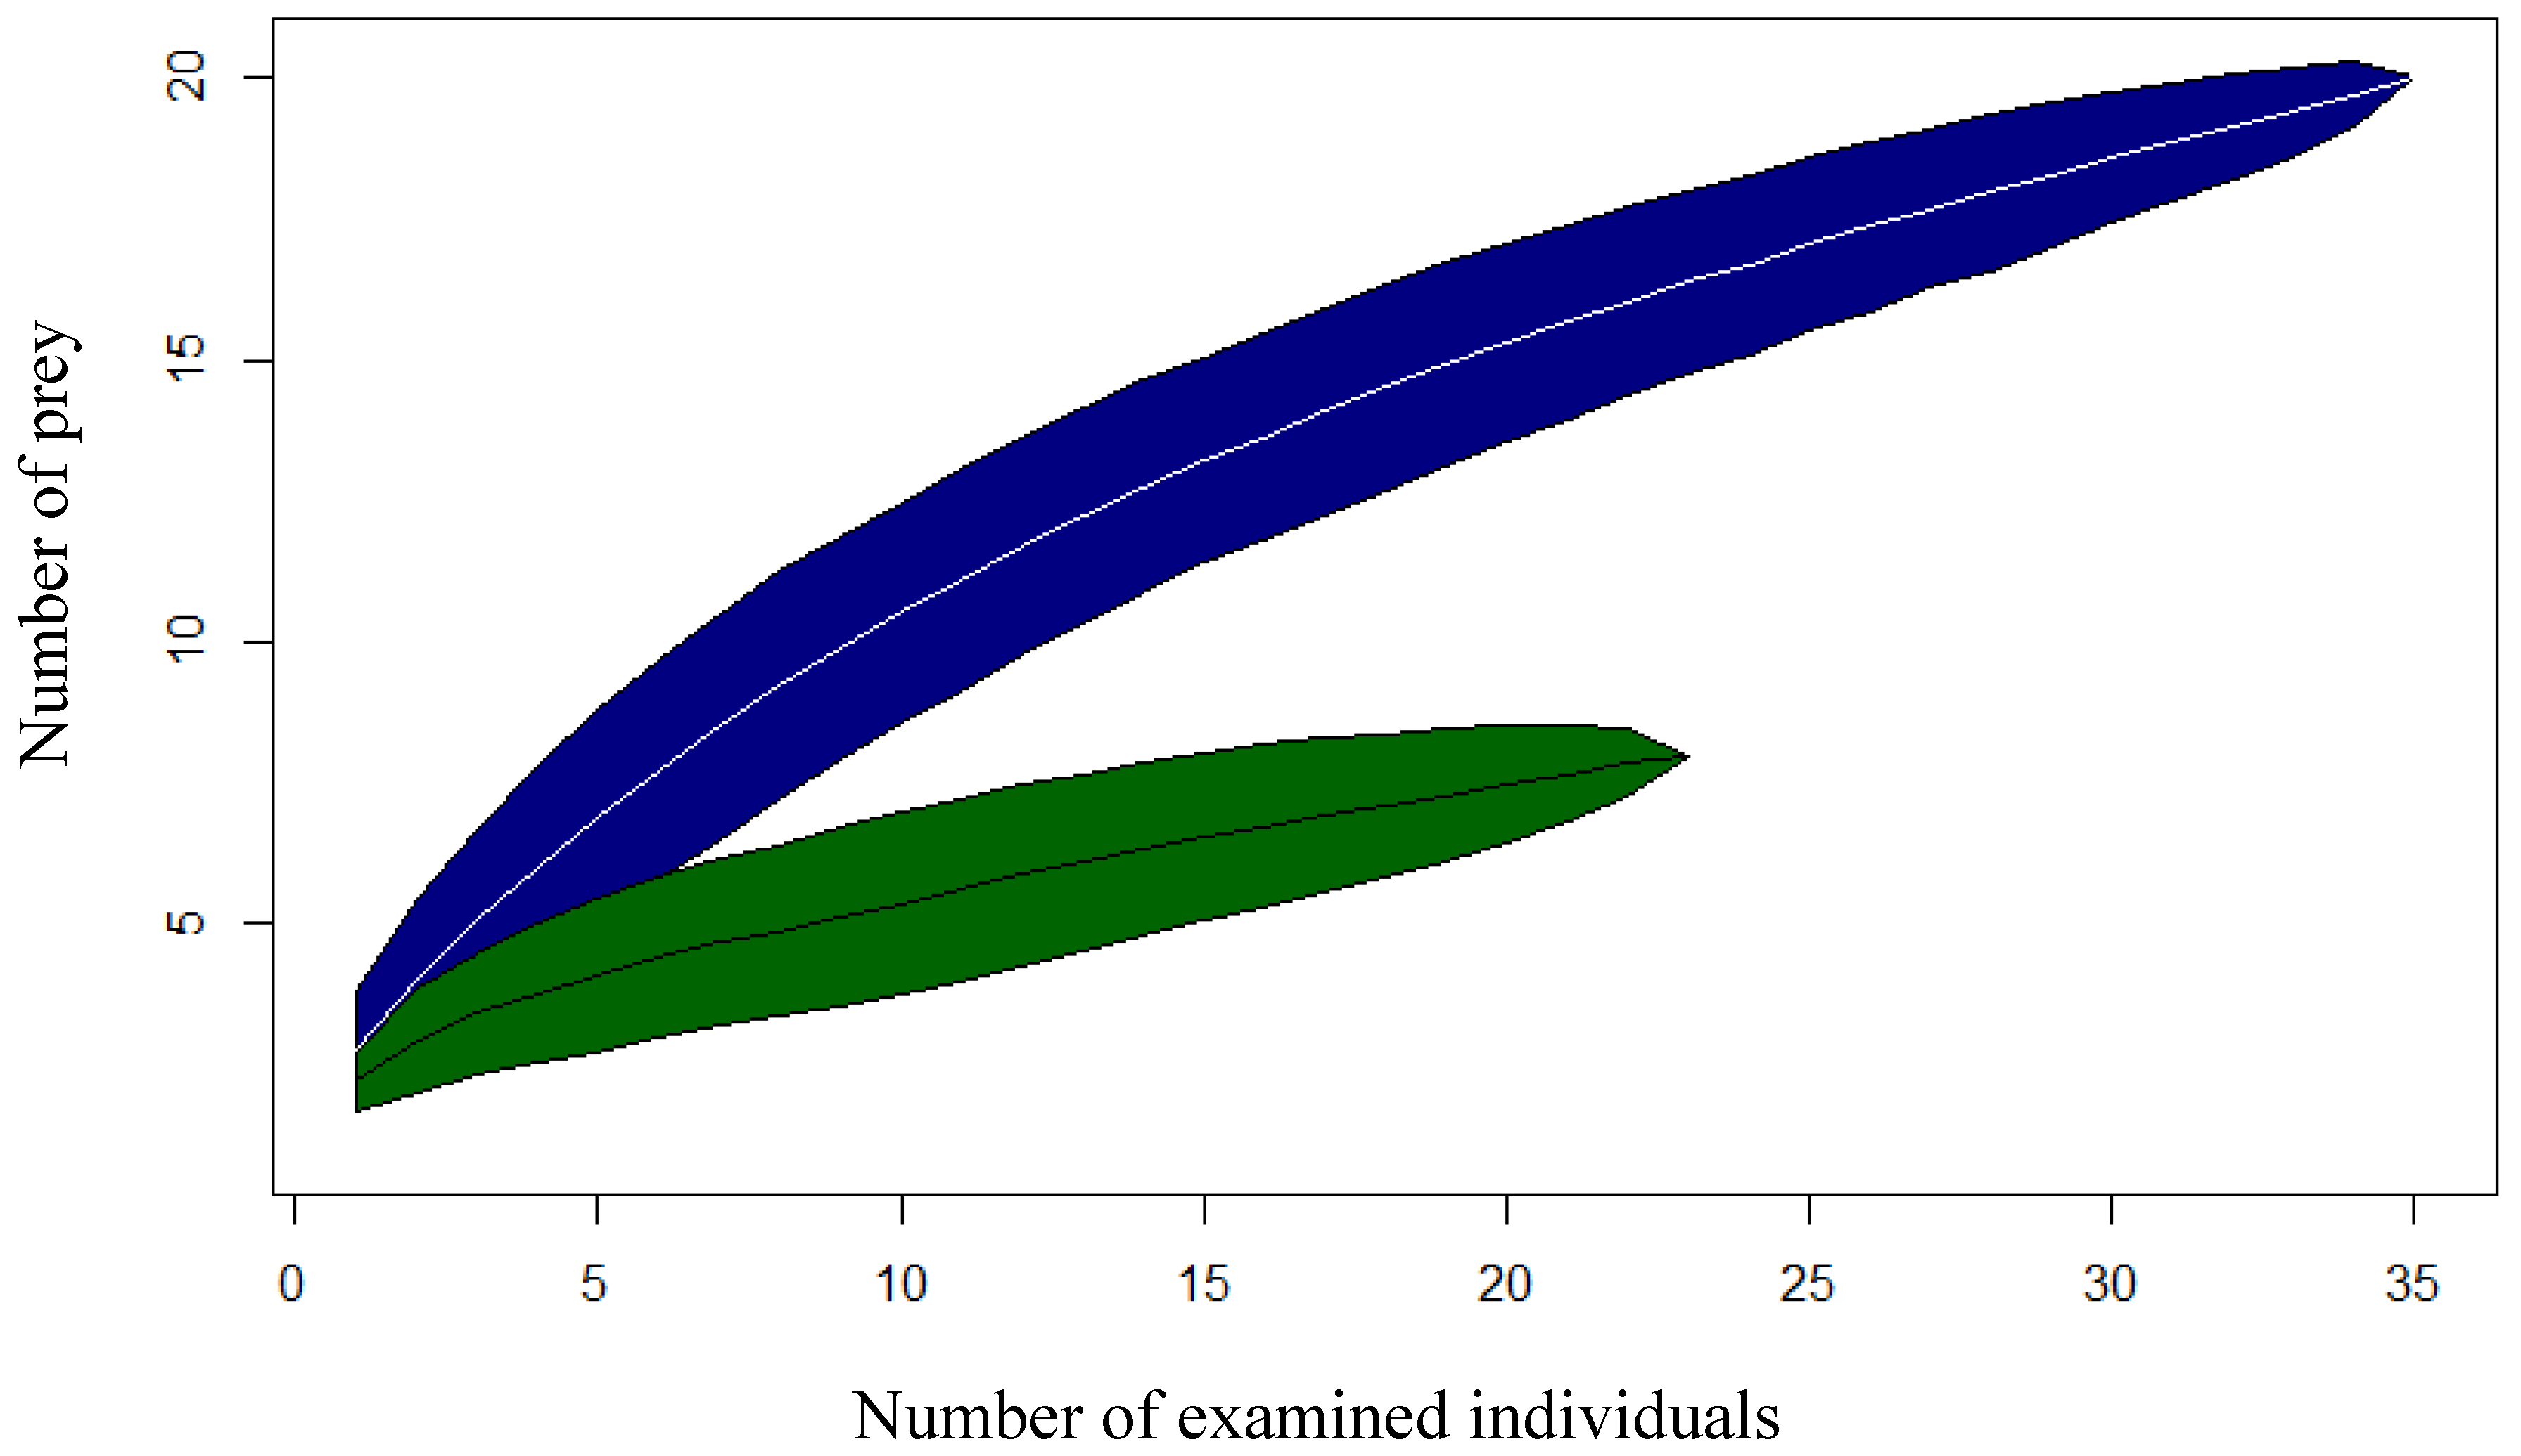
Prey cumulation curves showed that the number of prey items continued to increase as more stomachs were analyzed and did not stabilize with our studied number of individuals (Figure 1). The more accentuated curvature was observed for the lotic system when compared to the lentic system, thereby indicating how much broader the dietary niche seems to be in this environment.
The diet of the fishes captured in the lotic section differed greatly from that of the fishes from the lentic sectors (Table 2). Despite both relying heavily on crustaceans, the lentic fish ate almost solely based on this prey type. These fish also displayed a much larger red swamp crayfish (Procambarus clarkii (Girard, 1852)) component when compared to the lotic system (Mann–Whitney U: W = 499; Nlotic = 38; Nlentic = 28; P < 0.001). The lotic fish composition (18.3%), consisted mostly of benthic fish (75.4% of fish prey found), but also of a portion of pelagic fishes (24.6% of fish prey found), which exceeded the number of fish prey found in the lentic system (Mann–Whitney U: W = 533; Nlotic = 38; Nlentic = 28; P < 0.01). In the lentic sample, fish prey represented less than 10% of the total number of prey found and came from only two of the individuals sampled. In the lentic environment, aside from the freshwater shrimp (Atyaephyra desmaresti, Millet, 1831) and amphipods, the remainder of the diet was completely constituted by non-native species.
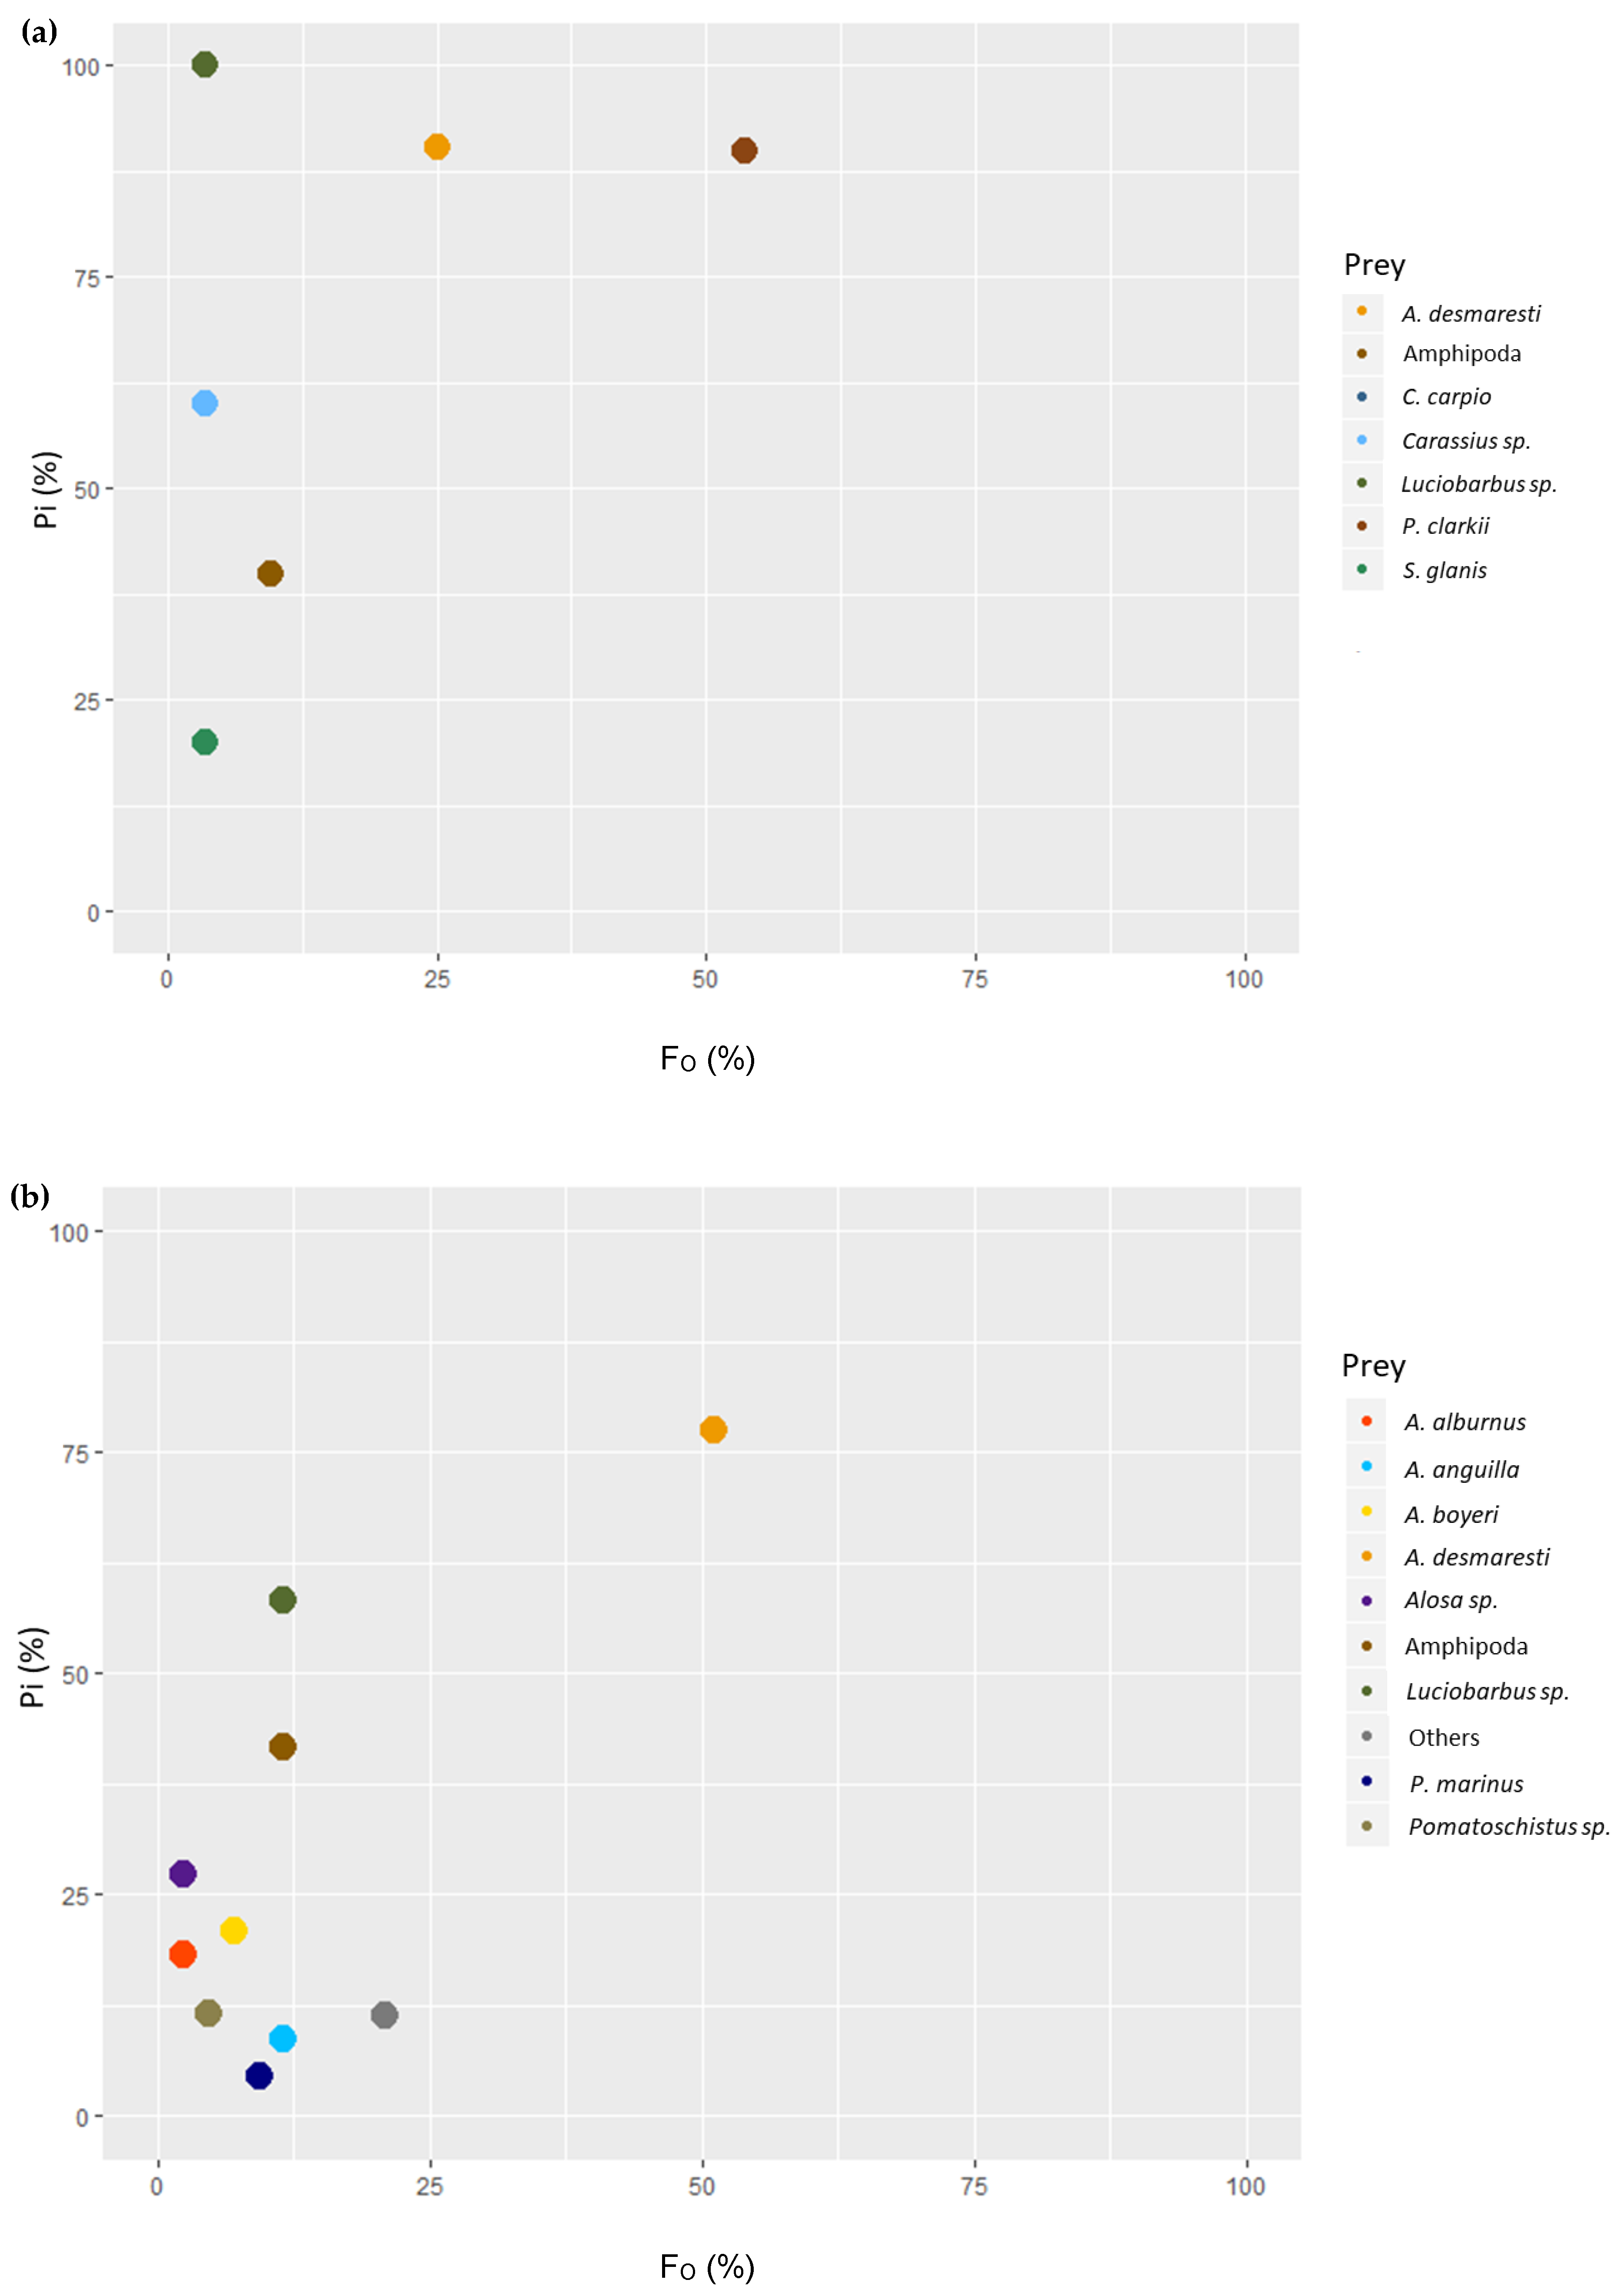
In the lentic environment, some degree of specialization toward the consumption of crustaceans was observed, while fish prey were rare (Figure 2). As for the lotic environment, a broad dietary niche seemed to form due to the number of different fish species found without any of them becoming dominant in the diet; however, the same degree of specialization was observable toward the most abundant prey, A. desmaresti (Figure 2).
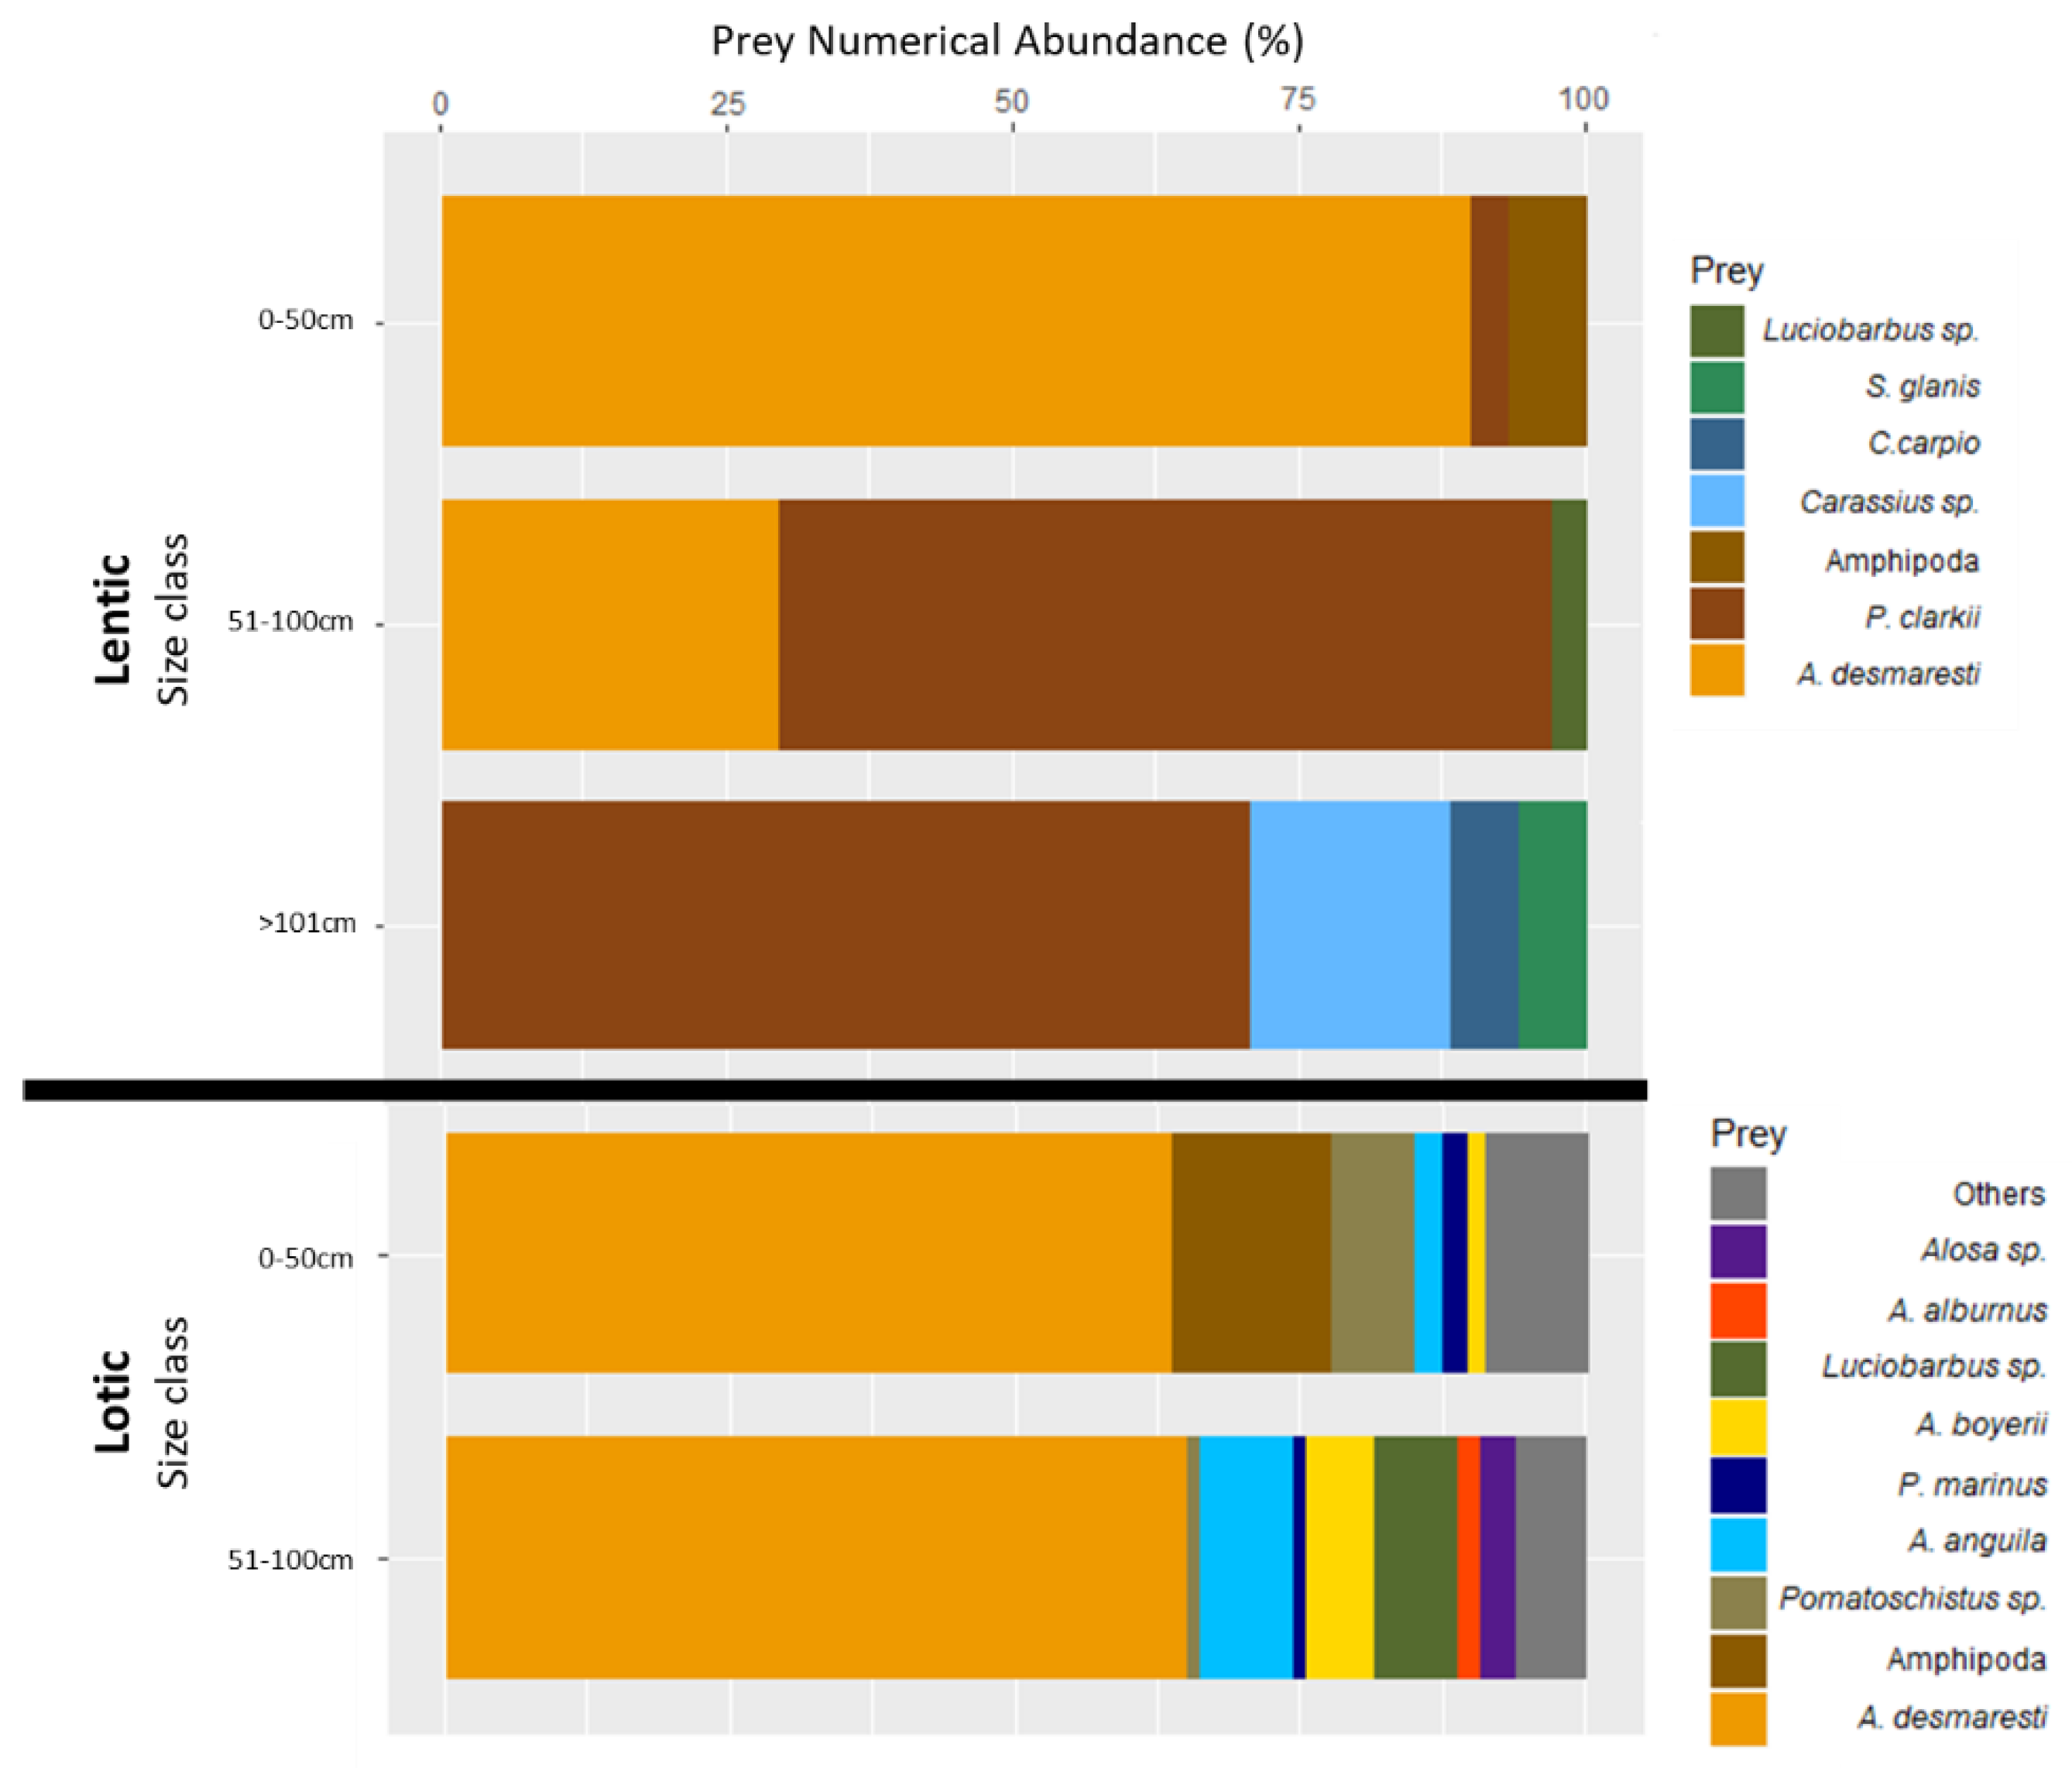
In the lentic environments, small-sized fish (Class 1) had a diet that consisted almost exclusively of crustaceans, nearly 90%, while in the lotic environment it was about 65%, also complemented with small fishes (Figure 3). However, while in the lotic environment the main crustacean prey was A. desmaresti, in the lentic environment it was crayfish, being dominant in Class 2 and Class 3. Furthermore, we observed remarkable prey diversity in the lotic environment, with small European catfish eating mostly benthic fish (such as eel), while medium-sized fishes had a larger proportion of pelagic fish prey (such as shad, Alosa sp.) (Figure 3). The Mann–Whitney U test revealed no differences between Class 1 and Class 2 for the lotic system, however, it did show significant differences between Class 1 and Class 2 in the lentic system in the amount of A. desmaresti consumed (Mann–Whitney U: W = 52; Nlentic,C1 = 8; Nlentic,C2 = 15; P < 0.05) and of crayfish (Mann–Whitney U: W = 11; Nlentic,C1 = 8; Nlentic,C2 = 15; P < 0.05).
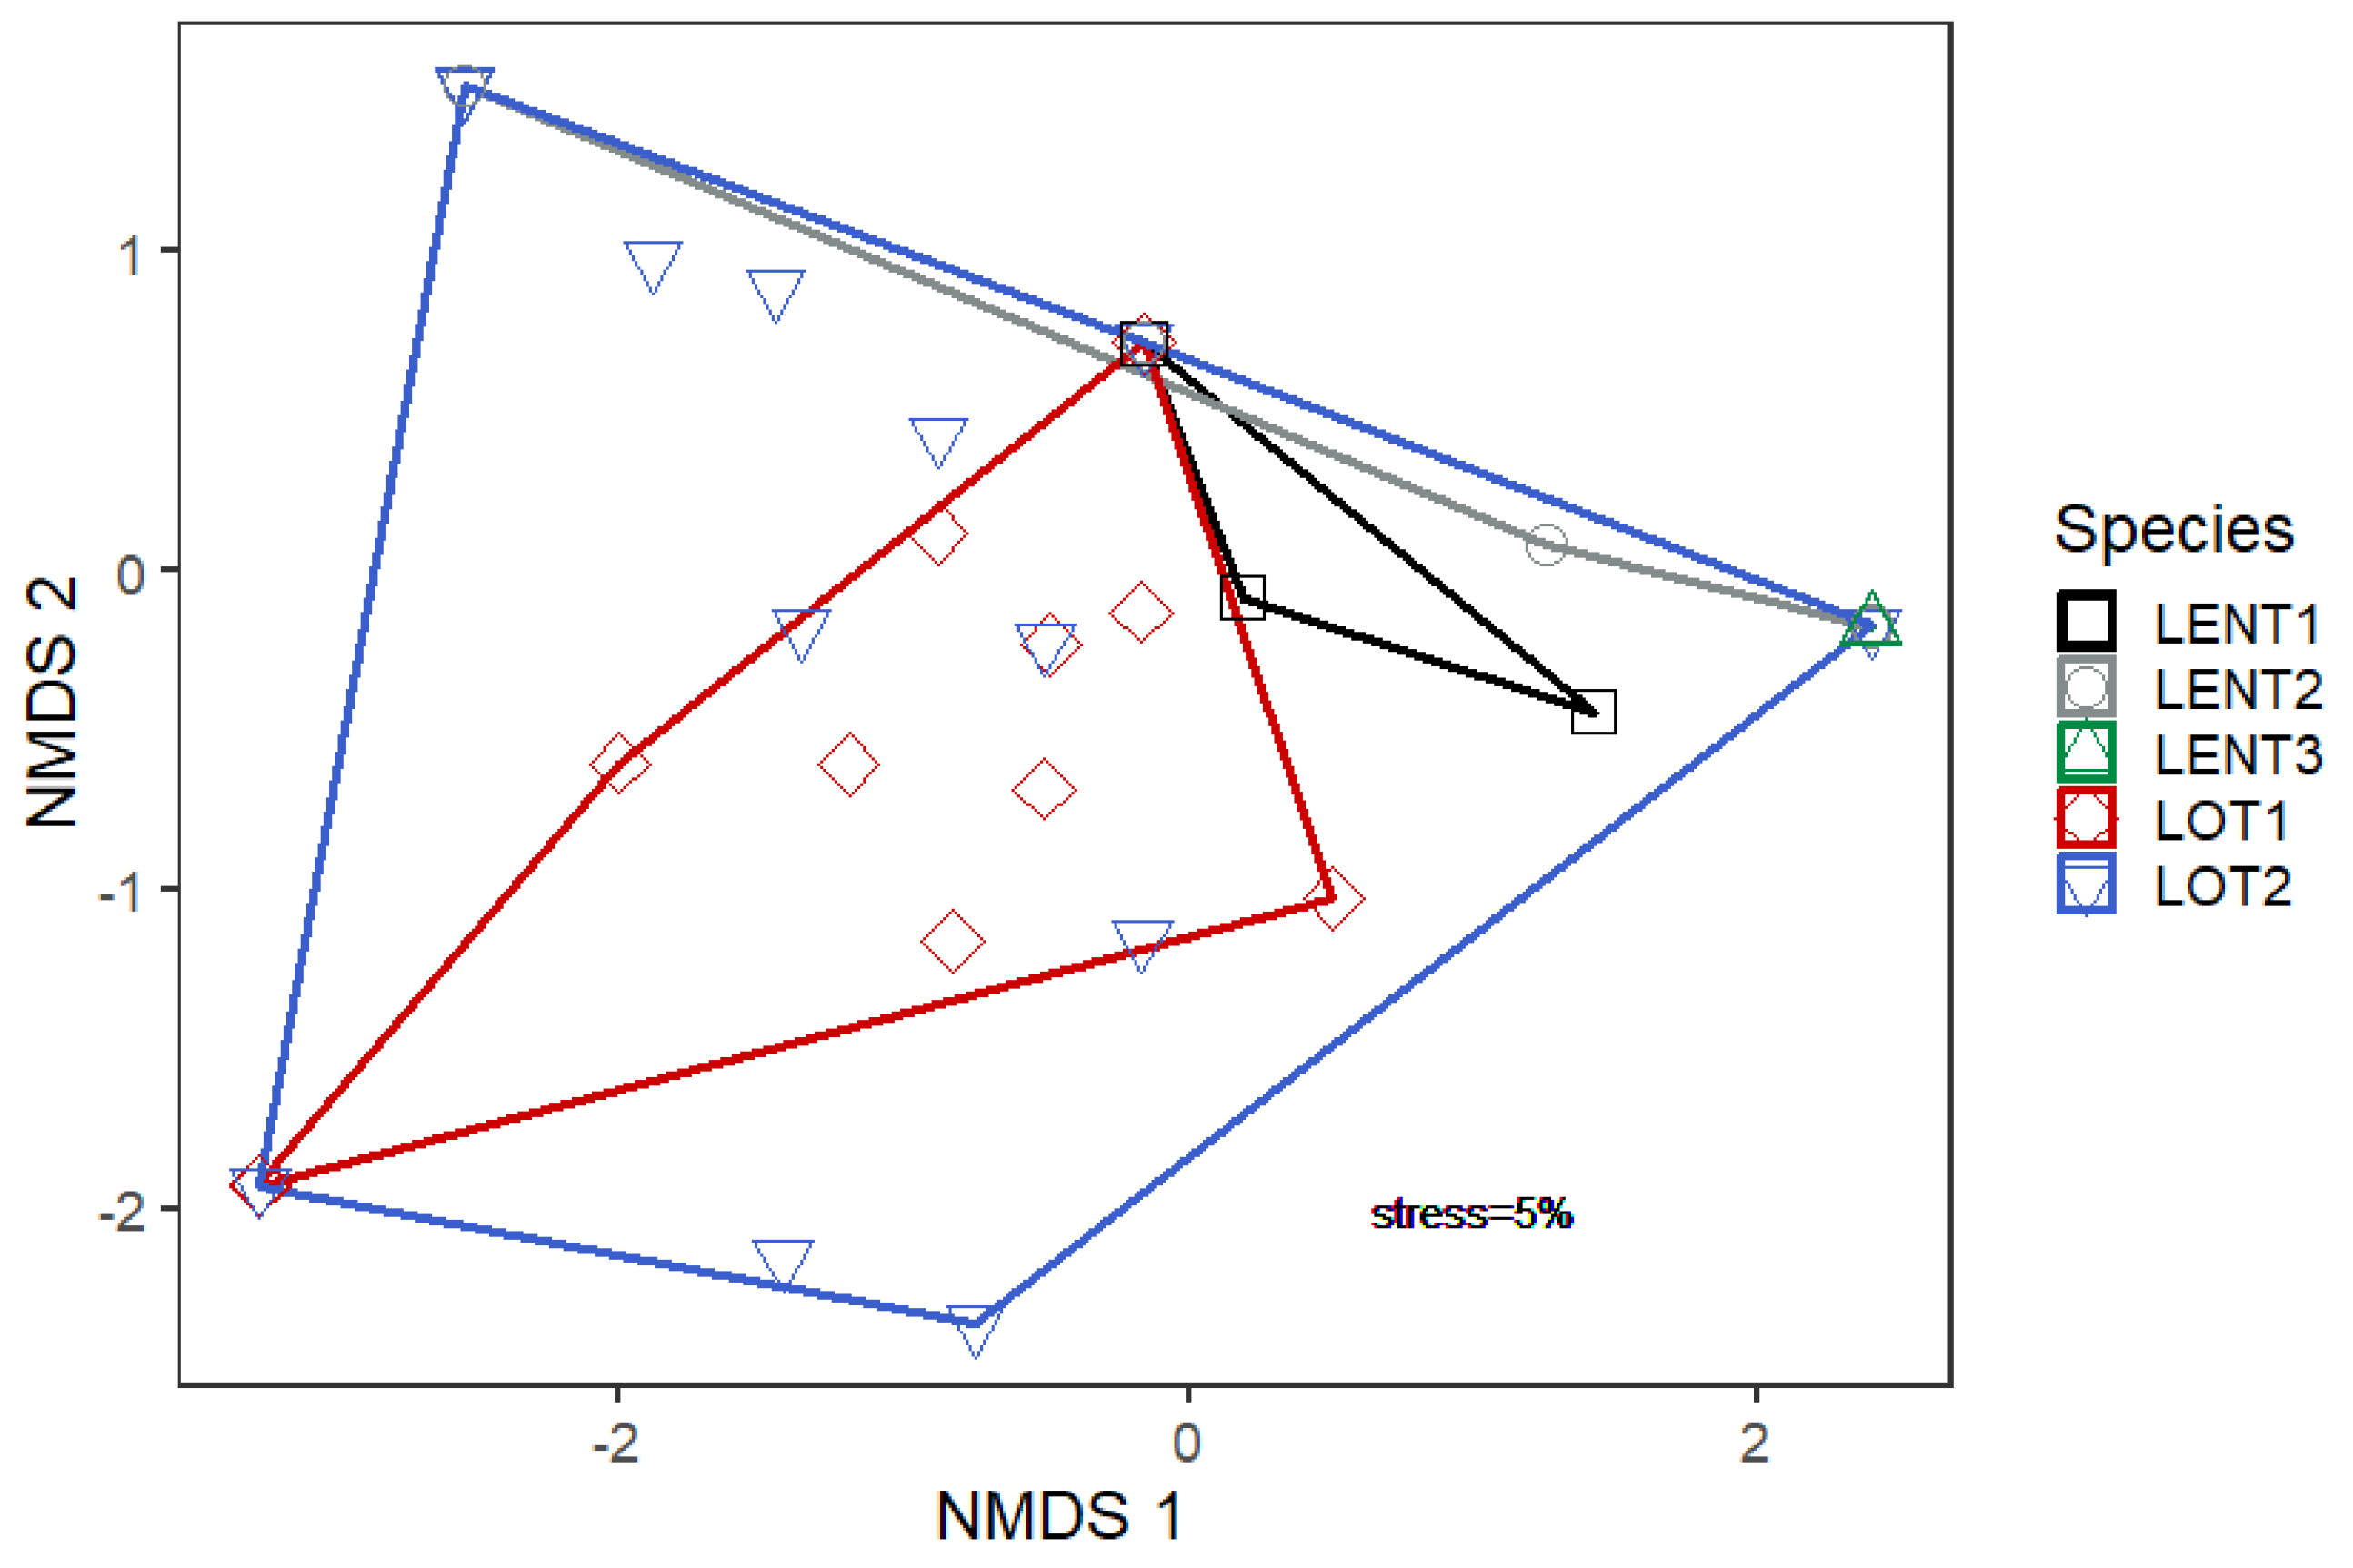
The NMDS (Figure 4) showed that fishes in the lotic system exhibited greater prey diversity than those in the lentic system. As size increased in the lotic system, there was an expansion in prey diversity, with medium-sized individuals’ (LOT2) prey spectrum overlapping that of small-sized individuals (LOT1). For the lentic system, the different size classes exhibited diverging predatory niches.
3. Discussion
This work constitutes the first dietary study of European catfish in Portuguese freshwaters, assessing feeding behavior and potential impact in two different habitats in the Lower Tagus region. This species appropriates the most common food resource available in each habitat. In the lentic environment, non-native fish eat predominantly crustaceans, such as the freshwater shrimp and red swamp crayfish, and in lotic systems the European catfish ate mostly freshwater shrimp, closely followed by fish. Piscivory tended to increase with individual size in both studied habitats, and its feeding behavior was considerably broader in the lotic environment. This first set of data showed that non-native predators presented different impacts depending on their environment; in this case, the European catfish could have an important impact on the fish communities in the lotic habitats of the Lower Tagus River.
This study presents preliminary data regarding species impact in the Lower Tagus River. Firstly, this study relied on fishermen’s fishing efforts (predominately in fishing season, i.e., February and July) and, consequently, the number of fish captured varied along the year, with the bulk of the data coinciding with spring and early summer. However, the fish during the winter presented low activity [23] and, most likely, any collected European catfish would present low number of prey items and prey diversity. Additionally, the size of the collected fish was highly dependent on the fishing net mesh size. Nevertheless, the observed tendency for piscivory seemed to be consistent in both studied habitats and comparable with other studies (e.g., [17,18]).
The lotic habitats generally exhibit communities that are more diverse, which increases the available prey diversity for S. glanis and allows for a wider dietary niche. Verissimo et al. (2018) [22] documented a total of 14 fish species in the Lower Tagus. The European catfish in the Tarn river, a tributary of the Garrone in France, seems to also feed on most of the available species found there [17]. Most of the diet in the lotic habitat consisted of native species, with A. desmarestii, a small freshwater shrimp, being the most abundant prey (over 60%). The presence of prey like A. anguilla, Alosa sp., and P. marinus is worrying for two main reasons. Firstly, the populations of these three species have seen a sharp decline over the past few decades; therefore, added pressure on these populations may further aggravate this trend [24,25]. In addition, these species are central to the economy of anglers and fisheries, as well as the restaurants that depend on them across the Tagus River, and their decline will most definitely affect the future prospects of these commercial activities. In fact, Guillerault et al. (2017) [16] mentioned that the European catfish could represent an important predatory pressure on migratory fish, namely shad and lamprey.
In lentic habitats, the diet consisted mostly of invasive species, with the staple prey being P. clarkii. This observation was consistent with that found in some Spanish reservoirs [18], however, other reservoir populations exhibited fairly different niches. The prey diversity found was lesser than that of lotic sites, but this was to be expected, given that reservoirs are areas of high stress and disturbance mostly populated by non-native species.
Due to abundance being calculated based on prey number rather than volume, it is important to note that this alternative approach may change how these data are viewed, as fishes, who generally have a larger biomass than the freshwater crustaceans analyzed here, may become the most predated group and therefore be even more impacted than what was observed in this study.
In general, the typology of prey found within S. glanis stomachs seemed to be directly correlated with the size of the mouth, given that larger prey were found in larger individuals. In lotic habitats, individuals of Class 1 were already preying on other, smaller fish species like goby (Pomatoschistus sp.) and juveniles of both eel and lamprey. Class 2 individuals fed on benthic fishes, with 10% of the diet surprisingly consisting of pelagic species, such as A. boyerii and shad (Alosa sp.). It is also worth noting that, in these habitats, almost all (81.1%) of the diet comprised native species, and of these, roughly 20% were native fish species.
As for the lentic habitats, the mouth size/prey size relation was easier to observe with Class 1 individuals feeding strictly on crustaceans with a vast majority of freshwater shrimp, Class 2 fishes replacing the shrimp with crayfish and, finally, Class 3 individuals including large fish such as carp in their diet. The predation on pelagic prey demonstrated a plastic response of this species predatory behavior, enabling it to obtain new food resources [13]. In fact, the different dietary habits observed in both environments attested to this broad adaptive capacity. Indeed, Copp et al. (2009) [14] observed that the European catfish presented an enormous variation across the species range.
The prey cumulation curves did not stabilize, indicating that a larger sampling effort is needed to evaluate the full predatory niche this species is using in its current distribution. In fact, there is a new prey item registered for every two individuals in the lotic system, and one new prey item registered for every three individuals in the lentic system. However, when compared to the work of Guillerault et al. (2017) [16], we saw that for the same number of individuals sampled (N = 16), they found six different prey species, while in the Tagus, 14 species were identified. The same work also described DNA metabarcoding as a more efficient method of diet composition analysis; perhaps, if the same had been applied in this case, the number of identified prey would be higher. In sum, the number of species affected by S. glanis predation in the Portuguese Tagus River was larger than that found for France.
The larger prey diversity observed in the present study could be a result of native fish prey naivety, considering that this non-native fish was only established about a decade ago. As stated previously, in the Portuguese freshwater courses, piscivorous fishes were originally absent and, as such, the native fish species have not developed strategies to evade fish predation. This “inadaptation” toward this threat may explain why smaller S. glanis are able to prey on fish in the lotic system. Most non-native fishes found in reservoirs share the same native distribution with S. glanis, therefore, fishes like carp and goldfish may have some innate mechanism of defense that has not yet been silenced. Studying the diet of this recent apex predator constitutes an unique opportunity to demonstrate the early and considerable impact of predation on a unique fish community of the Lower Tagus River that could encompass more than 20 native fish, some endemic to this region.
4. Materials and Methods
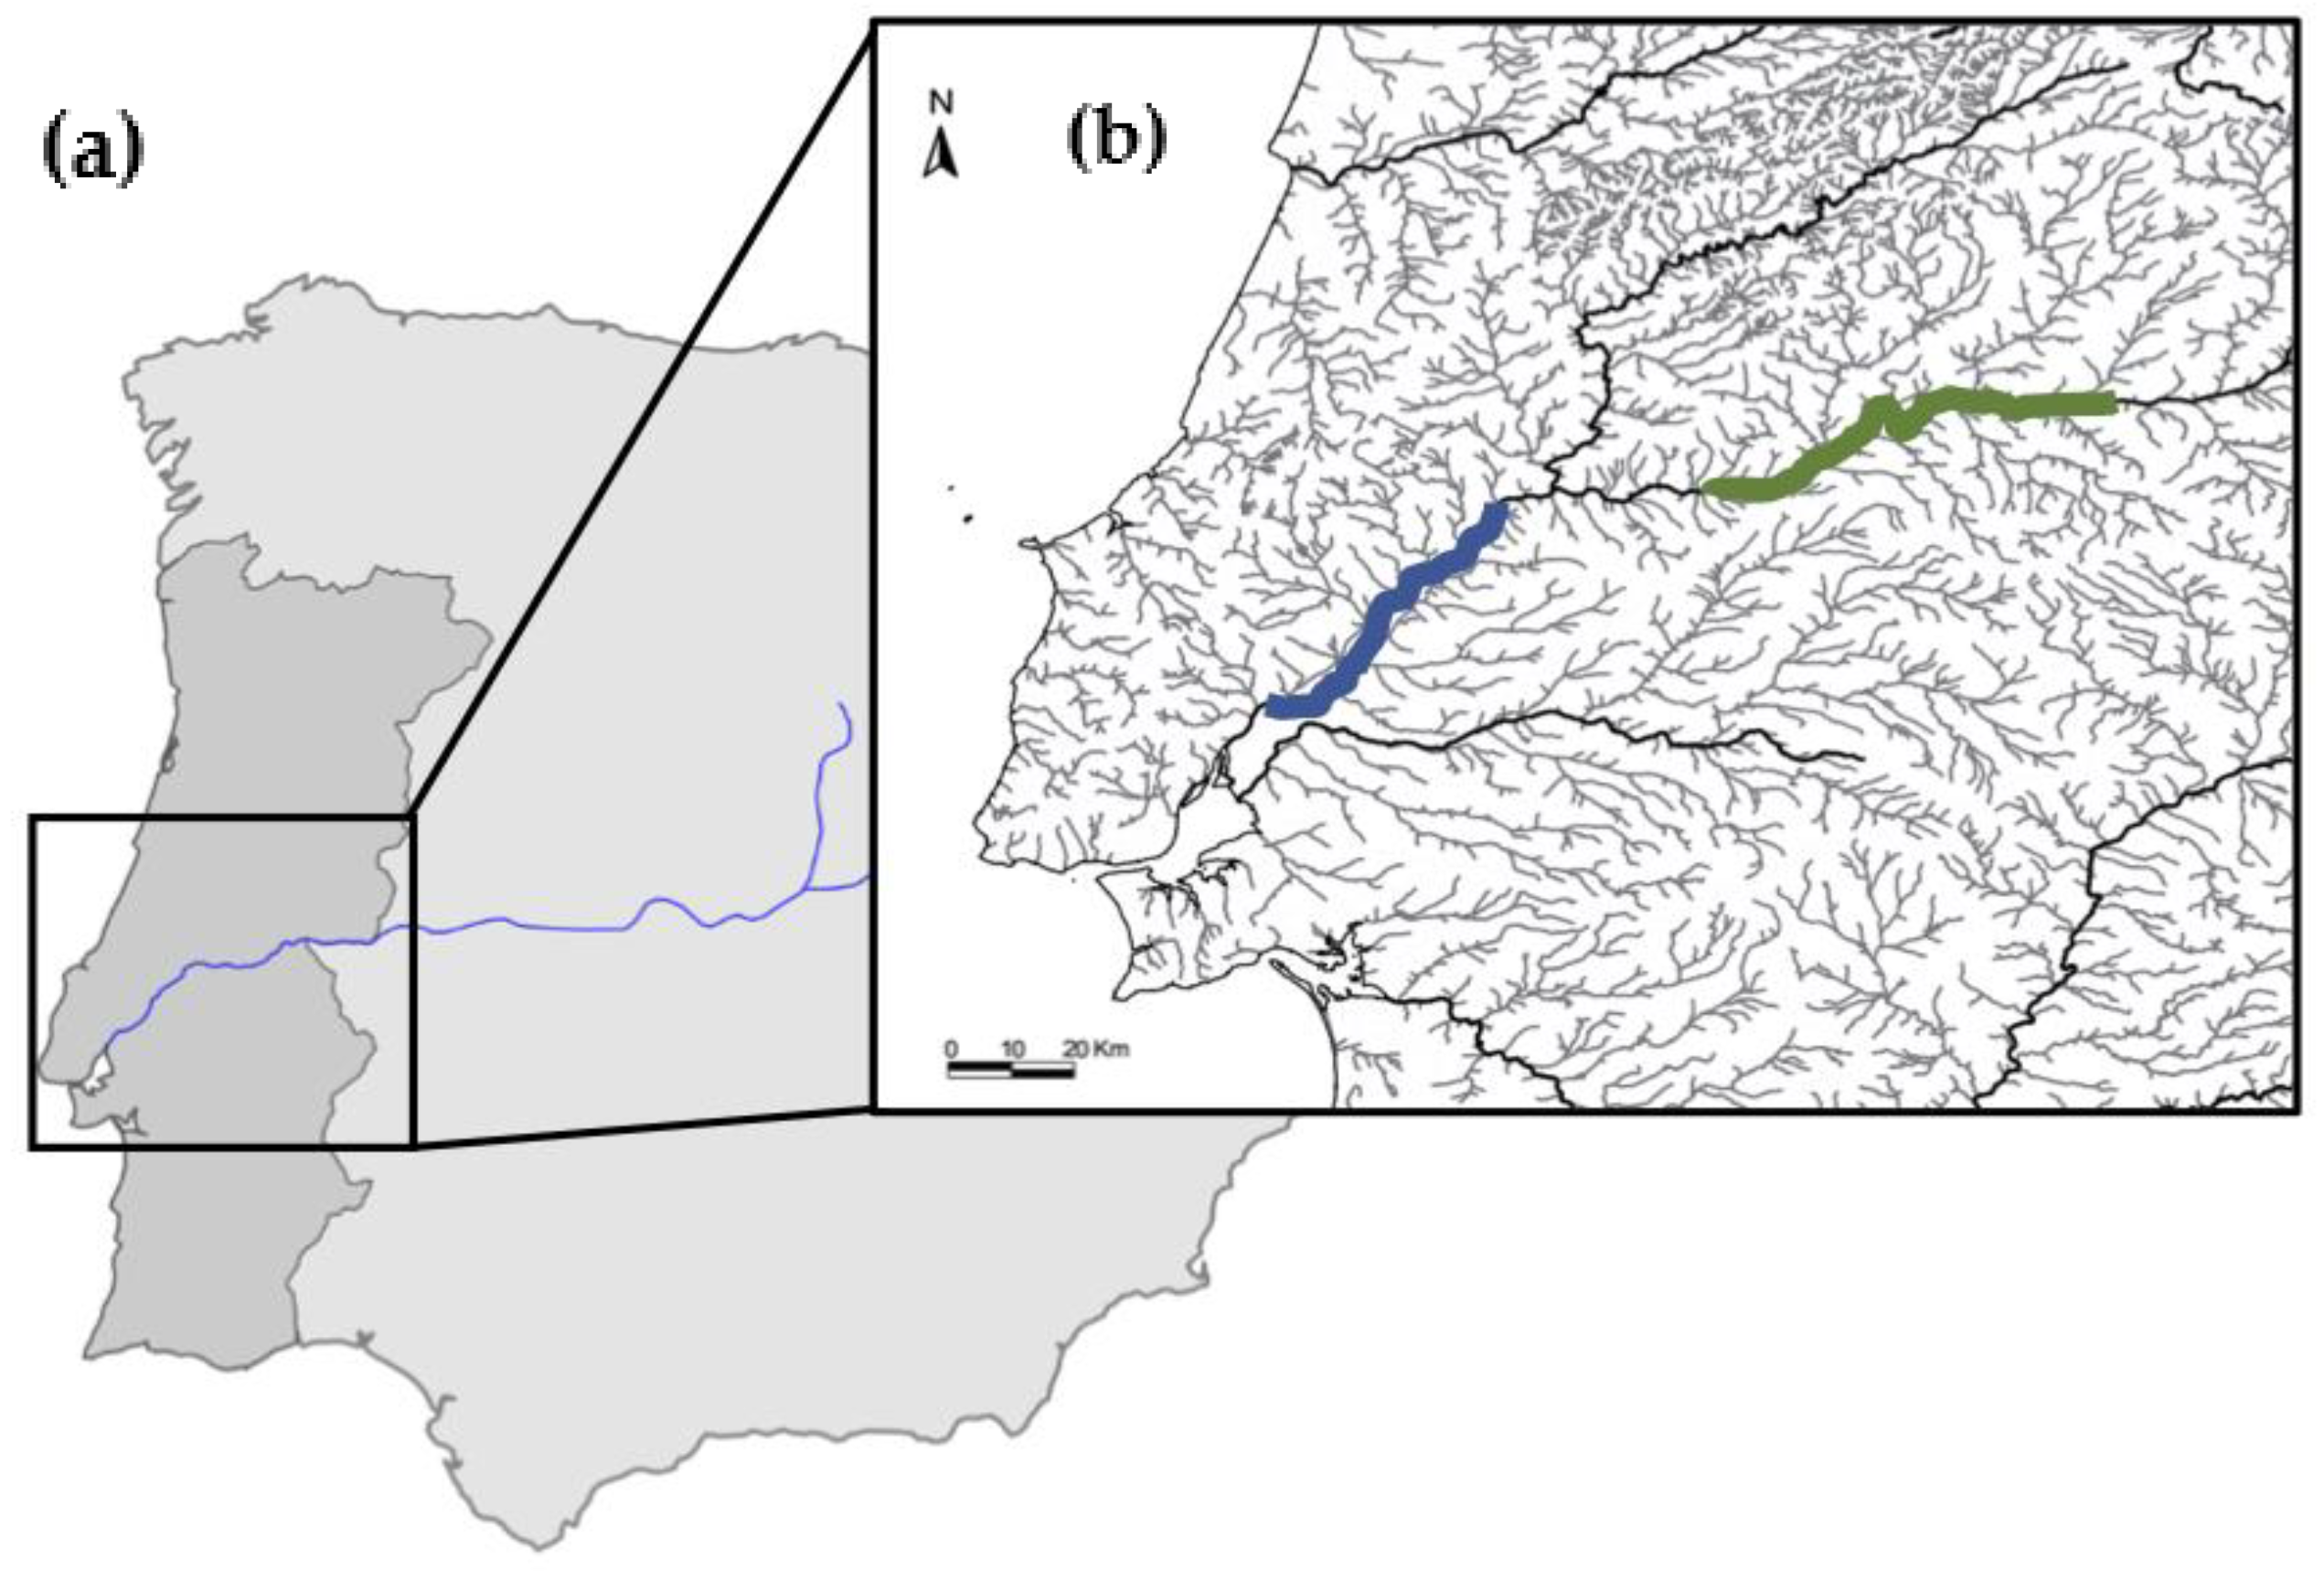
The fish used in this study were obtained opportunistically between April 2017 and November 2018 by fishermen located in two distinct areas, namely, the flowing section of the Tagus River (Santarém–Azambuja), referred to as lotic environment, and the lentic environment (Belver, Fratel, and Cedilho reservoirs) (Figure 5). Fish were generally captured with stationary nets of various sizes and lengths. The Tagus is a river system with many obstacles through its course, like weirs and dams. Belver, Fratel, and Cedilho are hydroelectric dams with relatively small reservoirs that allow for the constant flow of water, which is maximized during periods of electrical production.
In the laboratory, fish were measured for total length (TL) to the nearest millimeter, when possible, and standard length (SL) to the nearest millimeter. They were weighed (total weight (TW) to the nearest gram) and a gut incision was made to extract the digestive tract, liver and gonads. The fishes were then weighed for eviscerated weight (EW) to the nearest gram. Stomach content analysis followed Knoppel (1970) [26]. Contents were placed in a Petri dish, observed under a stereomicroscope (Leica MZ 125), and were posteriorly identified to the lowest possible taxa using identification keys [27] as well as expert opinions.
A prey accumulation curve, which measured the number of different prey items as a function of sample effort, was obtained for each environment (lotic and lentic). This was done using the Vegan R package, via a randomizing methodology with 1000 permutations, adapted from [28].
Fishes were separated into two groups according to place of capture, lentic environment and lotic environment, and then sub-divided into three size classes for each group using TL measurements, i.e., Class 1: 0–50 cm, Class 2: 50–100 cm, and Class 3: >100 cm. The relative numerical prey abundance (AN, %) was calculated as described by Hyslop (1980) [29]. The frequency of occurrence (FO, %) was, given the total number of stomachs containing prey, the percentage of each of the prey items listed. Variation between systems and size classes in numeric prey abundance was evaluated using a Mann–Whitney U test, specifically pertaining to the four most preyed-upon items.
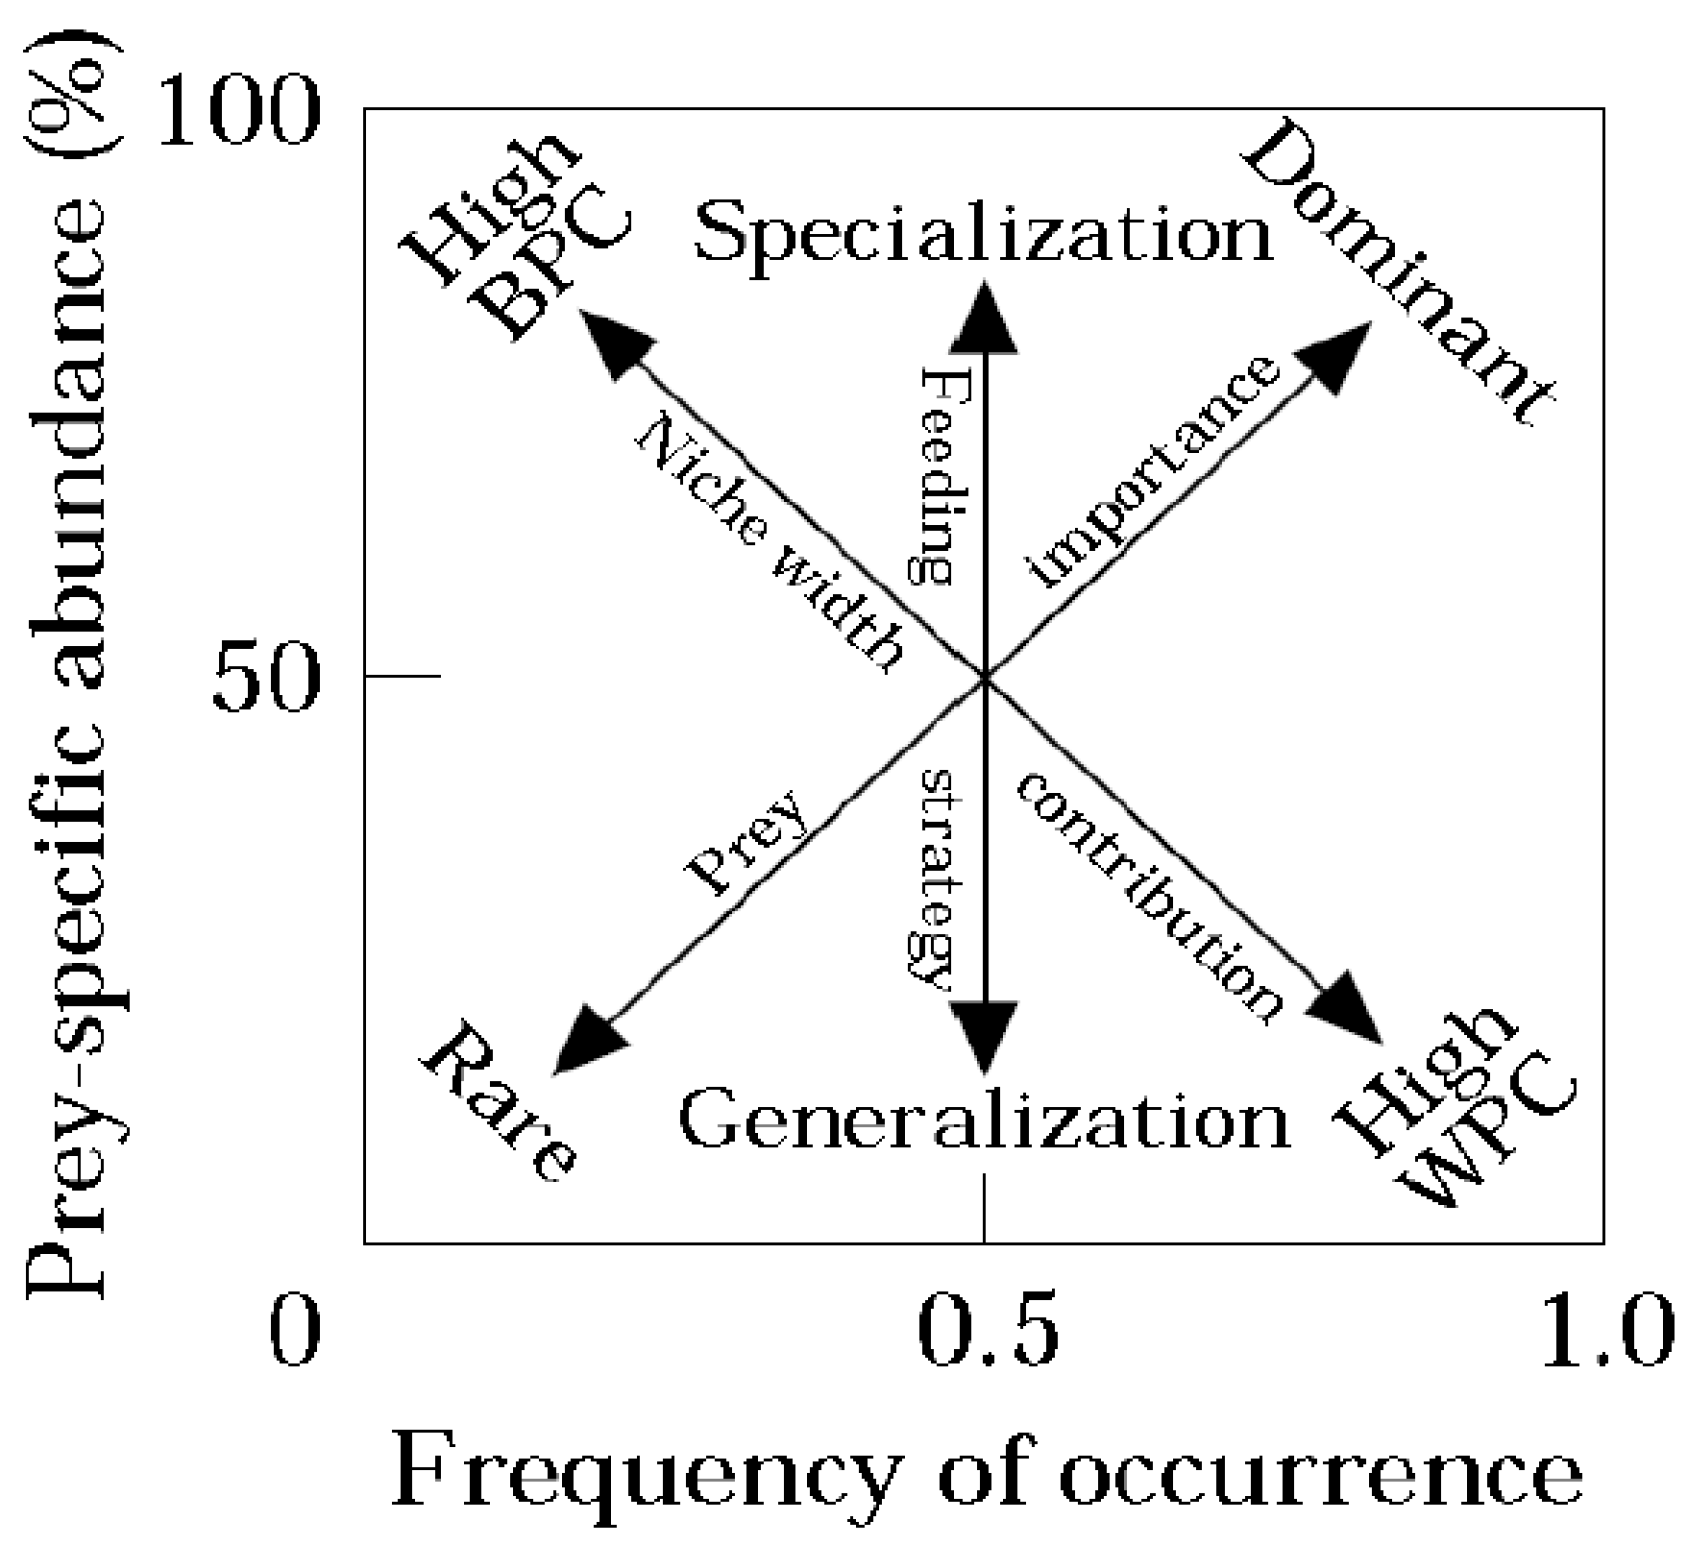
A modified Costello [30] graphical method was used to illustrate the feeding behavior for each river system. This method plotted FO (%) and prey specific abundance (Pi, %) to classify a species’ prey-selection behavior (1).
Pi (%) was calculated as a function of Psi, the amount of prey items for a prey type (i) found in the stomachs, and Pst, the total amount of prey items of each type of prey found in each stomach that contained prey i. The graphical representation allowed for the characterization of feeding behavior by analyzing the distribution of points along the diagonals and axes of the diagram (Figure 6).
Feeding strategy was characterized by the vertical axis, with the bottom representing generalization and top representing specialization. The importance of each prey was characterized diagonally, from rare prey in the lower left and dominant prey in the upper right. Individuals with a narrow predatory niche were associated with prey items found in the upper left region and individuals with a broad niche were associated with prey items in the lower right region (Figure 6) [30]. This analysis was produced using Excel 2013.
A non-metric multidimensional scaling analysis (NMDS) was performed using the R package Vegan: Community Ecology Package [31] to visualize the prey spectrum variation between and within each group of fish (lentic and lotic and size class within each environment). This approach was based in the Bray–Curtis similarity index [32]. The prime components were understood as tendencies for prey niche dimensions. A larger number of iterations was used in order to reduce stress values to <0.2, as the standard approach resulted in lack of component convergence; this was possibly due to low sample size. A follow up analysis of similarity (ANOSIM) was attempted, but trust in the results was not satisfactory and therefore was not included, following Gkenas et al. (2019) [33].
Author Contributions
Conceptualization: F.R. and J.G.; methodology: F.R., J.G., and M.F.; formal analysis: M.F. and F.R.; investigation: F.R., M.F., and J.G.; resources: F.R. and J.G.; data curation: F.R. and M.F.; writing—original draft preparation: M.F.; writing—review and editing: F.R. and J.G.
Funding
This project was fully funded by the FRISK project PTDC/AAG-MAA/0350/2014 from the Foundation for Science and Technology (FCT). Additionally, Portuguese national funds were received from the Foundation for Science and Technology through the strategic plan of the Marine and Environmental Sciences Centre (MARE) (UID/Multi/04326/2019), and a fellowship attributed to F.R. by FRISK Project (BCC FCT Ref. PTDC/AAG-MAA/0350/2014).
Acknowledgments
We are deeply appreciative to professional fishermen João Lobo Cristino, Francisco Pinto, Carlos Serras, and Mário Costa, who kindly provided several specimens to be analyzed, and to José Freitas, who was always our connection point with the Tagus River fishermen. The authors are thankful to the Fish Invasions Lab team, specifically Christos Gkenas for help in statistical analysis and Diogo Ribeiro that helped in prey items identification and sampling.
Conflicts of Interest
The authors declare no conflict of interest.
References
- Didham, R.K.; Tylianakis, J.M.; Hutchison, M.A.; Ewers, R.M.; Gemmell, N.J. Are invasive species the drivers of ecological change? Trends Ecol. Evol. 2005, 20, 470–474. [Google Scholar] [CrossRef] [PubMed]
- Ribeiro, F.; Leunda, P.M. Non-native fish impacts on Mediterranean freshwater ecosystems: Current knowledge and research needs. Fish. Manag. Ecol. 2012, 19, 142–156. [Google Scholar] [CrossRef]
- Godinho, F.N.; Ferreira, M.T. Diet composition of largemouth black bass, Micropterus salmoides (Lacepede), in southern Portuguese reservoirs: Its relation to habitat characteristics. Fish. Manag. Ecol. 1994, 1, 129–137. [Google Scholar] [CrossRef]
- Ribeiro, D. Diet of the Pikeperch Sander Lucioperca (Linnaeus, 1758) in Three Portuguese Reservoirs. Bachelor Thesis, Instituto de Ciências Biomédicas Abel Salazar, Porto, Portugal, 2017. [Google Scholar]
- Ribeiro, F.; Collares-Pereira, M.J.; Moyle, P.B. Non-native fish in the fresh waters of Portugal, Azores and Madeira Islands: A growing threat to aquatic biodiversity. Fish. Manag. Ecol. 2009, 16, 255–264. [Google Scholar] [CrossRef]
- Gkenas, C.; Gago, J.; Mesquita, N.; Alves, M.J.; Ribeiro, F. Short communication First record of Silurus glanis Linnaeus, 1758 in Portugal (Iberian Peninsula). J. Appl. Ichthyol. 2015, 31, 756–758. [Google Scholar] [CrossRef]
- Ribeiro, F.; Gante, H.F.; Sousa, G.; Filipe, A.F.; Alves, M.J.; Magalhães, M.F. New records, distribution and dispersal pathways of Sander lucioperca in Iberian freshwaters. Cybium 2009, 33, 255–256. [Google Scholar]
- Stolyarov, I.A. Dietary features of catfish, Silurus glanis, and pike-perch, Stizostedion lucioperca in Kizlyarsk Bay, northern Caspian Sea. J. Ichthyol. 1985, 25, 140–145. [Google Scholar]
- Vejřík, L.; Vejříková, I.; Blabolil, P.; Eloranta, A.P.; Kočvara, L.; Peterka, J.; Sajdlová, Z.; Chung, S.H.T.; Šmejkal, M.; Kiljunen, M.; et al. European catfish (Silurus glanis) as a freshwater apex predator drives ecosystem via its diet adaptability. Sci. Rep. 2017, 7, 15970. [Google Scholar] [CrossRef]
- Bekbergenov, Z.H.; Sagitov, N.I. Feeding habits of juveniles of some commercial fishes in the Amu Dar’ya River. J. Ichthyol. 1984, 24, 18–22. [Google Scholar]
- Mihálik, J. Der Wels. Die Neue Brehm-Bucherei, 2nd ed.; Westarp Wissenschaften: Magdeburg, Germany, 1995. [Google Scholar]
- Omarov, O.P.; Popova, O.A. Feeding behavior of pike, Esox lucius, and catfish, Silurus glanis, in the Arakum Reservoirs of Dagestan. J. Ichthyol. 1985, 25, 25–36. [Google Scholar]
- Cucherousset, J.; Boulêtreau, S.; Azémar, F.; Compin, A.; Guillaume, M.; Santoul, F. Freshwater killer whales: Beaching behavior of an alien fish to hunt land birds. PLoS ONE 2012, 7, e50840. [Google Scholar] [CrossRef] [PubMed] [Green Version]
- Copp, G.H.; Robert Britton, J.; Cucherousset, J.; García-Berthou, E.; Kirk, R.; Peeler, E.; Stakėnas, S. Voracious invader or benign feline? A review of the environmental biology of European catfish Silurus glanis in its native and introduced ranges. Fish Fish. 2009, 10, 252–282. [Google Scholar] [CrossRef]
- Haubrock, P.J.; Azzini, M.; Balzani, P.; Inghilesi, A.F.; Tricarico, E. When alien catfish meet—Resource overlap between the North American Ictalurus punctatus and immature European Silurus glanis in the Arno River (Italy). Ecol. Freshw. Fish 2019, 1–14. [Google Scholar] [CrossRef] [Green Version]
- Guillerault, N.; Bouletreau, S.; Iribar, A.; Valentini, A.; Santoul, F. Application of DNA metabarcoding on faeces to identify European catfish Silurus glanis diet. J. Fish Biol. 2017, 90, 2214–2219. [Google Scholar] [CrossRef]
- Syväranta, J.; Cucherousset, J.; Kopp, D.; Crivelli, A.; Céréghino, R.; Santoul, F. Dietary breadth and trophic position of introduced European catfish Silurus glanis in the River Tarn (Garonne River basin), southwest France. Aquat. Biol. 2010, 8, 137–144. [Google Scholar] [CrossRef]
- Carol, J.; Benejam, L.; Benito, J.; García-Berthou, E. Growth and diet of European catfish (Silurus glanis) in early and late invasion stages. Fundam. Appl. Limnol. Arch. Hydrobiol. 2009, 174, 317–328. [Google Scholar] [CrossRef]
- Gago, J.; Anastácio, P.; Gkenas, C.; Banha, F.; Ribeiro, F. Spatial distribution patterns of the non-native European catfish, Silurus glanis, from multiple online sources–a case study for the River Tagus (Iberian Peninsula). Fish. Manag. Ecol. 2016, 23, 503–509. [Google Scholar] [CrossRef] [Green Version]
- Cabral, M.J.; Almeida, J.; Almeida, P.R.; Dellinger, T.; Ferrand de Almeida, N.; Oliveira, M.E.; Palmeirim, J.M.; Queirós, A.I.; Rogado, L.; Santos-Reis, M. Livro Vermelho dos Vertebrados de Portugal; Instituto da Conservação da Natureza: Lisbon, Portugal, 2005. [Google Scholar]
- Sabater, S.; Feio, M.J.; Graça, M.A.; Muñoz, I.; Romaní, A. The Iberian Rivers. In Rivers of Europe, 1st ed.; Tockner, K., Uehlinger, U., Robinson, C.T., Eds.; Academic Press: Cambridge, MA, USA, 2009; pp. 113–149. [Google Scholar]
- Veríssimo, A.; Gante, H.F.; Santos, C.D.; Cheoo, G.; Oliveira, J.M.; Cereja, R.; Ribeiro, F. Distribution and demography of the critically endangered Lisbon arched-mouth nase, Iberochondrostoma olisiponense. Fishes Mediterr. Environ. 2018, 2018, 13. [Google Scholar] [CrossRef]
- Slavík, O.; Horký, P.; Bartoš, L.; Kolářová, J.; Randák, T. Diurnal and seasonal behaviour of adult and juvenile European catfish as determined by radio-telemetry in the River Berounka, Czech Republic. J. Fish Biol. 2007, 71, 104–114. [Google Scholar] [CrossRef]
- International Council for the Exploration of the Sea. Report of the Workshop on Lampreys and Shads (WKLS); ICES CM 2014/SSGEF:13; International Council for the Exploration of the Sea: Lisbon, Portugal, 2014. [Google Scholar]
- International Council for the Exploration of the Sea. Report of the Joint EIFAAC/ICES/GFCM Working Group on Eels (WGEEL); ICES CM 2017/ACOM:15; International Council for the Exploration of the Sea: Kavala, Greece, 2017. [Google Scholar]
- Knoppel, H.A. Food of Central Amazonian fishes. Contribution to the nutrient-ecology of Amazonian rain-forest-streams. Amazoniana 1970, 2, 257–352. [Google Scholar]
- Escala, M.; Miranda, R. Guía de identificación de restos óseos de los Ciprínidos presentes en España. Escamas, opérculos, cleitros y arcos faríngeos. Publ. Biol. Univ. Navarra. Ser. Zoológica 2002, 28, 1–239. [Google Scholar]
- Torres Rojas, Y.; Hernandez Herrera, A.; Ortega-Garcia, S.; Domeier, M. Stable isotope differences between blue marlin (Makaira nigricans) and striped marlin (Kajikia audax) in the southern Gulf of California, Mexico. Bull. Mar. Sci. 2013, 89, 421–436. [Google Scholar] [CrossRef] [Green Version]
- Hyslop, E.J. Stomach contents analysis—A review of methods and their application. J. Fish Biol. 1980, 17, 411–429. [Google Scholar] [CrossRef] [Green Version]
- Amundsen, P.A.; Gabler, H.M.; Staldvik, F.J. A new approach to graphical analysis of feeding strategy from stomach contents data—Modification of the Costello (1990) method. J. Fish Biol. 1996, 48, 607–614. [Google Scholar] [CrossRef]
- Oksanen, J.; Blanchet, F.G.; Kindt, R.; Legendre, P.; O’hara, R.B.; Simpson, G.L.; Solymos, P.; Stevens, M.H.H.; Wagner, H.H. Vegan: Community Ecology Package. R Package Version 1.17-4. 2010. Available online: http://cran. r-project. org (accessed on 16 January 2019).
- Clarke, K.R.; Tweedley, J.R.; Valesini, F.J. Simple shade plots aid better long-term choices of data pre-treatment in multivariate assemblage studies. J. Mar. Biol. Assoc. UK 2014, 94, 1–16. [Google Scholar] [CrossRef] [Green Version]
- Gkenas, C.; Magalhães, M.F.; Cucherousset, J.; Orjuela, R.L.; Ribeiro, F. Dietary niche divergence between two invasive fish in Mediterranean streams. Knowl. Manag. Aquat. Ecosyst. 2019, 24. [Google Scholar] [CrossRef]
Figure 1.
Prey cumulation curves for S. glanis captured in both habitats, lotic in blue and lentic in green. Calculated using a randomized method with 1000 permutations, with variation represented by polygons extending from the solid line.
Figure 1.
Prey cumulation curves for S. glanis captured in both habitats, lotic in blue and lentic in green. Calculated using a randomized method with 1000 permutations, with variation represented by polygons extending from the solid line.

Figure 2.
Modified Costello graphs for the fish collected in (a) lentic and (b) lotic systems. Prey proportion per stomach (Pi) as a function of frequency of observation (FO).
Figure 2.
Modified Costello graphs for the fish collected in (a) lentic and (b) lotic systems. Prey proportion per stomach (Pi) as a function of frequency of observation (FO).

Figure 3.
Ontogenic variation of the S. glanis diet representing prey abundance (%) per Size Class (Total length, cm) of both environmental populations. Lentic and lotic environments of S. glanis in the Tagus main stem. The number above each column represents the sample size.
Figure 3.
Ontogenic variation of the S. glanis diet representing prey abundance (%) per Size Class (Total length, cm) of both environmental populations. Lentic and lotic environments of S. glanis in the Tagus main stem. The number above each column represents the sample size.

Figure 4.
Non-metric multidimensional analysis (NMDS) overlapping the dietary spectrum for S. glanis in both the lentic (LENT) and lotic (LOT) habitats. The numbers 1, 2, and 3 in each habitat group refer to individual size, with 1 representing individuals 0–50 cm, 2 representing individuals 51–100 cm, and 3 representing individuals 101 cm+.

Figure 5.
Location of the (a) Tagus in Iberian Peninsula and (b) Portuguese Tagus with both sections highlighted. Lotic section ( ![Fishes 04 00058 i001]() ) and lentic section (
) and lentic section ( ![Fishes 04 00058 i002]() ).
).
 ) and lentic section (
  ).
).
Figure 5.
Location of the (a) Tagus in Iberian Peninsula and (b) Portuguese Tagus with both sections highlighted. Lotic section ( ![Fishes 04 00058 i001]() ) and lentic section (
) and lentic section ( ![Fishes 04 00058 i002]() ).
).
) and lentic section ( ).
Figure 6.
Diagram explanation of the modified Costello method, as per Amundsen et al. (1996).


Table 1.
Mean total length (TL) and eviscerated weight (EW), per size class with respective sample size (N) and sex ratio. In the lotic environment, none of the fishes measuring >101 cm had identifiable prey in their stomachs and were disregarded for the remaining analysis. Sex is represented by male (M), female (F), and immature (I).
| Lotic Environment | Lentic Environment | |||||||
|---|---|---|---|---|---|---|---|---|
| Size Class (cm) | N | TL (cm) | EW (g) | Sex (M:F:I) | N | TL (cm) | EW (g) | Sex (M:F:I) |
| 0–50 | 16 | 36.8 ± 4.6 | 306.2 ± 119.7 | 3:0:13 | 8 | 35.5 ± 1.5 | 301.6 ± 43.5 | 2:2:4 |
| 51–100 | 22 | 59.3 ± 7.3 | 1364.6 ± 740.6 | 10:8:4 | 15 | 71.4 ± 13.3 | 2392.1 ± 1353.2 | 4:7:4 |
| >101 | - | - | - | - | 5 | 118.4 ± 9.5 | 10572 ± 2858.3 | 3:2:0 |
Table 2.
Variation of relative numerical prey abundance (AN, %) and frequency of occurrence (FO, %) of food items found in the guts of Silurus glanis in the two main habitats of the Tagus River. Statistical differences among habitats were obtained by Mann–Whitney tests. ** P < 0.01, *** P < 0.001; n.s.: not significant. Number of analized species (N); number of identified prey items (n).
| Lotic Habitat N = 38, n = 355 | Lentic Habitat N = 28, n = 111 | |||
|---|---|---|---|---|
| Food Item | AN (%) | FO (%) | AN (%) | FO (%) |
| Crustaceans | 74.5 | 55.8 | 92.6 | 71.4 |
| Atyaephyra desmaresti ** | 63.4 | 51.2 | 45.7 | 25.0 |
| Amphipoda | 10.5 | 11.6 | 2.5 | 9.5 |
| Procambarus clarkia *** | 0.6 | 2.3 | 44.4 | 53.6 |
| Fish ** | 18.3 | 39.5 | 7.3 | 7.1 |
| Pomatoschistus sp. | 5.5 | 4.7 | - | - |
| Anguilla anguilla | 3.9 | 11.6 | - | - |
| Atherina boyerii | 2.8 | 7.0 | - | - |
| Luciobarbus sp. | 2.5 | 11.6 | 1.2 | 3.6 |
| Petromyzon marinus | 1.9 | 9.3 | - | - |
| Alosa sp. | 0.8 | 2.3 | - | - |
| Alburnus alburnus | 0.6 | 2.3 | - | - |
| Chelon ramada | 0.3 | 2.3 | - | - |
| Carassius sp. | - | - | 3.7 | 3.6 |
| Cyprinus carpio | - | - | 1.2 | 3.6 |
| Silurus glanis | - | - | 1.2 | 3.6 |
| Other prey ** | 7.2 | 20.9 | - | - |
© 2019 by the authors. Licensee MDPI, Basel, Switzerland. This article is an open access article distributed under the terms and conditions of the Creative Commons Attribution (CC BY) license (http://creativecommons.org/licenses/by/4.0/).
Share and Cite
MDPI and ACS Style
Ferreira, M.; Gago, J.; Ribeiro, F. Diet of European Catfish in a Newly Invaded Region. Fishes 2019, 4, 58. https://0-doi-org.brum.beds.ac.uk/10.3390/fishes4040058
AMA Style
Ferreira M, Gago J, Ribeiro F. Diet of European Catfish in a Newly Invaded Region. Fishes. 2019; 4(4):58. https://0-doi-org.brum.beds.ac.uk/10.3390/fishes4040058
Chicago/Turabian StyleFerreira, Marco, João Gago, and Filipe Ribeiro. 2019. "Diet of European Catfish in a Newly Invaded Region" Fishes 4, no. 4: 58. https://0-doi-org.brum.beds.ac.uk/10.3390/fishes4040058