Article

Comparing Body Density of Lumpfish (Cyclopterus lumpus) to Different Operational Welfare Indicators

by
Albert Kjartan Dagbjartarson Imsland
1,2,*,†,
Magnus Sunason Berg
2,†,
Gyri Teien Haugland
2 and
Kirstin Eliasen
3
1
Akvaplan-niva Iceland Office, Akralind 4, 201 Kopavogur, Iceland
2
Department of Biological Sciences, University of Bergen, High Technology Centre, 5020 Bergen, Norway
3
Fiskaaling, Við Áir 11, Hvalvik 430, Faroe Islands
*
Author to whom correspondence should be addressed.
These authors contributed equally to this work.
Submission received: 7 September 2022 / Revised: 30 September 2022 / Accepted: 10 October 2022 / Published: 13 October 2022
(This article belongs to the Special Issue Cleaner Fish in Aquaculture)

Abstract

:
Farmed lumpfish (Cyclopterus lumpus) are commonly used as cleaner fish in the salmonid aquaculture industry, but a knowledge gap exists with regards to their body density. Filling this knowledge gap is of importance, as the lumpfish has no swim bladder and thus relies on alternative methods for buoyancy, i.e., the body density difference between the fish and its surroundings. The aims of this study were to measure the body density of lumpfish and investigate the correlation between body density and different operational welfare indicators. A total of 138 lumpfish were sampled at five different aquaculture sites situated in the Faroe Islands. Weight in water and air was measured, body density was calculated, and operational welfare was assessed. The average body density of the juvenile lumpfish was 1.030 g mL−1. Fulton’s K, stomach score, and length were negatively correlated to body density, while the hepatosomatic index was positively correlated to body density. Liver colour was correlated to body density, but the groupings were too broad for a final definitive conclusion. The knowledge gained from this study might help the industry improve their understanding of the operational welfare indicators used for lumpfish. Additionally, the knowledge might also help the aquaculture industry improve their husbandry and feeding practices.

1. Introduction

Lumpfish are commonly used as cleaner fish in the Atlantic salmon industry and have been farmed for the purpose since 2012 [1]; however, general knowledge about the fish physiology is lacking [2,3,4]. One of the knowledge gaps which exists within the literature is with regards to buoyancy of farmed lumpfish deployed as cleaner fish. Davenport and Kjørsvik [5] measured body density of wild lumpfish, and to our knowledge, this is the only study that to date has looked at body density of lumpfish. Lumpfish have no swim bladder and rely on lipid storage, a cartilaginous bone structure, a subcutaneous jelly, dorsal muscles, and some low-density fluids for buoyancy [5]. The source of buoyancy from muscles was found to differentiate between female and male lumpfish, where the male uses more lipids, while the female uses a higher water content and reduced fiber-bundle diameter for buoyancy [5]. Lipids act as an energy storage and a source of buoyancy for fish [6,7], and thus, it might be suspected that a starving lumpfish will use up its energy reserves which will then decrease its buoyancy. Because of this possible interaction, knowing more about buoyancy in lumpfish used in aquaculture might benefit the industry, as starvation is a common cause of death for deployed lumpfish [4]. In addition to starvation, several other welfare problems exist, such as diseases and physical damage. To assess potential welfare problems, the industry uses operational welfare indicators (OWIs). OWIs are usually scores where low values indicate good health while high values indicate bad health. Examples of OWIs include fin scores, skin scores and hepatosomatic index [2,8,9]. Correlations might exist between commonly used OWIs and body density, as compromised health might result in stress and consequently reduced appetite [10].
The main objective in this study was to measure the body density of farmed lumpfish used as cleaner fish and compare it with wild lumpfish from existing literature. Additionally, possible correlations between common OWIs and body density were investigated.

2. Materials and Methods

2.1. Experimental Fish and Location

The lumpfish were randomly collected from Atlantic salmon farms belonging to Bakkafrost, HiddenFjord, and MOWI. The location of the study was in the northern parts of the Faroe Islands. To keep the companies anonymous, the locations were labelled A, B, C, D, and E (Table 1). The current measurements for locations D and E were not average current at 10 m dept but measured currents at the localities. Locations A, B, and C used Faroese lumpfish that were reared in the Faroe Islands and locations D and E used lumpfish imported as juveniles from Iceland.

2.2. Sample Collection

A total of 138 lumpfish were sampled from five different aquaculture sites (Table 1), and the locations had the following number of fish sampled; A = 30, B = 47, C = 23, D = 15, and E = 23. All of the samples were taken out of the same fish pen at each location. Locations A and B were sampled two times per month while location C had monthly samplings and locations E and D had a single sampling. At locations A-C, all the samplings were done from the same sea pen, 10 lumpfish at a time, in the timespan from September to November 2020 while locations D and E were sampled on 15 October 2020 and 19 October 2020, respectively. The lumpfish were caught with a dip net (1.5 m pole Ø30 mm, 30 × 30 net with 5 mm holes) at the edge of the pen. Because lumpfish tend to gulp air when they are exposed to air, and air bubbles in the stomach interfere with the weight measurements in water (observation during the first sampling), it was important to keep the lumpfish submerged, during sampling. This was done by keeping the dip net submerged, while the lumpfish were transported into a plastic bag (25 × 50 cm 6 L) filled with seawater. The bag with lumpfish was then moved to a 20 L bucket with seawater, which the lumpfish, still submerged, were released into.
The lumpfish were then transported to the laboratory. Transport from the fish pen to the laboratory, it took approximately 10–20 min. At the laboratory, an aquarium pump was put into the bucket to keep the water oxygenated. The pump used was a PUMP (1.5 W) from Collar global (Chernihiv, Ukraine) and is suitable for oxygenating aquariums up to 100 L. When it was time to make the measurements, one lumpfish at a time was moved to another 20 L bucket with seawater, where it was humanely euthanized with an overdose 0.6 g L−1 of Finquel (also known as MS-222) (Tjaldurs Apotek, Tórshavn, Faroe Islands).

2.3. Measuring Body Density of Lumpfish

The methods for measuring body density were modified from [5]. The lumpfish were weighed in seawater, which was done by hooking them to a fishhook connected to a nylon thread (0.16 mm) that was attached to a scale. The scale (Salter 1260 SVDR Precision Electronic Scale (Kent, UK)) had a measurement accuracy of 0.05 g. However, if the fish weighed more than 200 g, the accuracy declined to 0.1 g. After the fish had been weighed in water, it was weighed in air on the same scale. The temperature and salinity of the seawater was measured for each fish so that the body density could be calculated (see Equation (1)). The salinity and temperature were measured with a Pro30 (YSI, Yellow Springs, OH, USA).
When the weight of the lumpfish in water and air had been found, the following equations were used to calculate the body density of the fish. The equations are modified from [5,12].
The body density of the lumpfish was found by using Equation (1); however, the upthrust from water (u), the volume of the fish (v), and the seawater density ( ρ ) had to be calculated first. This was done by Equations (2)–(4), respectively.
p = w/v
where: p = fish body density (g mL−1); w = weight in air (g); v = volume of fish
u = w − w′
where: w = weight in air (g); w′ = weight in water (g); u = upthrust from water
v = u/ρ
where: v = volume of fish (mL); ρ = sea water density (g mL−1).
ρ (S,T,0) = ρ0 + ASPS + BSPS1.5 + CSPS2
where: S = salinity of seawater in parts per thousand by volume (ppt); ρ0 = density of pure water in kg/m3; ASPS + BSPS1.5 + CSPS2 = coefficients depending on the water temperature.

2.4. Hepatosomatic Index (HSI)

The hepatosomatic index, hereinafter referred to as HSI, was defined as ratio of liver weight to total body weight [2,8,13]. An anteroposterior cut was made on the left side of the lumpfish from where the liver was extracted. When the liver had been extracted, the liver weight was measured (same weight and accuracy as described above), and the HSI was calculated (Equation (5)).
HSI = 100 × (liver weight/total body weight)

2.5. Condition Factor

To determine the condition factor of the lumpfish, Fulton’s K factor (Equation (6)) was used. The formula used in this research study was from [2].
Fulton’s K is usually calculated from the total length of the fish. However, since tail damage can influence the total length, standard length was used instead, which is length from mouth to the start of the tail. This makes the Fulton’s K values larger, but the values still reflect the condition of the fish.
K = 100 × (W/L3)
where: K = condition factor; W = weight in g; L = standard length in cm.

2.6. Operational Welfare Indicators

The overall health of the fish was determined by using the OWIs; liver colour, fin score, skin score, hepatosomatic index, Fulton’s K, length, and weight.
The liver was grouped into 6 colours (1–6). According to [8], liver colour 1 can be an indicator for disease if previous samplings at a location have shown livers of colour 2–4. Liver colours 2–4 are generally considered healthy livers, while liver colours 5–6 are considered a sign of starvation.
The skin was scored from 1–3, where 1 was skin with no wounds, 2 had signs of inflammation, and 3 had wounds. The fin was scored from 1–3, where 1 had no wear, 2 had some wear and 3 had much wear. The stomach fulness was scored from 1–3, where 1 was an empty stomach, 2 was partially full, and 3 was a full stomach.

2.7. Statistical Analyses

Statistical tests were performed in SPSS (233 South Wacker Drive, Chicago, IL, USA), STATISTICATM 14.0 (Tibco, 3307 Hillview Avenue, Palo Alto, CA, USA) and Microsoft Excel. To assess normality of distributions a Kolmogorov–Smirnov test [14] was used, and homogeneity of variances was tested using Levene’s F test. To test for possible differences in fish body density (dependent variable), a one-way analysis of variance (ANOVA) was used followed by Tukey multiple post hoc tests in cases of significant ANOVAs [14]. The independent variables in this test were the five locations (A–E, see Section 2.2 above) or the liver colour (1–5) as defined by [8]. Possible correlations between fish body density and Fulton’s K, HSI, weight and length were investigated using Pearson product–moment correlation coefficient [14]. A significance level (α) of 0.05 was used if not stated otherwise.

3. Results

3.1. Disease at Location D

Location D had a sample size of n = 15, but Cyclopterus lumpus virus (CluV) had been confirmed at the site, which can make the liver pale and firm [14] and might affect HSI (personal observation). Due to this, the samples from location D were excluded from the statistical analysis, to prevent interference. However, the samples from location D were still used to compare densities with the other locations (Figures 1, 2 and 5) as here these samples were in their own group and thus did not interfere with the other groups.

3.2. Body Density

The body density of the fish sampled varied from 1.024 g mL−1 to 1.036 g mL−1 (Figure 1). The body density varied between locations (one-way ANOVA, p < 0.05, Figure 1), with the lowest body density (mean ± SD) at location E (1.028 ± 0.002 g mL−1), and the highest body density at location B (1.031 ± 0.002 g mL−1).

3.3. Fulton’s K

No statistical differences were found in Fulton’s K between sampling locations. The average Fulton’s K ± SD value was 5.33 ± 0.80, and the median value was 5.19 (Figure 2). Fulton’s K was negatively correlated to body density (Persons r = −0.08, p < 0.05, Figure 3).

3.4. Welfare Status

Different OWIs such as fin, skin, and stomach scores were compared to body density. The fish with liver colour 1 had the highest body density (1.031 g mL−1, Figure 4). Fish with liver colour 2 had the lowest body density (1.025 g mL−1). Fish with liver colour 3 had the largest span in body density, spanning from 1.026 to 1.036 g mL−1.
The lowest 30 body density fish had an average (±SD) body density of 1.027 ± 0.007 g mL−1 while the highest 30 body density lumpfish had a body density of 1.033 ± 0.001 g mL−1 (Table 2). The average fin, skin, and stomach scores of the lowest 30 body-density lumpfish were 1.7, 1.5, and 2.3, respectively, while the highest 30 body density lumpfish had an average fin, skin, and stomach score of 1.6, 1.2, and 2.2, respectively (Table 2). The stomach fulness is an important indicator for fish welfare, especially in practical aquaculture and present data point to a relationship between higher density and lower stomach fullness (Table 2).

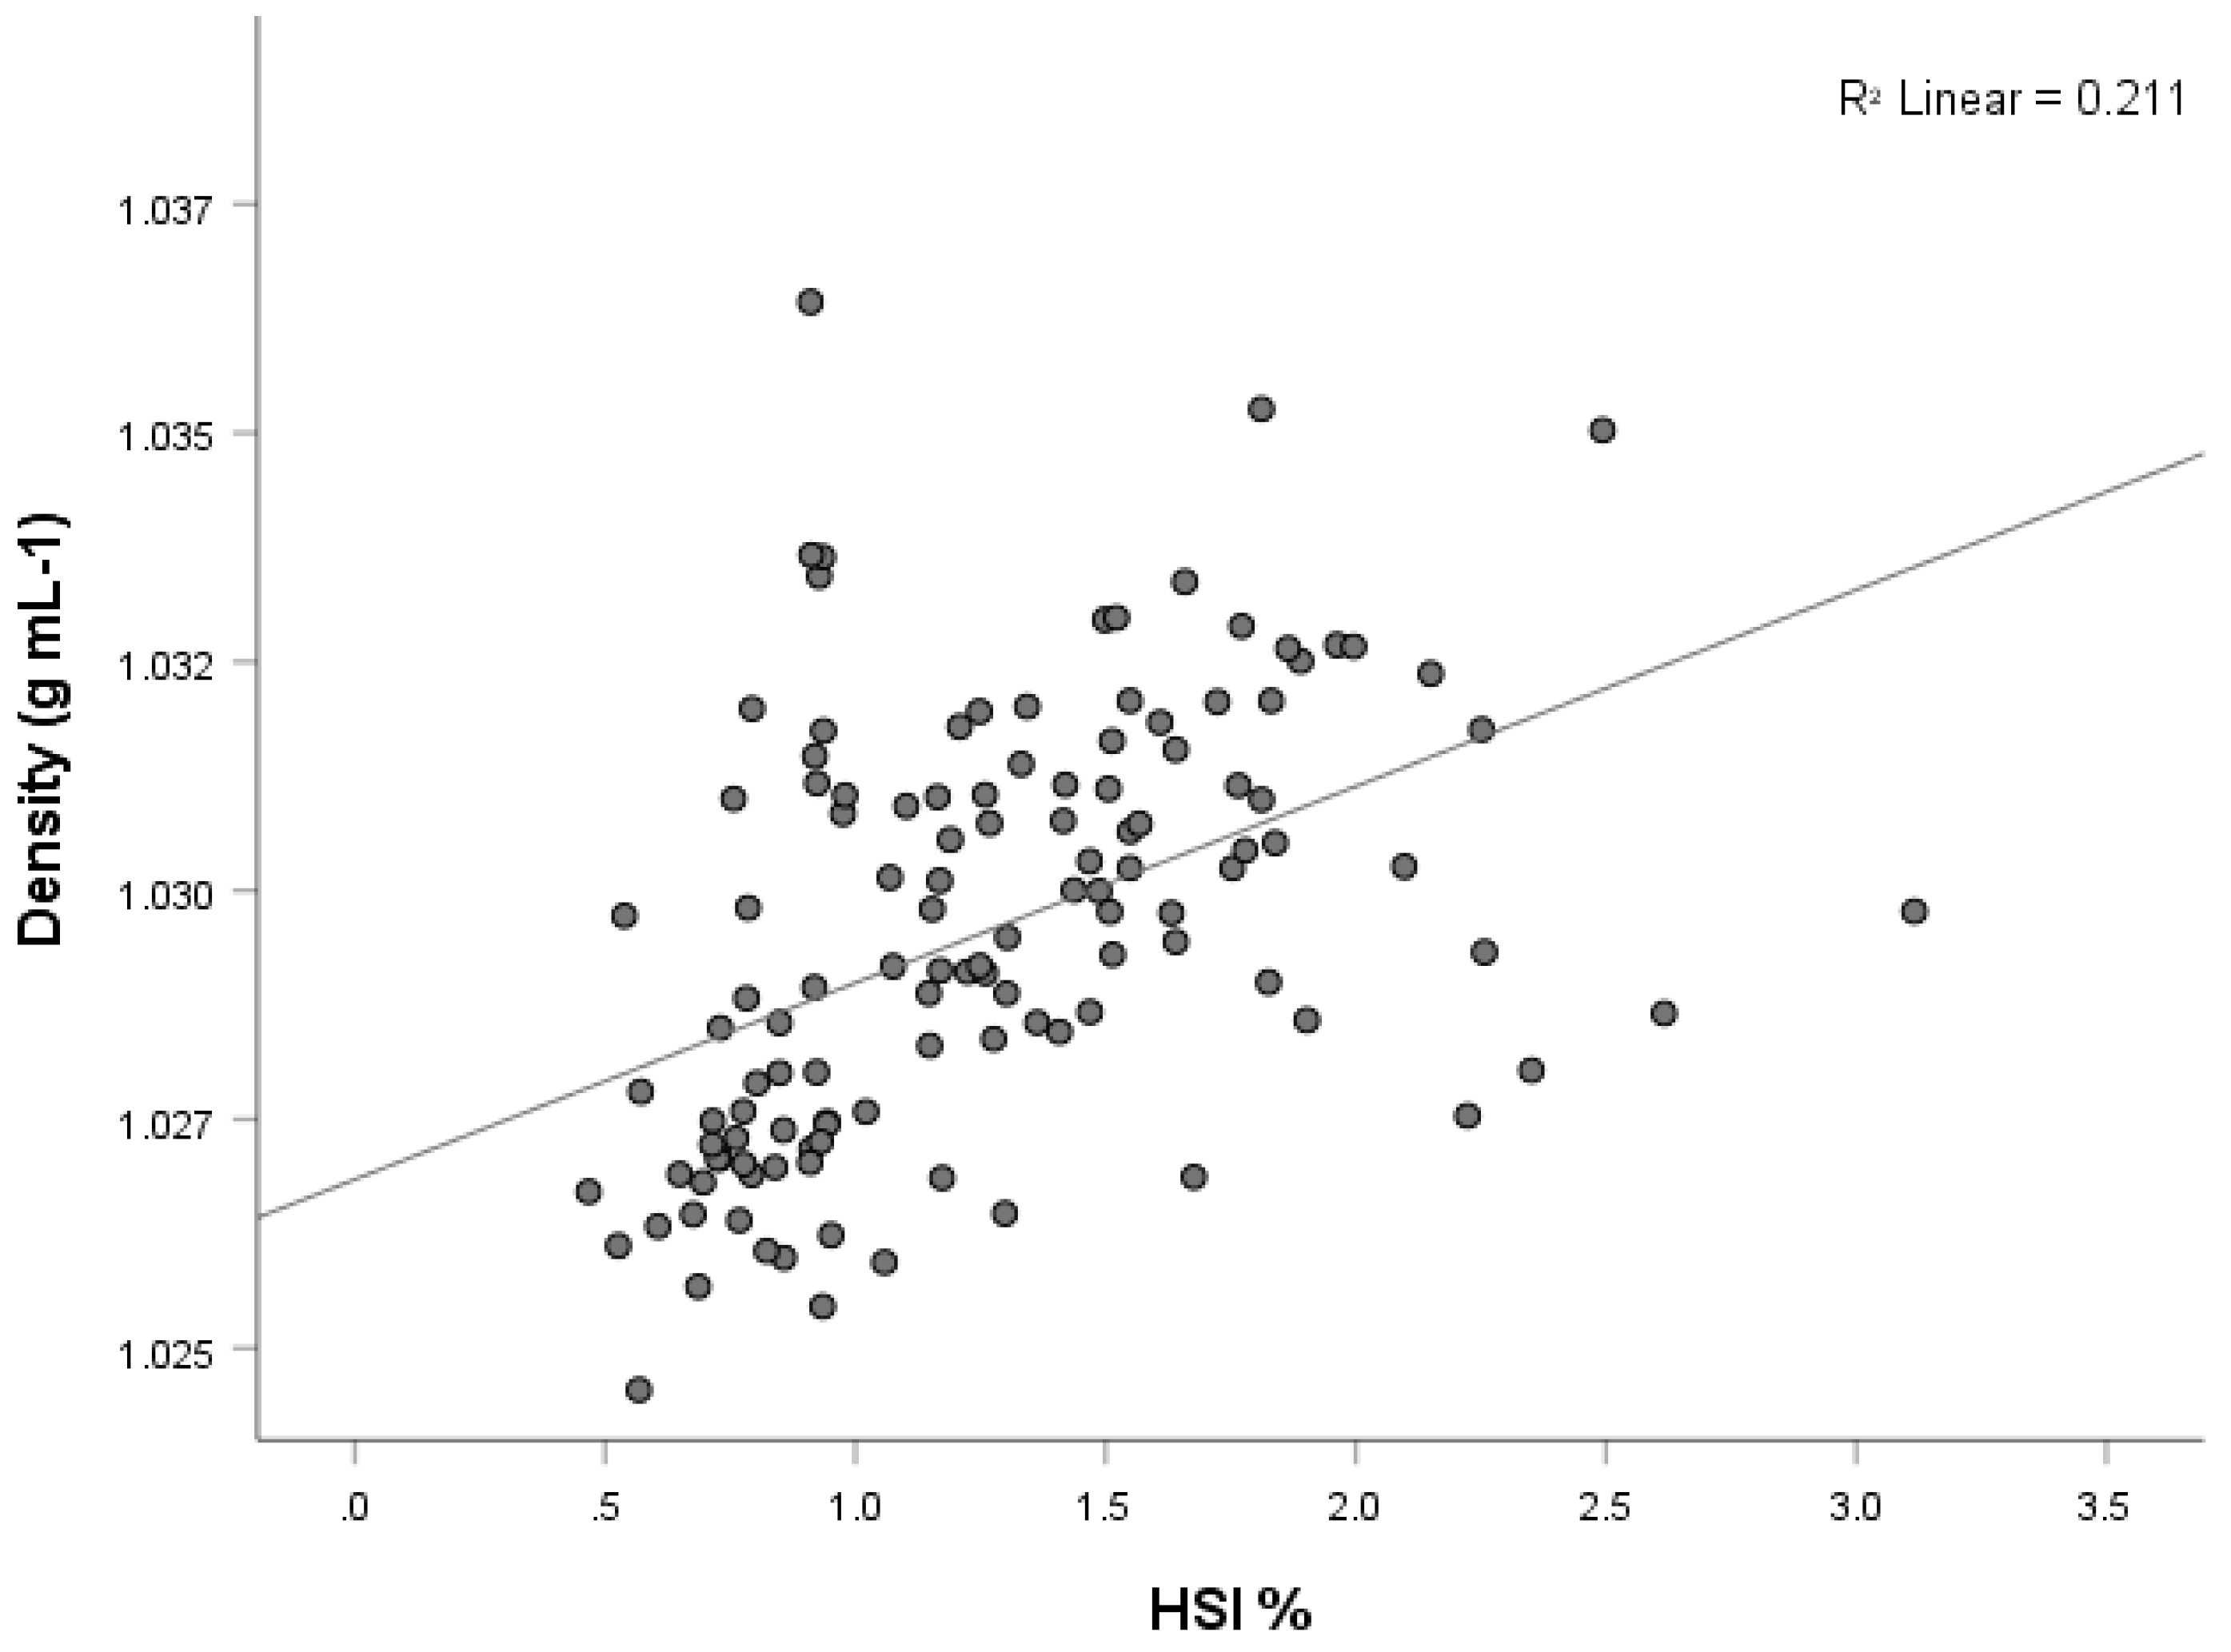
3.5. Hepatosomatic Index (HSI)

Locations A and D had the highest HSI (Tukey post hoc test, p < 0.05, Figure 5) HSI, and locations C and E had the lowest. The overall average HSI was 1.30 ± 0.51%. HSI was found to positively correlated to body density (r = 0.46, p < 0.001, Figure 6).

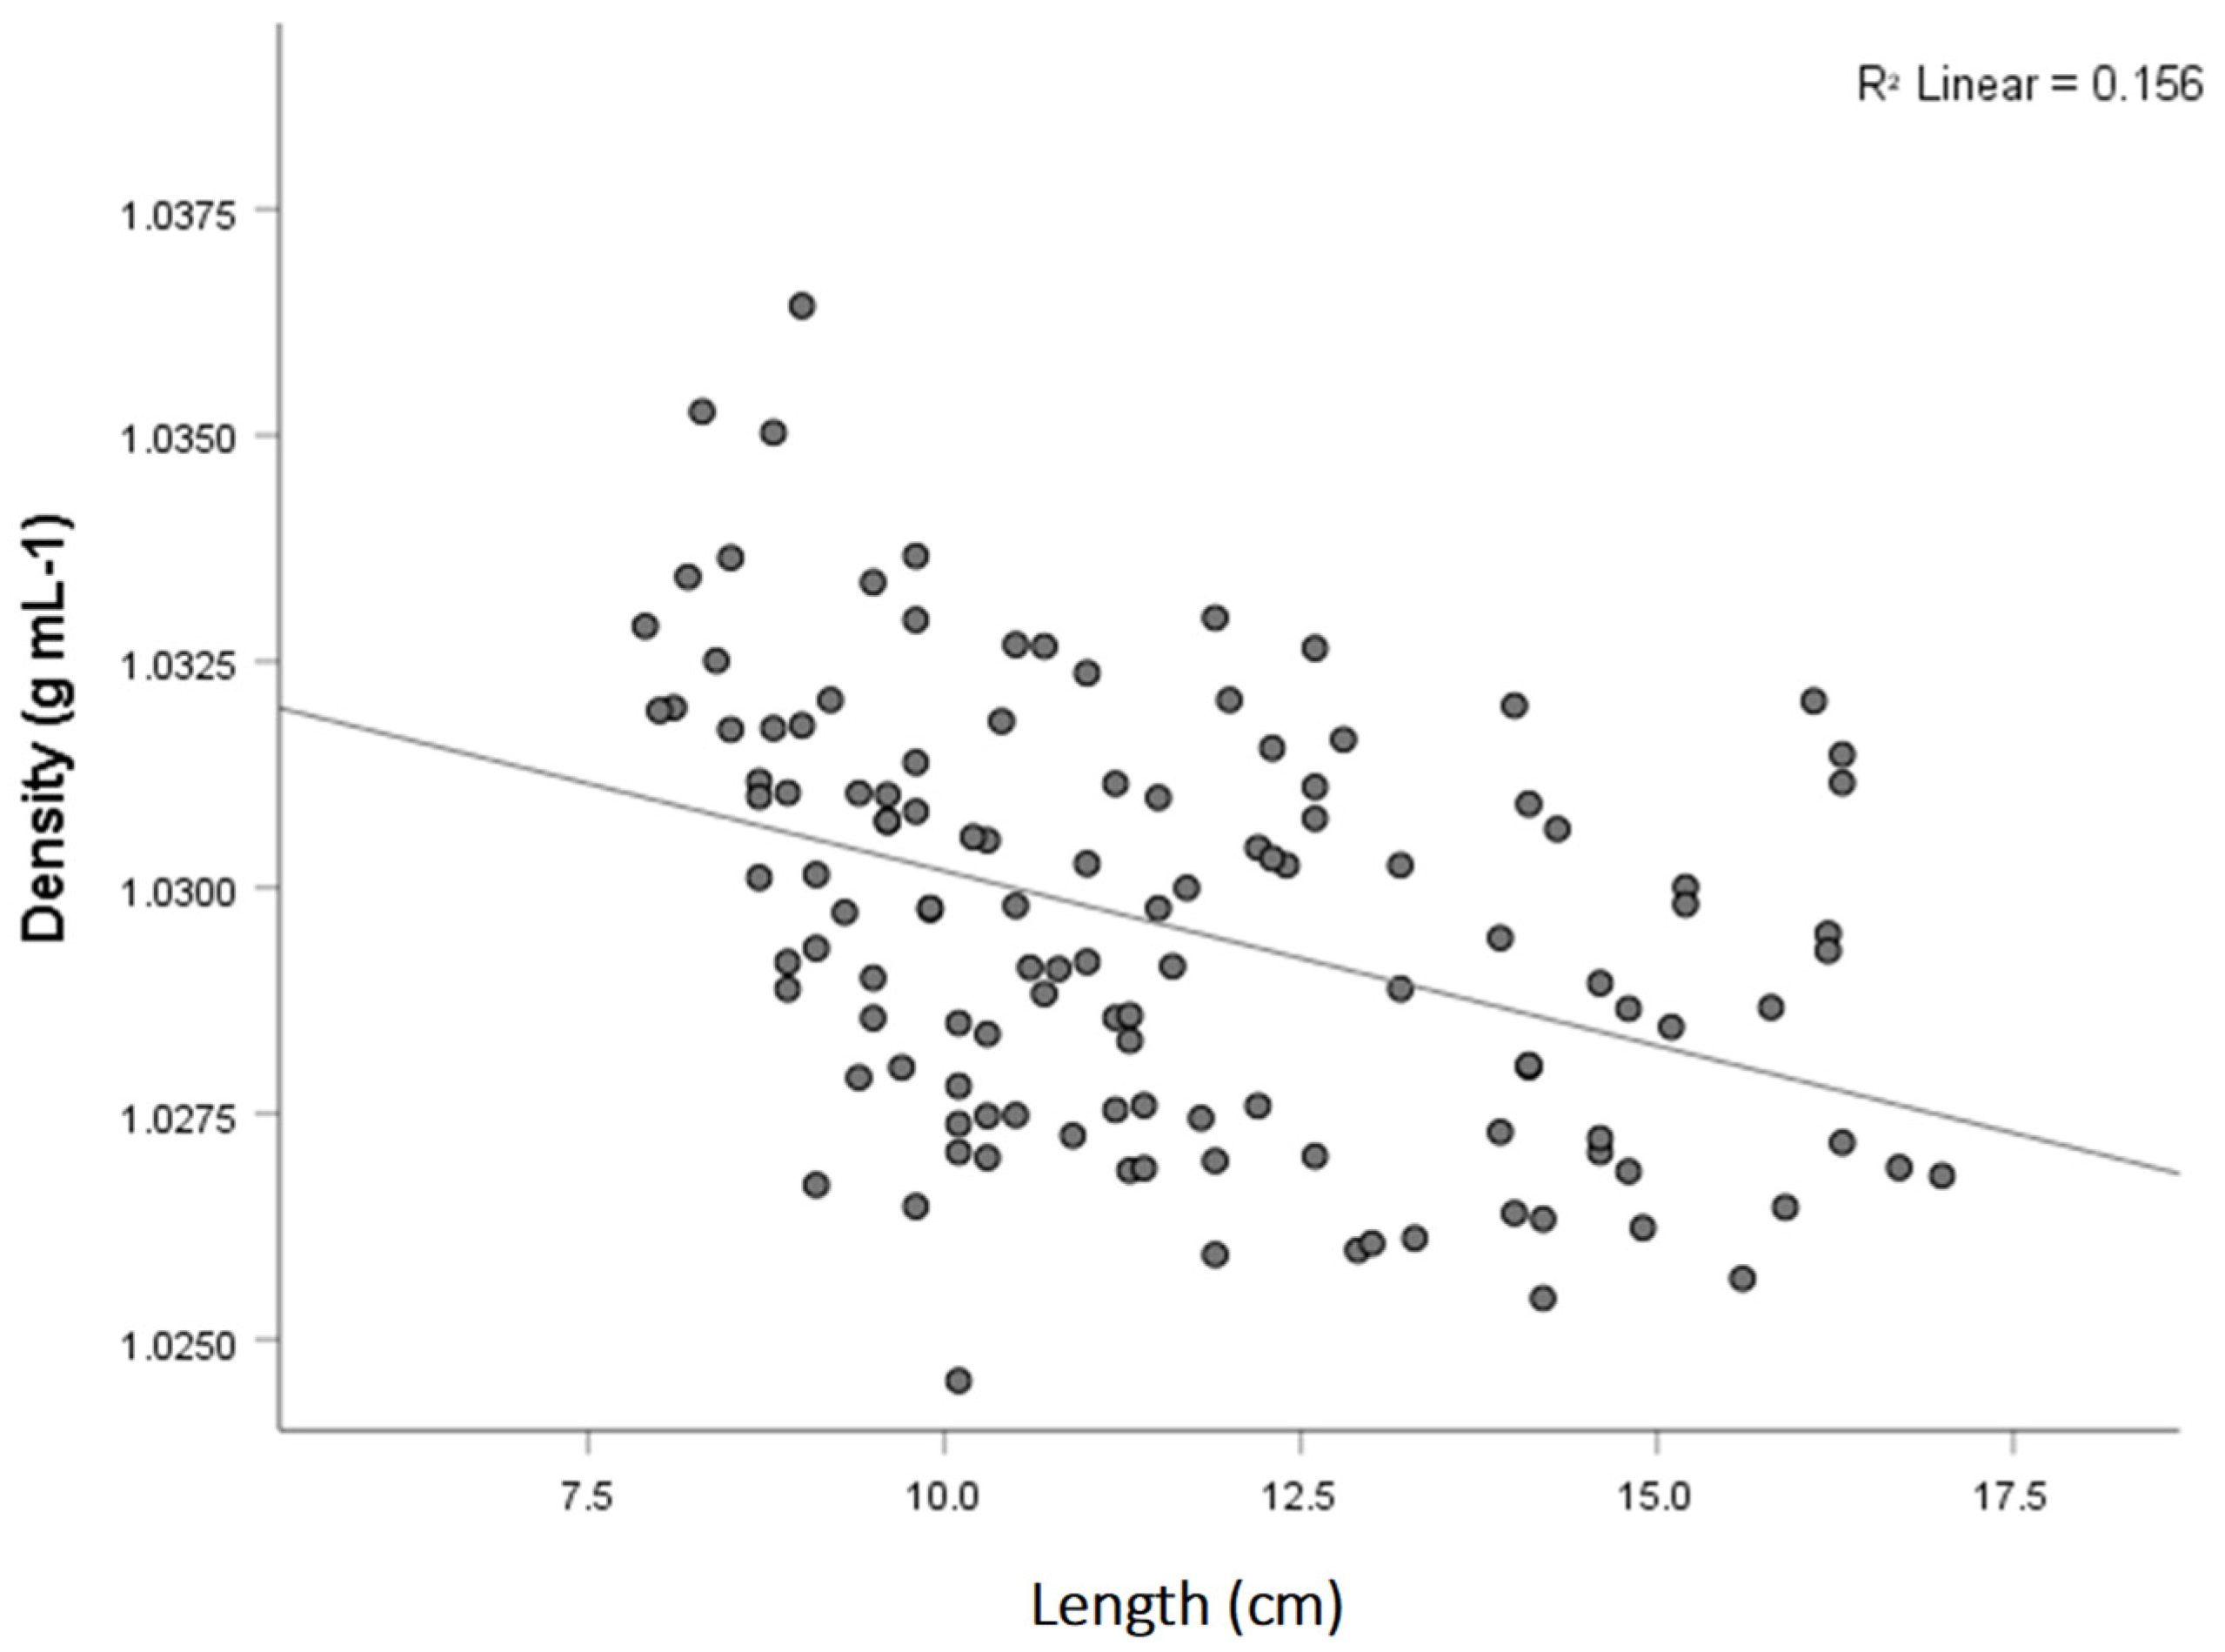
3.6. Length and Weight

A negative relationship was found between standard length and body density (r = −0.40, p < 0.01, Figure 7). No significant relationship was found between body density and weight (p > 0.2, Figure 8).

4. Discussion

4.1. Lumpfish Body Density and Welfare Status

Present data showed that the body density differences in the liver colours (Figure 4) were mixed evenly between 3 groups. Because the groupings of the liver colours were evenly mixed and because each group had liver colours spanning wide (group 1 goes from 1–4, etc.) it was difficult to conclude anything from this data and find any biological connections to the groups. However, if liver colour 1 is excluded, the body density increased from liver colour 2 to liver colour 4 and decreased again in liver colour 5, which agrees with the body density and HSI correlation from this study (Figure 6), and the data of [8]. The high body density of liver colour 1 was unexpected as the average HSI of liver colour 1 was low. The prevalence of empty stomachs in the fish with liver colour 1 was 62.5% which indicates that these fish were starving, and thus, starvation might explain the high body density. However, in fish with liver colour 5, which has been shown to be a sign of starvation according to [8], 61% of the stomachs were empty, and the body density was still low. The high body density in liver colour 1 might be explained by disease, but if this was the case, flavivirus was likely not the culprit, as the livers lacked one of the main symptoms, which was firmness [15].
The HSI was measured in the present study to investigate if it was possible to link the body density directly to the liver size. Even though the HSI varied, Tukey’s post hoc test indicated that liver colours 1, 2, 3, and 5 could be considered one group, while liver colours 1 and 4 were another group. Liver colour 4 was shown in [8] to be the liver colour of the healthy lumpfish and to be the liver colour with the highest his, and this is also the case in the present data. However, in [8], liver colour 5 had the lowest HSI which was different from the data in this study. Additionally, no liver with colour 6 was found in present study. This might be explained by prevalence, meaning that the prevalence of liver colour 6 in [8] makes it likely that in our sample size, liver colour 6 could have been missed.
Statistical testing of present data indicated that body density was positively correlated to HSI and that body density seemed to increase as the HSI increases which is in line with the results of [5]. During the sampling, the buoyancy of the livers was tested by dropping the livers into seawater, and they did sink, which further indicates that the liver does not contribute positively to density. This is further in agreement with [5], which stated that the liver does not play a role in positive buoyancy.
The stomach fulness score was the second OWI that had a significant relationship with body density in the present study. Linking this score to body density would most likely always give statistically significant scores as the stomach content adds to the weight of the fish and thus interferes with the density measurements. However, of the 30 highest body density fish, seven had empty stomachs while in the 30 lowest body density fish only one had an empty stomach. The average stomach fulness score was similar between these two groups although no statistical test was made.
When comparing the stomach fulness score with liver colours, a pattern emerges. A total of 21 stomachs were empty, and the most prevalent liver colour was liver colour 5 (n = 7) followed closely by liver colour 1 (n = 6). Liver colours 2 (n = 3), 3 (n = 2) and 4 (n = 3) had a lower prevalence, and this was to be expected. Fish with empty stomachs had a prevalence of 33% dark livers while fish with partially or full stomachs had a prevalence of 10% dark livers. A lumpfish with an empty stomach is generally considered a bad indicator of health [16,17], especially in an aquaculture sea pen where food is in abundance. The fact that the most prevalent liver colour was liver colour 5, which is a sign of hunger [8] (Eliasen et al., 2020), is a good indicator that the stomach fulness score is a useful tool for health indication. However, more sampling would be needed to do statistical tests for this conclusion, as the sample size of 21 stomachs is too small to compare it to the 5 groups of liver colours. If a link could be established with a stomach score of 1 and a dark liver colour, then stomach score and liver colour could be used as two OWIs that confirm each other.
The weight showed no statistical relationship to body density, whereas a negative relationship between body length and body density was found, i.e., longer fish generally had a lower body density. It might be that the larger fish have had time to build up lipid reserves, in their muscles and subcutaneous jelly, and thus have a lower body density. This is supported by location B having the lowest average length. Davenport and Kjørsvik [5] looked at lumpfish larvae and found that they had a significantly lower body density, which was most likely caused by a lack of a subcutaneous jelly which had not developed at this life stage. It is possible that the smaller lumpfish in location B still have not developed their subcutaneous jelly fully and thus have a higher body density.
The negative relationship between Fulton’s K and body density was expected, as a fish with a high Fulton’s K is fatter and most likely has a larger lipid reserve, which is one of the methods of buoyancy in lumpfish [5]. A high Fulton’s K value is considered a good welfare indicator [2], and this is confirmed by the negative relationship to body density that was found in this study. The relationship between body density and Fulton’s K shows how important it is to keep the lumpfish well fed, as the lumpfish with a low Fulton’s K also have a higher body density. This means that a lumpfish with a low Fulton’s K most likely uses more energy to stay afloat. This might force the lumpfish to use up more of their lipid storage which in turn lowers their Fulton’s K and increases their density even more. In the industry this means that if someone is considering starvation intervals as a method of motivating lice eating, it should be done with great caution and by personnel that knows about the relationship between density and Fulton’s K.

4.2. Lumpfish Body Density and Buoyancy Compared to Other Species

The body density of the lumpfish used in this study was similar to the female lumpfish measured in [5]. Davenport and Kjørsvik [5] compared the body density to other species such as the intertidal sea scorpion Cottus bubalis (Density = 1.0903 g mL−1) and the closely related arctic lumpsucker Eunicrotremus spinosus (Density = 1.0519 g mL−1) and concluded that the body density of lumpfish was remarkebly low compared to other teleost species. Additionally, arctic bentopelagic species, such as the rock cod Eleginops maclovinus (buoyancy = 4.43%) and the semi-pelagic Maori cod Paranotothenia magellanica (buoyancy = 3.88%), have a much lower buoyancy than the female lumpfish (buoyancy = 0.35%) [5,18]. Notothenioid fish have no swim bladder and studies about several species living in the Antarctic with regards to buoyancy have been made. Eastman [18] showed that several species are almost neutrally buoyant, ranging from a buoyancy of 0.6% (Pleuragramma antarticum) to approximately 6% (Bovichthys variegatus). Additionally, [19] measured the body density of (Dissostichus mawsoni) and measured it to have either no weight in water or a weight close to neutral buoyancy at 0.1%. It was noted that a fish that weights < 0.6% of its body weight in air compared to in water is considered neutrally buoyant, and thus, the lumpfish in this study might be considered neutrally buoyant as well [18].

5. Conclusions

Body density of the juvenile lumpfish used as cleaner fish in Faroese fish farms was shown to be similar to the body density of wild lumpfish. Fulton’s K, liver colour, HSI, standard length, and stomach fulness score were shown to be correlated to body density. Fulton’s K, stomach score, and standard length were negatively correlated to body density while HSI was positively correlated to body density.

Author Contributions

M.S.B.: investigation; conceptualization, and visualization; writing—original draft, review and editing; A.K.D.I. conceptualization, supervision; writing—original draft, review and editing; G.T.H. supervision; writing—review and editing; K.E. supervision; visualization. All authors have read and agreed to the published version of the manuscript.

Funding

This research received no external funding.

Institutional Review Board Statement

The present field trials were exempted from ethical approval as the fish were killed and no experiments with live animals were conducted.

Data Availability Statement

Not applicable.

Acknowledgments

The authors would like to thank the staff at the five aquaculture sites for helping with the sampling. Without your willingness to put aside some hours of work from your work schedule, to help us sample lumpfish, this would not have been possible. In addition to this, we would also like to thank Bakkafrost, Hiddenfjord, and Mowi for giving access to their fish pens and for the lumpfish that we were allowed to use for this research study.

Conflicts of Interest

There are no conflict of interest in relation to this study.

References

  1. Haugland, G.T.; Imsland, A.K.D.; Reynolds, P.; Treasurer, J. Application of biological control; use of cleaner fish. In Aquaculture Health Management: Design and Operational Approaches; Kibenge, F.S.B., Powell, M.D., Eds.; Elsevier: London, UK, 2020; pp. 319–369. [Google Scholar]
  2. Imsland, A.K.D.; Reynolds, P.; Lorentzen, M.; Eilertsen, R.A.; Micallef, G.; Tvenning, R. Improving survival and health of lumpfish (Cyclopterus lumpus L.) by the use of feed blocks and operational welfare indicators (OWIs) in commercial Atlantic salmon cages. Aquaculture 2020, 527, 735476. [Google Scholar] [CrossRef]
  3. Powell, A.; Treasurer, J.W.; Pooley, C.L.; Keay, A.J.; Lloyd, R.; Imsland, A.K.; Garcia de Leaniz, C. Cleaner fish for sea-lice control in salmon farming: Challenges and opportunities using lumpfish. Rev. Aquac. 2018, 10, 683–702. [Google Scholar] [CrossRef] [Green Version]
  4. Council for Animal Ethics. Er det Mulig å Bruke Rensefisk på en Etisk og Velferdsmessig Forsvarlig Måte i Norske Oppdrettsanlegg? In Norwegian. 2020. Available online: https://www.radetfordyreetikk.no/er-det-mulig-a-bruke-rensefisk-pa-en-etisk-og-velferdsmessig-forsvarlig-mate-i-norske-oppdrettsanlegg/?fbclid=IwAR0gLvlhTbeWtdpgGE6_8QKOnTRhfk-32x_XvyM986G7FRJ6sl3y1SxfKVg (accessed on 1 June 2021).
  5. Davenport, J.; Kjørsvik, E. Buoyancy in the lumpsucker Cyclopterus lumpus. J. Mar. Biol. Assoc. UK 1986, 66, 159–174. [Google Scholar] [CrossRef]
  6. Phleger, C.F. Buoyancy in marine fishes: Direct and indirect role of lipids. Am. Zool. 1998, 38, 321–330. [Google Scholar] [CrossRef]
  7. Sargent, J.R.; Tocher, D.R.; Bell, J.G. The lipids. In Fish Nutrition, 3rd ed.; Halver, J.E., Hardy, R.W., Eds.; Elsevier Academic Press: San Diego, CA, USA, 2003; pp. 181–257. [Google Scholar]
  8. Eliasen, K.; Patursson, E.J.; McAdam, B.J.; Pino, E.; Morro, B.; Betancor, M.; Baily, J.; Rey, S. Liver colour scoring index, carotenoids and lipid content assessment as a proxy for lumpfish (Cyclopterus lumpus L.) health and welfare condition. Sci. Rep. 2020, 10, 8927. [Google Scholar] [CrossRef]
  9. Gutierrez Rabadan, C.; Spreadbury, C.; Consuegra, S.; Garcia de Leaniz, C. Development, validation and testing of an Operational Welfare Score Index for farmed lumpfish Cyclopterus lumpus L. Aquaculture 2021, 531, 735777. [Google Scholar] [CrossRef]
  10. Madaro, A.; Olsen, R.E.; Kristiansen, T.S.; Ebbesson, L.O.; Nilsen, T.O.; Flik, G.; Gorissen, M. Stress in Atlantic salmon: Response to unpredictable chronic stress. J. Exp. Biol. 2015, 218, 2538–2550. [Google Scholar] [CrossRef] [PubMed] [Green Version]
  11. Niclasen, B.A.; Simonsen, K. High Resolution Wave Climate of the Faroe Islands; University of the Faroe Islands: Tórshavn, Faroe Islands, 2012. [Google Scholar]
  12. Millero, F.J.; Poisson, A. International one-atmosphere equation of state of seawater. Deep Sea Res. Part A Oceanog. Res. Pap. 1981, 28, 625–629. [Google Scholar] [CrossRef]
  13. Willora, F.P.; Grønevik, B.; Liu, C.; Palihawadana, A.; Sørensen, M.; Hagen, Ø. Total replacement of marine oil by rapeseed oil in plant protein rich diets of juvenile lumpfish (Cyclopterus lumpus): Effects on growth performance, chemical and fatty acid composition. Aquac. Rep. 2021, 19, 100560. [Google Scholar] [CrossRef]
  14. Zar, J.H. Biostatistical Analysis, 2nd ed.; Prentice-Hall, Inc.: Englewood Cliffs, NJ, USA, 1984; 718p. [Google Scholar]
  15. Skoge, R.H.; Brattespe, J.; Økland, A.L.; Plarre, H.; Nylund, A. New virus of the family Flaviviridae detected in lumpfish (Cyclopterus lumpus). Arc. Virol. 2018, 163, 679–685. [Google Scholar] [CrossRef] [PubMed]
  16. Arrington, D.A.; Winemiller, K.O.; Loftus, W.F.; Akin, S. How Often Do Fishes “Run on Empty”? Ecology 2002, 83, 2145–2151. [Google Scholar]
  17. Eliasen, K.; Danielsen, E.; Johannesen, Á.; Joensen, L.L.; Patursson, E.J. The cleaning efficacy of lumpfish (Cyclopterus lumpus L.) in Faroese salmon (Salmo salar L.) farming pens in relation to lumpfish size and seasonality. Aquaculture 2018, 488, 61–65. [Google Scholar] [CrossRef]
  18. Fernández, D.A.; Ceballos, S.G.; Malanga, G.; Boy, C.C.; Vanella, F.A. Buoyancy of sub-Antarctic notothenioids including the sister lineage of all other notothenioids (Bovichtidae). Polar Biol. 2012, 35, 99–106. [Google Scholar] [CrossRef]
  19. Eastman, J.T. The evolution of neutrally buoyant notothenioid fishes: Their specializations and potential interactions in the Antarctic marine food web. In Antarctic Nutrient Cycles and Food Webs; Siegfried, W.R., Condy, P.R., Laws, R.M., Eds.; Springer: Berlin/Heidelberg, Germany, 1985; pp. 430–436. [Google Scholar]
Figure 1. Average densities of lumpfish at each location of the study. Different letters indicate significant difference between sampling locations (Tukey’s post hoc test, p < 0.05). Whiskers indicate ±SD.
Fishes 07 00284 g001
Figure 2. Average Fulton’s K values of lumpfish from five different locations in the Faroe Islands. NS indicates no statistical difference between sampling locations (Tukey’s post hoc test, p > 0.05). Whiskers indicate ±SD.
Fishes 07 00284 g002
Figure 3. A scatterplot with a fit line of body density by Fulton’s K (n = 123). Location D was excluded from the analysis (see text for explanation).
Fishes 07 00284 g003
Figure 4. Body density compared to the liver colour of the lumpfish. Different letters indicate significant differences (Tukey’s post-hoc test, p < 0.05) between liver colours. Whiskers indicate minimum and maximum values, while boxes indicate Q1, median, and Q3 quartiles. The × indicates the average body density. Location D is excluded from this boxplot.
Fishes 07 00284 g004
Figure 5. The average HSI values for each location (n = 123). Different letters indicate significant difference between sampling locations (Tukey’s post hoc test, p < 0.05). Whiskers indicate ±SD.
Fishes 07 00284 g005
Figure 6. A scatterplot with a fit line between lumpfish body density by HSI (n = 123). Location D is excluded from this figure. Location D was excluded from the analysis (see text for explanation).
Fishes 07 00284 g006
Figure 7. A scatterplot with a fit line between lumpfish body density and length (n = 123). Location D was excluded from the analysis.
Fishes 07 00284 g007
Figure 8. A scatterplot between lumpfish body density and weight (n = 123). Location D was excluded from the analysis.
Fishes 07 00284 g008
Table 1. Table containing information about the different localities where lumpfish were sampled.
LocationABCDE
Start of sampling16 September 20208 September 202014 September 202015 October 202019 October 2020
End of sampling28 October 202004 November 202012 October 202015 October 202019 October 2020
Hm0_50 m1–2 m1–2 m2–4 m6 m1–2 m
Average current 10 m 6 cm/s6 cm/s5 cm/s50 cm/s (Measured)110 cm/s (Measured)
Ring Circumference and dept120 × 25 m120 × 25 m128 × 15 m160 × 12 m160 × 9 m
Salmon stock (#) at first sampling 138.87567.01654.87577.41658.722
Average salmon weight (g)8912.406 5050 6.200 6.100
Salmon FeedAthena 600Athena 1200Biomar 2.2 mmSkretting express 2500 50ASkretting express 2500 50A
Lumpfish stock (#) at first sampling22.9687.48413.31310.2745.843
Lumpfish feedUnknownUnknown9 mm margæti3 mm margæti3 mm margæti
Average lumpfish weight (g) at first measurement146 32 85 143 157
The significant wave height data (Hm0) is from [11], and the data about the current was retrieved from the companies that had the aquaculture sites. Hm0_50 is the statistically estimated largest 1 h Hm0 value during the last 50 years.
Table 2. The four different groups compared to the different welfare parameters that were used. The values are averages from the measured fish.
ParametersAll Fish
(D Excluded)
Lowest 30 Density FishHighest 30 Density FishLocation D
(n = 15)
Density ± SD1.030 ± 0.0021.027 ± 0.0011.033 ± 0.0011.029 ± 0.002
Fin1.521.701.561.73
Skin1.321.501.202.07
Stomach2.282.272.172.53
Publisher’s Note: MDPI stays neutral with regard to jurisdictional claims in published maps and institutional affiliations.

