Article

Wax-Printed Fluidic Time Delays for Automating Multi-Step Assays in Paper-Based Microfluidic Devices (MicroPADs)

1
Department of Biological Sciences, California Polytechnic State University, San Luis Obispo, CA 93407, USA
2
Department of Chemistry and Biochemistry, California Polytechnic State University, San Luis Obispo, CA 93407, USA
*
Author to whom correspondence should be addressed.
Submission received: 20 February 2019 / Revised: 10 March 2019 / Accepted: 13 March 2019 / Published: 19 March 2019
(This article belongs to the Special Issue Microfluidics and Nanofluidics)

Abstract

:
Microfluidic paper-based analytical devices (microPADs) have emerged as a promising platform for point-of-care diagnostic devices. While the inherent wicking properties of microPADs allow for fluid flow without supporting equipment, this also presents a major challenge in achieving robust fluid control, which becomes especially important when performing complex multi-step assays. Herein, we describe an ideal method of fluid control mediated by wax-printed fluidic time delays. This method relies on a simple fabrication technique, does not utilize chemicals/reagents that could affect downstream assays, is readily scalable, and has a wide temporal range of tunable fluid control. The delays are wax printed on both the top and bottom of pre-fabricated microPAD channels, without subsequent heating, to create hemi-/fully-enclosed channels. With these wax printed delays, we were able to tune the time it took aqueous solutions to wick across a 25 mm-long channel between 3.6 min and 13.4 min. We then employed these fluid delays in the sequential delivery of four dyes to a test zone. Additionally, we demonstrated the automation of two simple enzymatic assays with this fluid control modality. This method of fluid control may allow future researchers to automate more complex assays, thereby further advancing microPADs toward real-world applications.

Graphical Abstract

1. Introduction

Accurate and timely diagnosis is a vital first step toward the treatment of a disease. As of 2013, at least 400 million people worldwide are classified as low income and without access to essential health services, including diagnostic technologies [1]. The development of cost-effective point-of-care (POC) diagnostic tests is therefore critically important, especially in these low resource settings. As outlined by the World Health Organization (WHO), the ideal POC diagnostic test should meet the ASSURED criteria: affordable, sensitive, specific, user-friendly, rapid and robust, equipment-free, and deliverable to end users [2]. In this article, we describe a new technique for tuning wicking rates in microfluidic paper-based analytical devices (microPADs). The ability to control wicking rates in paper-based channels can be harnessed for the automation of multi-step assays, which may ultimately enable the development of improved POC diagnostic devices.
Since their inception in 2007, microPADs have emerged as a promising platform for POC diagnostics because they were designed to meet the ASSURED criteria [3,4,5,6,7]. Paper is an ideal platform for diagnostic assays because it is affordable, widely available, and hydrophilic in nature, thereby allowing fluids to flow through its porous structure via capillary action. In microPADs, fluid flow is controlled by patterning the paper with hydrophobic materials to create hydrophilic channels and reservoirs bounded by hydrophobic barriers [3]. A simple method of patterning paper is wax printing, which typically involves printing wax on the surface of paper using a solid ink printer, followed by a brief heating step to melt the wax into the paper [8,9,10].
While the inherent wicking properties of microPADs allow for fluid flow without supporting equipment (i.e., no external pumps), this also presents a major challenge in achieving robust fluid control [6]. Fluid control becomes especially important when performing complex multi-step assays, sometimes requiring extended incubation periods [6,11]. While many complex laboratory-based diagnostic tests are automated, this level of automation and complexity has been difficult to achieve in microPADs [6]. Examples of multi-step assays performed on microPADs range from simple enzymatic assays [12,13,14], to more complex paper-based enzyme-linked immunosorbent assays (ELISAs) for diagnostic applications [15,16,17,18,19]. Two examples of multi-step enzymatic assays that we explored in this work include a horseradish peroxidase (HRP) assay [13,20,21,22], and an enzyme inhibition assay for toxic heavy metal ions [23,24]. The HRP assay requires a multi-step process in which a chromogenic reagent is first incubated with HRP, followed by a sulfuric acid quench. While the HRP assay alone can be used to study enzyme stability [21], it is more commonly used in coupled reactions [14], or as a reporter enzyme in microPADs [13,22]. The enzyme inhibition assay can be used to determine the concentration of toxic heavy metal ions, such as silver (I) and mercury (II), in water samples with limits of detection as low as 0.001 ppm [23]. In these assays, samples containing the metals are incubated with the reporter enzyme β-galactosidase (β-gal), followed by the addition of the enzyme substrate, chlorophenol red-β-d-galactopyranoside (CPRG), to measure the activity of the enzyme following inhibition by the metal [23]. With improved methods of fluid control, we may be able to better automate multi-step assays, such as the HRP and enzyme inhibition assay, on paper.
The need for increased fluid control in microPADs has led to the development of active and passive fluid control systems [6]. Active fluid control systems typically rely on valves and allow for the direct control of fluids based upon an external input. While active fluid control has many potential advantages, there are relatively few reported methods of active control, and the available methods are often complex to operate, require significant external equipment, are not compatible with high volume fabrication, or are otherwise too impractical to be used in POC devices [6,25,26]. For example, a common form of active valve involves mechanical switches, whereby some form of paper folding, sliding, or removal is used to facilitate fluid transport [27,28,29,30]. While these are simple to operate, they rely on the end-user accurately controlling the timescale of the assay, and scalability of these devices would likely be difficult.
In their most common form, passive fluid control systems in microPADs are used to control fluid flow rate within a channel. Passive fluid control systems do not require external inputs, are typically easier to fabricate than active control systems, and often do not require any additional equipment when operating the device, which makes them better-suited for POC applications. In their simplest form, changing channel geometry (i.e., width and length) leads to changes in fluid flow [29,31,32,33,34,35]. However, these techniques have a limited range of fluid control [6,31,34]. While there are many additional methods of passive fluid control in microPADs (e.g., fluidic diodes, delay shunts, altering pore size, ionogel passive pumps, laser direct writing, sucrose delays, chemical modifications, dissolvable/erodible bridges) [6,11,36,37,38,39,40,41,42,43,44,45,46], all of these have significant limitations, such as the extensive use of additional fabrication materials or equipment beyond what is required for wax printing (e.g., laser cutters, plastic sheets, or adhesives) [39,40,44,45], use of reagents that could impact downstream assays (e.g., sugars, polymers, or surfactants) [11,38,42,43,46], or the use of techniques not compatible with high-volume fabrication [36,37,41].
Ultimately, the ideal method of fluid control would utilize a simple fabrication technique, have a wide temporal range of tunable fluid control, be readily scalable, not use additional chemicals that could affect downstream processes, and could be used to automate complex multi-step assays. The purpose of our investigation was to develop a passive fluid control system in microPADs that fits all these criteria via the creation of wax-printed fluidic time delays. First, we explored the effect of these delays on fluid flow rate. Second, we used the delays to automate the sequential delivery of multi-colored dyes to a test zone. And finally, we applied this technology to automate two simple enzymatic assays on paper.

2. Materials and Methods

2.1. Fabrication of MicroPADs with Wax-Printed Fluidic Delays

MicroPADs were designed on the computer (Affinity Designer v1.6.5, Nottingham, England, UK) and printed on Whatman no. 1 chromatography paper (GE Healthcare Life Sciences, Marlborough, MA, USA) using a solid ink printer (Xerox Phaser 8560, Norwalk, CT, USA) [8]. The paper was then baked at 195 °C for two minutes (compact forced air convection oven, MTI Corporation, Richmond, CA, USA), thereby allowing the wax to transverse the width of the paper and create hydrophilic channels and reservoirs bounded by hydrophobic wax barriers.
To fabricate wax-printed fluidic time delays, another layer of wax was deposited on the top and/or bottom of each channel by performing additional cycles of wax printing using the same solid ink printer (Figure 1a,b). This layer of wax was not baked and therefore did not permeate through the channel (Figure 1a). The amount of wax deposited was defined in terms of percentage channel coverage, with 200% being assigned to the fully-enclosed channel (Figure 1a,b). Wax-printed fluidic delays were first deposited on the back side of the microPAD (0–100% coverage) prior to printing on the top side of the channel (125–200% coverage) (Figure 1b). Example design files for microPADs with wax-printed fluidic time delays are included with the supplementary materials.
A 0.6 mm-wide wax line was printed on the threshold of the top side of the channel for the 0–100% wax channels to act as a choke valve and shunt the fluid into the paper prior to wicking along the channel (Figure 1b). The choke valve prevented fluid from wicking across the surface of the paper, which negated the effects of the wax-printed fluidic time delays. The wax-printed choke valve was not considered when calculating the reported percentage of wax channel coverage. The microPADs were suspended in the air by taping them to an open frame, which prevented fluid from wicking onto the surface below.

2.2. Effect of Wax-Printed Fluidic Time Delays on Fluid Flow Rate and Wicking Distance

Standard fluidic channels (3 mm × 30 mm) were fabricated. Wax-printed fluidic time delays ranging from 0–200% (25% increments) were tested (Figure 1b). The wicking times of 30 µL of a 1.25-mM solution of Allura Red (Sigma-Aldrich, 458848, St. Louis, MO, USA) to select distances along the channel (5–25 mm in 5 mm increments) were measured (n = 3).
The effect of wax-printed delays on wicking distance was also measured. Ten microliters of a 1.25-mM solution of Allura Red was added to channels with 0–200% wax coverage (Figure 1b) and allowed to wick until dry (n = 3). The final distance wicked by the solution was recorded. Time-lapse photos were taken for the duration of each test.

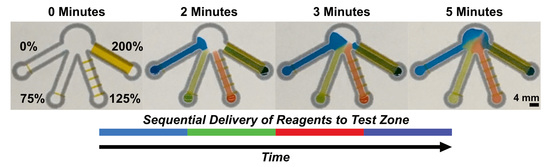
2.3. Sequential Delivery of Dyes to a Test Zone Mediated by Wax-Printed Fluidic Time Delays

A microPAD with four channels (15 mm × 4 mm) was fabricated with varying percentages of wax channel coverage (0%, 75%, 125%, and 200%) to enable the sequential addition of multi-colored dyes to a test zone (Figure 2a). Eight microliters each of four different aqueous dyes were pipetted simultaneously into each of the loading inlets (1.25-mM Allura red, 1.25-mM Erioglaucine blue (Sigma-Aldrich, 861146), green (mixture of blue and 1.25-mM Tartrazine yellow, Fisher Scientific, AAA1768214, Waltham, MA, USA), and purple (mixture of red and blue dyes)) (Figure 2b). Time-lapse photos were taken throughout the duration of the experiment.
To display the customizability of our wax-printed fluidic time delays, a microPAD with three channels (7.5 mm × 4 mm) was also fabricated with 0% wax coverage on two channels, and 200% coverage on the third. Eight microliters each of three different dyes were pipetted simultaneously into the loading inlets (1.25-mM Allura red, 1.25-mM Erioglaucine blue, and green (mixture of blue and yellow)) (Figure 2d). Design files for the microPADs displayed in Figure 2 are included with the supplementary materials.
To display the effect of smaller gaps between percentages of wax coverage across the channels, a second microPAD with four channels (15 mm × 4 mm) was fabricated with 25%, 50%, 75%, and 100% wax channel coverage and was tested with the same four aqueous dyes (Figure A2).

2.4. Automated Multi-Step Enzymatic Assays

Automated multi-step enzymatic assays (HRP and enzyme inhibition assay) were performed to demonstrate the efficacy of wax-printed fluidic time delays for assay automation. MicroPADs were designed with two channels (7.5 mm × 4 mm) leading to a central test zone (Figure 3a). The left channel had 200% wax coverage, and the right channel had 0% wax coverage. Two concentrations (146 and 14.6 U/mL) of horseradish peroxidase (HRP) (Alfa Aesar, AAJ60026MC) were prepared in 1X phosphate-buffered saline (PBS). An aliquot (1.25 µL) of each HRP solution was spotted onto the middle test zone of each device and allowed to dry for 10 min. Next, 8 μL of a one-step 3,3′,5,5′-tetramethylbenzidine (TMB) substrate solution (ThermoFisher, PI34024, Waltham, MA, USA) (a colorimetric substrate for HRP) was simultaneously added to the 0% wax-covered channel along with 8 μL of 1.8-M sulfuric acid (quencher) to the 200% wax-covered channel (Figure 3b,c). The TMB one-step solution is converted from colorless to blue by the enzymatic activity of HRP; the assay is then quenched upon the addition of H2SO4, which also changes the color from blue to yellow.
For the enzyme inhibition assay, a protocol was adapted from Hossain and Brennan [23]. A 1-ppm silver (I) ion (AgNO3, Macron Chemicals, 2169-03, Avantor Inc., Radnor, PA, USA) solution was prepared in water. An aliquot (1 µL) of the Ag(I) solution was spotted onto the middle test zone of a device and allowed to dry for 10 min (Figure 3d). Next, a 200-U/mL solution of β-galactosidase (β-gal) (MP Biomedicals, 104939, Santa Ana, CA, USA) was prepared in a 50-mM phosphate buffer (pH 7.3) containing 0.1-mM Mn2+ and 10-mg/mL bovine serum albumin (BSA, Fisher BioReagents BP9705100, Waltham, MA, USA). The β-gal (8 µL) was added to the 0% covered channel, while 9-mM chlorophenol red-β-d-galactopyranoside (8 µL, CPRG) (Sigma-Aldrich, 220588) (a colorimetric substrate for β-gal) solution prepared in 50-mM phosphate buffer (pH 7.3) was simultaneously added to the 200% wax-covered channel. As a negative control, this protocol was repeated with nanopure water used instead of 1 ppm silver (I) ion. Time-lapse images were taken throughout the duration of both assays. Design files for the microPAD displayed in Figure 3 are included with the supplementary materials.

3.5. Statistical Analyses

Statistical analyses were performed in JMP (v12.1, SAS Institute, Cary, NC, USA). A one-way analysis of variance (ANOVA) was performed to determine if there was any significant difference in wicking distance across the varying percentages of wax channel coverage (Figure A1). Tukey’s honest significant difference (HSD) post-hoc analysis was performed to determine which wicking distances were significantly different from one another.

3. Results

3.1. MicroPAD Channels with Wax-Printed Fluidic Time Delays

Fluidic time delays were introduced on microPADs by printing an additional layer of wax above and/or below the paper channel (Figure 1a,b). These wax features were not heated so as to prevent the wax from permeating into the paper channel (Figure 1a). Various percentages of wax coverage (0–200%) on the channels were explored, where 0% is defined as an open paper channel, 100% is a fully wax-backed channel (hemi-channel) and 200% is a fully-enclosed channel (Figure 1a,b). Intermediate wax percent coverages were achieved by printing interspaced wax segments (Figure 1b). These wax-printed fluidic time delays resulted in a measurable reduction of wicking speed, as a function of increasing percentage wax coverage (Figure 1c, Table A1). Using a short 5 mm channel, there were minimal differences in wicking times between 0% and 200% covered channels: 7.3 ± 1.2 s and 13.3 ± 0.9 s, respectively (Figure 1c, Table A1). However, with a longer 25 mm channel, there were significant differences in wicking times: 216.3 ± 9.7 s (3.6 min, 0% wax) and 806.0 ± 70.0 s (13.4 min, 200% wax). Across all wicking distances, wicking time decreased with increasing wax coverage (Figure 1c, Table A1).
Additionally, all the wax-printed fluidic time delays (25–200%) reduced wicking distance (~26.7 mm avg. (n = 3), 10 µL dye applied) in microPAD channels (3 mm wide) as compared to a standard open channel (33.5 mm, 0% wax) (p < 0.05). However, there were negligible wicking distance differences between the higher percentage wax channel coverages (~25.7 mm wicking distance for 75%-200% wax (n = 3), p > 0.25) (Figure A1).

3.2. Sequential Delivery of Dyes to the Test Zone Mediated by Wax-Printed Fluidic Time Delays

Wax-printed fluidic time-delays were incorporated on three and four-channel microPAD designs and monitored for the sequential delivery of colored dyes (Figure 2). Time-lapse images of a microPAD with four channels (15 mm × 4 mm) indicated that a lower percentage of wax coverage resulted in faster fluid arrival at the test zone (Figure 2a,b), with appreciable differential fluid delivery to the test zone (Figure 2b–d). Of note, the time-controlled sequential arrival of each of the four colored dyes to the center of the test zone (white circles) was achieved (Figure 2c). Finally, larger differences in percentage wax coverage between channels on a microPAD allowed for larger gaps between arrival times, and more significant differences in fluid coverage in the test zone (Figure 2b–d vs. Figure A2).
Time lapse images of a microPAD with 3 channels (7.5 mm × 4 mm) are shown in Figure 2e. This microPAD allowed for the simultaneous delivery of two dyes (green & red, 0% wax channels), followed by the delayed arrival of a third dye (blue, 200 % wax channel) to the test zone, displaying the high degree of customizability associated with this fluid control technique. See the supplemental video for a time-lapse of devices depicted in Figure 2.

3.3. Automated Multi-Step Enzymatic Assays via Wax-Printed Fluidic Time Delays

Automated multi-step enzymatic assays (HRP and enzyme inhibition assay [23]) were performed on microPADs with two channels to demonstrate the efficacy of wax-printed fluidic time delays for assay automation (Figure 3). As an initial validation of a two channel (0% & 200%) device design, a 12 s delay of arrival to the test zone was demonstrated using blue and red dye applied simultaneously (Figure 3a). Of note, the earlier arrival of the red dye in the test zone creates a fluidic-barrier that further delays the advance of the blue dye across the test zone (Figure 3a, 50 s image), thus enabling longer reactions times between incoming reagents (represented by the red dye) and any reagent(s) that may have been pre-dried/deposited in the test zone [47]. HRP was deposited in the middle test zone of the microPAD, followed by the simultaneous addition of TMB (colorimetric substrate for HRP) to the right channel (0% wax) and H2SO4 (quencher) to the left channel (200% wax). Successful automation of the multi-step assay was confirmed through the initial color change to blue in the test zone upon TMB arrival and reaction with HRP (120 s), followed by delayed quenching of the enzymatic reaction by H2SO4 (300 s), resulting in the observable color change to yellow (840 s) (Figure 3b). Higher HRP concentrations (Figure 3b) produced more colored product as compared to lower concentrations (Figure 3c). Observed wicking times through channels were similar to expected values (Figure 3).
As a demonstration of an enzyme inhibition assay, Ag(I) ion (heavy metal, enzyme inhibitor being tested) was deposited in the middle test zone of the microPAD, followed by the simultaneous addition of β-galactosidase to the right channel (0% wax), and CPRG (colorimetric substrate for β-gal) to the left channel (200% wax) (Figure 3d). The lack of purple color in the test zone, as compared to the control without Ag(I) ion, displays successful automation of the assay. See the supplemental video for a time-lapse of the assays depicted in Figure 3.

4. Discussion

The inherent capillary action of paper has led to the emergence of microPADs as platforms for POC assays, however, achieving robust fluid control has been a significant challenge on these devices since their inception [6]. This is a particularly important challenge when it comes to the automation of multi-step assays on microPADs [6,11,29]. While there are many published methods of fluid control in this category of diagnostic devices, each comes with their set of limitations which ultimately prevent their utilization in real-world settings and include: the extensive use of additional fabrication materials or equipment (beyond what is used to fabricate the initial device), use of reagents and materials that could impact downstream assays, or the use of techniques not compatible with high-volume fabrication [6]. In this study, we achieved robust, passive fluid control in microPADs through the deposition of varying amounts of wax overlays on the device, resulting in regulated and predicted time-delays of fluid, which allowed for the implementation of automated multi-step assays. This method of fluid control was designed to fit the following idealized criteria for passive fluid control systems in microPADs: (1) has a simple fabrication process; (2) can be readily scaled; (3) requires no additional chemicals that could affect downstream processes; (4) has a wide temporal range of tunable fluid control; and (5) can be used to automate complex multi-step assays.
MicroPADs and the corresponding wax time delays were readily fabricated through multiple cycles of wax printing, which is both a simple and scalable fabrication modality [8]. This process required no additional chemicals or reagents for fabrication (Figure 1a,b), which means that samples wicking across channels containing wax time delays will not be contaminated with any additional substances that could affect downstream reactions. It is important to note that after fabricating the wax barriers in the paper, subsequent printing cycles required careful alignment to ensure the wax time delays were printed in the correct position on the page and were aligned with the wax barriers. However, once the alignment was optimized for a particular device, we found that we could consistently fabricate multiple copies of that device.
Wax-printed time delays allowed for a wide temporal range of tunable fluid control (Figure 1c, Table A1). The results of the characterization of the time delays can be used to determine the channel length and percent wax coverage necessary to achieve a desired time delay for a reagent in a device. We applied the results from the characterization experiments toward the design of the devices shown in Figure 2 and Figure 3, and these devices performed as expected and matched the predicted wicking times with relative accuracy (Figure 2d,f and Figure 3). This was in spite of the fact that the characterization experiments were performed with a different fluid volume (30 µL) and different channel dimensions (3 mm wide) compared to the devices in Figure 2 and Figure 3. These results suggest that other researchers could use the characterization results to reasonably predict the necessary channel length and percent wax coverage for their specific applications. We did find that the presence of these wax-printed time delays did cause a reduction in total wicking distance (Figure A1). However, the difference was minimal, and could be overridden by using slightly larger fluid volumes for longer channels (i.e., >30 mm). Furthermore, we did not examine multiple patterning schemes to achieve the same total wax coverages (e.g., 4 vs. 5 segments totaling 50% wax coverage) (Figure 1b), so we cannot comment on the potential effects of changes in wax patterning.
The wax-printed time delays were able to mediate the sequential delivery of dyes to a test zone (Figure 2), shown by the passing of all four colored dyes through a central location of the test zone (white circle in Figure 2c). While this device will probably not be useful for performing an actual assay, it does serve to illustrate the potential for using wax time delays to deliver fluids to a test zone in a timed, sequential manner. Currently, we envision two distinct methods for using these time delays in assay automation: 1) make the time delay equal to the intended incubation period, or 2) use the time delay to allow for disproportional fluid coverage in the test zone (a.k.a., paper-based micromixer [47]). For example, in the first method, if you needed a 10-min incubation period of two reagents prior to adding a third reagent, you would want to add the third reagent to a 25 mm-long channel with 125% wax coverage (time delay = 9.5 ± 0.8 min) (Table A1). With this method, channel geometry would have to be precisely calculated to ensure the proper sequential delivery of reagents in the desired assay. Alternatively, in the second method, you could incorporate a shorter time delay (e.g., the 12 s delay in Figure 3), which would thereby allow for differential fluid coverage in the test zone (Figure 3a). If the first reagent that reaches the test zone occupies that space (e.g., red dye, Figure 3a), then the second reagent cannot occupy the space as well (e.g., blue dye, Figure 3a). In this scenario, a slight excess volume of each fluid can be used, but the volumes would also need to be optimized as these would influence the time for the assay to complete. This second method of timed reagent application was demonstrated through the automation of a simple HRP assay (Figure 3b,c), as well as an enzyme inhibition assay for environmental heavy metal monitoring (Figure 3d). The major drawback of this method is that reagents can mix prematurely, however, we did not want to alter channel geometry (i.e., length) in order to isolate the effects of the wax-printed time delays, and therefore chose this second method of assay automation. Ultimately, these wax-printed fluidic time delays may allow researchers to better automate more complex, multi-step assays on microPADs, such as paper-based ELISAs.
One previously published method of fluid control that meets many of the idealized criteria for a passive fluid control modality in microPADs was demonstrated by the Yager group [29,31,34]. They were able to successfully automate multi-step assays through the alteration of channel geometry (i.e., channel length & width), thereby allowing for the timed addition of reagents to a test zone. While changing microPAD channel geometry meets nearly all the criteria of an ideal passive fluid control modality, it has a clearly limited temporal range of tunable fluid control. For example, if you wanted to control fluid flow through a 20 mm channel by changing channel width, you would only have a range of about 100–200 s [31,34]. In contrast, with the wax-printed fluidic time delays, you can tunably control fluid flow through the same 20 mm channel in a range of 118 to 402 s, dependent on percentage wax coverage (Table A1, Figure 1c). This temporal range of tunability then increases to up to 806 s (~13.4 min) in a 25 mm channel (Table A1). A similar temporal range can be matched by altering channel length, but this would require significantly longer channels and larger fluid volumes [29,34]. Finally, it is important to note that the alteration of channel geometry could easily be combined with our wax-printed fluidic time delays to further increase the temporal range of fluid control.
The most similar methods of fluid control to the method presented in this work are those published by Noh & Phillips [48,49], Jang & Song [47], and Weng et al. [50]. These groups all investigated the deposition of various concentrations of wax, followed by heating, as a fluid control mechanism. They all observed decreased flow rates with decreased permeability (i.e., more wax). This relationship is predicted by Darcy’s Law [47], which describes fluid flow through a porous medium, as follows:
Q = k w h μ d p d x Darcy s   Law .
where Q is the flow rate, k is permeability, w is the channel width, h is the channel height, μ is the viscosity of the fluid, and dp/dx is the pressure gradient in the flow direction. In these scenarios, the authors hypothesized that paper permeability (k) would decrease with increased wax deposition, thereby decreasing flow rate (Q) [47,48,49,50]. While it is difficult to compare the temporal range of fluid control in the works published by Noh & Phillips and Jang & Song as they used significantly different device designs (e.g., 3D channels) [48,49], or did not track time [47], the range of control presented by Weng et al. appears to be similar [50]. For example, they reported fluid control in a range of approximately 30 to 120 s in a 7 mm × 9 mm channel. Whereas we report fluid control in a range of 31 to 67 s through the first 10 mm of our channel (3 mm wide), and between 87 to 335 s through the next 10 mm of channel (Table A1). However, it must be noted that these are extremely rough comparisons given that channel dimensions (w & h), paper permeability (k), and pressure gradient (dp/dx), were all different in our device designs as compared to those published by Weng et al. (Equation (1)). Finally, while altering paper permeability via wax printing could meet our idealized criteria of a passive fluid control system, the devices designed by these groups were not suited for high volume fabrication as they either used tape to hold paper layers together [48,49], utilized multiple overlapping paper types [47], or required paper devices to be assembled by inserting channels into precut holes in adjacent paper features [50]. As a final comparison, none of these reported devices were applied toward the automation of multi-step assays. Once again, it is worth noting that this method of fluid control could also be used in conjunction with the method presented in this work.
While previous groups have manipulated flow rates in microPADs by changing paper permeability (k) [47] or channel width (w) [34], we hypothesize that we were able to change flow rate through the alteration of channel height (h). Even though our wax-printed fluidic time delays were not heated (Figure 1a,b), deposited wax from wax printing is known to slightly permeate the surface of the paper [8]. Therefore, by decreasing channel height (h) throughout the channels, we will also decrease flow rate (Equation (1)).
Finally, we are not the first group to create hemi and fully-enclosed channels in microPADs (Figure 1a) [51,52,53,54]. Enclosing paper-based microfluidic channels has been previously shown to reduce contamination, contain and protect stored reagents, increase ease of operation, and reduce evaporation [51]. Of particular importance, utilizing a hemi-channel (at minimum) (Figure 1a) allows for significantly increased ease of operation by allowing microPADs to be handled more facilely, as well as allowing them to be run in direct contact with adjacent surfaces. In standard microPADs, channels are exposed to the environment, which means they must often be run in suspension so that fluids cannot wick onto the surface below. Any channel with greater than 100% wax coverage would not need to be run in suspension.

5. Conclusions

Robust fluid control remains a significant problem in microPADs. While there have been numerous studies published examining various fluid control mechanisms, none currently meet the criteria of an ideal passive fluid control modality: simple fabrication technique, no use of additional chemicals that may affect downstream reactions, readily scalable, wide temporal range of tunable fluid control, and can be used to automate multi-step assays. Herein we present a simple method of passive fluid control mediated by wax-printed fluidic time delays, with which we have demonstrated the automation of multi-step enzymatic assays. This new fluid control modality meets all the aforementioned criteria, while also maintaining all the benefits of hemi/fully-enclosed channels, such as reduced contamination and increased ease of operation. Furthermore, this method could be easily combined with many of the other fluid control mechanisms previously published as it only involves wax printing, which is already utilized in standard microPAD fabrication.

Supplementary Materials

The following are available online at https://0-www-mdpi-com.brum.beds.ac.uk/2411-5134/4/1/20/s1, Video S1: Time Lapse Videos of Sequential Dye Delivery and Automated Multi-Step Enzymatic Assays. MicroPAD design files for Figure 2 & Figure 3 are also included.

Author Contributions

Conceptualization, E.B.S., N.W.M. and A.W.M.; Data curation, E.B.S., C.K., J.T.W., A.R.J., N.W.M. and A.W.M.; Formal analysis, E.B.S., C.K., J.T.W., A.R.J. and M.L.M.; Funding acquisition, N.W.M. and A.W.M.; Investigation, E.B.S., C.K., J.T.W., A.R.J. and M.L.M.; Methodology, E.B.S., C.K., J.T.W., A.R.J., M.L.M., N.W.M. and A.W.M.; Project administration, N.W.M. and A.W.M.; Resources, N.W.M. and A.W.M.; Supervision, N.W.M. and A.W.M.; Validation, E.B.S., C.K., J.T.W., A.R.J., M.L.M., N.W.M. and A.W.M.; Writing—original draft, E.B.S., C.K., J.T.W., A.R.J., M.L.M., N.W.M. and A.W.M.; Writing—review & editing, E.B.S., N.W.M. and A.W.M.

Funding

This material is based upon work supported by the National Science Foundation Graduate Research Fellowship under Grant No. 1546590 (E. Brandon Strong, Fellow ID No. 2018256709), and by the National Science Foundation under Grant No. 1605499.

Conflicts of Interest

The authors declare no conflict of interest.

Appendix A

Figure A1. Graph of wicking distance (10 µL dye) as a function of % wax channel coverage. There was a significant difference in wicking distance across the different channels (F = 19.75, df = 8, p < 0.0001). However, there was no significant difference between channels ranging from 75–200% wax coverage (p > 0.25). Letters above bars represent significant differences.
Inventions 04 00020 g0a1
Table A1. Raw data for graph in Figure 1C (n = 3). Wicking time increases with both % wax coverage and channel length. Standard error also tends to increase for longer time points. Channels were 3 mm wide. SE = standard error of the mean.
Time Required for Wicking to Varied Distances (Seconds ± SE [Minutes Conversion])
% Wax5 mm10 mm15 mm20 mm25 mm
07.3 ± 1.2 [0.12]31.0 ± 1.7 [0.52]69.3 ± 2.7 [1.16]118.0 ± 10.7 [1.97]216.3 ± 9.7 [3.61]
257.7 ± 0.3 [0.13]37.3 ± 1.9 [0.62]84.7 ± 0.3 [1.41]156.7 ± 4.1 [2.61]270.0 ± 8.5 [4.50]
509.3 ± 0.3 [0.16]40.7 ± 0.3 [0.68]93.0 ± 2.1 [1.55]183.3 ± 6.6 [3.06]304.0 ± 9.2 [5.07]
7510.0 ± 0.6 [0.17]41.7± 1.8 [0.69]102.7 ± 7.8 [1.71]206.3 ± 17.3 [3.44]337.0 ± 27.3 [5.62]
10012.7 ± 0.7 [0.21]42.3 ± 1.5 [0.71]106.3 ± 4.1 [1.77]212.3 ± 9.6 [3.54]374.3 ± 10.9 [6.24]
12511.3 ± 0.9 [0.19]50.0 ± 5.5 [0.83]126.7 ± 12.7 [2.11]262.7 ± 27.3 [4.38]568.7 ± 50.2 [9.48]
15012.7 ± 0.7 [0.21]55.7 ± 4.2 [0.93]155.0 ± 11.3 [2.58]293.0 ± 17.0 [4.88]703.0 ± 79.3 [11.72]
17513.3 ± 2.3 [0.22]58.3 ± 6.4 [0.97]162.0 ± 15.3 [2.70]335.0 ± 38.2 [5.58]760.7 ± 72.7 [12.68]
20013.3 ± 0.9 [0.22]67.3 ± 6.7 [1.12]177.7 ± 17.1 [2.96]402.3 ± 69.7 [6.71]806.0 ± 70.0 [13.43]
Figure A2. Time lapse images of sequential dye delivery to the test zone in an additional 4-channel (15 × 4 mm) microPAD with differing percentages of wax coverage (25–100%) as compared to Figure 2a–c. Multi-colored dyes were added simultaneously to the loading inlet. The dyes reached the test zone at more similar times as compared to Figure 2a–c. Abbreviations: Obs. means observed, Exp. means expected, * means expected calculated based on the results from Figure 1c & Table A1. The dimensions of the channels and volumes of fluids used in the two experiments were different, however, these values allow for an approximate prediction of wicking time given the channel length and % wax coverage.
Inventions 04 00020 g0a2

References

  1. WHO—World Health Organization. World Health Statistics 2017: Monitoring Health for The SDGs; World Health Organization: Geneva, Switzerland, 2017. [Google Scholar]
  2. Kosack, C.S.; Page, A.-L.; Klatser, P.R. A guide to aid the selection of diagnostic tests. Bull. World Health Organ. 2017, 95, 639–645. [Google Scholar] [CrossRef] [PubMed]
  3. Martinez, A.W.; Phillips, S.T.; Butte, M.J.; Whitesides, G.M. Patterned paper as a platform for inexpensive, low-volume, portable bioassays. Angew. Chem. Int. Ed. 2007, 46, 1318–1320. [Google Scholar] [CrossRef]
  4. Martinez, A.W.; Phillips, S.T.; Carrilho, E.; Thomas, S.W.; Sindi, H.; Whitesides, G.M. Simple telemedicine for developing regions: Camera phones and paper-based microfluidic devices for real-time, off-site diagnosis. Anal. Chem. 2008, 80, 3699–3707. [Google Scholar] [CrossRef]
  5. Martinez, A.W.; Phillips, S.T.; Whitesides, G.M.; Carrilho, E. Diagnostics for the developing world: Microfluidic paper-based analytical devices. Anal. Chem. 2010, 82, 3–10. [Google Scholar] [CrossRef]
  6. Fu, E.; Downs, C. Progress in the development and integration of fluid flow control tools in paper microfluidics. Lab Chip 2017, 17, 614–628. [Google Scholar] [CrossRef]
  7. Hu, J.; Wang, S.; Wang, L.; Li, F.; Pingguan-Murphy, B.; Lu, T.J.; Xu, F. Advances in paper-based point-of-care diagnostics. Biosens. Bioelectron. 2014, 54, 585–597. [Google Scholar] [CrossRef]
  8. Carrilho, E.; Martinez, A.W.; Whitesides, G.M. Understanding wax printing: A simple micropatterning process for paper-based microfluidics. Anal. Chem. 2009, 81, 7091–7095. [Google Scholar] [CrossRef] [PubMed]
  9. Namwong, P.; Jarujamrus, P.; Amatatongchai, M.; Chairam, S. Fabricating Simple Wax Screen-Printing Paper-Based Analytical Devices To Demonstrate the Concept of Limiting Reagent in Acid–Base Reactions. J. Chem. Educ. 2018, 95, 305–309. [Google Scholar] [CrossRef]
  10. Younas, M.; Maryam, A.; Khan, M.; Nawaz, A.A.; Jaffery, S.H.I.; Anwar, M.N.; Ali, L. Parametric analysis of wax printing technique for fabricating microfluidic paper-based analytic devices (µPAD) for milk adulteration analysis. Microfluid. Nanofluid. 2019, 23, 38. [Google Scholar] [CrossRef]
  11. Lutz, B.; Liang, T.; Fu, E.; Ramachandran, S.; Kauffman, P.; Yager, P. Dissolvable fluidic time delays for programming multi-step assays in instrument-free paper diagnostics. Lab Chip 2013, 13, 2840–2847. [Google Scholar] [CrossRef] [Green Version]
  12. Cate, D.M.; Adkins, J.A.; Mettakoonpitak, J.; Henry, C.S. Recent Developments in Paper-Based Micro fluidic Devices. Anal. Chem. 2015, 87, 19–41. [Google Scholar] [CrossRef]
  13. Yetisen, A.K.; Akram, M.S.; Lowe, C.R. Paper-based microfluidic point-of-care diagnostic devices. Lab Chip 2013, 13, 2210–2251. [Google Scholar] [CrossRef]
  14. Mitchell, H.T.; Noxon, I.C.; Chaplan, C.A.; Carlton, S.J.; Liu, C.H.; Ganaja, K.A.; Martinez, N.W.; Immoos, C.E.; Costanzo, P.J.; Martinez, A.W. Reagent pencils: A new technique for solvent-free deposition of reagents onto paper-based microfluidic devices. Lab Chip 2015, 15, 2213–2220. [Google Scholar] [CrossRef]
  15. Shih, C.M.; Chang, C.L.; Hsu, M.Y.; Lin, J.Y.; Kuan, C.M.; Wang, H.K.; Te Huang, C.; Chung, M.C.; Huang, K.C.; Hsu, C.E.; et al. Paper-based ELISA to rapidly detect Escherichia coli. Talanta 2015, 145, 2–5. [Google Scholar] [CrossRef]
  16. Pang, B.; Zhao, C.; Li, L.; Song, X.; Xu, K.; Wang, J.; Liu, Y.; Fu, K.; Bao, H.; Song, D.; et al. Development of a low-cost paper-based ELISA method for rapid Escherichia coli O157:H7 detection. Anal. Biochem. 2018, 542, 58–62. [Google Scholar] [CrossRef]
  17. Hsu, C.K.; Huang, H.Y.; Chen, W.R.; Nishie, W.; Ujiie, H.; Natsuga, K.; Fan, S.T.; Wang, H.K.; Lee, J.Y.Y.; Tsai, W.L.; et al. Paper-based ELISA for the detection of autoimmune antibodies in body fluid-the case of bullous pemphigoid. Anal. Chem. 2014, 86, 4605–4610. [Google Scholar] [CrossRef]
  18. Cheng, C.M.; Martinez, A.W.; Gong, J.; Mace, C.R.; Phillips, S.T.; Carrilho, E.; Mirka, K.A.; Whitesides, G.M. Paper-based elisa. Angew. Chem. Int. Ed. 2010, 122, 4881–4884. [Google Scholar] [CrossRef]
  19. Ma, L.; Nilghaz, A.; Choi, J.R.; Liu, X.; Lu, X. Rapid detection of clenbuterol in milk using microfluidic paper-based ELISA. Food Chem. 2018, 246, 437–441. [Google Scholar] [CrossRef]
  20. Azevedo, A.M.; Martins, V.C.; Prazeres, D.M.F.; Vojinović, V.; Cabral, J.M.S.; Fonseca, L.P. Horseradish peroxidase: A valuable tool in biotechnology. Biotechnol. Annu. Rev. 2003, 9, 1387–2656. [Google Scholar]
  21. Ganaja, K.A.; Chaplan, C.A.; Zhang, J.; Martinez, N.W.; Martinez, A.W. Paper Microzone Plates as Analytical Tools for Studying Enzyme Stability: A Case Study on the Stabilization of Horseradish Peroxidase Using Trehalose and SU-8 Epoxy Novolac Resin. Anal. Chem. 2017, 89, 5333–5341. [Google Scholar] [CrossRef]
  22. Ramachandran, S.; Fu, E.; Lutz, B.; Yager, P. Long-term dry storage of an enzyme-based reagent system for ELISA in point-of-care devices. Analyst 2014, 139, 1456–1462. [Google Scholar] [CrossRef] [Green Version]
  23. Hossain, S.M.Z.; Brennan, J.D. β-Galactosidase-based colorimetric paper sensor for determination of heavy metals. Anal. Chem. 2011, 83, 8772–8778. [Google Scholar] [CrossRef]
  24. Baskaran, G.; Masdor, N.A.; Syed, M.A.; Shukor, M.Y. An inhibitive enzyme assay to detect mercury and zinc using protease from coriandrum sativum. Sci. World J. 2013, 2013, 678356. [Google Scholar] [CrossRef]
  25. Li, X.; Tian, J.; Nguyen, T.; Shen, W. Paper-based microfluidic devices by plasma treatment. Anal. Chem. 2008, 80, 9131–9134. [Google Scholar] [CrossRef]
  26. Phillips, E.A.; Shen, R.; Zhao, S.; Linnes, J.C. Thermally actuated wax valves for paper-fluidic diagnostics. Lab Chip 2016, 16, 4230–4236. [Google Scholar] [CrossRef]
  27. Li, X.; Tian, J.; Shen, W. Progress in patterned paper sizing for fabrication of paper-based microfluidic sensors. Cellulose 2010, 17, 649–659. [Google Scholar] [CrossRef]
  28. Martinez, A.W.; Phillips, S.T.; Nie, Z.; Cheng, C.M.; Carrilho, E.; Wiley, B.J.; Whitesides, G.M. Programmable diagnostic devices made from paper and tape. Lab Chip 2010, 10, 2499–2504. [Google Scholar] [CrossRef]
  29. Fu, E.; Liang, T.; Spicar-Mihalic, P.; Houghtaling, J.; Ramachandran, S.; Yager, P. Two-dimensional paper network format that enables simple multistep assays for use in low-resource settings in the context of malaria antigen detection. Anal. Chem. 2012, 84, 4574–4579. [Google Scholar] [CrossRef]
  30. Han, K.N.; Choi, J.S.; Kwon, J. Three-dimensional paper-based slip device for one-step point-of-care testing. Sci. Rep. 2016, 6, 25710. [Google Scholar] [CrossRef] [Green Version]
  31. Fu, E.; Ramsey, S.A.; Kauffman, P.; Lutz, B.; Yager, P. Transport in two-dimensional paper networks. Microfluid. Nanofluid. 2011, 10, 29–35. [Google Scholar] [CrossRef]
  32. Fu, E.; Kauffman, P.; Lutz, B.; Yager, P. Chemical signal amplification in two-dimensional paper networks. Sens. Actuators B Chem. 2010, 149, 325–328. [Google Scholar] [CrossRef] [Green Version]
  33. Toley, B.J.; Wang, J.A.; Gupta, M.; Buser, J.R.; Lafleur, L.K.; Lutz, B.R.; Fu, E.; Yager, P. A versatile valving toolkit for automating fluidic operations in paper microfluidic devices. Lab Chip 2015, 15, 1432–1444. [Google Scholar] [CrossRef] [Green Version]
  34. Fu, E.; Lutz, B.; Kauffman, P.; Yager, P. Controlled reagent transport in disposable 2D paper networks. Lab Chip 2010, 10, 918–920. [Google Scholar] [CrossRef]
  35. Preechakasedkit, P.; Siangproh, W.; Khongchareonporn, N.; Ngamrojanavanich, N.; Chailapakul, O. Development of an automated wax-printed paper-based lateral flow device for alpha-fetoprotein enzyme-linked immunosorbent assay. Biosens. Bioelectron. 2018, 102, 27–32. [Google Scholar] [CrossRef]
  36. Shin, J.H.; Park, J.; Kim, S.H.; Park, J.K. Programmed sample delivery on a pressurized paper. Biomicrofluidics 2014, 8, 054121. [Google Scholar] [CrossRef] [Green Version]
  37. Toley, B.J.; McKenzie, B.; Liang, T.; Buser, J.R.; Yager, P.; Fu, E. Tunable-delay shunts for paper microfluidic devices. Anal. Chem. 2013, 85, 11545–11552. [Google Scholar] [CrossRef]
  38. Strong, E.B.; Schultz, S.A.; Martinez, A.W.; Martinez, N.W. Fabrication of Miniaturized Paper-Based Microfluidic Devices (MicroPADs). Sci. Rep. 2019, 9, 7. [Google Scholar] [CrossRef]
  39. Akyazi, T.; Saez, J.; Elizalde, J.; Benito-Lopez, F. Fluidic flow delay by ionogel passive pumps in microfluidic paper-based analytical devices. Sens. Actuators B Chem. 2016, 233, 402–408. [Google Scholar] [CrossRef]
  40. He, P.J.W.; Katis, I.N.; Eason, R.W.; Sones, C.L. Engineering fluidic delays in paper-based devices using laser direct-writing. Lab Chip 2015, 15, 4054–4061. [Google Scholar] [CrossRef]
  41. Houghtaling, J.; Liang, T.; Thiessen, G.; Fu, E. Dissolvable bridges for manipulating fluid volumes in paper networks. Anal. Chem. 2013, 85, 11201–11204. [Google Scholar] [CrossRef] [Green Version]
  42. Chen, H.; Cogswell, J.; Anagnostopoulos, C.; Faghri, M. A fluidic diode, valves, and a sequential-loading circuit fabricated on layered paper. Lab Chip 2012, 12, 2909–2913. [Google Scholar] [CrossRef]
  43. Jahanshahi-Anbuhi, S.; Henry, A.; Leung, V.; Sicard, C.; Pennings, K.; Pelton, R.; Brennan, J.D.; Filipe, C.D.M. Paper-based microfluidics with an erodible polymeric bridge giving controlled release and timed flow shutoff. Lab Chip 2014, 14, 229–236. [Google Scholar] [CrossRef]
  44. Jahanshahi-Anbuhi, S.; Chavan, P.; Sicard, C.; Leung, V.; Hossain, S.M.Z.; Pelton, R.; Brennan, J.D.; Filipe, C.D.M. Creating fast flow channels in paper fluidic devices to control timing of sequential reactions. Lab Chip 2012, 12, 5079–5085. [Google Scholar] [CrossRef]
  45. Da Silva, E.T.S.G.; Santhiago, M.; De Souza, F.R.; Coltro, W.K.T.; Kubota, L.T. Triboelectric effect as a new strategy for sealing and controlling the flow in paper-based devices. Lab Chip 2015, 15, 1651–1655. [Google Scholar] [CrossRef]
  46. Songok, J.; Toivakka, M. Controlling capillary-driven surface flow on a paper-based microfluidic channel. Microfluid. Nanofluid. 2016, 20, 63. [Google Scholar] [CrossRef]
  47. Jang, I.; Song, S. Facile and precise flow control for a paper-based microfluidic device through varying paper permeability. Lab Chip 2015, 15, 3405–3412. [Google Scholar] [CrossRef]
  48. Noh, H.; Phillips, S.T. Metering the capillary-driven flow of fluids in paper-based microfluidic devices. Anal. Chem. 2010, 82, 4181–4187. [Google Scholar] [CrossRef]
  49. Noh, H.; Phillips, S.T. Fluidic timers for time-dependent, point-of-care assays on paper. Anal. Chem. 2010, 82, 8071–8078. [Google Scholar] [CrossRef]
  50. Weng, C.H.; Chen, M.Y.; Shen, C.H.; Yang, R.J. Colored wax-printed timers for two-dimensional and three-dimensional assays on paper-based devices. Biomicrofluidics 2014, 8, 066502. [Google Scholar] [CrossRef] [Green Version]
  51. Schilling, K.M.; Lepore, A.L.; Kurian, J.A.; Martinez, A.W. Fully enclosed microfluidic paper-based analytical devices. Anal. Chem. 2012, 84, 1579–1585. [Google Scholar] [CrossRef]
  52. Renault, C.; Koehne, J.; Ricco, A.J.; Crooks, R.M. Three-dimensional wax patterning of paper fluidic devices. Langmuir 2014, 30, 7030–7036. [Google Scholar] [CrossRef]
  53. Li, X.; Liu, X. Fabrication of three-dimensional microfluidic channels in a single layer of cellulose paper. Microfluid. Nanofluidics 2014, 16, 819–827. [Google Scholar] [CrossRef]
  54. Maejima, K.; Tomikawa, S.; Suzuki, K.; Citterio, D. Inkjet printing: An integrated and green chemical approach to microfluidic paper-based analytical devices. RSC Adv. 2013, 3, 9258–9263. [Google Scholar] [CrossRef]
Figure 1. Paper-based channels with wax-printed fluidic time delays. (a) Diagram of MicroPAD cross-section displaying regular channels (exposed to ambient environment), hemi-channels (wax on one side), and fully-enclosed channels (wax on both sides). (b) MicroPAD top view diagram (front & back sides). The black wax represents a standard microPAD channel, while the yellow wax represents fluidic time delays (measured as % coverage of the paper channel). As shown, a fully-enclosed channel was defined as 200% wax coverage. The wax choke valve (not accounted for in % wax channel coverage calculation) was used to direct the fluid into the paper channel and prevent wicking along the top surface of the paper, which can negate the time delay effects of the wax printed features. (c) Graph of wicking distance over time (channel width = 3 mm, n = 3). A greater percentage wax coverage of channels resulted in decreased wicking rates. For example, it took 806 s (~13.4 min) for fluid to wick 25 mm in a 200% covered channel, and 216 s (~3.6 min) in a standard channel. Error bars were omitted for clarity, please see Table A1 for exact values and standard error.
Inventions 04 00020 g001
Figure 2. Sequential delivery of dyes to the test zone mediated by wax-printed fluidic time delays. (a) Conceptual diagram (front & back) of automated sequential delivery of reagents to a test zone. Wax-printed fluidic time delays depicted in yellow. The wax choke valve is used to direct the fluid into the paper channel. Colored dyes (8 µL), added simultaneously to the fluid reservoirs, arrive at the central test zone in a timed sequence (see colored bar below diagram). (b) Time lapse images of sequential fluid delivery on a microPAD with 4 channels (15 mm × 4 mm) and 0–200% wax coverage (diagramed in part a). Fluid applied to channels with lower wax percentages arrived first at the test zone. (c) Time lapse images of the test zone from the microPAD depicted in parts a and b. The four dyes arrive at the center of the test zone in the predicted sequential order, as indicated by the color of dye in the white circle at each time point. (d) Table of observed versus expected values for wicking times through each of the channels depicted in parts ac. (e) Time lapse images of a microPAD with two channels with 0% wax coverage and one channel with 200% wax coverage (a total of three channels, each 7.5 mm × 4 mm) displaying the simultaneous arrival of two dyes (red & green) at the test zone from the 0% channels, followed by the later arrival of the third dye (blue) from the 200% channel. (f) Table of observed versus expected values for wicking times through each of the channels depicted in part e. Abbreviations: Obs. means observed, Exp. means expected, * means expected calculated based on the results from Figure 1c & Table A1. The dimensions of the channels and volumes of fluids used in the two experiments were different, however, these values allow for an approximate prediction of wicking time given the channel length and % wax coverage.
Inventions 04 00020 g002
Figure 3. Automated multi-step enzymatic assays via wax-printed fluidic time delays. (a) Time-lapse images of sequential dye delivery in a microPAD with 2 channels (7.5 mm × 4 mm) (left channel = 200% wax, right channel = 0% wax). Red dye (right) enters test zone first (15 s), followed by the blue dye (left) (27 s). (b) Time-lapse images of an automated HRP assay (1.25 µL of 146 U/mL HRP deposited in test zone), followed by an H2SO4 quench. The HRP/TMB reaction first produces a blue color, and the acid quench produces a yellow color. (c) Time lapse images of an automated HRP assay with a lower amount of HRP deposited (1.25 µL of 14.6 U/mL HRP). This reaction produced a reduced color intensity as compared to the higher HRP concentration. (d) Time-lapse images of an automated enzyme inhibition assay for Ag(I) ion [23]. β-galactosidase was added to the right channel (0% wax), CPRG (colorimetric substrate for β-gal) was placed in the left channel (200% wax), and 1 ppm Ag(I) ion was deposited in the center test zone. β-gal inhibition by the Ag(I) ion indicates successful automation of the assay. Lighter yellow color in the 900 s images as compared to the 780 s image is due to the drying of the CPRG solution. Abbreviations: HRP refers to horseradish peroxidase, TMB refers to the colorimetric substrate for HRP, RXN means reaction, β-gal = β-galactosidase, CPRG refers to the colorimetric substrate for β-gal, Ag(I) =is silver (I) ion (heavy metal), Obs. means observed, Exp. means expected, * means expected calculated based on the results from Figure 1c & Table A1. The dimensions of the channels and volumes of fluids used in the two experiments were different, however, these values allow for an approximate prediction of wicking time given the channel length and % wax coverage.
Inventions 04 00020 g003

