Secondary Voltage Control Application in a Smart Grid with 100% Renewables


1
Electrical Power and Machines Dept., Faculty of Engineering, Helwan University, Cairo 11792, Egypt
2
Electromechanics Engineering Dept., Faculty of Engineering, Heliopolis University, Cairo 11785, Egypt
*
Author to whom correspondence should be addressed.
Inventions 2020, 5(3), 37; https://0-doi-org.brum.beds.ac.uk/10.3390/inventions5030037
Submission received: 16 June 2020
/
Revised: 28 July 2020
/
Accepted: 30 July 2020
/
Published: 1 August 2020
(This article belongs to the Special Issue Emerging Technologies for the Energy Systems of the Future)
Abstract
:This paper presents secondary voltage control by extracting reactive power from renewable power technologies to control load buses voltage in a power system at different operating conditions. The study is performed on a 100% renewable 14-bus system. Active and reactive powers controls are considered based on grid codes of countries with high penetration levels of renewable energy technologies. A pilot bus is selected in order to implement the secondary voltage control. The selection is based on short-circuit calculation and sensitivity analysis. An optimal Proportional Integral Derivative (PID) voltage controller is designed using genetic algorithm. A comparison between system with and without secondary voltage control is presented in terms of voltage profile and total power losses. The optimal voltage magnitudes at busbars are calculated to achieve minimum power losses using optimal power flow. The optimal placement of Phasor Measurement Units (PMUs) is performed in order to measure the voltage magnitude of buses with minimum cost. Optimization and simulation processes are performed using DIgSILENT and MATLAB software applications.
1. Introduction
One of the main visions of the future power systems is high penetration level of renewable energy technologies [1,2]. Renewable energy power plants, such as wind and solar farms, are fundamentally different from conventional power plants in terms of components and structure. In conventional power systems, synchronous generators are the main sources of reactive power to support voltage and maintain stability. In the renewable generation system, the voltage is controlled through power electronic converter [3,4,5].
If the grid faces voltage instability, following a disturbance, the voltage declines within few minutes dramatically and monotonically. When this decrease is too pronounced, the system integrity is endangered. This degradation process may eventually lead to a blackout in the form of a voltage collapse [6]. The control of voltage in electrical power networks has three hierarchical levels: Primary Voltage Control (PriVC), Secondary Voltage Control (SecVC), and Tertiary Voltage Control (TerVC) [7]. PriVC regulates the voltage of the generator bus by controlling the reactive power injection or absorption through automatic voltage regulators for the synchronous generators [8]. PriVC is performed in fraction of seconds to ten seconds. SecVC is directed to regulate load buses voltage magnitude. SecVC requires partitioning the grid into regions and select the pilot bus of each region. The pilot bus is normally the most sensitive load bus to the reactive power changes. A control system is applied to the pilot bus of the region by using a controller to track the optimal value of the pilot bus voltage. The optimal value is calculated from TerVC. Normally, through control action the generators in the region will be asked to inject/absorb reactive power by adding a signal to the PriVC. SecVC implementation time is ranging from 50 s to 25 min. to avoid overlap with the PriVC action. TerVC is normally an optimal power flow process occur every half an hour or longer time interval. The optimal power flow process is typically performed to achieve an objective or multi objectives, such as minimum power losses or/and minimum generating cost. Pilot bus reference voltage is calculated from TerVC [9].
Countries worldwide are spotting remarkable efforts towards the smart grid in the recent years. The smart grid is a power system with high quality, security, stability, efficiency, and green environment. To achieve these objectives wide area measurement systems, real time control, real time protection, and self-healing would be considered in the future grids. The wide area measurement system is achieved by using Phasor Measurement Units (PMUs) based on global positioning system. PMUs facilitate real time voltage control and self-healing [10,11]. An application of coordinated SecVC to a power system with conventional power plants was presented in [12].
There are a lot of methods proposed in previous work in order to apply primary voltage control to transmission and distribution grids with high share of renewable energies. In [13], the paper illustrates how the voltage control is applied through optimal placement of unified power flow controllers. In [14], the research improved the voltage performance of the grid through optimal placement and the sizing of renewable energies.
In [15], the paper illustrates a technique to apply distributed secondary voltage control among inverter-based generation systems. The secondary control is applied based on droop control. The applied method in [15]; leads to steady-state error in the pilot bus voltage due to absence of integral action in the regional controller. In addition, technical requirements of grid codes for integrating renewable energies have not been considered. In [16], the authors target secondary voltage applications of a 100% inverter-based microgrid showing the effect of communication delays. In [15] and [16], inverter based secondary voltage control is distributed and controlling buses, which include distributed generation.
The main contributions of this paper are:
- Coordinated Secondary voltage control is applied to control a load bus (not include a distributed generation) in a grid feeding from 100% renewable energies through extracting reactive power from inverter-based renewable energy power plants. In this research, a number of Proportional Integral Derivative (PID) controllers are designed in order to deal with various operating conditions using the genetic algorithm toolbox in MATLAB to enable the pilot bus to reach its optimal value at each condition.
- The grid codes of integrating renewable energies for countries with high share of renewable energies mainly photovoltaics (PV) and wind are considered while applying secondary voltage control and primary frequency control.
- PMUs are used to measure the real time voltage of the pilot bus and detect through what-if-analysis the optimal parameters of the secondary voltage genetic PID controller while using the neural network.
The paper is organized, as follows: Section 2 describes the configuration of the studied 100% renewable power system. Section 3 discusses grid code for renewables integration. Section 4 presents the secondary voltage control and pilot bus selection. Section 5 illustrates how the PMUs are optimally allocated. Section 6 briefly describes how the PID controller is optimally designed. Section 7 illustrates how tertiary voltage control is performed. In Section 8, the application of the coordinated SecVC to the 100% renewable power system is presented. Section 9 presents the simulation results and Section 10 summarizes the main conclusions.
2. 100% Renewable Grid
Some countries achieved 100% renewables in grid operation, such as Iceland, while Norway achieved 98% penetration level of renewables in 2019, Kenya achieved 70 % and aims to reach 100% by the end of 2020 while Brazil and Canada achieved more than 70% and 60%, respectively. Countries, like Denmark, Ireland and Germany, are operating their grids with more than 20% penetration level of renewables [17,18]. Now, it is a trend in the United States to reach 100% renewables through building new wind farms, PV parks, and distributed generation [19,20]. Globally, the current penetration level of renewables is 19.3% growing faster than the demand, which is an indicator to global 100% renewable energy within decades, which is also a goal of the European Commission [18].
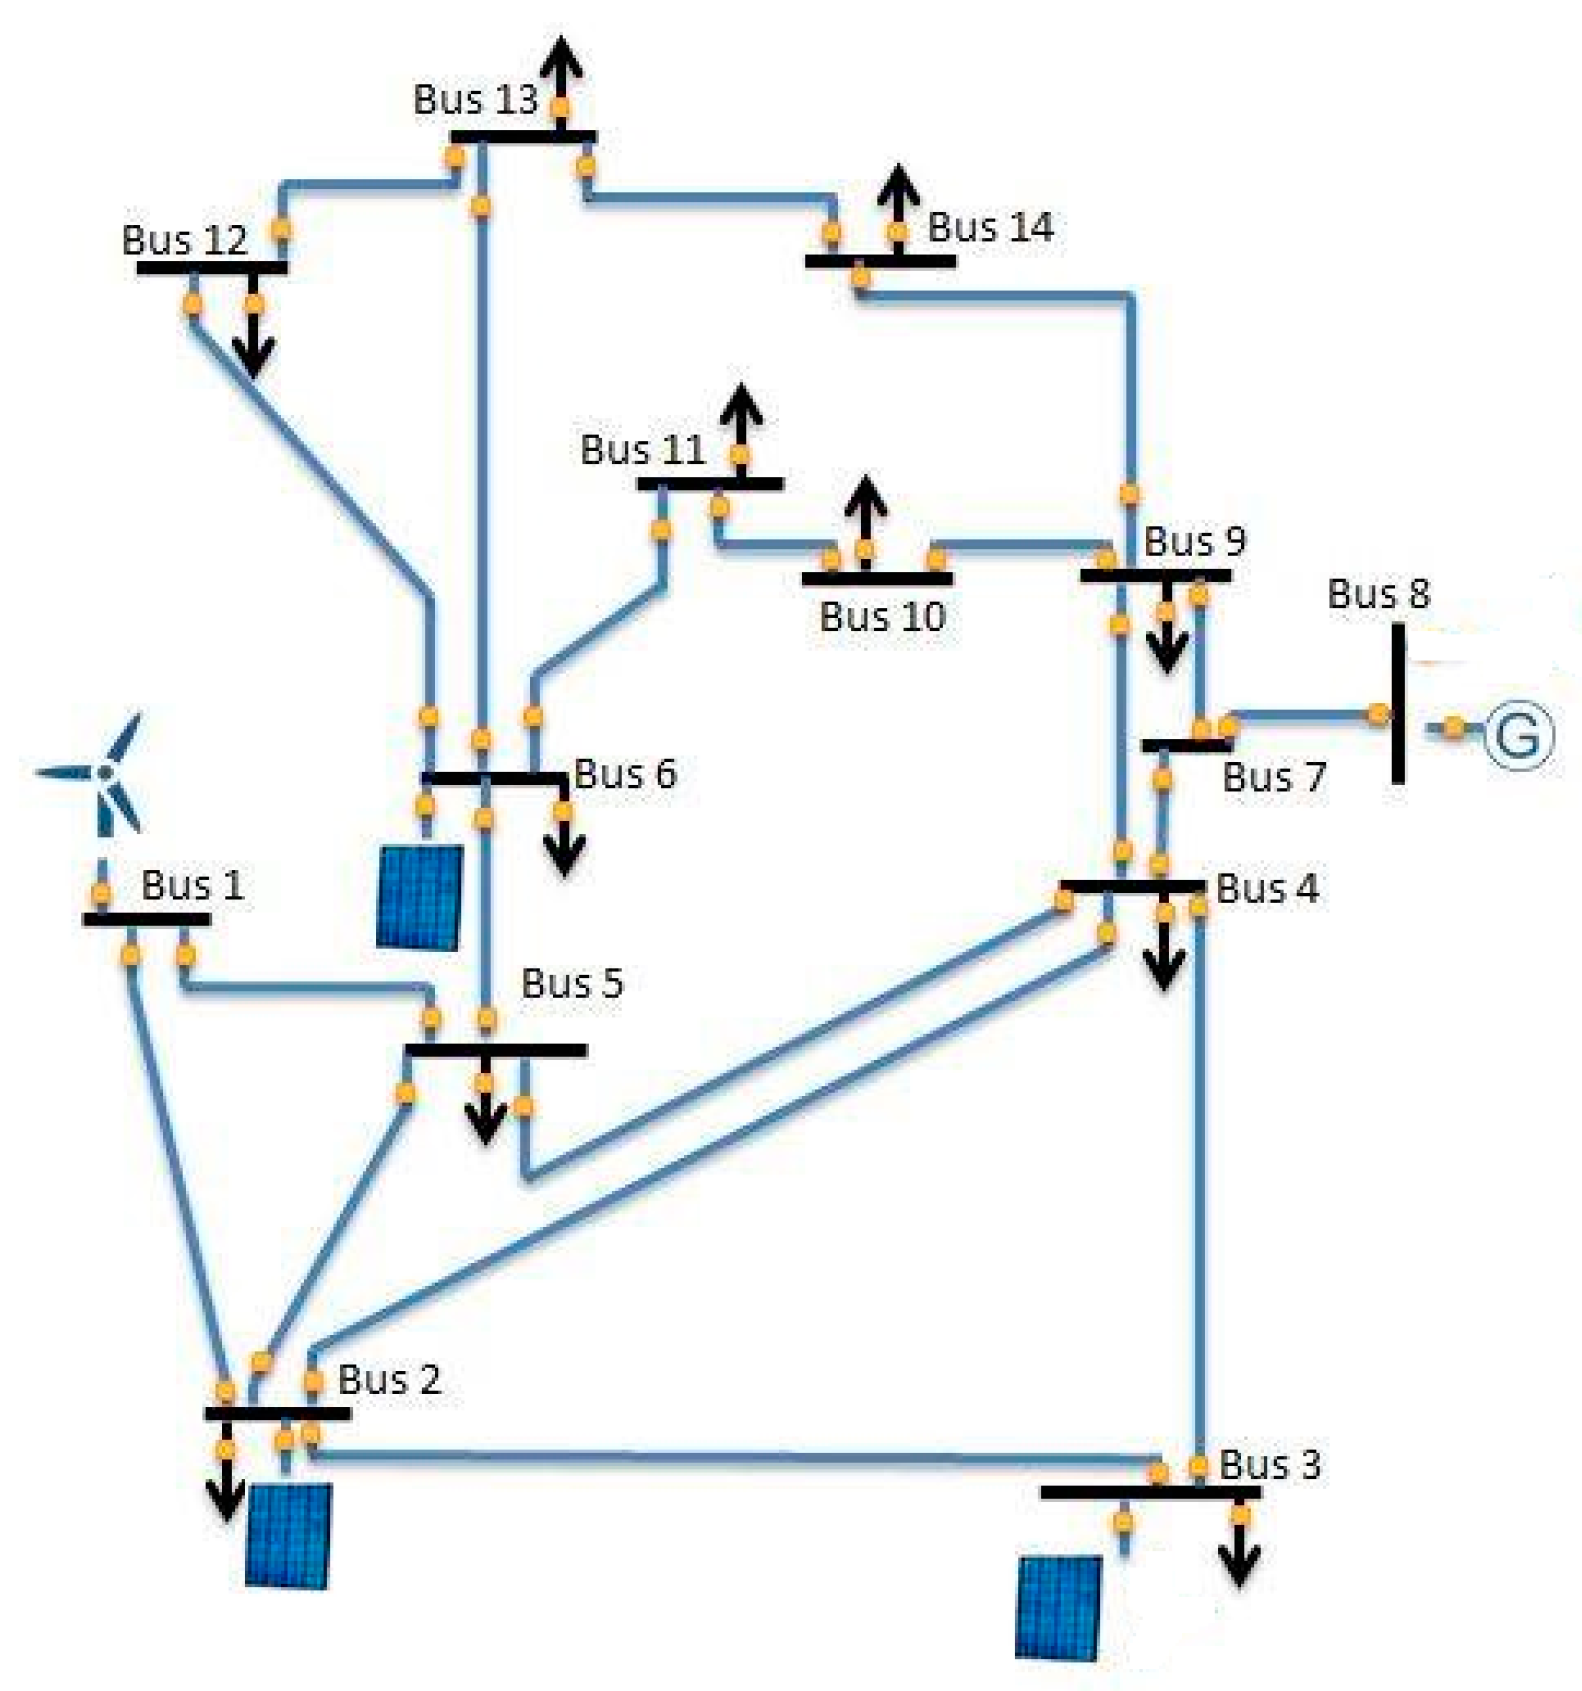
In this paper, selecting a 100% renewable power system was an objective to ensure the validity of controlling the pilot bus load voltage control from only renewable generators. The power system chosen shown in Figure 1 is the IEEE 14-Bus system after modifying the generation to be 100% renewable, as listed in Table 1. The modifications are made to enable the control of the pilot bus from inverter-based generation systems. In the proposed 14 bus system, unlike countries with high participation of renewable energies, it is assumed that the penetration level of inverter-based power plants is higher than that of the hydro. The assumption is performed based on the global trend towards increasing the installed capacity of photovoltaics and wind generation. Appendix A illustrates the lines and load data.
3. Renewable Energy Grid Integration
3.1. Wind Farm
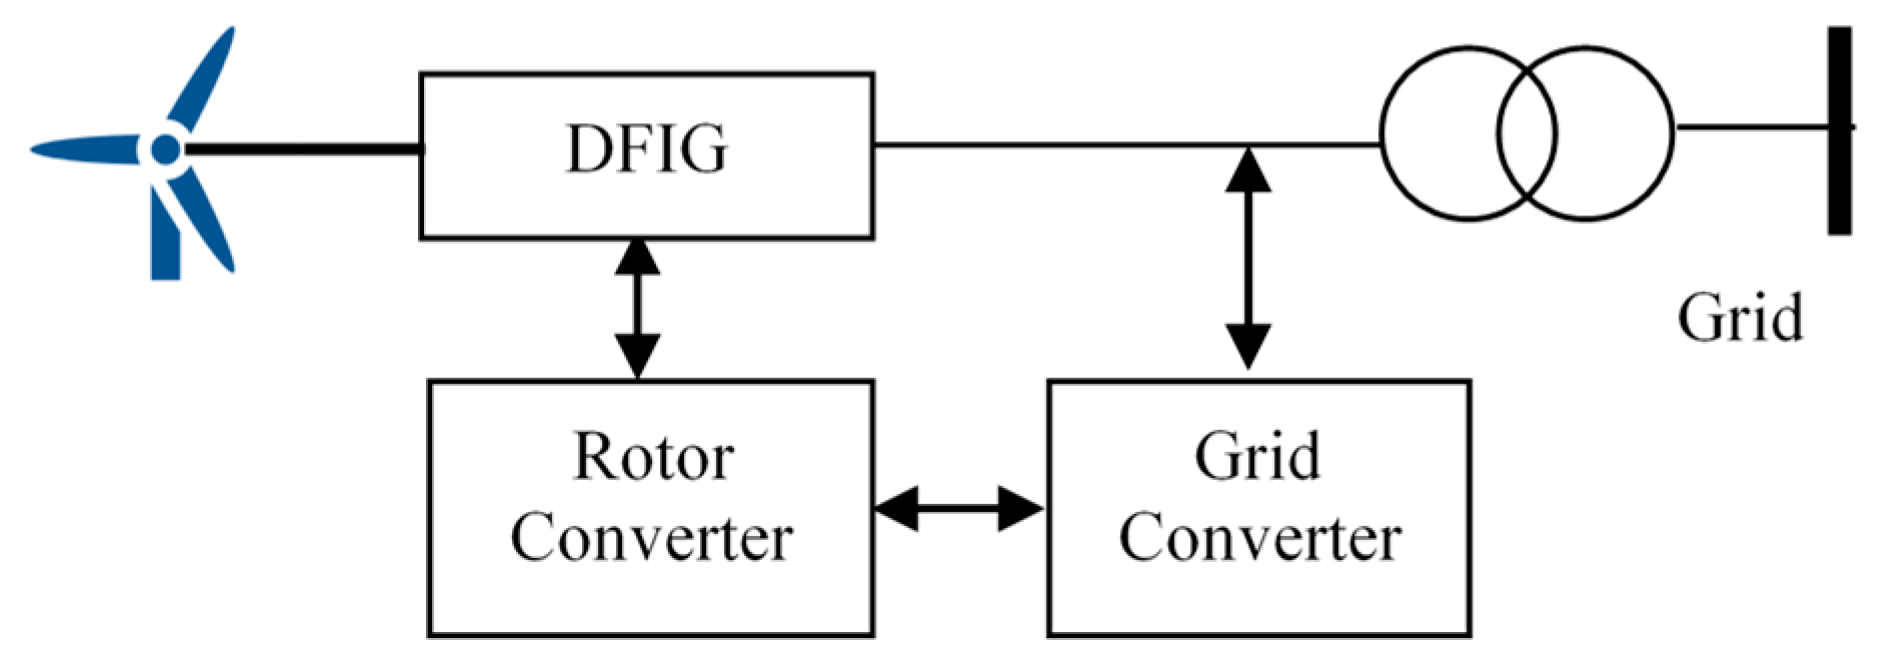
There are four main types of wind turbines generators (WTGs). Type 1 and 2 WTGs are based on induction generators, and they cannot provide reactive power, so no chance to offer voltage control to the power system. Type 3 (with a doubly fed induction generator) and Type 4 (with a synchronous generator) WTGs both integrated to the grid through power electronic converters and DC link capacitor. For both types, the converters and the DC link offer the ability to provide reactive power and, hence, apply voltage regulation. In this paper the Type 3, which is shown in Figure 2, was selected to simulate the wind generators in the 100% renewable grid.
The Nordic grid code for integrating wind farms to the grid was taken in this study as a reference to establish the 100% 14 bus renewable grid based on the frequency active power control and voltage reactive power control, as explained in the following [21]:
3.1.1. Frequency and Active Power
Wind farms ≥ 10 MVA shall be able for instantaneous contribution of active reserve both for up- and down-regulation. Wind farms ≥ 10 MVA shall have the availability to send frequency-controlled reserve power, activated via frequency controllers implemented in each wind turbine. It shall be possible to set the droop from 1 to 12 % for wind farms ≥ 1 MVA [21].
3.1.2. Voltage and Reactive Power
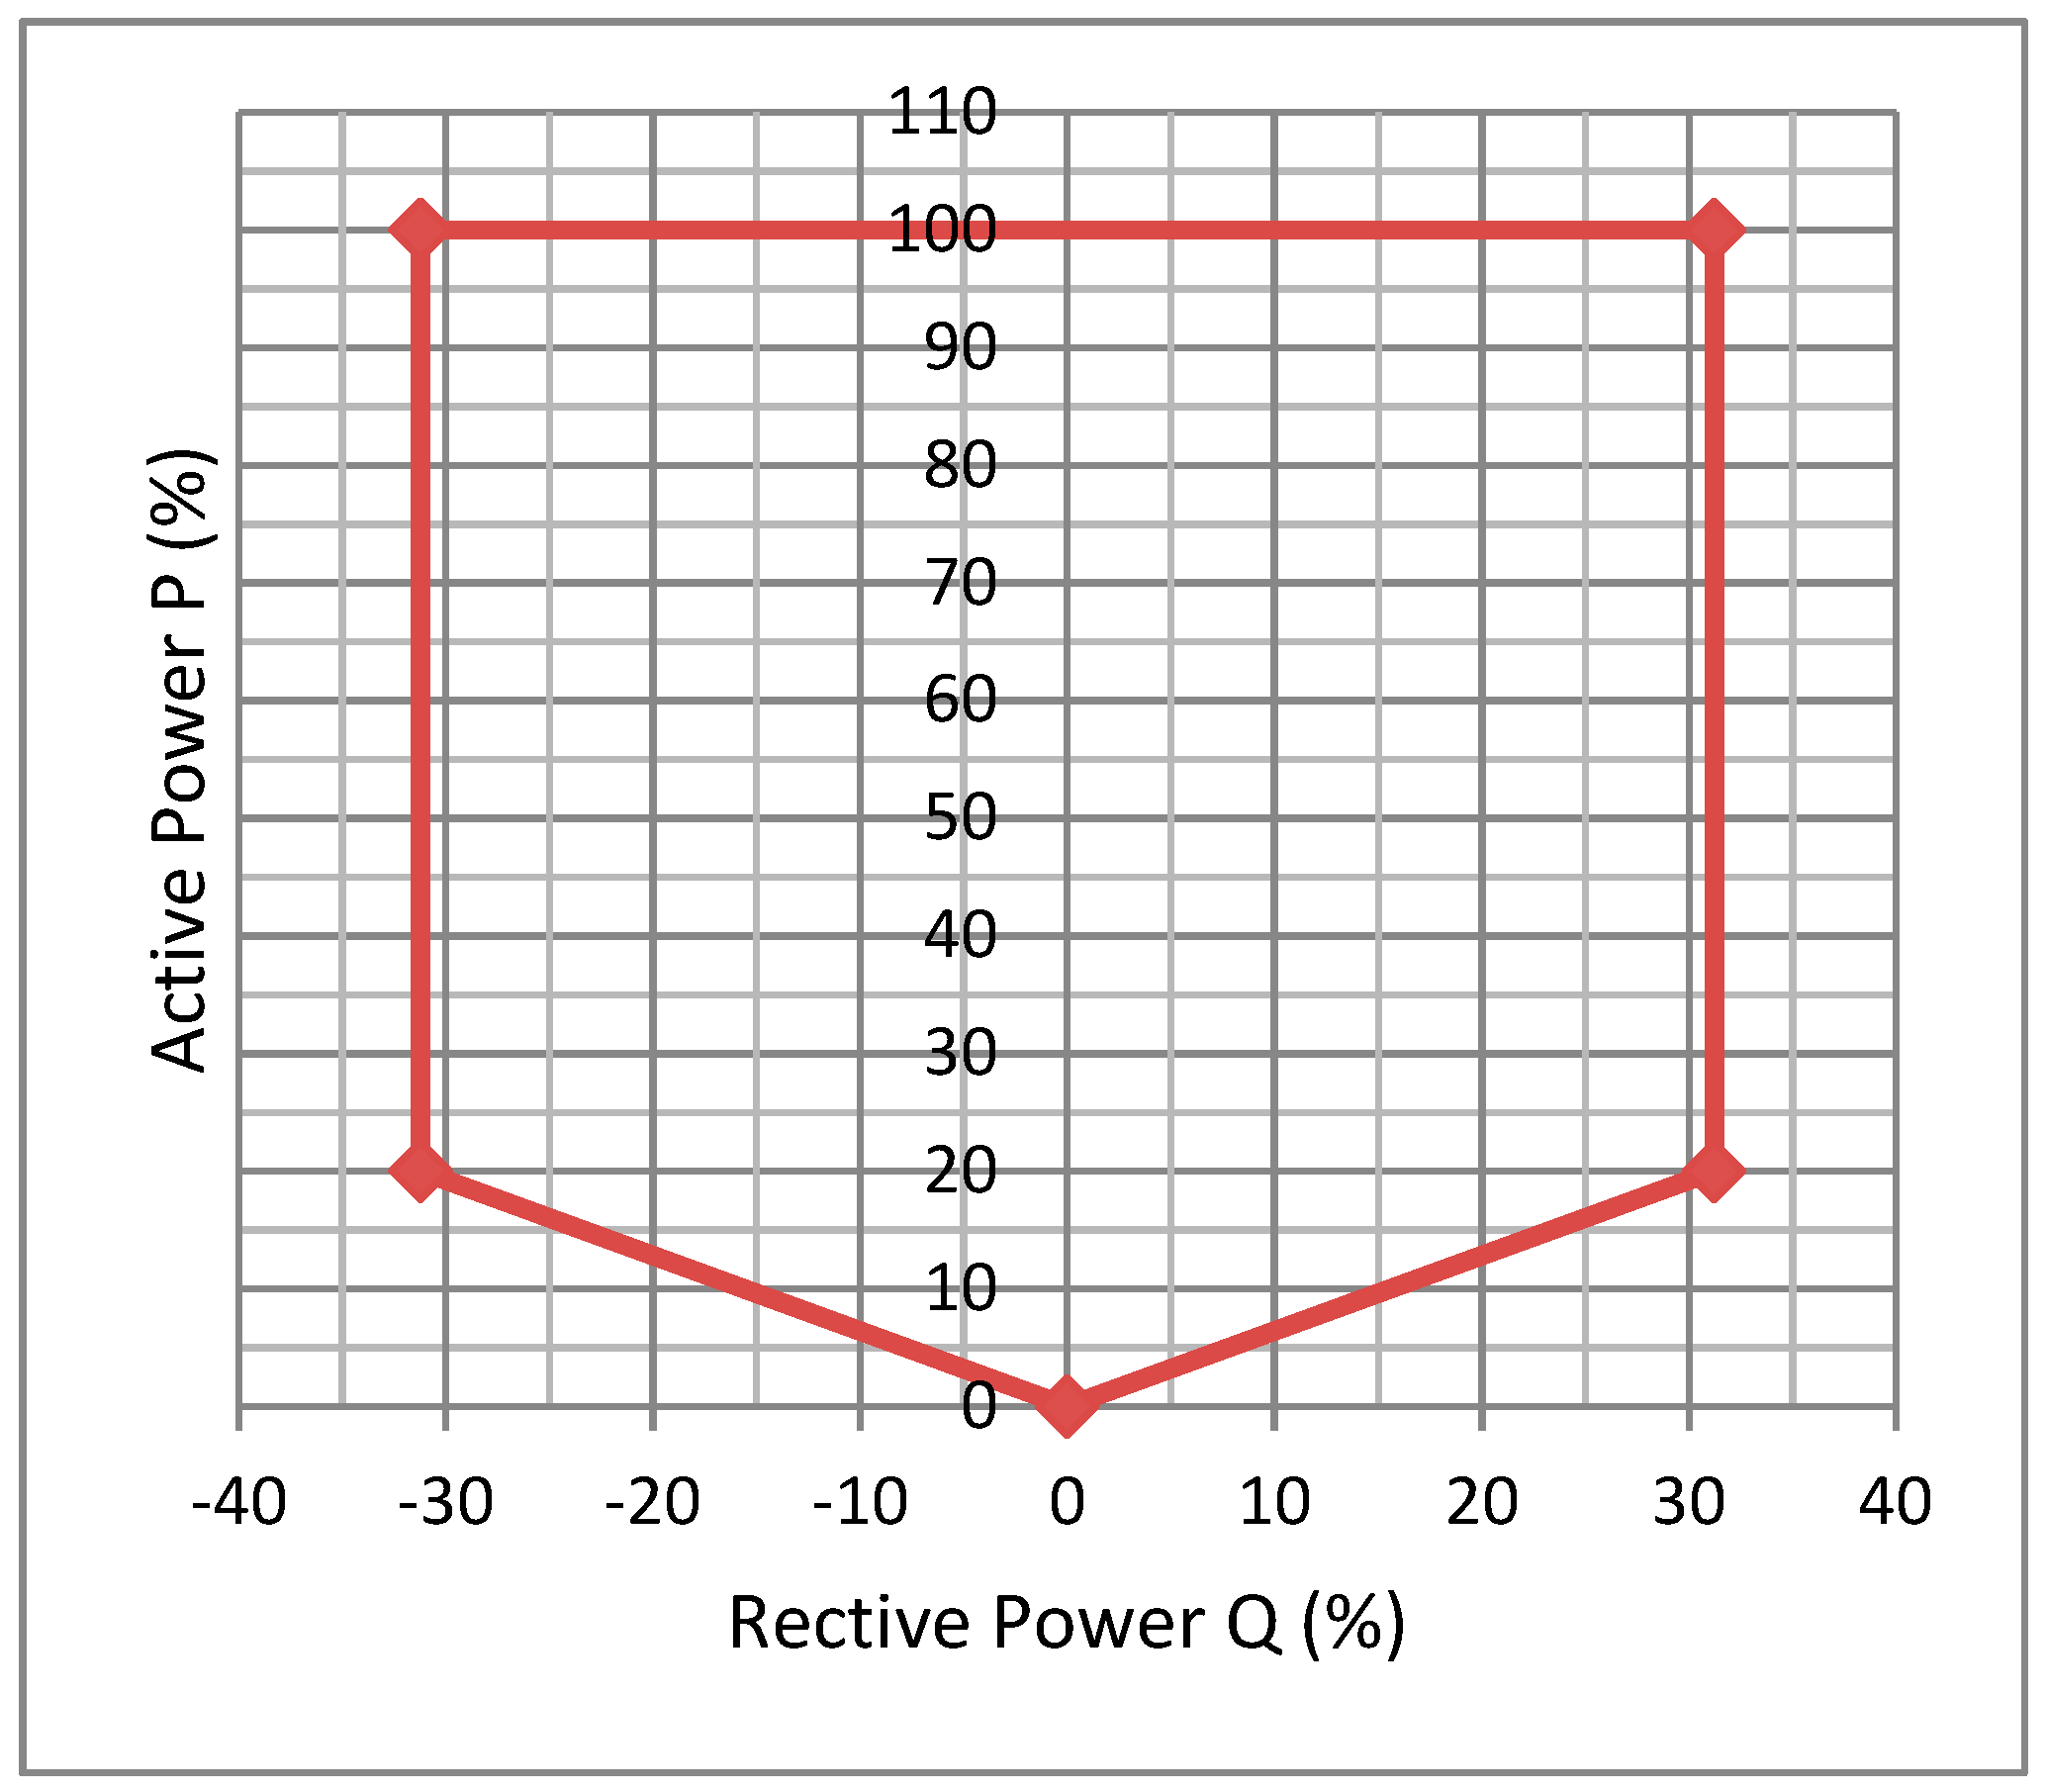
Wind power plants shall be able to operate with a power factor limits 0.95 lagging and 0.95 leading, at nominal active power generation, as illustrated in Figure 3. The requirements are referred to the Point of Common Coupling (PCC) with the grid. The compensation shall be dimensioned according to the needs of the grid where the wind turbines are connected. It shall be possible to change the set-point for the voltage controller both locally and remotely [21].
WTGs should be capable of regulating voltage through the provision of dynamic reactive power support. However, wind farms are comprised of many distributed wind turbine generators and, therefore, exhibit behavior that is different from that of conventional high rating generators. Nevertheless, from a smart grid operational point-of-view, wind farms should provide voltage controllability that is required for system stability and reliability.
3.2. Photovoltaic Park
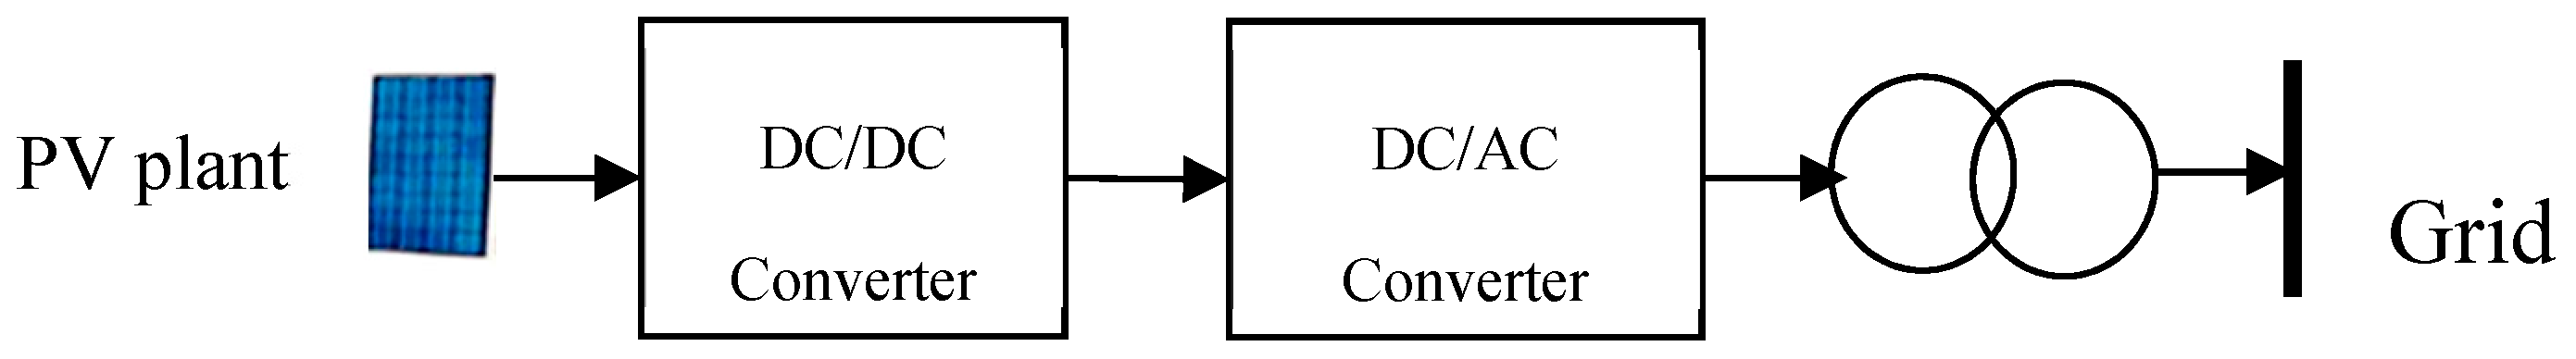
In recent years, photovoltaic systems have been widely used as distributed electric power generators in kW scale and sometimes as farms producing output power in range of MW scale. Despite the fact that the configuration of the photovoltaic farm is different than that of the traditional power plants. PV parks are required to support the grid in terms of active and reactive powers targeting stable and reliable system. Figure 4 shows the main components of a grid tied photovoltaic power plant. Active and reactive power control systems mainly depend on the change of the control signal of the two converters of the system.
Based on some European countries grid code and Chinese grid code for integrating the PV to the grid, the following requirements should be applied [22,23]:
3.2.1. Frequency and Active Power Control
Grid-connected photovoltaic power stations are required to respond to the frequency deviation that is based on different grid codes. Different output response requirements are generally specified to three frequency ranges. In the range of e.g., ±0.2 Hz maximum deviation from the base frequency a dead band is set. The system frequency within this range needs no response of the photovoltaic park output. When the power system frequency is higher than 50.2 Hz, a PV park should reduce its active power; the control in this case is performed while using the frequency droop method. If the frequency is below 49.8 Hz, then active power control may also be applied. In existing codes of some countries, no active power control is required in this frequency range. The dead band in ENTSO-E and Germany codes is ±0.5 Hz [23].
3.2.2. Voltage and Reactive Power Control
The grid connected inverters installed in photovoltaic power station should meet the requirement that their power factors could be dynamically adjusted within the range of 0.95 leading 0.95 lagging at the rated active power output, as shown in Figure 3. Solar codes in some countries require reactive power control within the above range even at zero active power output [24].
If a fault occurs; to get faster grid voltage recovery, the grid-connected photovoltaic park is required to increase its reactive current output when the voltage dip occurs at PCC with the grid to provide voltage support. If the voltage at the PCC ranges between 0.9 p.u. to 1.1 p.u., no reactive current injection or absorption is enabled based on the grid code of many countries, but, below 0.9 p.u. a reactive current should be injected to the grid as fast as possible (less than 30 ms in many countries). If the voltage is higher than 1.1 p.u., reactive power absorption is required by the PV park.
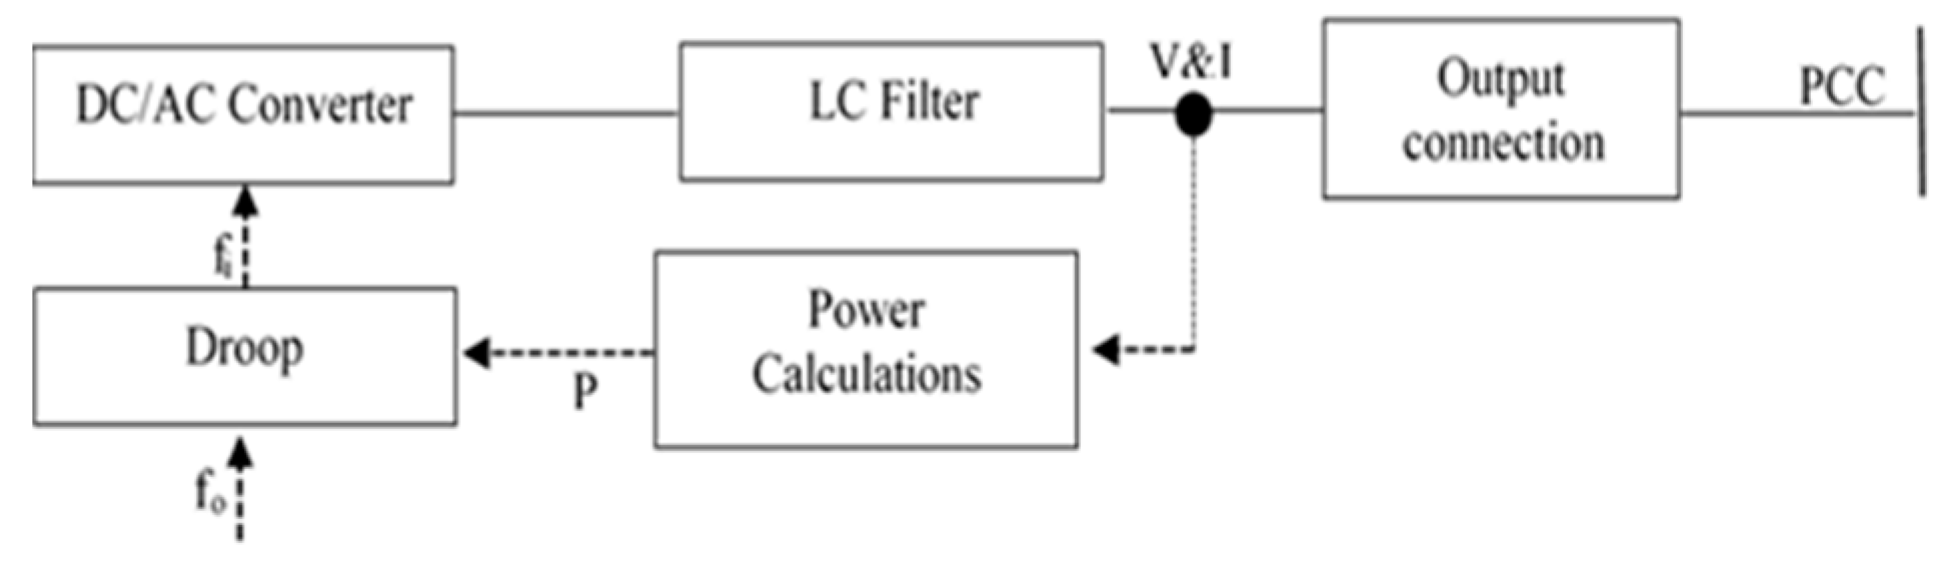
3.3. Implementation of Power Frequency Control
Figure 5 shows a frequency control system of inverters-based generators in power systems. The three blocks are power block, current block, and voltage block. The current and voltage blocks are classified as fast dynamics blocks, while power block concerns with power control ignoring fast dynamics of the other two blocks. The basic key in the power controller is the droop control, since the inertia is small in most wind turbines and negligible in PV modules so the primary frequency control is made mainly using the droop control. Equation (1) describes the power frequency control [25].
where is the output frequency while is the desired frequency, is the park or farm measured real power, and is the frequency droop.
4. Voltage Control & Pilot Bus Selection
4.1. Secondary Voltage Control
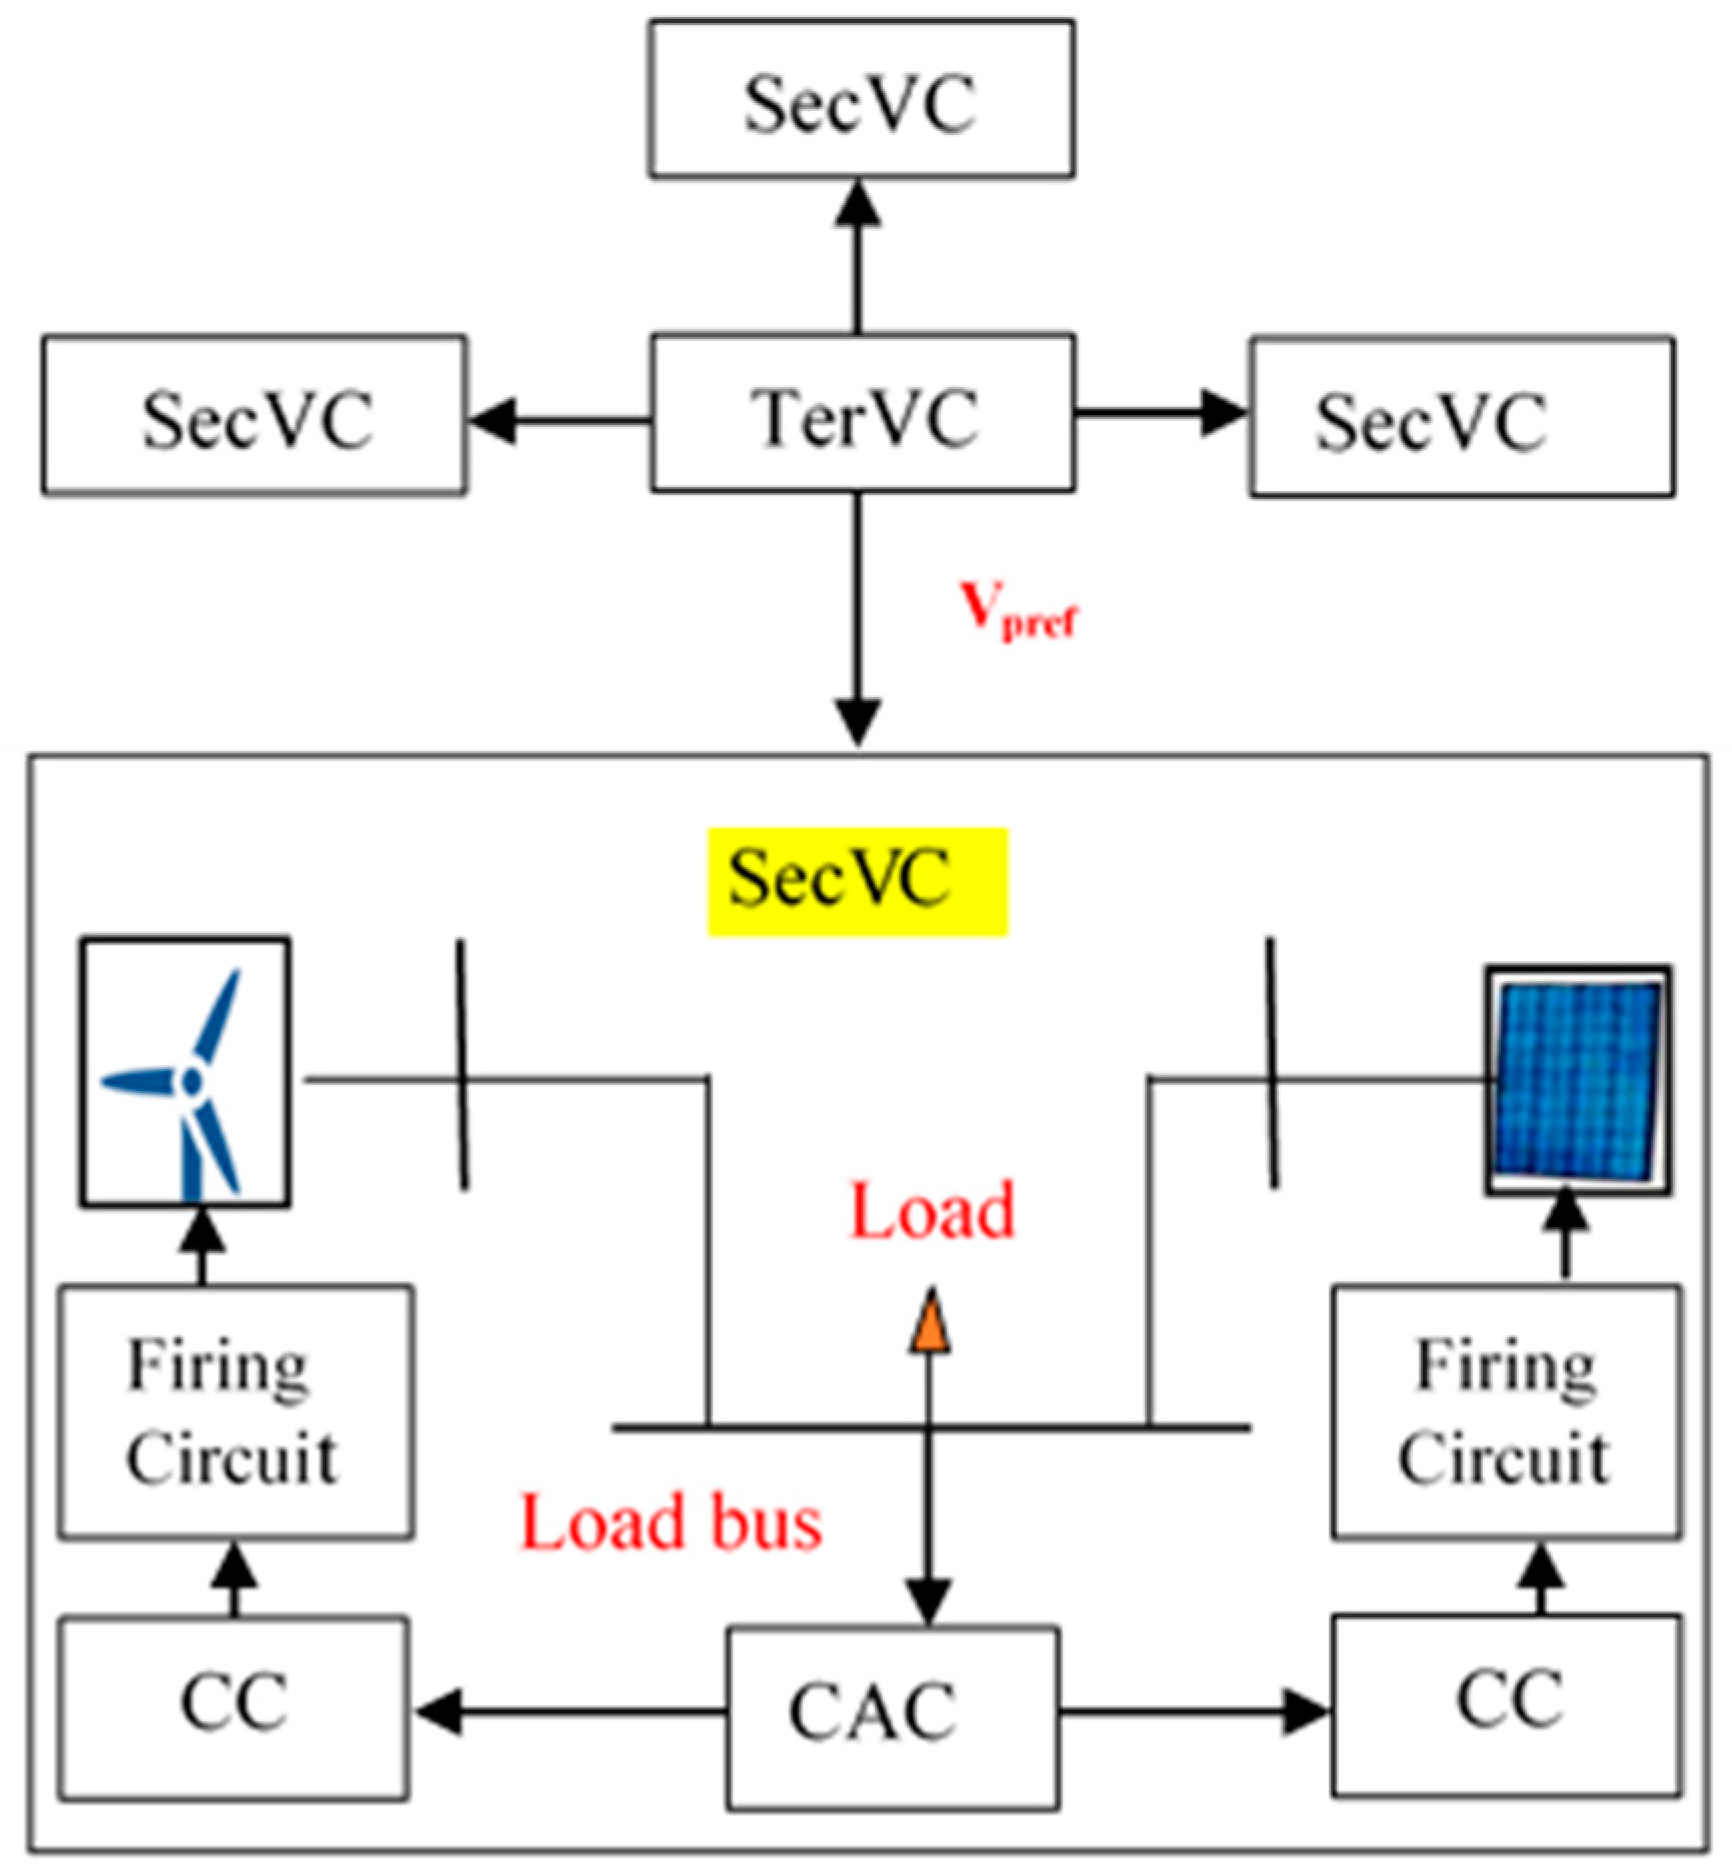
To apply SecVC in a large electrical power network, the network is normally partitioned into regions while small networks are considered as a single region power system, as illustrated in [8]. The reactive power compensators/generators are responsible for absorbing or generating adequate reactive power to reach an optimal value. The SecVC main objective when applied to a smart grid consisting of renewable generators is to control the pilot bus voltages magnitude by changing the reference points of the firing circuits of the wind or photovoltaic inverters in a coordinated way.
Figure 6 illustrates how voltage control hierarchy is applied based renewable power generators in the electrical network with SecVC configuration details. The execution time of each level is less than the higher one in order to avoid overlapping between the three levels. This application can be implemented by adapting the dominant time constant of the SecVC to be higher than that of all the PriVCs in the power grid and the TerVC is performed every half an hour or longer time interval [9]. The voltage control sequence is performed, as described by the following procedure:
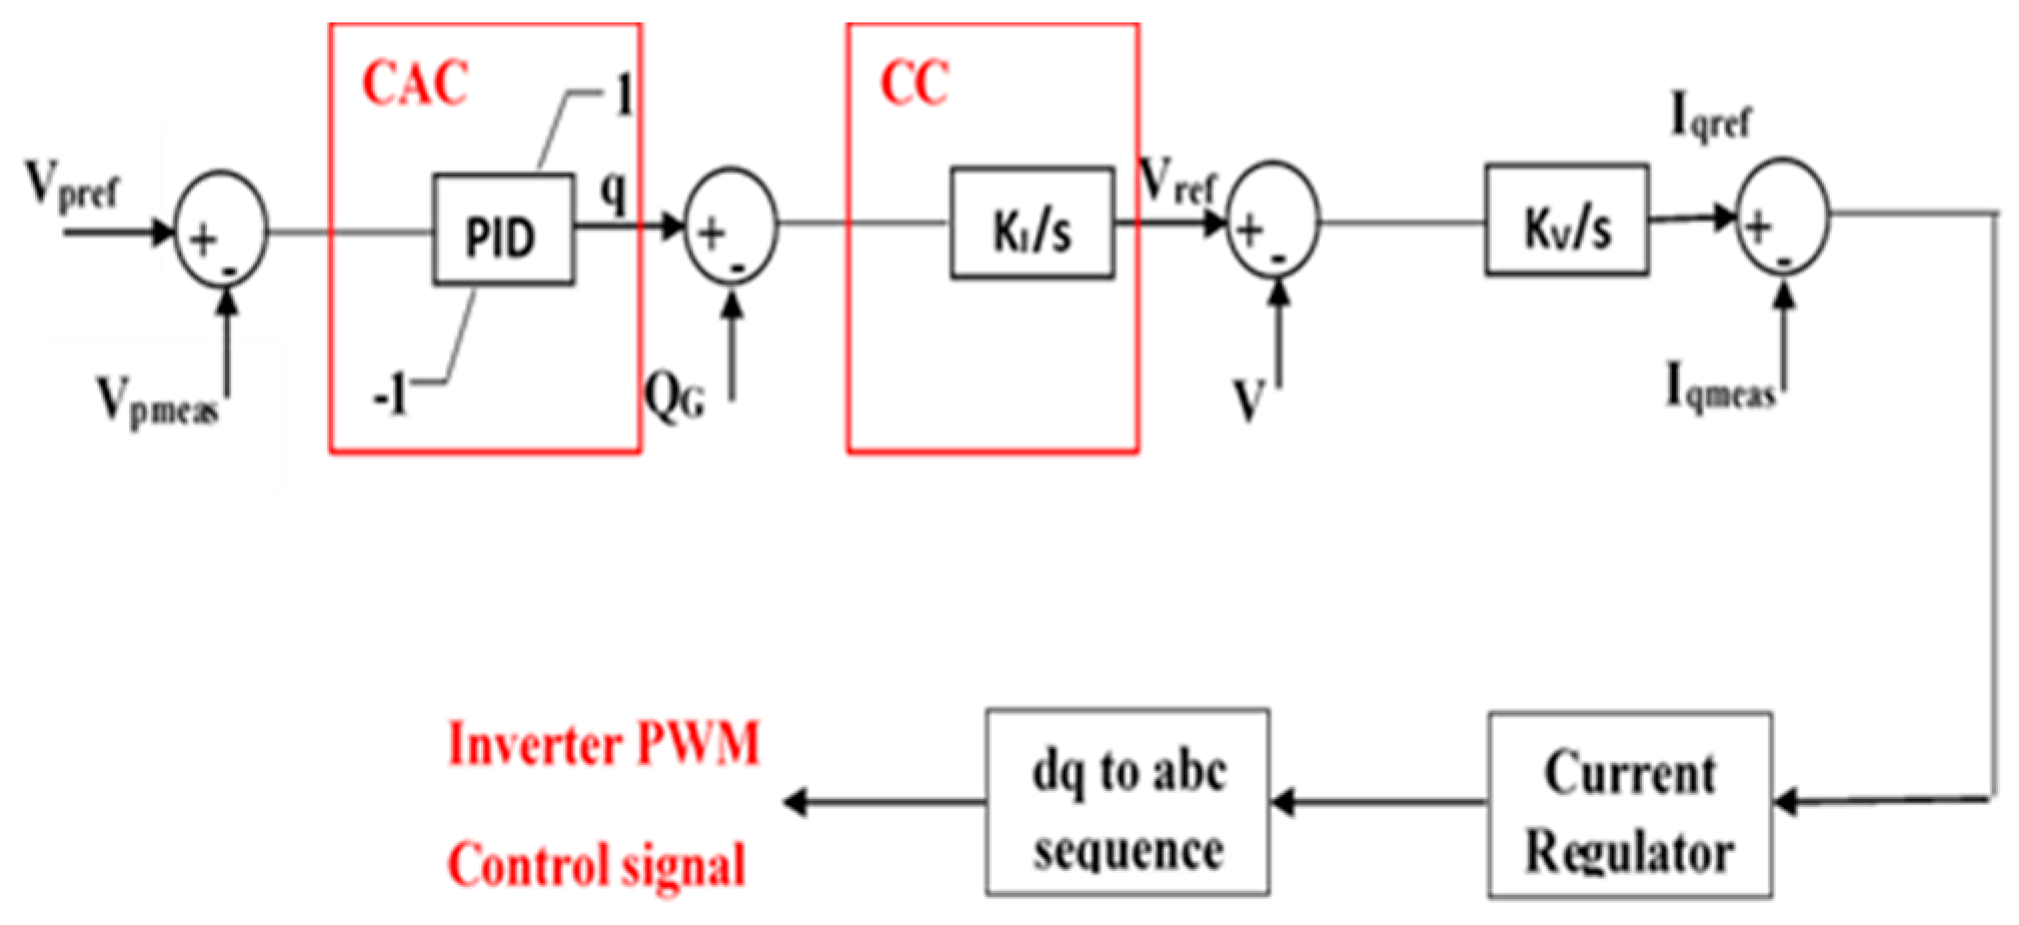
PriVC (firing angle control) controls the PCC voltage magnitude of the farm or the park, which is implemented by controlling automatically the on–off switching of the inverter through controlling Iqref reference current, as shown in (2). The time constant of the PriVC is normally short (≤0.5 s). The actual measured Iqmeas is compared with the reference Iqref, as shown in (3), and the error (ΔIq) is the input of the current regulator, which by its role will control Vd and Vq leading to the change of the firing angle of the inverter.
Figure 7 shows Unit Cluster Control (CC). The PriVC voltage reference could be varied between Vmin and Vmax, which obtains the unit reactive power production QG corresponding to its reference value Qref, as illustrated in (4).
where represents the regulator integral gain [6]. , XTG, and Xeq are dominant time constant, transformer power station reactance, and equivalent reactance of the line connecting the pilot bus with reactive power source, respectively.
The pilot Central Area Control (CAC) provides reactive power level q. The reactive level q has minimum and maximum limits, which are qmin = −100% and its maximum qmax = 100% to track pilot bus reference value Vpref [9].
where , , and are the coordinated PID controller parameters.
can be obtained by performing optimal power flow calculation in order to achieve certain objective of operation when considering equality and non-equality constraints.
4.2. Pilot Bus Selection
The pilot bus is selected based on the idea of controlling this bus to control the voltages of all load buses in the voltage control area. The load bus with the highest voltage sensitivity || in each area is selected to be the pilot bus [7]. Short-circuit analysis is performed to define the load bus with highest short-circuit current to support this selection.
5. Phasor Measurement Units (PMUs)
PMU is a device that can measure voltage and current phasors in the transmission in real time. PMU is one of the most promising devices in smart grid, as it facilitates the application of many features such as real time control and protection in addition to self-healing. The distinction comes from its unique ability to provide synchronized phasor measurements of voltages and currents from widely dispersed locations in an electric power grid. The commercialization of the global positioning satellite (GPS) with an accuracy of timing pulses in the order of one microsecond made possible the commercial production of phasor measurement units [26]. The main question, which was raised in the past decade, is it possible to install a PMU in each bus bar? Because of the cost of the measurement devices, it is not economically feasible to place them at every grid bus, the answer is no [27]. In this paper, a sequential linear programming optimization technique is used to get real time measurements for the load buses voltages using a minimum number of PMUs [28].
The optimization problem is defined as follows:
- Objective function: minimization of the PMU devices in the power system,
Such that is the total number of buses, is 0 or 1 depending on the PMU capability of measurement and x is the bus number.
- Variables: buses that include PMU devices.
- Constraints: each bus voltage can be reached by at least one PMU, i.e.,f(x) ≥ 1
f(x) is a vector function, whose entries are non- zero if the corresponding bus voltage is solvable while using the given measurements [27,28].
The PMU can measure the entire bus voltage and the voltage of other buses connected to the bus which has PMU. The optimal placement of PMUs is applied to the network that is shown in Figure 1. Performing the optimization on MATLAB, results in placing PMUs at buses 2, 6, 8, and 9.
6. PID Controller Design
The design of PID controllers will be performed for each operation condition separately using the GA toolbox in MATLAB to enable the pilot bus to reach its optimal value at this condition. The optimization problem is described, as follows:
- Objective Function: Minimizing the integration of pilot bus voltage error (Δ):
- Variables: coordinated PID controller parameters (, , and ).
- Constraints: q limits (±100%) and generated reactive power limits.
GA is widely known for its optimization capability results; it includes three main stages, which are: reproduction, crossover, and mutation. GA in each stage produce a new generation from the old one by selecting individuals. The convergence speed is varied by using different probabilities for applying these operators. Crossover and mutation operators must be designed carefully, because their selection highly contributes in the evaluation of genetic algorithm [29].
In the reproduction stage, the performance of individuals is measured by the fitness function, and it also directs the selection process. Suitable individuals increase opportunities to transfer genetically important material to successive generations. Through this route, GA searches in the search space from many points simultaneously, and the search focus is constantly narrowed to the observed performance areas [29]. The reproduction is responsible for selecting a novel form of chromosomes, and cross-over mix exchanging partitions of two chromosomes. More chromosomes are generated with the cross-over operation. Reproduction is a clear characteristic of existing species with significant reproductive potential that their population size will increase exponentially if individuals of this species proliferate successfully. Reproduction can progeny by the transfer of the individual’s genetic program. The search space is widened to all possible groups of the parameter values of the controller in order to minimize the values of the fitness function, which is the error criterion. The error criterion of PID controller is minimized by GA in each iteration. In this paper, integral of square error is selected to be minimized as a fitness function for the design of optimal controllers [29]. The GA applied in this research has the following settings: population type: double vector, population size: 20. The Elite count reproduction: 2 and the crossover fraction: 0.8. To avoid premature convergence to local optima, the best set of parameters for the optimization problem are selected by adapting the number of population members and number of generations in addition to increasing the mutation rate in GA toolbox in MATLAB.
7. Tertiary Voltage Control
Tertiary Voltage Control (TerVC) is responsible for changing the setting point of the pilot bus voltages in order to implement Secondary Voltage Control (SecVC) based on optimal load flow process. Figure 6 shows the voltage control hierarchy. The optimal load flow is applied based on the following description:
- Objective function: minimization of total active power losses.
- Variables: buses voltage (magnitude and angle) and each renewable park/farm active and reactive power
- Constraints: the optimization process is subjected to the following conditions:
Load flow equations
Generating limits for each renewable park/farm
Bus voltage magnitude level limits
Each line loading thermal limit
In (14), the maximum and minimum voltage values differ from one operating condition to another. During normal operation, the minimum and maximum limits should be 95 % and 105% of the rated bus voltage magnitude, respectively, while during contingency (generator outage or line outage) the limits should be 90% and 110% of the rated bus voltage magnitude, respectively.
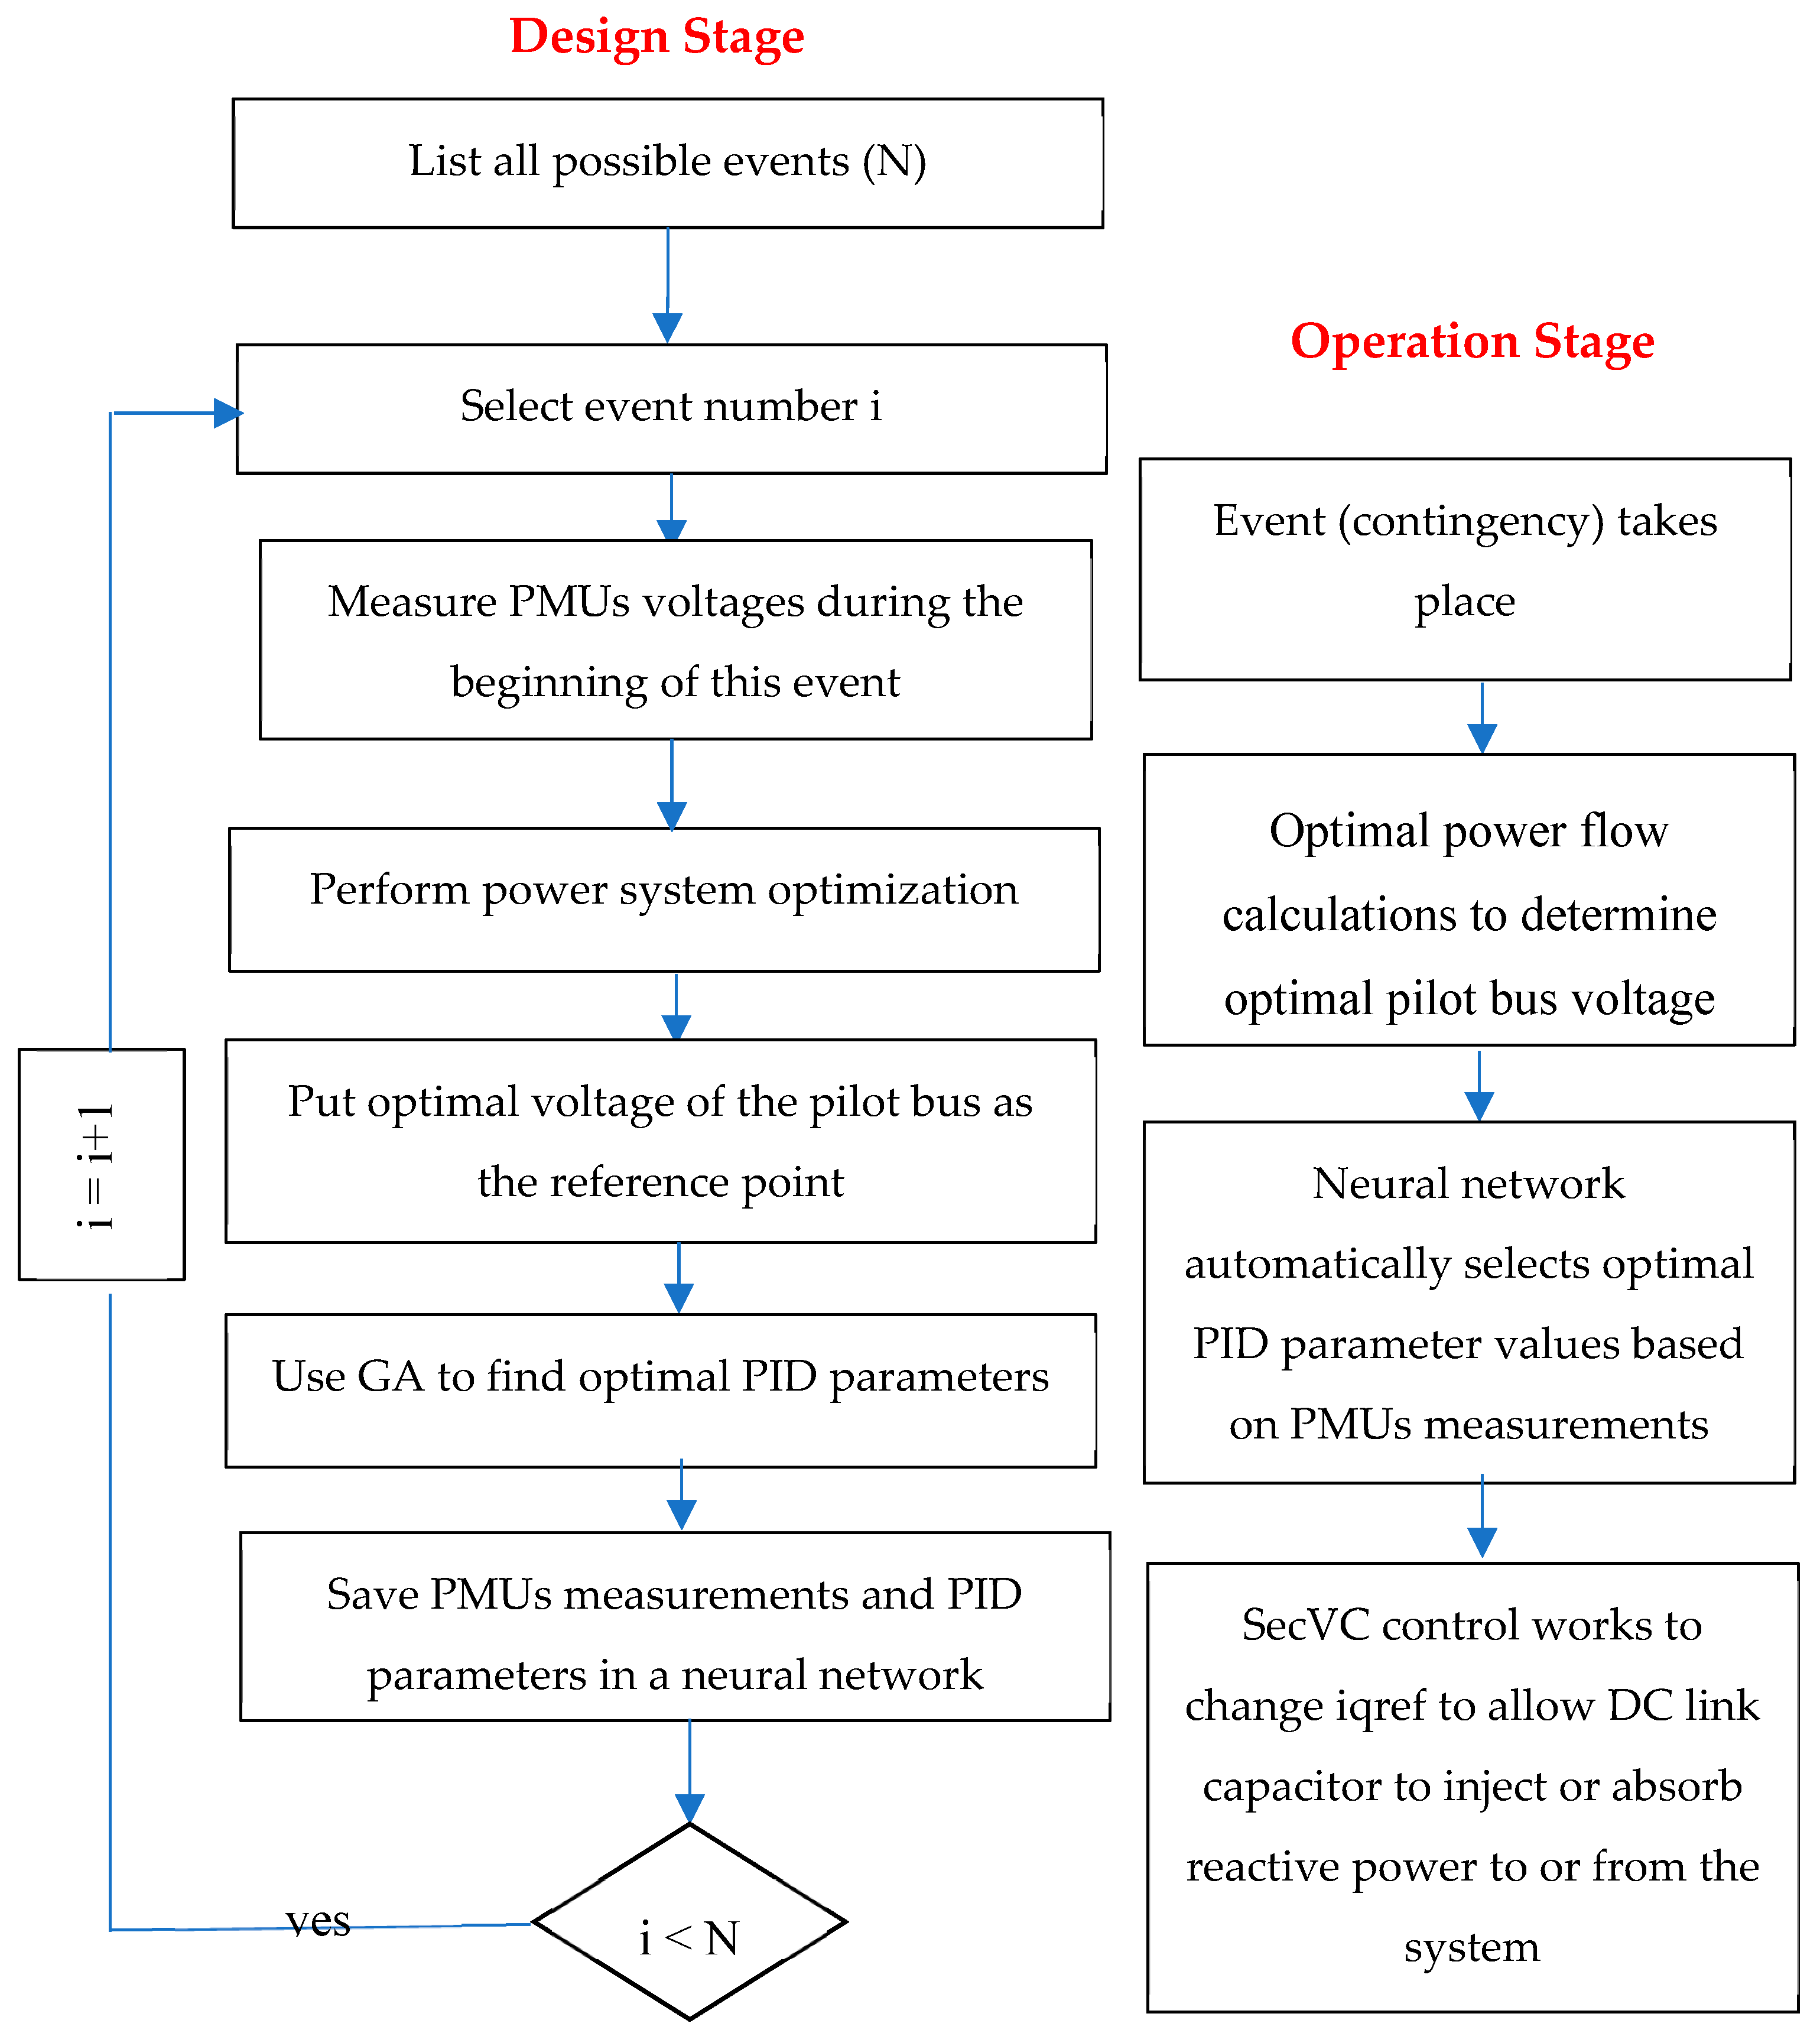
8. Proposed Control Strategy
The idea in this paper is that in high penetration level of renewables, the renewable power plants should support the voltage of loads at PQ buses in case of contingencies. In this research, we consider a 100% renewable 14-bus system with a very high penetration level of wind and photovoltaic generation, as shown in Figure 1. The voltage control strategy explained in Figure 8 includes two stages: the design stage, which is basically made to enable the grid to optimally behave during any operation stage through optimization process and artificial intelligence. During the operation stage, the system will be able to detect its entire case the optimal values of this case (certain contingency) and the controllers should work properly to reach those optimal values. The design stage flow chart shows that at different conditions of the power system optimal values change. In this study a renewable plant outage will be assumed, and the power system optimization process will take place in order to minimize the total power loss taking into considerations voltages, active, reactive power limits. The optimization will be performed using the DIgSILENT power factory software.
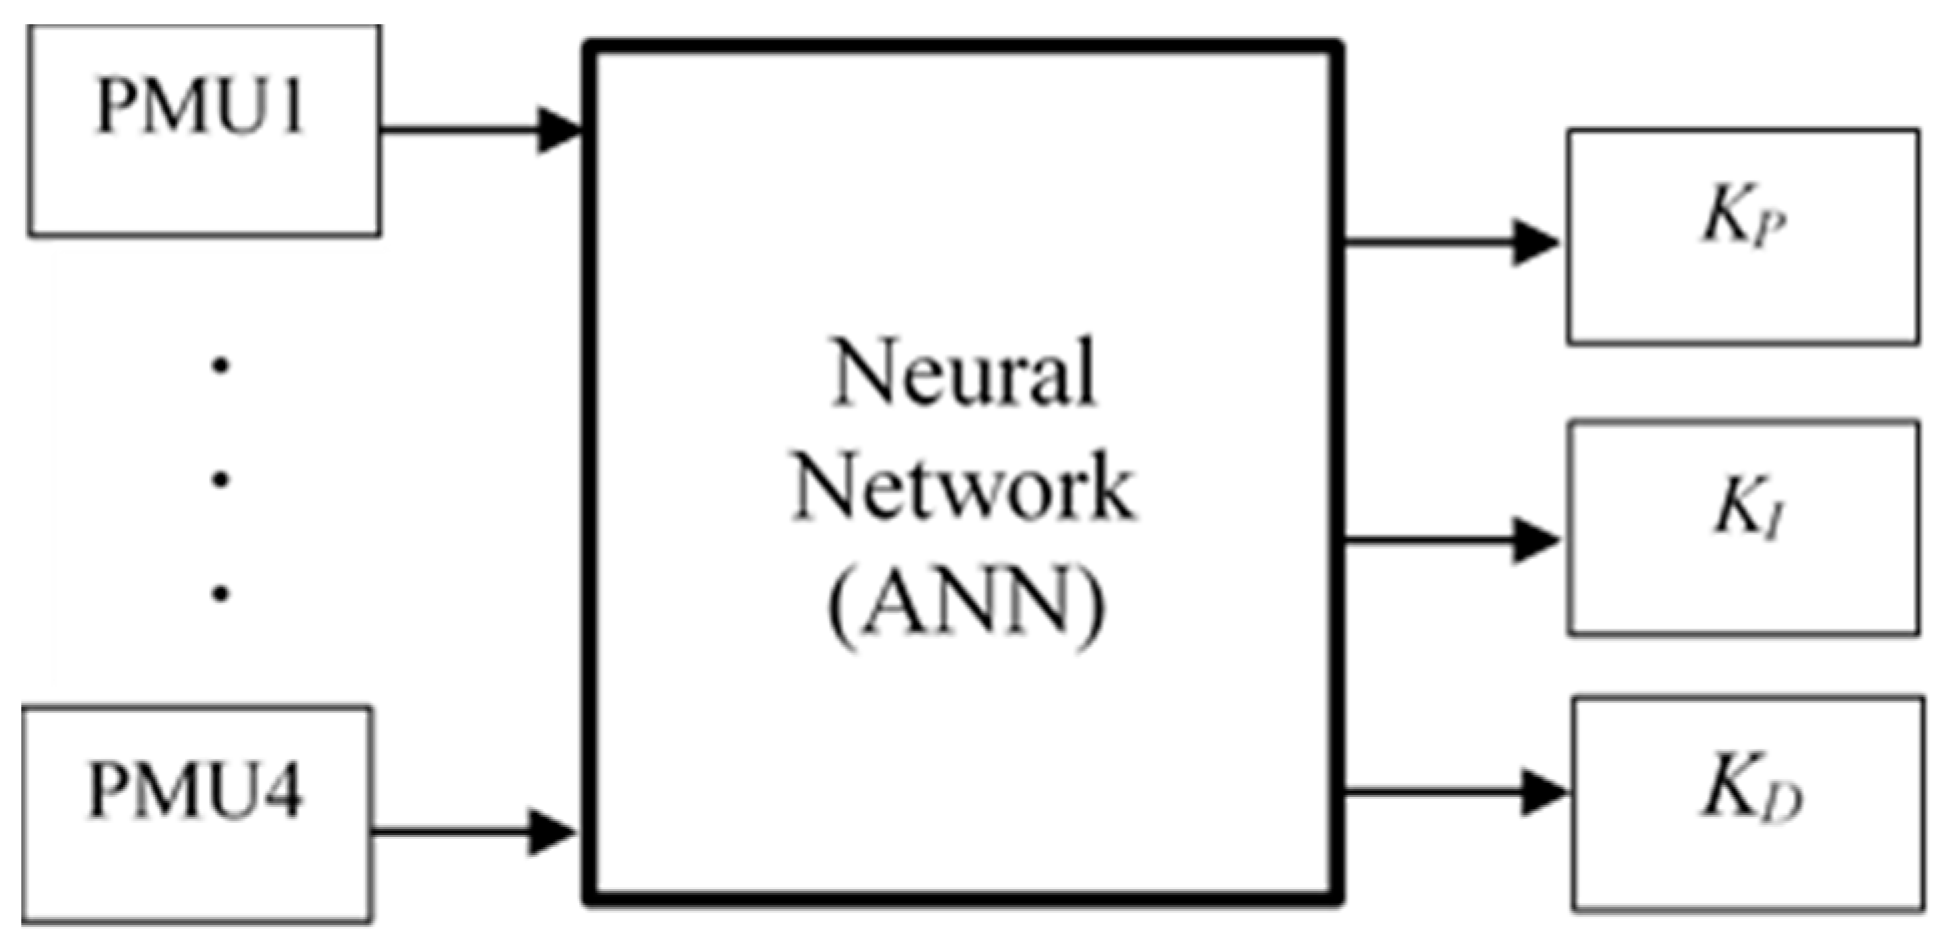
The secondary voltage control scheme, which is shown in Figure 7, includes parameters that are driven from the power system directly except the coordinated PID controller parameters, which is designed to track the reference value of the pilot load bus at a time range longer than that of the PriVC. The 100% renewable power network is subjected to different large disturbance, such as the outage of part of a renewable power plant or an outage of a transmission line. In each disturbance, the optimal parameters of the coordinated PID controller will differ due to the change of the power system configuration at each operating condition; moreover, the pilot bus voltage reference will change based on TerVC at each operating case. To solve this problem, an artificial intelligence element is used. The element is chosen to be the neural network to work based on what-if analysis such that it will be able to optimally tune the coordinated PID based on the operating condition. The neural network will select optimal PID controller parameters according to the operating condition that is determined by PMUs readings as shown in Figure 9.
The neural network is designed as follows in MATLAB/SIMULINK:
- No. of inputs: four (since the network has 4 PMUs)
- No. of outputs: three (coordinated PID controller parameters)
- Hidden layer: one hidden layer with 10 neurons
- Training method: Lavenberg–Marquardt back propagation method
To beat the curse of dimensionality of ANN, all of the possible contingencies are considered, and optimal controllers are created based on genetic algorithm for each contingency.
9. Simulation Results
9.1. Pilot Bus Selection
Both sensitivity |∂V/∂Q| and short-circuit techniques provide the same pilot bus result, which is bus 5, as shown in Table 2. It is the most sensitive bus with highest maximum short circuit current [7]. DIgSILENT software is used in order to calculate both the sensitivity and short circuit currents at all buses. The pilot bus is selected from the load buses assuming the 14-bus system consists of one voltage control area.
9.2. Normal Operation Conditions
Optimal power flow calculations are performed in normal operation conditions (base case) using DIgSILENT software. The results are shown in Table 3, which includes buses voltage magnitude (|V|) and generated reactive power. In this case, the penetration levels of wind and photovoltaic power plants at normal conditions are 54% and 26%, respectively.
9.3. Contingency 1
The wind farm at bus 1 consists of two blocks, the first one has 142.5 MW installed capacity and the second one has 47.5 MW installed capacity. This contingency simulates the outage of the second block. The second block was producing 30 MW before outage.
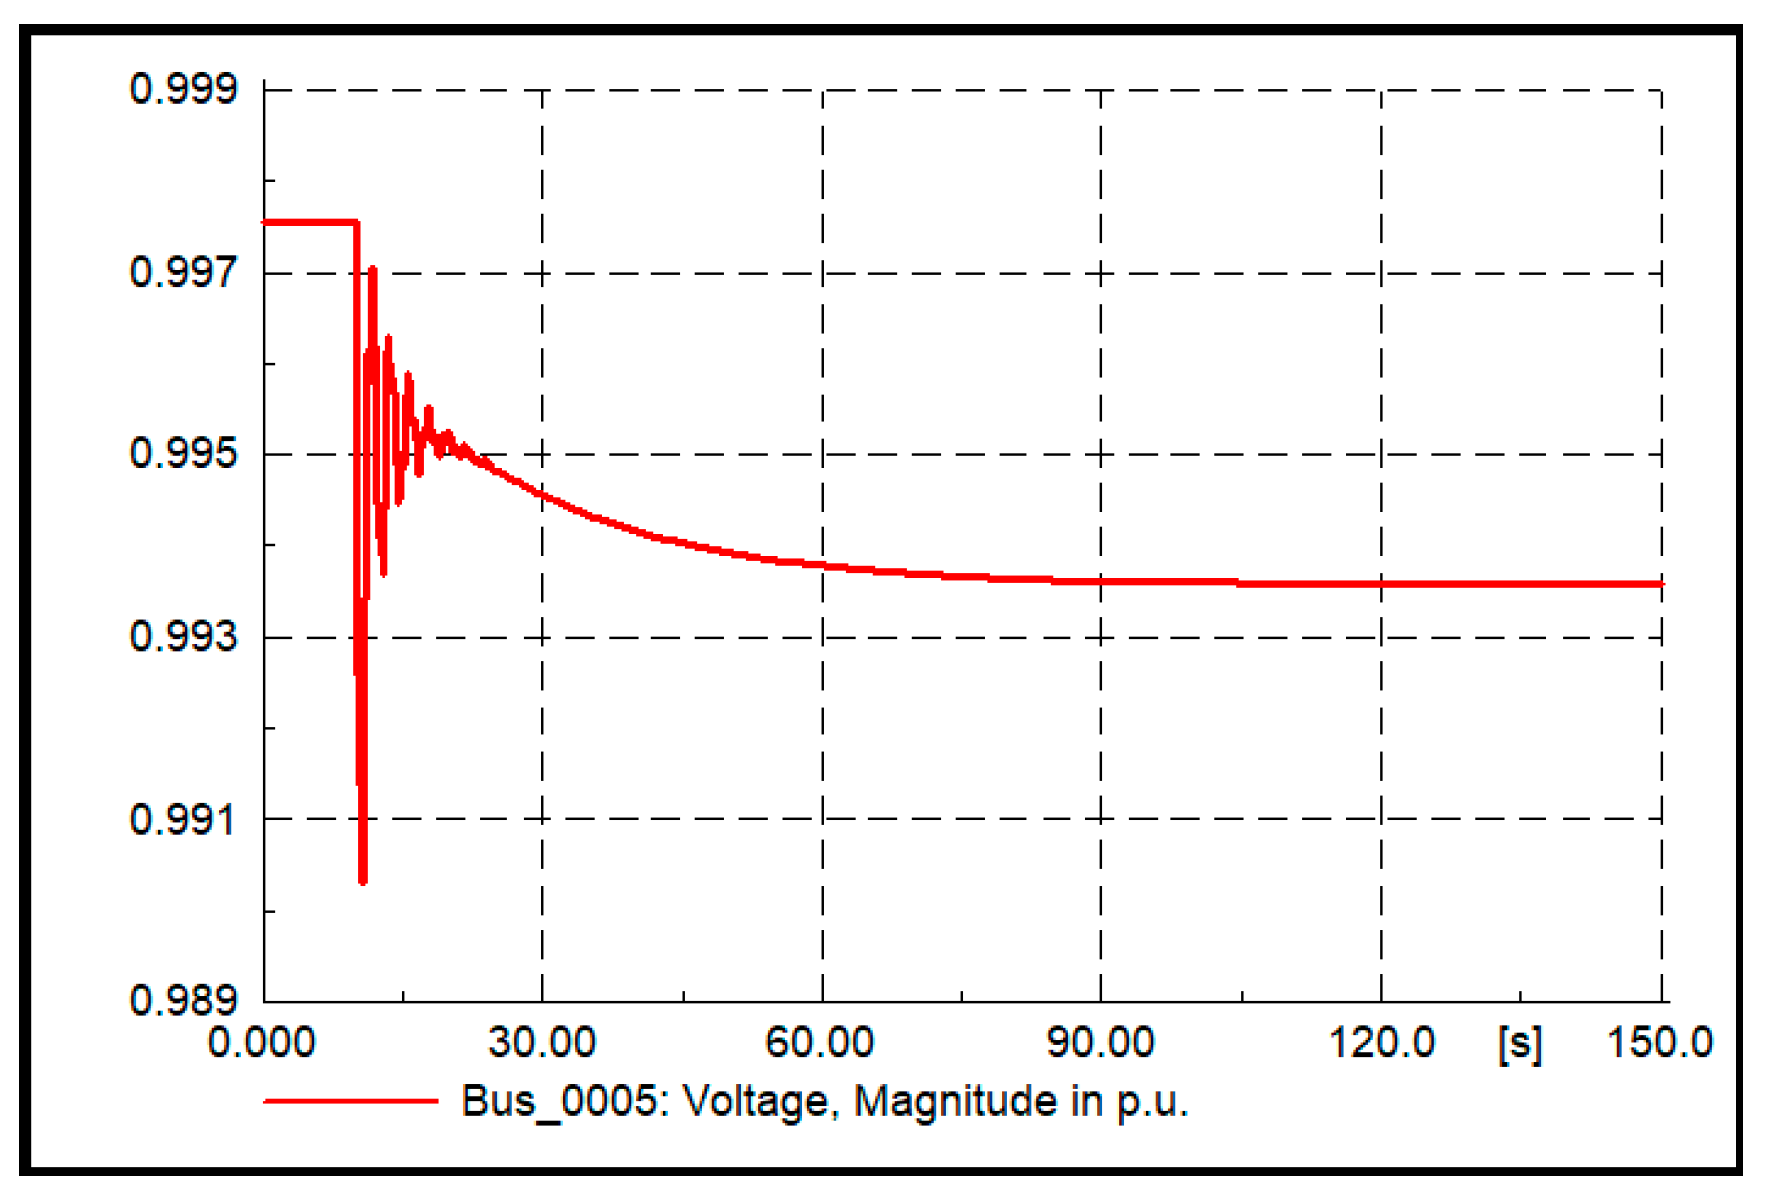
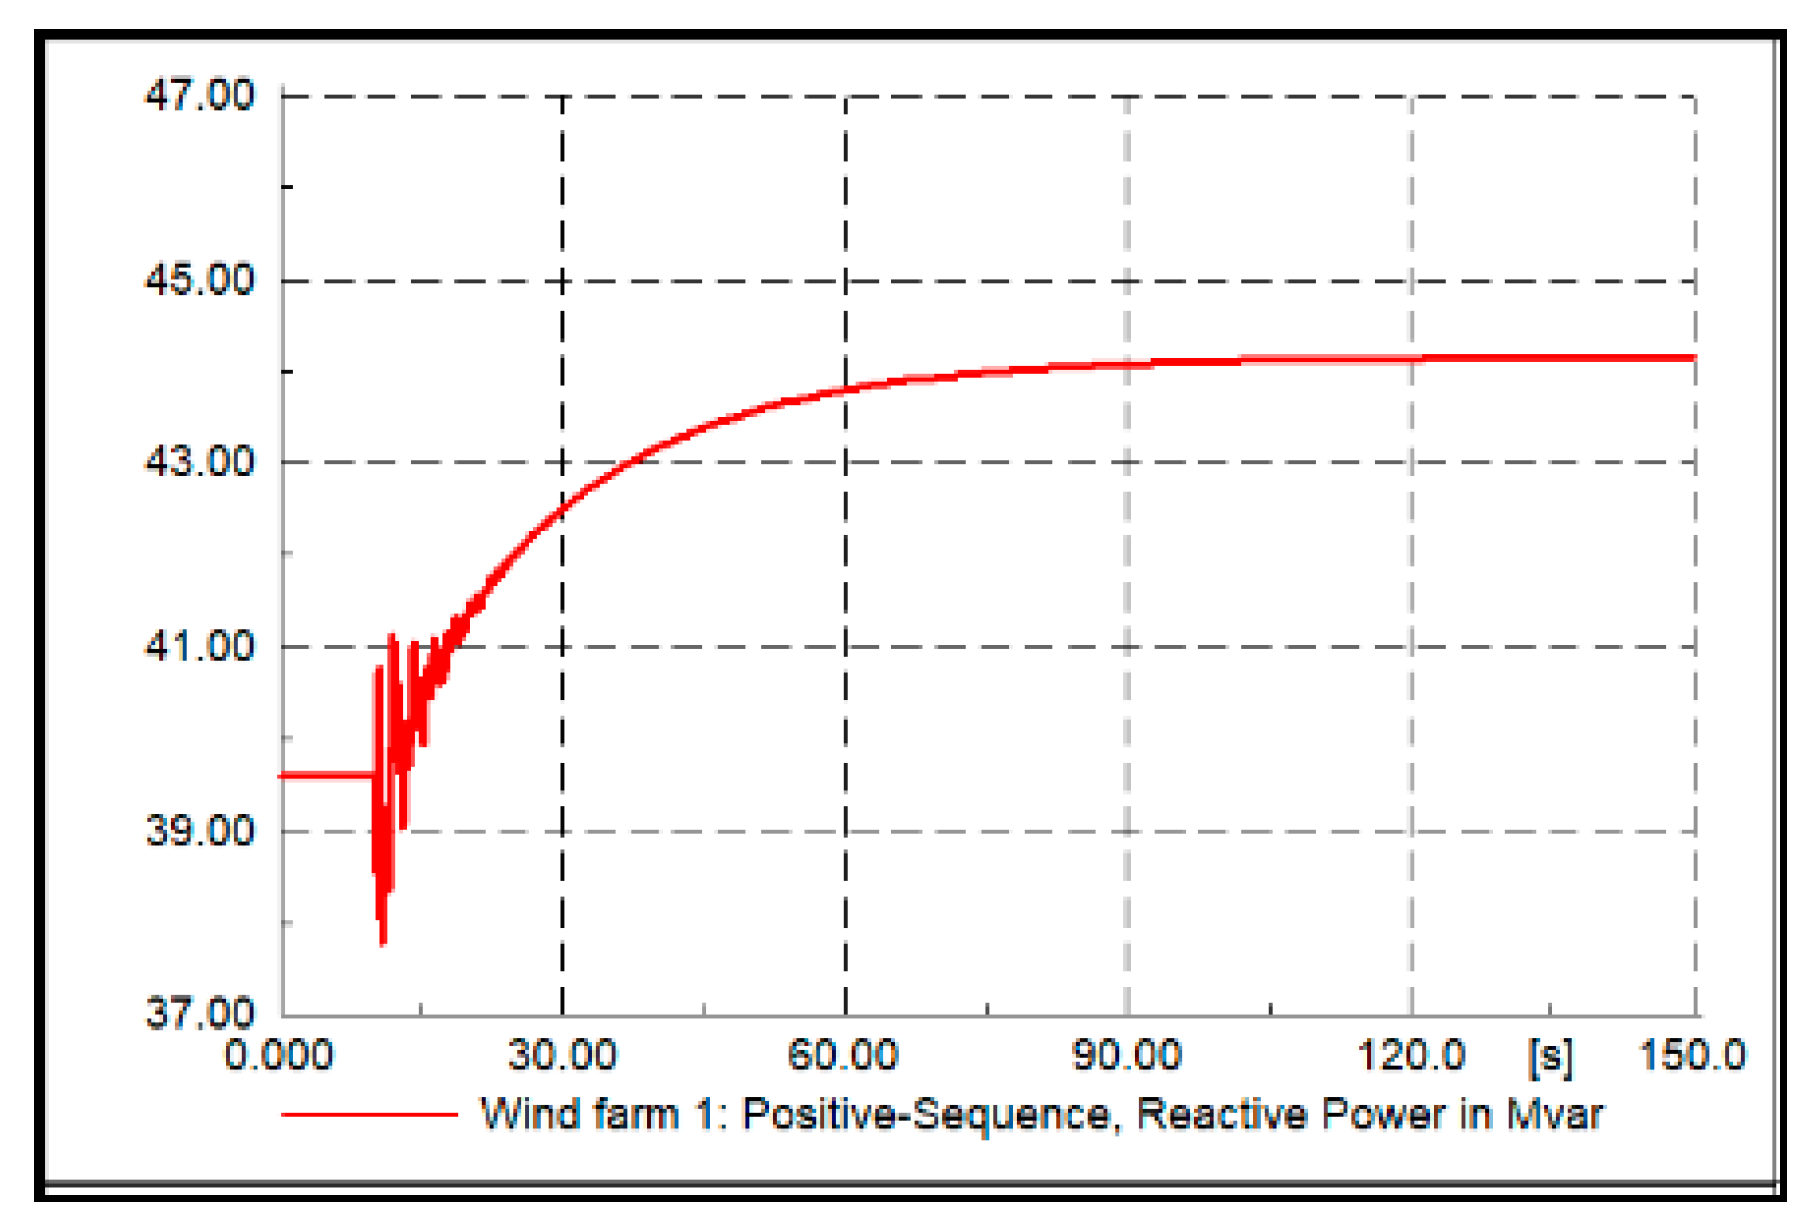
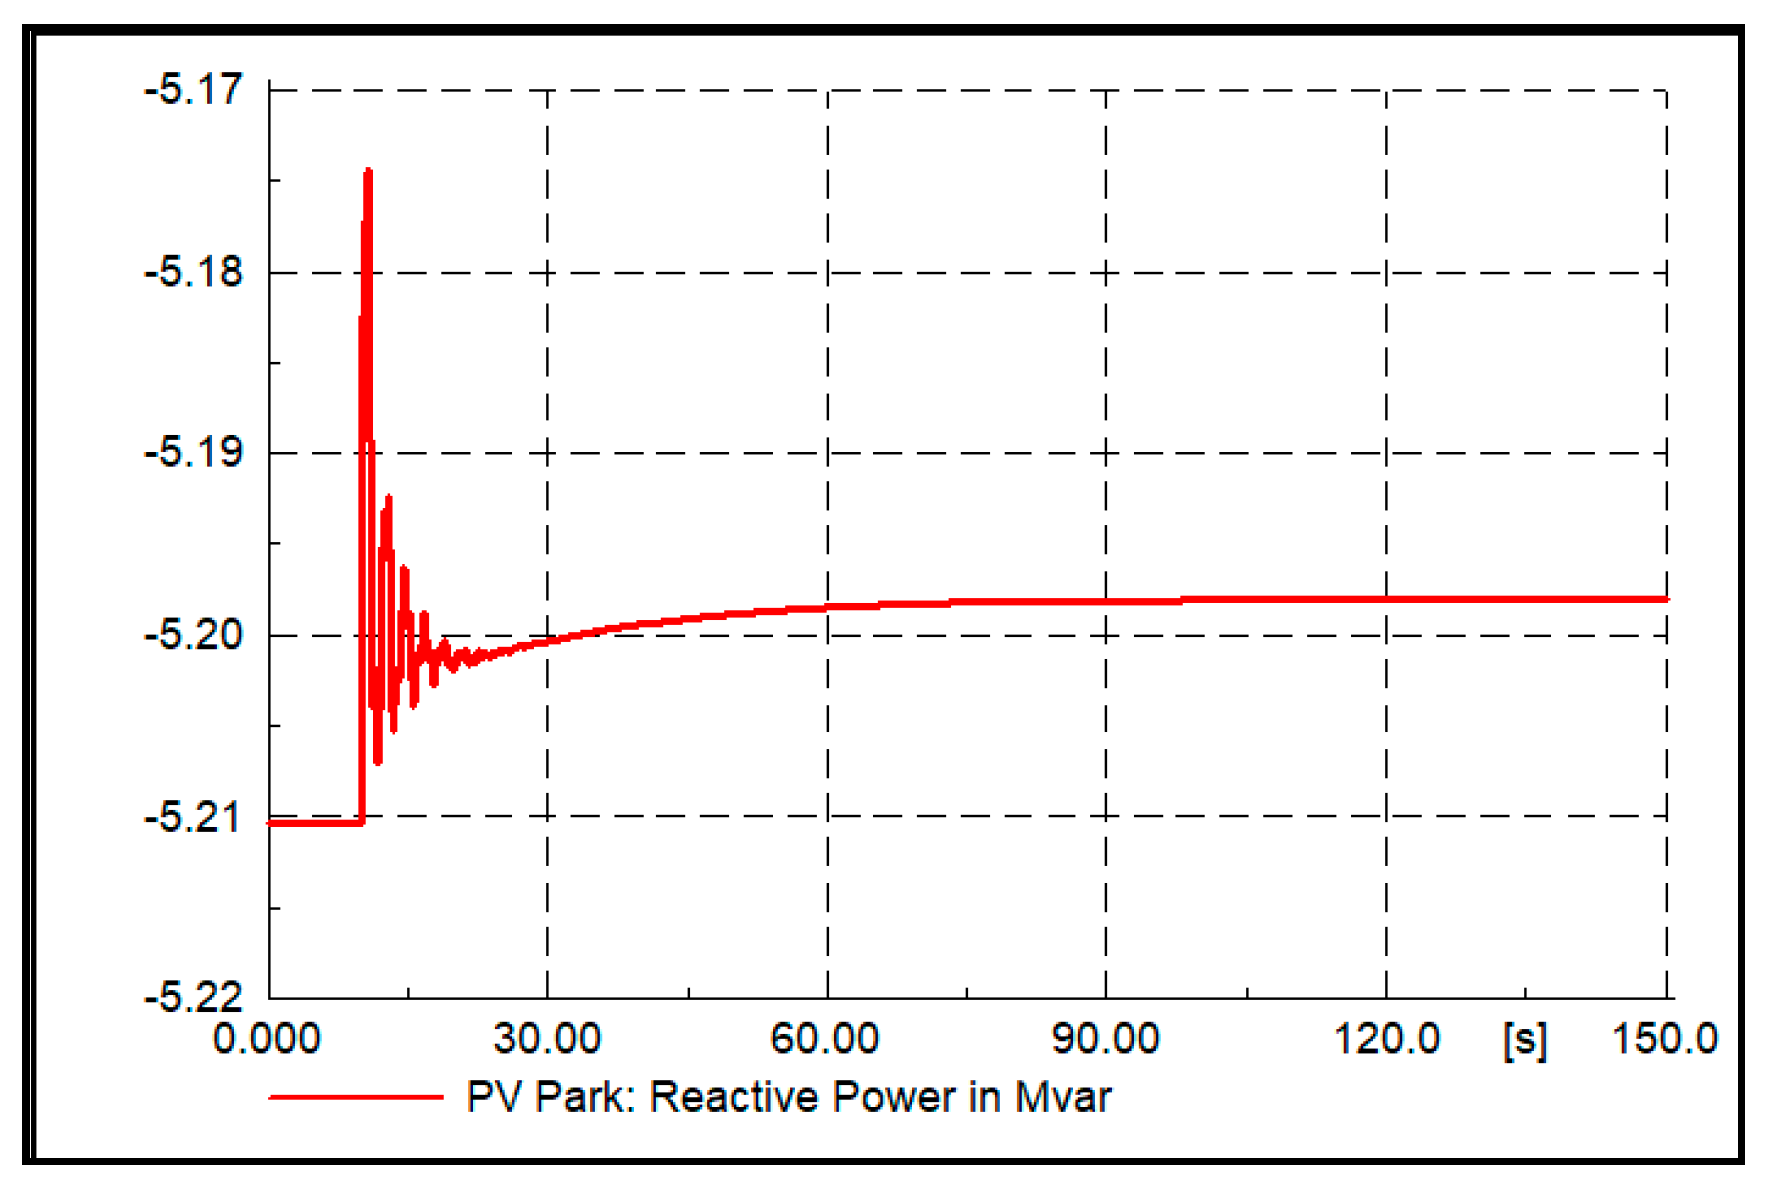
The optimal load flow calculations were conducted at this contingency to achieve minimum power losses and the results are shown in Table 3. To achieve the results of the tertiary voltage control, a coordinated secondary voltage control was applied in order to make the rest of wind farm and PV park support the pilot bus 5 to reach its optimal value. The coordinated PID controller parameters designed by GA using MATLAB/SIMULINK at this condition were found to be KP = 0.74, KI = 0.23, and KD = 0.00184. The GA takes 14 iterations to converge. Figure 10 shows that SecVC has directed bus 5 voltage to its optimal steady-state value given in Table 3 which is 0.994 p.u. Figure 11 and Figure 12 show the generated reactive power response from the wind farm and PV park, respectively, to control the load voltage.
9.4. Contingency 2
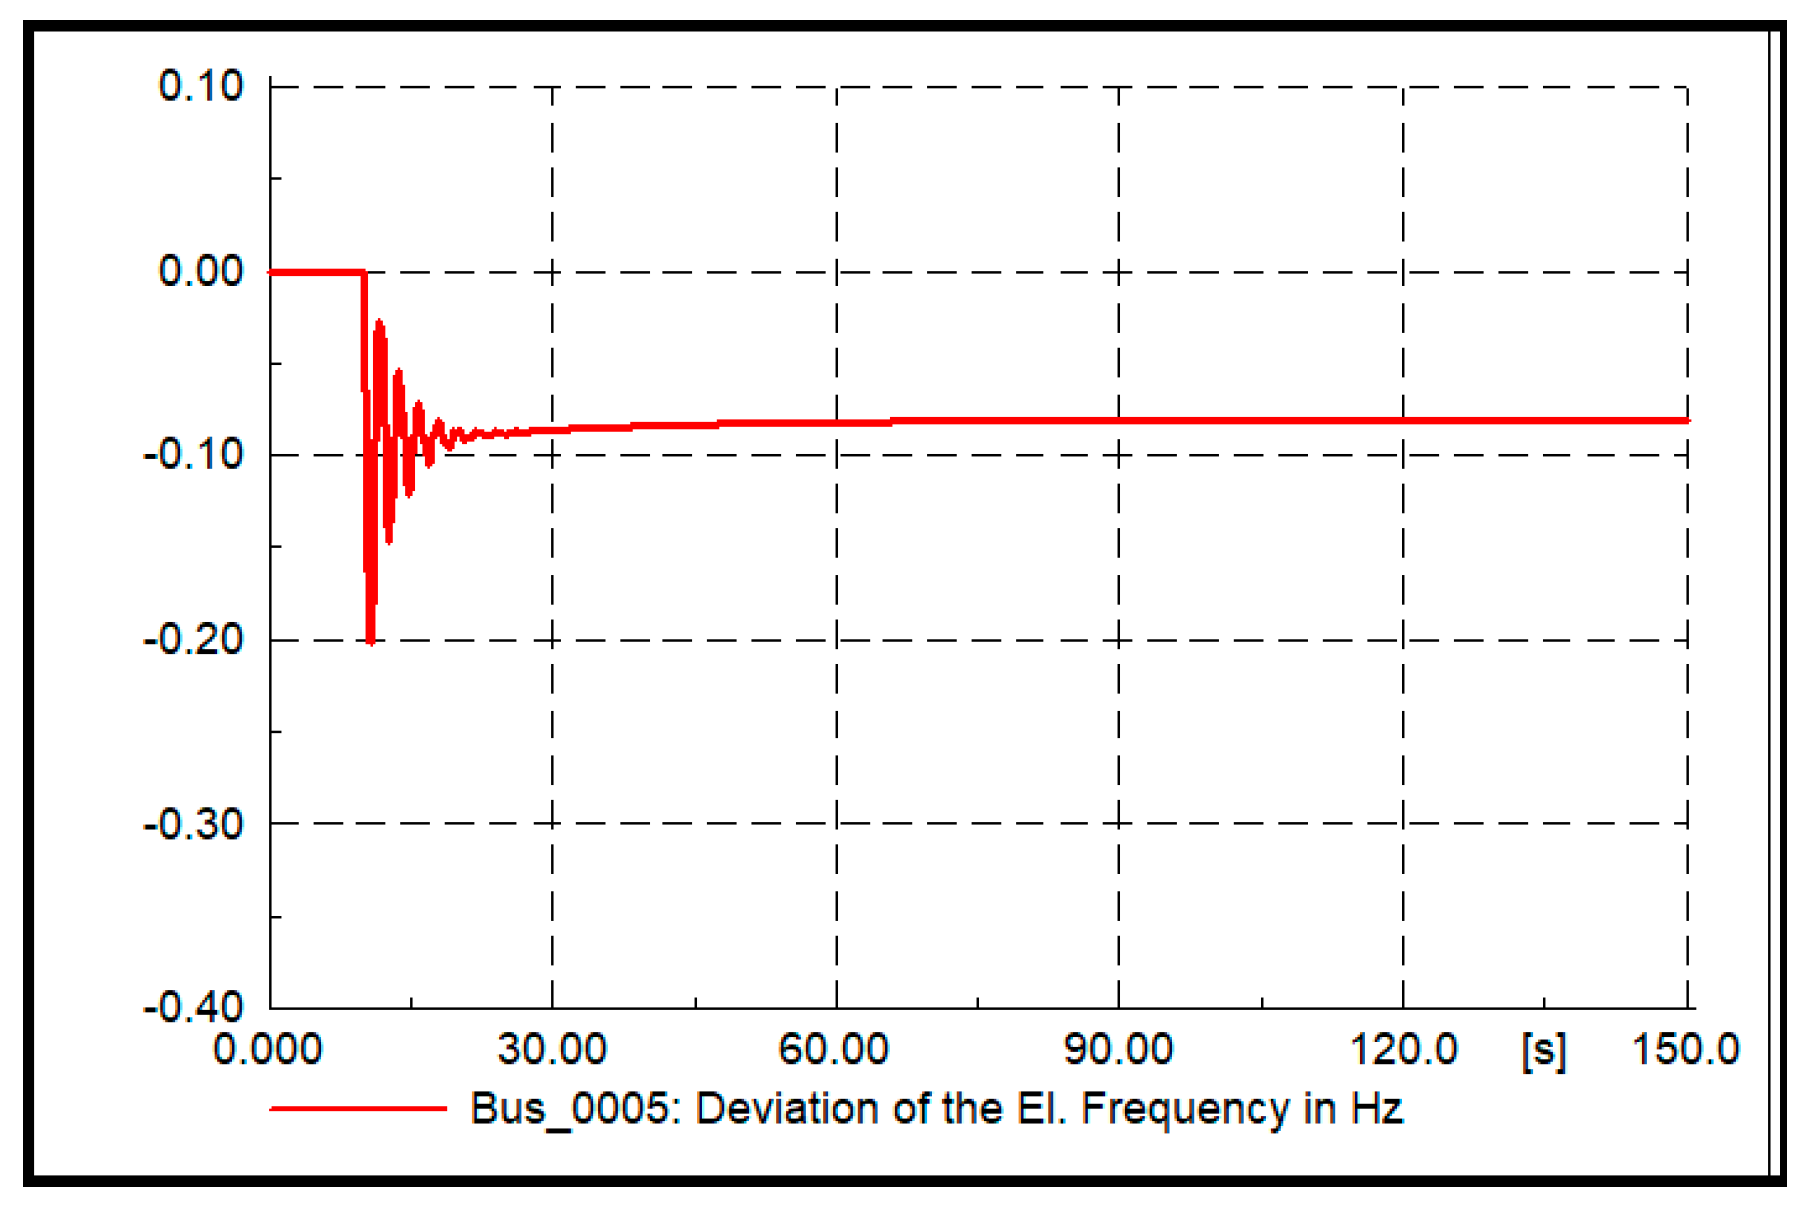
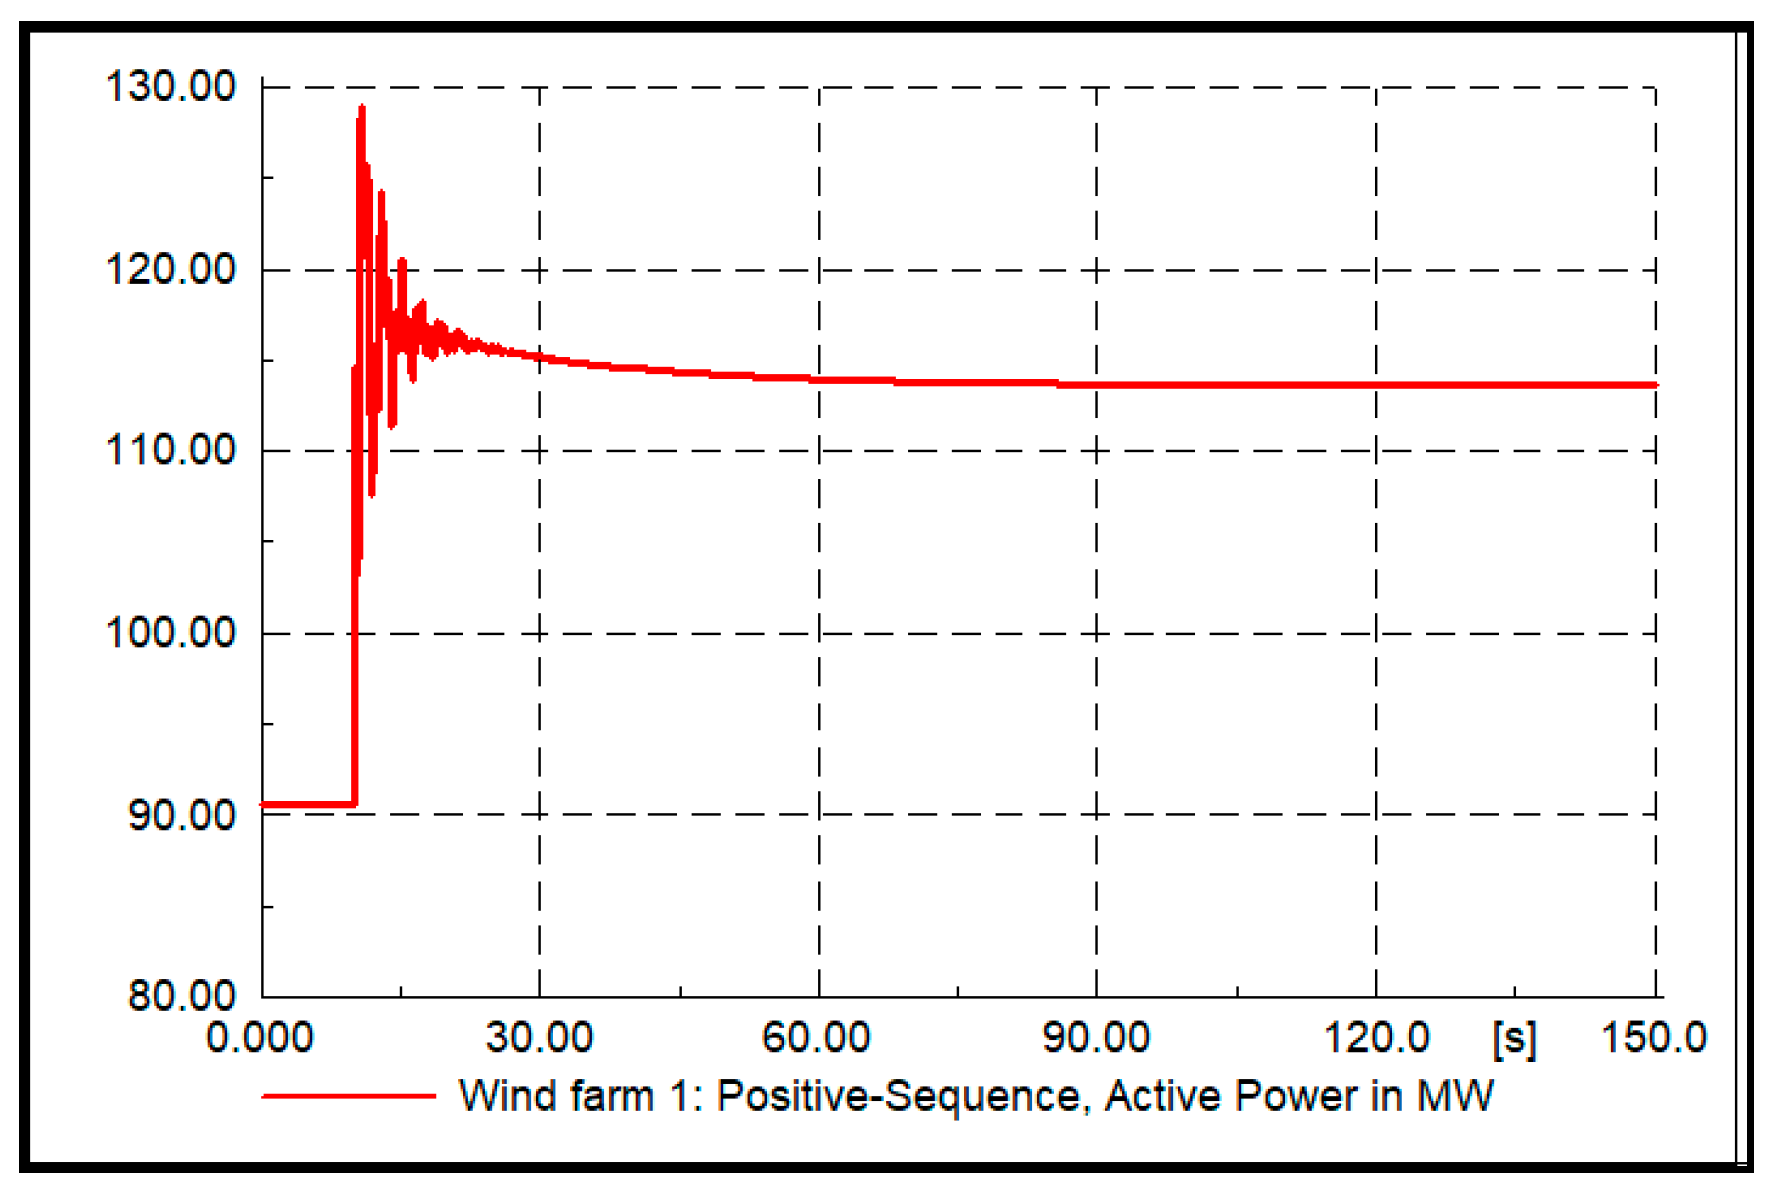
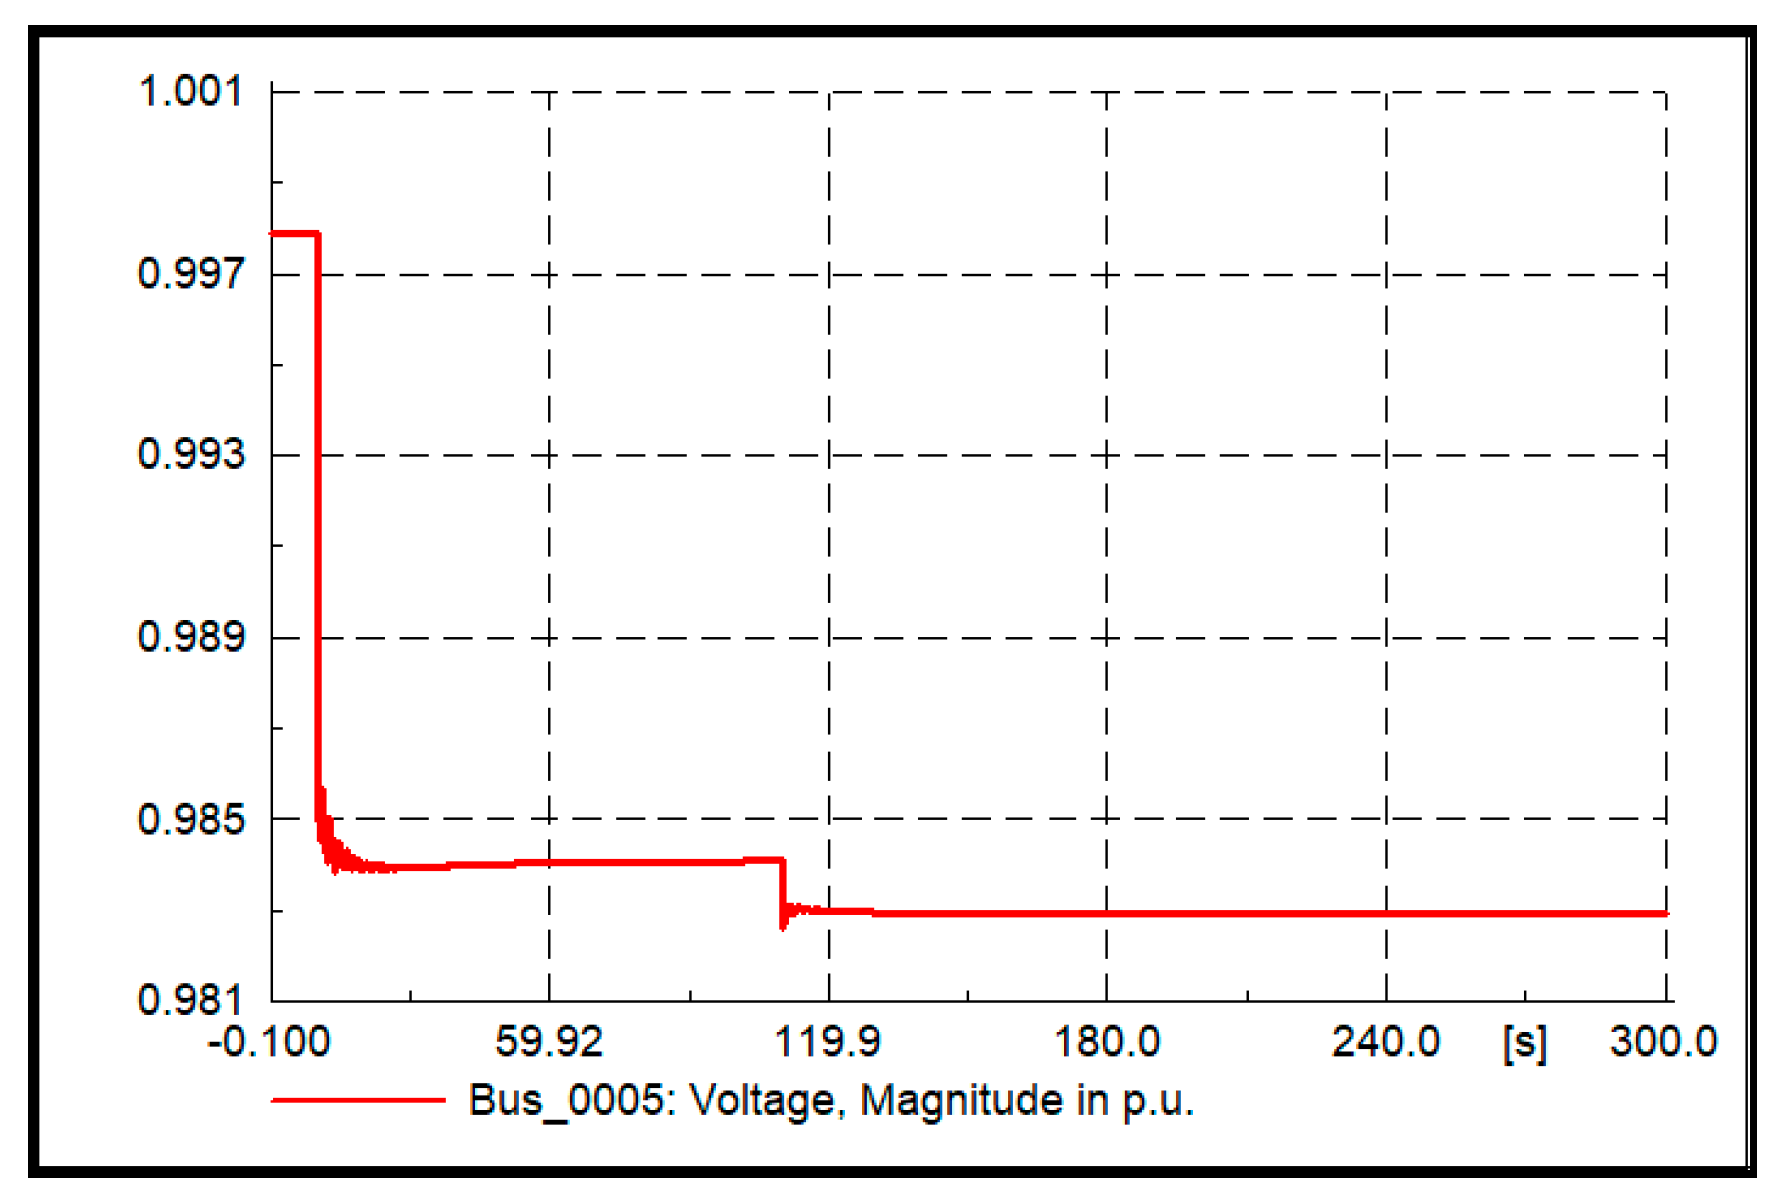
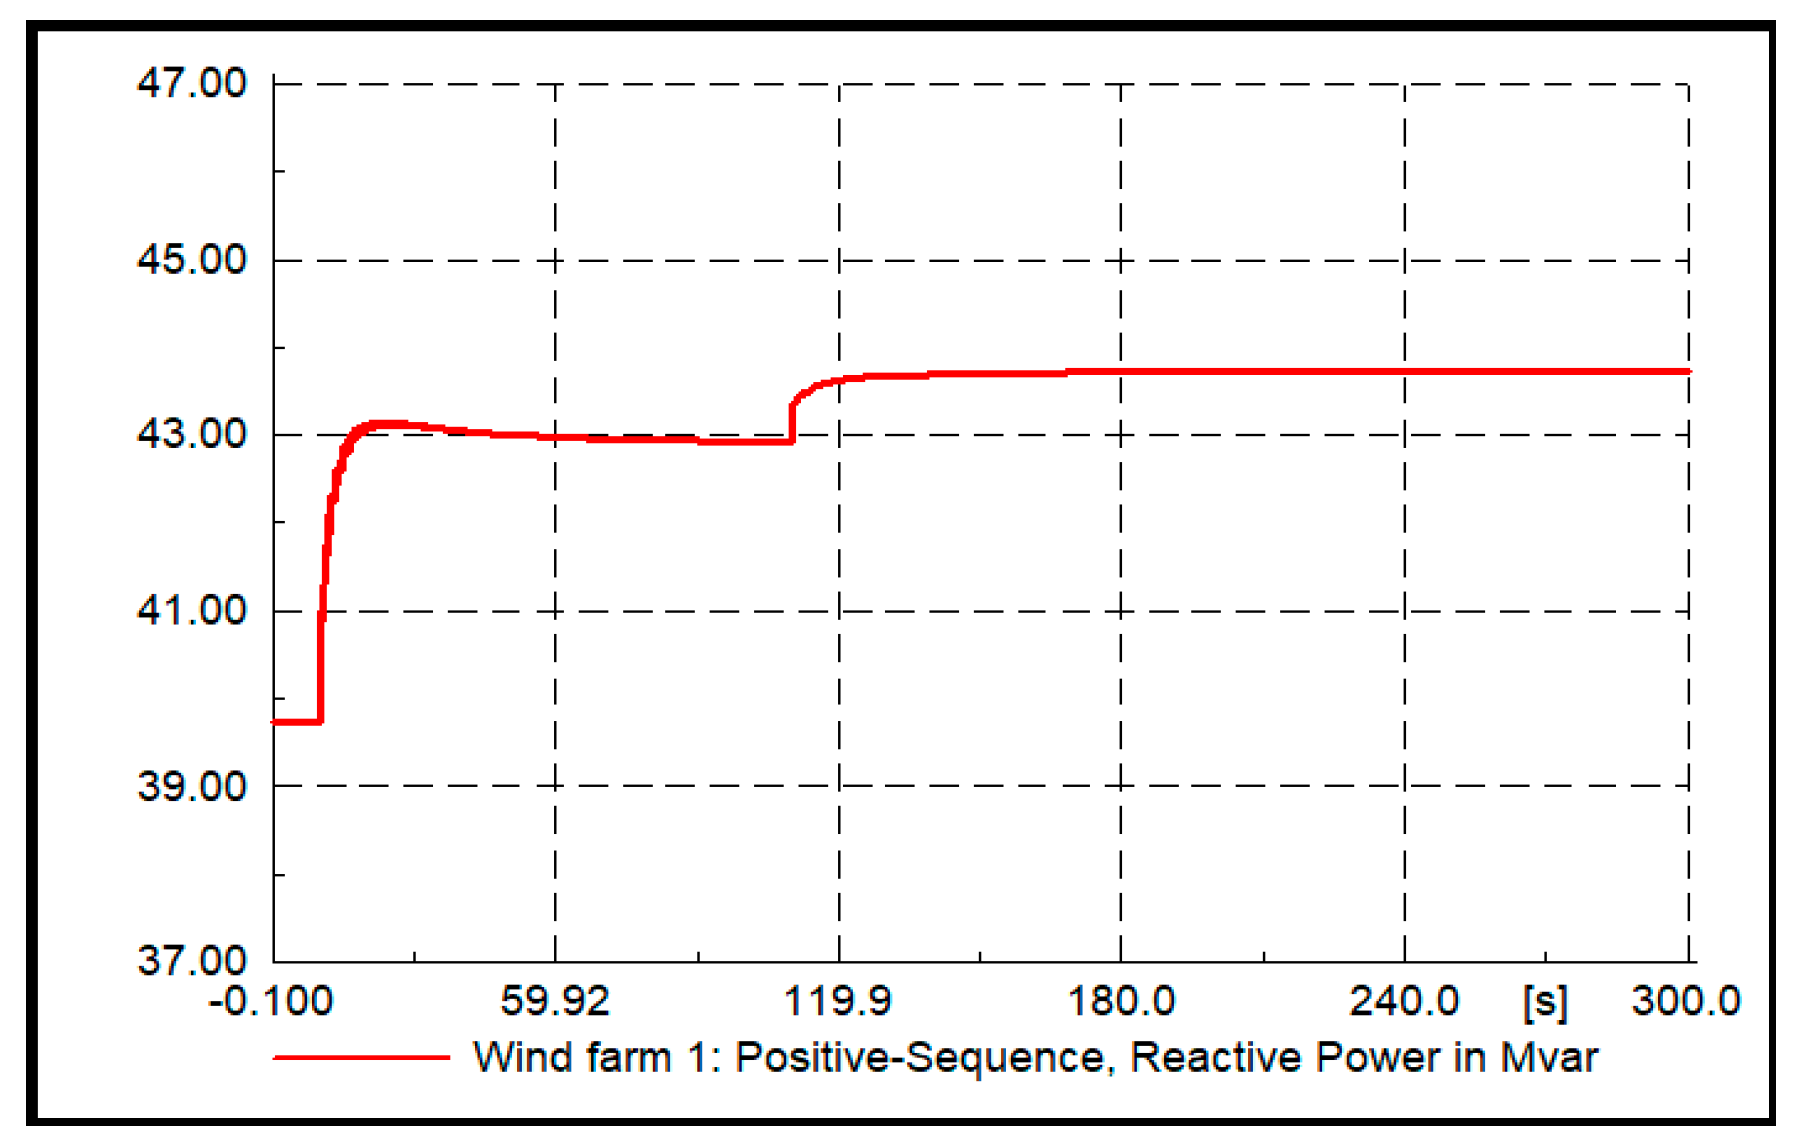
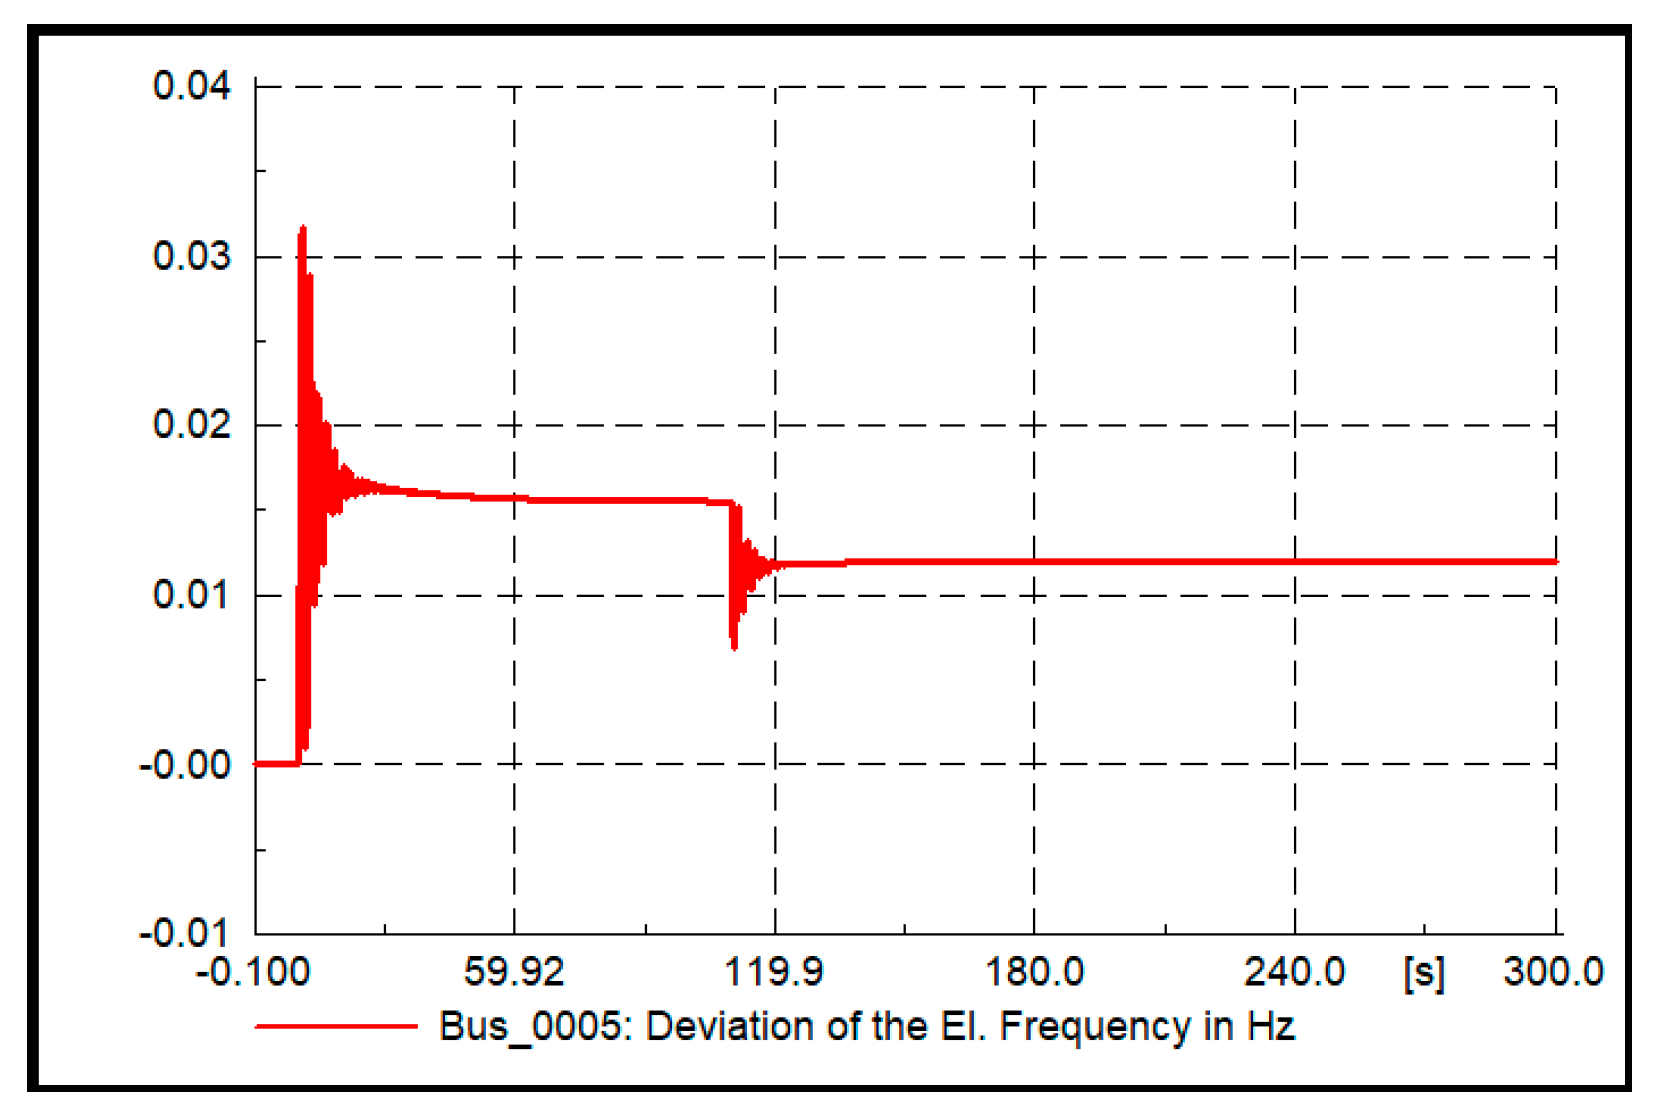
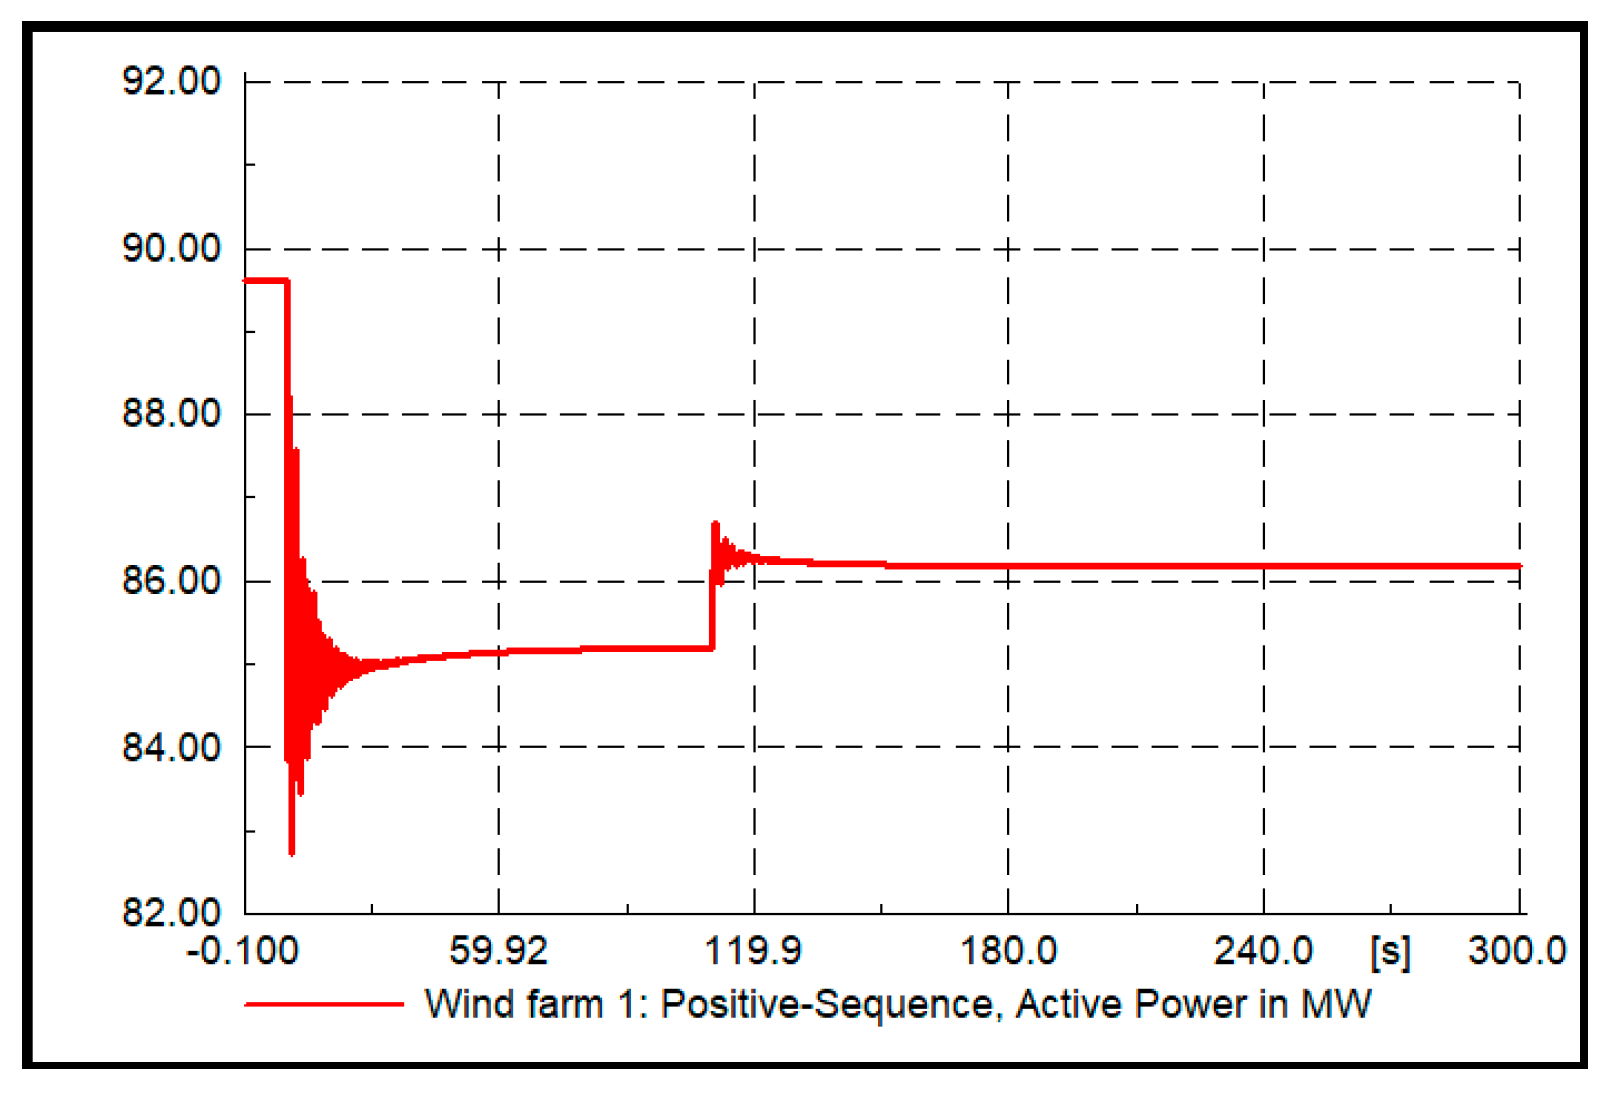
Now, a short-circuit for 120 ms occurs on line 1–2 followed by line outage, in addition the load at bus 5 increases by 25% after 110 s. Optimal power flow calculations were performed at these events to achieve minimum power losses and the results are listed in Table 3. The secondary PID controller parameters are found to be KP = 1.7, KI = 0.93, and KD = 0.075, and the control signal is directed to the wind farm installed at bus 1 to apply reactive power control to achieve the optimal voltage value at the pilot bus. Figure 15 shows the pilot bus voltage response, while Figure 16 shows the reactive power generated from the wind farm. Figure 17 shows system frequency deviation and Figure 18 shows the active power response of the wind farm; noting that the real power of PV park will be constant as the frequency deviation is within the dead band. The reactive current of the PV park during the short circuit remains constant, because the voltage of PCC did not reach below 0.9 pu in this case.
9.5. Comparison of Power Losses and Voltage Index
Table 4 shows a comparison of system performances using proposed SecVC, droop SecVC and without SecVC in terms of total power losses and voltage deviation index (VDI) as illustrated in (16) [30]. The results show that the system proposed SecVC has better performance in terms of lower active losses and lower voltage deviation index through controlling the reactive power.
where is the number of load buses in the power system, which is equal to nine buses in the studied 100% renewable system, is the nominal voltage of the load bus, and is the actual load bus voltage.
10. Conclusions
The paper has investigated the application of coordinated secondary voltage control to power system contingencies in a smart grid with 100% renewable generations in order to avoid voltage violations. Controls of active and reactive powers are considered based on grid codes of countries with high penetration level of renewable energy sources. The results have shown that the wind and solar renewable systems can support voltage by controlling the reactive power through inverters and the dc links. The proposed technique also led the system to reach better voltage profile and less total power losses than droop control. The paper also proved that the wind farm can contribute to primary frequency control using droop control. The coordinated PID controller optimal parameters change at each operating condition due to the change of the network configuration. Neural network is used to select the optimal parameters of the controller at each case. The PMUs are essential in the proposed work in order to provide real time voltage measurements to be used as inputs to the neural network. The paper has also investigated the pilot bus selection by two different methods; namely, sensitivity and short-circuit analyses.
Author Contributions
Conceptualization, H.H.F. and O.H.A.; methodology, H.H.F., A.M.A.G. and O.H.A.; software, H.H.F.; validation, H.H.F. and O.H.A.; formal analysis, H.H.F. and O.H.A.; investigation, H.H.F. and O.H.A.; resources, H.H.F. and O.H.A.; data curation, H.H.F. and O.H.A.; writing—original draft preparation, H.H.F. and O.H.A.; writing—review and editing, H.H.F. and O.H.A.; visualization, H.H.F., A.M.A.G. and O.H.A.; supervision, A.M.A.G. and O.H.A. All authors have read and agreed to the published version of the manuscript.
Funding
This research received no external funding and the APC was waived.
Conflicts of Interest
The authors declare no conflict of interest.
Nomenclature
| B | Charge in P.U. |
| Output frequency | |
| Desired frequency | |
| Voltage regulator integrator gain | |
| Reactive power integrator gain | |
| KP | Proportional gain constant |
| KI | Integral gain constant |
| KD | Derivative gain constant |
| Frequency droop gain | |
| Generated active power | |
| Maximum generated power | |
| Minimum generated power | |
| PD | Demand active power |
| Line power loading | |
| Maximum line power loading | |
| QG | Generated reactive power |
| QGmax | Maximum reactive power limit |
| QGmin | Minimum reactive power limit |
| QD | Demand reactive power |
| R | Resistance in P.U. |
| S | Apparent power |
| X | Reactance in P.U. |
| Vb | Bus voltage in P.U. |
| VP | Pilot bus actual voltage |
| Vpref | Pilot bus reference voltage |
| VMax | Maximum valve position |
| VMin | Minimum valve position |
| id, iq | d and q axis currents |
| q | Secondary voltage control signal (action). |
| vd, vq | d and q axis voltages |
| ΔVP | Error in pilot bus voltage |
| Abbreviations | |
| AVR | Automatic voltage regulator |
| DFIG | Doubly fed induction wind generator |
| GA | Genetic algorithm |
| PID | Proportional integral derivative controller |
| PriVC | Primary voltage control |
| PMU | Phasor measurement unit |
| PV | Photovoltaic |
| PWM | Pulse width modulation |
| SCADA | Supervisory control and data acquisition |
| SecVC | Secondary voltage control |
| TerVC | Tertiary voltage control |
| VAR | Volt-ampere reactive (unit of reactive power). |
| WAMS | Wide area measurement system |
| WF | Wind farm |
Appendix A
Loads data of the applied 100% renewable energy system are listed in Table A1 and lines data are listed in Table A2.

Table A1.
100% Renewable 14 Bus System Load Data.
| Bus | PD | QD | Bus | PD | QD |
|---|---|---|---|---|---|
| 1 | 0 | 0 | 8 | 0 | 0 |
| 2 | 21.7 | 12.7 | 9 | 29.5 | 16.6 |
| 3 | 94.2 | 19 | 10 | 9 | 5.8 |
| 4 | 47.8 | −3.9 | 11 | 3.5 | 1.8 |
| 5 | 7.6 | 1.6 | 12 | 6.1 | 1.6 |
| 6 | 11.2 | 7.5 | 13 | 13.5 | 5.8 |
| 7 | 0 | 0 | 14 | 14.9 | 5 |
Table A2.
100% Renewable 14 Bus System Line Data.
| Line | From Bus | To Bus | R | X | B |
|---|---|---|---|---|---|
| 1 | 1 | 2 | 0.01938 | 0.05917 | 0.0264 |
| 2 | 2 | 3 | 0.04699 | 0.19797 | 0.0219 |
| 3 | 2 | 4 | 0.05811 | 0.17632 | 0.0187 |
| 4 | 1 | 5 | 0.05403 | 0.22304 | 0.0246 |
| 5 | 2 | 5 | 0.05695 | 0.17388 | 0.017 |
| 6 | 3 | 4 | 0.06701 | 0.17103 | 0.0173 |
| 7 | 4 | 5 | 0.01335 | 0.04211 | 0.0064 |
| 8 | 5 | 6 | 0 | 0.25202 | 0 |
| 9 | 4 | 7 | 0 | 0.20912 | 0 |
| 10 | 7 | 8 | 0 | 0.17615 | 0 |
| 11 | 4 | 9 | 0 | 0.55618 | 0 |
| 12 | 7 | 9 | 0 | 0.11001 | 0 |
| 13 | 9 | 10 | 0.03181 | 0.0845 | 0 |
| 14 | 6 | 11 | 0.09498 | 0.1989 | 0 |
| 15 | 6 | 12 | 0.12291 | 0.25581 | 0 |
| 16 | 6 | 13 | 0.06615 | 0.13027 | 0 |
| 17 | 9 | 14 | 0.12711 | 0.27038 | 0 |
| 18 | 10 | 11 | 0.08205 | 0.19207 | 0 |
| 19 | 12 | 13 | 0.22092 | 0.19988 | 0 |
| 20 | 13 | 14 | 0.17093 | 0.34802 | 0 |
References
- Bose, B.K. Power Electronics, Smart Grid, and Renewable Energy Systems. Proc. IEEE 2017, 105, 2011–2018. [Google Scholar] [CrossRef]
- Bose, B.K. Artificial Intelligence Techniques in Smart Grid and Renewable Energy Systems—Some Example Applications. Proc. IEEE 2017, 105, 2262–2273. [Google Scholar] [CrossRef]
- Bhalshankar, S.S.; Thorat, C.S. Integration of smart grid with renewable energy for energy demand management: Puducherry case study. In Proceedings of the 2016 International Conference on Signal Processing, Communication, Power and Embedded System (SCOPES), Paralakhemundi, India, 3–5 October 2016; pp. 1–5. [Google Scholar]
- Alam, M.J.E.; Muttaqi, K.M.; Sutanto, D. A Multi-Mode Control Strategy for VAr Support by Solar PV Inverters in Distribution Networks. IEEE Trans. Power Syst. 2014, 30, 1316–1326. [Google Scholar] [CrossRef]
- Golsorkhi, M.S.; Shafiee, Q.; Lu, D.D.C.; Guerrero, J.M.; Esfahani, M.S.G. A Distributed Control Framework for Integrated Photovoltaic-Battery-Based Islanded Microgrids. IEEE Trans. Smart Grid 2016, 8, 2837–2848. [Google Scholar] [CrossRef]
- Hu, B.; Canizares, C.A.; Liu, M. Secondary and Tertiary Voltage Regulation based on optimal power flows. In Proceedings of the 2010 IREP Symposium Bulk Power System Dynamics and Control—VIII (IREP), Rio de Janeiro, Brazil, 1–6 August 2016. [Google Scholar]
- Alvarez, S.R.; Mazo, E.H.L.; Oviedo, J.E. Evaluation of power system partitioning methods for secondary voltage regulation application. In Proceedings of the 2017 IEEE 3rd Colombian Conference on Automatic Control (CCAC), Cartagena, Colombia, 18–20 October 2017; pp. 1–6. [Google Scholar]
- Corsi, S. Closure of “The Coordinated Automatic Voltage Control of the Italian Transmission Grid—Part I: Reasons of the Choice and Overview of the Consolidated Hierarchical System”. IEEE Trans. Power Syst. 2006, 21, 445–446. [Google Scholar] [CrossRef]
- Martins, N. The new cigre task force on coordinated voltage control in transmission networks. In Proceedings of the 2000 Power Engineering Society Summer Meeting (Cat. No.00CH37134), Seattle, WA, USA, 16–20 July 2002. [Google Scholar] [CrossRef]
- Su, H.-Y.; Liu, C.-W. An Adaptive PMU-Based Secondary Voltage Control Scheme. IEEE Trans. Smart Grid 2013, 4, 1514–1522. [Google Scholar] [CrossRef]
- Abdalla, O.H.; Ghany, A.A.; Fayek, H.H. Coordinated PID secondary voltage control of a power system based on genetic algorithm. In Proceedings of the 2016 Eighteenth International Middle East Power Systems Conference (MEPCON), Cairo, Egypt, 27–29 December 2016; pp. 214–219. [Google Scholar]
- Bose, A. Smart Transmission Grid Applications and Their Supporting Infrastructure. IEEE Trans. Smart Grid 2010, 1, 11–19. [Google Scholar] [CrossRef]
- Li, J.; Liu, F.; Li, Z.; Mei, S.; He, G. Impacts and benefits of UPFC to wind power integration in unit commitment. Renew. Energy 2018, 116, 570–583. [Google Scholar] [CrossRef] [Green Version]
- Kumar, M.; Nallagownden, P.; Elamvazuthi, I. Optimal Placement and Sizing of Renewable Distributed Generations and Capacitor Banks into Radial Distribution Systems. Energies 2017, 10, 811. [Google Scholar] [CrossRef] [Green Version]
- Romero, M.E.; Seron, M. Ultimate Boundedness of Voltage Droop Control with Distributed Secondary Control Loops. IEEE Trans. Smart Grid 2018, 10, 4107–4115. [Google Scholar] [CrossRef]
- Lai, J.; Lu, X.; Monti, A. Distributed secondary voltage control for autonomous microgrids under additive measurement noises and time delays. IET Gener. Transm. Distrib. 2019, 13, 2976–2985. [Google Scholar] [CrossRef]
- Gas and Power UK. Available online: https://gulfgasandpower.uk/blog/top-renewable-energy-generating-countries-in-the-world (accessed on 20 June 2020).
- Kroposki, B.; Johnson, B.; Zhang, Y.; Gevorgian, V.; Denholm, P.; Hodge, B.-M.; Hannegan, B. Achieving a 100% Renewable Grid: Operating Electric Power Systems with Extremely High Levels of Variable Renewable Energy. IEEE Power Energy Mag. 2017, 15, 61–73. [Google Scholar] [CrossRef]
- Blaabjerg, F.; Yang, Y.; Yang, D.; Wang, X. Distributed Power-Generation Systems and Protection. Proc. IEEE 2017, 105, 1311–1331. [Google Scholar] [CrossRef] [Green Version]
- Denholm, P.; Margolis, R. Energy Storage Requirements for Achieving 50% Solar Photovoltaic Energy Penetration in California; National Renewable Energy Lab.: Golden, CO, USA, 2016.
- REN21. Functional requirements in the power system (translated title, in Norwegian: Funksjonskravi kraftsystemet (FIKS)). In Renewable Energy Policy Network for the 21st Century Annual Report 2017; REN21: Paris, France, 2017. [Google Scholar]
- Standardization Administration of the People’s Republic of China. Technical Requirements for Connecting Photovoltaic Power Station to Power Systems; GB/T 19964-2012; Standardization Administration of the People’s Republic of China: Beijing, China, 2012. [Google Scholar]
- Zheng, Q.; Li, J.; Ai, X.; Wen, J.; Fang, J. Overview of grid codes for photovoltaic integration. In Proceedings of the 2017 IEEE Conference on Energy Internet and Energy System Integration (EI2), Beijing, China, 26–28 November 2017; pp. 1–6. [Google Scholar]
- Abdalla, O.H. Technical requirements for connecting medium and large solar power plants to electricity networks in Egypt. J. Egypt. Soc. Eng. 2018, 57, 25–36. [Google Scholar]
- Lou, G.; Gu, W.; Xu, Y.; Cheng, M.; Liu, W. Distributed MPC-Based Secondary Voltage Control Scheme for Autonomous Droop-Controlled Microgrids. IEEE Trans. Sustain. Energy 2017, 8, 792–804. [Google Scholar] [CrossRef]
- Mahari, A.; Seyedi, H. Optimal PMU placement for power system observability using BICA, considering measurement redundancy. Electr. Power Syst. Res. 2013, 103, 78–85. [Google Scholar] [CrossRef]
- Shrivastava, D.R.; Siddiqui, S.; Verma, K. Optimal PMU placement for coordinated observability of power system under contingencies. In Proceedings of the 2017 IEEE International Conference on Circuits and Systems (ICCS), Thiruvananthapuram, India, 20–21 December 2017; pp. 334–339. [Google Scholar]
- Chakrabarti, S.; Kyriakides, E.; Eliades, D.G. Placement of Synchronized Measurements for Power System Observability. IEEE Trans. Power Deliv. 2008, 24, 12–19. [Google Scholar] [CrossRef] [Green Version]
- Dracopoulos, D.C. Genetic Algorithms and Genetic Programming for Control. In Evolutionary Algorithms in Engineering Applications; Dasgupta, D., Michalewicz, Z., Eds.; Springer Science and Business Media LLC: Berlin, Germany, 1997; pp. 329–343. [Google Scholar]
- Abdalla, O.H.; Al-Badwawi, R.; Al-Hadi, H.S.; Al-Riyami, H.A.; Al-Nadabi, A. Steady-State and Dynamic Performance of Oman Transmission System with Diesel-Engine Driven Distributed Generation. In Proceedings of the 46th International Universities Power Engineering Conference (UPEC 2011), Soest, Germany, 5–8 September 2011. [Google Scholar]
Figure 1.
Bus system with 100% renewables.

Figure 2.
Wind energy generation system (Type 3) [18].
Figure 2.
Wind energy generation system (Type 3) [18].

Figure 3.
P-Q capability chart for renewable power plants [21].
Figure 3.
P-Q capability chart for renewable power plants [21].

Figure 4.
Grid tied PV system [18].
Figure 4.
Grid tied PV system [18].

Figure 5.
Inverter control blocks [25].
Figure 5.
Inverter control blocks [25].

Figure 6.
Voltage control strategy in 100% renewable grid.

Figure 7.
Renewable power plant SecVC scheme.

Figure 8.
Flow chart of proposed voltage control strategy during design stage (left) and operation stage (right).
Figure 8.
Flow chart of proposed voltage control strategy during design stage (left) and operation stage (right).

Figure 9.
Neural network used in SecVC.

Figure 10.
Bus 5 voltage in contingency 1.

Figure 11.
Reactive power of the first block of wind farm at bus 1 in contingency 1.

Figure 12.
PV Park at bus-2 reactive power in contingency 1.

Figure 13.
System frequency deviation in contingency 1.

Figure 14.
Active power of the first block of wind farm at bus 1 in contingency 1.

Figure 15.
Bus 5 Voltage in contingency 2.

Figure 16.
Wind farm reactive power in contingency 2.

Figure 17.
System frequency deviation in contingency 2.

Figure 18.
Wind farm active power in contingency 2.

Table 1.
Generation systems in the 100% Renewable 14 bus system.
| Power Station Type | Location Bus No. | Installed Capacity |
|---|---|---|
| DFIG wind farm | 1 | 190 MW |
| Photovoltaic park | 2 | 95 MW |
| Photovoltaic park | 6 | 40 MW |
| Photovoltaic park | 3 | 150 MW |
| Hydro power plant | 8 | 140 MW |
Table 2.
Buses Sensitivity |∂V/∂Q| and Maximum Short Circuit Current.
| Bus No. | Bus Type | |∂V/∂Q| PU/MVAR | Short Circuit Current in PU |
|---|---|---|---|
| 1 | Generator | 0 | 34.9 |
| 2 | Generator | 0 | 20.99 |
| 3 | Generator | 0 | 11.93 |
| 4 | Load | 0.001286 | 14.81 |
| 5 | Load | 0.001967 | 15.19 |
| 6 | Generator | 0 | 10.78 |
| 7 | Load | 0.000939 | 8.64 |
| 8 | Generator | 0 | 8.43 |
| 9 | Load | 0.001322 | 7.30 |
| 10 | Load | 0.001518 | 5.74 |
| 11 | Load | 0.001944 | 5.35 |
| 12 | Load | 0.001059 | 4.37 |
| 13 | Load | 0.001837 | 6.06 |
| 14 | Load | 0.001571 | 3.98 |
Table 3.
Optimal Power Flow Result in Normal Operation Conditions.
| Bus No. | Normal Operation | Contingency 1 | Contingency 2 | |||
|---|---|---|---|---|---|---|
| |V| PU | Qg MVAR | |V| PU | Qg MVAR | |V| PU | Qg MVAR | |
| 1 | 1.05 | 39.83 | 1.05 | 44.2 | 1.05 | 43.82 |
| 2 | 1.02 | −5.21 | 1.02 | −5.20 | 1.01 | −5.15 |
| 3 | 0.99 | 15.50 | 0.99 | 15.50 | 0.97 | 15.50 |
| 4 | 1.00 | 0.00 | 1.00 | 0.00 | 0.98 | 0.00 |
| 5 | 1.00 | 0.00 | 0.99 | 0.00 | 0.98 | 0.00 |
| 6 | 1.00 | −9.91 | 1.00 | −9.60 | 1.00 | −4.40 |
| 7 | 1.02 | 0.00 | 1.02 | 0.00 | 1.01 | 0.00 |
| 8 | 1.05 | 19.58 | 1.05 | 21.55 | 1.05 | 20.62 |
| 9 | 1.02 | 0.00 | 1.02 | 0.00 | 1.01 | 0.00 |
| 10 | 1.01 | 0.00 | 1.01 | 0.00 | 1.00 | 0.00 |
| 11 | 1.00 | 0.00 | 1.00 | 0.00 | 1.00 | 0.00 |
| 12 | 0.99 | 0.00 | 0.99 | 0.00 | 0.99 | 0.00 |
| 13 | 0.98 | 0.00 | 0.98 | 0.00 | 0.98 | 0.00 |
| 14 | 0.98 | 0.00 | 0.98 | 0.00 | 0.98 | 0.00 |
Table 4.
Comparison Between System Performance Using Proposed, Droop and Without SecVC.
| Contingency No. | Losses in MW | Voltage Index | ||||
|---|---|---|---|---|---|---|
| Proposed SecVC | Droop SecVC | Without SecVC | Proposed SecVC | Droop SecVC | Without SecVC | |
| 1 | 8.4 | 10.1 | 11.2 | 0.024 | 0.051 | 0.087 |
| 2 | 7.9 | 8.3 | 9.0 | 0.019 | 0.037 | 0.066 |
© 2020 by the authors. Licensee MDPI, Basel, Switzerland. This article is an open access article distributed under the terms and conditions of the Creative Commons Attribution (CC BY) license (http://creativecommons.org/licenses/by/4.0/).
Share and Cite
MDPI and ACS Style
Abdalla, O.H.; Fayek, H.H.; Abdel Ghany, A.M. Secondary Voltage Control Application in a Smart Grid with 100% Renewables. Inventions 2020, 5, 37. https://0-doi-org.brum.beds.ac.uk/10.3390/inventions5030037
AMA Style
Abdalla OH, Fayek HH, Abdel Ghany AM. Secondary Voltage Control Application in a Smart Grid with 100% Renewables. Inventions. 2020; 5(3):37. https://0-doi-org.brum.beds.ac.uk/10.3390/inventions5030037
Chicago/Turabian StyleAbdalla, Omar H., Hady H. Fayek, and A. M. Abdel Ghany. 2020. "Secondary Voltage Control Application in a Smart Grid with 100% Renewables" Inventions 5, no. 3: 37. https://0-doi-org.brum.beds.ac.uk/10.3390/inventions5030037