
Fused Graphical Lasso Recovers Flowering Time Mutation Genes in Arabidopsis thaliana


1
Department of Electrical and Computer Engineering, Texas A&M University, 188 Bizzell St., College Station, TX 77843, USA
2
Department of Soil and Crop Sciences, Texas A&M University, 370 Olsen Blvd., College Station, TX 77843, USA
*
Author to whom correspondence should be addressed.
Inventions 2021, 6(3), 52; https://0-doi-org.brum.beds.ac.uk/10.3390/inventions6030052
Submission received: 15 April 2021
/
Revised: 12 July 2021
/
Accepted: 14 July 2021
/
Published: 20 July 2021
(This article belongs to the Special Issue Robotics and Automation in Agriculture)
Abstract
:Conventional breeding approaches that focus on yield under highly favorable nutrient conditions have resulted in reduced genetic and trait diversity in crops. Under the growing threat from climate change, the mining of novel genes in more resilient varieties can help dramatically improve trait improvement efforts. In this work, we propose the use of the joint graphical lasso for discovering genes responsible for desired phenotypic traits. We prove its efficiency by using gene expression data for wild type and delayed flowering mutants for the model plant. Arabidopsis thaliana shows that it recovers the mutation causing genes LNK1 and LNK2. Some novel interactions of these genes were also predicted. Observing the network level changes between two phenotypes can also help develop meaningful biological hypotheses regarding the novel functions of these genes. Now that this data analysis strategy has been validated in a model plant, it can be extended to crop plants to help identify the key genes for beneficial traits for crop improvement.
1. Introduction
The changing world climate continues to threaten our ability to keep global food production in line with the growing population [1]. The manifestation of climate change in terms of extreme temperatures, altered rainfall patterns and changing geographical distribution of pests and pathogens will render it difficult to maintain crop yield and quality [1,2,3,4]. The recent 2021 winter storm in Texas caused at least USD 230 million losses to citrus crops and USD 150 million losses to vegetable crops in the state, according to an estimate by Texas A&M Agrilife Extension Service [5]. In addition, latest climate models predict that, for the remainder of the 21st century, the state will face dry conditions comparable to or even exceeding the driest centuries of the last 1000 years [6]. The decreasing water supply against rapidly an increasing state population will pose a major challenge to the agricultural industry.
In the last few centuries, plant breeders successfully used crossing and selection to improve the agronomic character of cultivated crops, such as wheat, maize, rice, barley and others, resulting in dramatic increases in food production [7]. However, this selective breeding among relatively few high yield varieties has resulted in a significant reduction in genetic diversity and trait diversity in major crops [7,8], contributing to the loss of certain genes that are responsible for efficiency or adaptation to stress(es) [8,9]. During the course of evolution, nature has evolved new genes and shuffled and selected these genes in a wide range of environments to produce the diversity evidenced in wild species [8]. In order to enhance the rate of genetic gain [10] and to develop climate resilient varieties, it is important to identify these genes in crop wild relatives (CWR) and carry out their controlled incorporation into novel germplasm [8]. With the recent technological innovations including the development of rapid and cheap sequencing technologies, genomics-assisted breeding is considered to have the greatest potential for overcoming these challenges [2,7]. The discovery of these genes can now be paired with genome editing techniques such as CRISPR/Cas9 to rapidly develop climate change resilient crops, including plants with better biotic and abiotic stress tolerance and enhanced nutritional value [7]. For developing varieties with high yield under changing climate conditions, the following traits have been suggested by biologists for further investigation [11]: (a) increased root/shoot ratio, (b) vernalization periods, (c) maturity, (d) regulation of node formation/internode distance, (e) harvest index variations and (f) allelopathy. This work focuses on the vernalization or flowering related pathways, which are sensitive to temperature, water and photoperiod changes [12,13,14].
Flowering in Plants
Plants control the transition to flowering such that seed production takes place under optimal conditions [15]. By perceiving and processing different environmental and internal signals, the plant makes a binary decision to flower or not to flower [16]. For example, experiments in perilla (mint) and tobacco [17,18] showed that once the leaves detect an increase in day length, which is a cue for the onset of spring and summer, they transmit a signal to the shoot apex to initiate flowering. The decision to flower also depends on favorable internal signals such as plant age and stage of development. Experiments with maize plants suggest that the meristem commits to form flowers only in the presence of at least four to six leaves [18,19]. Similarly, the leaves of the impatiens send a continuous inductive signal to keep the plant from reverting back to vegetative stage [16,20].
Arabidopsis is a preferred model plant for understanding the intricate and complex relationships between different gene pathways contributing to flowering time control [21]. It is one of the most well studied plant species with a vast amount of data available for verification of predicted gene interactions. Additionally, many of the flowering related responses are found to be phylogenetically well conserved among different plant species. Even with rapid growth in plant genomics over the last few decades, the exact functions of most genes remain unknown, even in model plant species [8].
We use circadian RNAseq data from two Arabidopsis thaliana phenotypes: The wild type and delayed flowering time lnk1/lnk2 mutant from [22]. Night light-inducible and clock regulated genes (LNK) control daily and seasonal rhythmic patterns in Arabidopsis by linking photoreceptor genes to the plant endogenous circadian clock. Unlike most light responsive genes, which respond most strongly to light during the subjective day, LNK genes were identified by their strong response to light in the middle of the night. While genes responding strongly to a light pulse in the middle of the day are expected to be involved in maximizing processes such as photosynthesis, those responding strongly to a pulse in the middle of the night are expected to be involved in sensing day break and tracking day length [22]. Further gene knockout experiments in that study confirmed that the lnk1/lnk2 mutant has delayed flowering time under long day conditions [22]. In this paper, we prove the efficacy of fused graphical lasso data analysis approach in identifying LNK1/2 genes as causal genes for substantial flowering phenology (the seasonal timing of reproduction and other life history events) changes using the publicly available gene expression data collected in that study. We also predict novel interactions of these genes and network level changes in wild type and mutant subnetworks for developing meaningful biological hypotheses.
2. Materials and Methods
2.1. Dataset
The interactions between light and the circadian clock are responsible for the control of several biological activities in plants including flowering time and seedling photomorphogenesis [23,24,25,26]. We use the previously published circadian time series gene expression data from wild type (WT) and light genes lnk1/lnk2 mutant Arabidopsis phenotypes [22]. We test the efficacy of a fused graphical lasso in learning network level changes and identify the trait related genes LNK1 and LNK2 responsible for differences between the two phenotypes.
RNAseq data from the NCBI SRA project SRP018266 (https://0-www-ncbi-nlm-nih-gov.brum.beds.ac.uk/bioproject/PRJNA188075, accessed on 18 July 2020) deposited by authors in [22] were used for this analysis. The dataset contains RNA sequencing data for both wild-type (WT) and lnk1/lnk2 mutants grown under long day conditions (16 h light/8 h darkness), where the samples had been harvested every 4 h over a 24 h period beginning 2 h after the onset of the light period. The mapped and processed raw gene counts were obtained using RNAseq-er API [27] from the European Bioinformatics Institute (https://www.ebi.ac.uk/fg/rnaseq/api/tsv/90/getRunsByStudy/SRP018266 accessed on 18 July 2020). The sample annotation file was constructed using sample information from the NCBI SRA database.
2.2. Sample Selection Based on Phenotypic Observations
During germination of the Arabidopsis seed, a radicle first emerges from the plant embryo that penetrates down into the soil and develops into the root. This is followed by the emergence of the hypocotyl, which develops into the stem. One major phenotypic difference between the wild type (WT) and lnk1/lnk2 mutant is the elongation of the hypocotyl, which is the embryonic stem. The lnk1/lnk2 double mutant was found to have significantly longer hypocotyls than WT seedlings under continuous white light conditions [22] and the phenotype was stronger under red light than under blue light. In addition, the lnk1/lnk2 mutant was observed to flower later than WT plants during longer days (16 h light/8 h darkness), with no difference in flowering time during shorter days (8 h light/16 h darkness). Thus, the genes responsible for the trait are expected to track seasonal changes in day length. Since a longer day also means an earlier sunrise and the red/far-red light photoreceptors called phytochromes, which are known to be responsible for stronger hypocotyl length, rhythmically express maximum levels during the day, the differential expression of trait genes is expected to be at the maximum in the early morning.
Since the goal is to investigate light and circadian related gene networks, we focus on data obtained during the subjective day. This is also supported by the fact that most clock genes downregulated in the mutant are found to peak at Zeitgeber time 10 (ZT10) in the wild type [22]. A zeitgeber is any external signal that alters the circadian rhythm. When light is considered as a zeitgeber, zeitgeber time is defined relative to dawn [28] and thus ZT10 would be 10 h after dawn. Taking these phenotypic observations into consideration, we select a subset of circadian time series data from ZT2–ZT10 for further analysis, spanning a total of 8 daytime hours.
2.3. Data Processing and Filtering
Three replicates were used for each Zeitgeber time for both mutant and WT, resulting in a total of 18 sample points. Genes with less than 10 mapped gene reads were filtered, leaving 23,380 genes for analysis. In order to account for non-idealities frequently present in RNAseq data, the variance of gene expression was stabilized using the DESeq2 [29] package with the terms ‘genotype + time + genotype:time’ using all sample points (ZT2-ZT22) before selecting 18 samples corresponding to ZT2-ZT10 for further analysis. A quick two sample t-test from package VIPER [30] found 1773 differentially expressed genes at significance level of .
2.4. Gene Selection for Fused Graphical Lasso
In order to create a list of light responsive and circadian genes, the gene ontology (GO-Slim) terms containing ‘light’ or ‘circadian’ were collected from the TAIR database [31]. Genes corresponding to these terms were then obtained using BiomaRt from Ensembl, which is the plants website [32]. Out of these, 918 were found among 23,380 filtered genes with at least 10 mapped RNAseq reads and 84 were found to be differentially expressed between the two phenotypes.
2.5. Fused Graphical Lasso Gene Network Inference
Over the past decade many approaches for modeling gene networks have been pro- posed for studying drought pathways [33] and pathogen resistance in crops [34], aiding the discovery of new biological gene interactions and studying cancer drug design [35,36,37,38]. These approaches include Boolean networks, Bayesian networks, probabilistic Boolean networks and Gaussian graphical models [39,40,41,42,43,44]. Out of these, Gaussian network learning based approaches have been used extensively in the past due to their scalability and wide application relative to microarray based data. However, their applicability to RNAseq data has not been explored. In order to learn the network level changes between wild type and the delayed flowering mutant, we briefly discuss a network learning approach based on Gaussian graphical models with fused lasso penalty. Consider the data matrix , where is the number of genes and is the total number of samples and so each observation is an dimensional vector . In a Gaussian graphical model, these are assumed to be independently and identically normally distributed , where is an dimensional mean vector and is a positive definite covariance matrix [45].
The gene connectivity is described by the precision matrix where genes which are conditionally independent (zero entries) and are assumed to be disconnected. The goal of network learning is to estimate this matrix Θ. In the ideal case where we have large enough number of samples for each node, we can estimate Θ by maximizing the following log likelihood with respect to Θ [45]:
where is the empirical covariance matrix. This yields as the estimate of Θ. However, under higher dimensional settings, becomes singular and cannot be inverted. To overcome this, we can instead optimize the penalized log likelihood driven by [45] the following:
where λ is the non-negative tuning parameter. This penalty is also known as lasso penalty and the optimization problem is called the graphical lasso. In effect, a larger value of λ forces entries very close to zero in the co-variance matrix to exactly zero, thus resulting in a sparse network. Since our goal is to discover differential edges between the wild type and mutant subnetworks, we focus on an extension of the graphical lasso called the joint graphical lasso [45]. The joint graphical lasso jointly learns many graphical models which are related but have some distinct gene interactions. Instead of learning a graphical model separately for wild type and mutant subnetworks, joint graphical lasso makes optimum use of the available data by learning common and differential edges resulting in performance gains [45]. We focus on the generalized fused lasso penalty formulation of joint graphical lasso where the log-likelihood function for two classes is provided by [45] the following:
where is given by [45] the following:
and and are the positive definite precision matrices for the two classes and is the number of samples in the kth class. Highly efficient algorithms based on the alternating directions method of multipliers (ADMM) [46] exist for solving this optimization problem [45]. The penalty consists of two different penalties: is a lasso penalty on off-diagonal elements, while penalizes the difference between the corresponding entries in the two precision matrices. Larger values of encourage sparser networks in both classes, whereas larger values of encourage both networks to be similar to one another. Thus, the network sparsity and similarities are controlled separately [45]. Since we are interested in recovering differential edges for biological hypothesis generation, we will focus on values of close to one and values of close to zero.
As discussed in the earlier subsection, we used time series samples for ZT2-ZT10 and gene expression for TF and circadian/light related genes to create a differential network with parameters and ; the genes were found to be connected with 728 and 92 predicted interactions in WT and lnk1/lnk2 mutant subnetworks, respectively, and 62 common interactions. In order to verify the robustness and consistency of the predicted gene network, the network was recreated and tested multiple times by adding random additional 1000 genes in the input dataset. Although the time series observations are not independent, we were able to empirically verify that under the high edge penalty, the joint graphical lasso is able to reliably recover the gene network.
2.6. Network Inference Using MARINa Algorithm
The Master Regulator Inference Algorithm (MARINa) algorithm [47] infers transcription factors (TFs) controlling the transition between the two phenotypes. Since the algorithm assumes that the differences in phenotypes are caused by transcription factors, it cannot recover mutation causing non-TF genes. Therefore, we use the additional information from TF-gene interactions database to learn if LNK1 and LNK2 genes are known to interact with any of the transcription factors identified by MARINa. A list of all potential Arabidopsis regulator genes (transcription factors; TF) was obtained from the Plant Transcription Factor Database [48] (PlantTFDB, version 5.0). ARACNe-AP [49] was used to create genome-wide TF-gene regulatory network based on mutual information (MI) with default parameters using all samples. The resulting 3-column TF-gene-MI file was then used to predict the most influential key regulators (TF) contributing to differences between the two phenotypes for 18 selected samples using MARINa [47].
High confidence predicted and verified interactions between Arabidopsis genes obtained from the Plant Transcription Factor Database (PlantTFDB v5.0) [48] were used for constructing trait related regulatory network. Interactions among top 50 predicted regulators and 84 differentially expressed light and circadian genes were extracted using a unix script. Flourish studio (https://flourish.studio accessed on 19 July 2021) webservice was used to create a network graph using these interactions.
3. Results
3.1. Wild Type and Flowering Mutant Subnetworks
The results of fused lasso graphical modelling between wild type and lnk1/lnk2 mutant are shown in Table 1. As expected, LNK1 and LNK2 genes have no connections in the mutant subnetwork. Next, we compared the top 10 hub genes in WT and mutant subnetworks are shown in Table 2. CCA1 (AT2G46830) and LHY (AT1G01060) are the most connected nodes in both subnetworks. Both of these genes play a crucial role in the regulation of circadian rhythms and act as accelerators of flowering time [50]. FKF1 (AT1G68050) is a clock regulated gene that regulates the transition to flowering in Arabidopsis [51]. Additionally, FKF1 and GIGANTEA (GI) complex are required for the measurement of day-length [52]. COR27 (AT5G42900) is a known positive regulator of flowering [53]. GRP7 (AT2G21660) is an upstream regulator of a flowering repressor gene FLC [54] and grp7-1 mutants are known to flower late [55]. eip6 mutants were found to flower early and showed increased expression of flowering-time and floral organ identity genes [56]. atgstu17 mutants (atgstu17-1 and atgstu17-2) were also observed to flower late [57]. In [58], Arabidopsis plants overexpressing MIPS2 were shown to have delayed flowering. Similarly, CDF6 was recently known to delay flowering [59]. While atnap null mutant and WT plants are developmentally indistinguishable in terms of bolting and flowering times, silique senescence was found to be dramatically delayed in the mutants [60]. ATHB12 is known to negatively regulate the growth of the inflorescence stem [61]. Thus, the hub genes predicted by graphical modeling are biologically meaningful.
Finally, we observe the gene interactions of CCA1 specific to the mutant subnetwork to evaluate whether they can explain the late flowering phenotype. Among the six neighbors of CCA1 specific to the mutant subnetwork are the genes COL9 (AT3G07650), B-BOX32 (AT3G21150) and LIR1 (AT3G26740). COL9 and B-BOX32 are known to delay flowering [62,63]. Similarly, Arabidopsis thaliana plants heterologously expressing ryegrass LIR1 show a minor delay in flowering time [64,65].
3.2. Predicting Mutation Causing Genes
In order to test if it is possible to infer LNK1 and LNK2 genes as the ones responsible for mutation, we collected genes which are present in the wild type gene subnetwork but not in the mutant subnetwork and that have a degree of at least two. The Interpro domain enrichment terms obtained for these genes using STRING protein–protein interaction database (v.11.0) [66] are shown in Table 3. It can be observed that LNK genes are on the top of the list.
3.3. Predicted Interactions of LNK1/2 Genes
Next, we sought to verify the biological relevance of gene interactions predicted by graphical modeling. Table 4 and Table 5 list predicted interactions of LNK2 and LNK1 genes, respectively. The verified interactions from literature are shown in bold. LNK genes are also known to contribute to the activation of afternoon genes such as ELF4 (AT2G40080) and FKF1 (AT1G68050) [22], which explains the positive correlation in Table 4 and Table 5. Interaction between FKF1 and LNK genes was also predicted in [67]. CCA1 (AT2G46830) is known to interact with both LNK1 and LNK2 [68]. The nature of this interaction is not yet known. However, LNK genes are known to function as transcriptional coactivators of evening-phased genes TOC1 and PRR5 [69], which are known to repress morning-phased gene CCA1. This could explain the negative correlation between CCA1 and LNK genes. In addition to the verified interactions discussed above, we predicted several novel interactions which might be useful in developing new hypotheses for the control of flowering time. It is important to note here that the graphical lasso cannot distinguish between protein–protein interactions and interactions at the gene regulatory level. For example, the interactions discussed above are gene regulatory interactions but the model also predicted interactions between FKF1 and GI genes that are known to interact in a blue light dependent manner at the protein level in the flowering pathway [52,70,71].
3.4. Comparison with Existing Methods
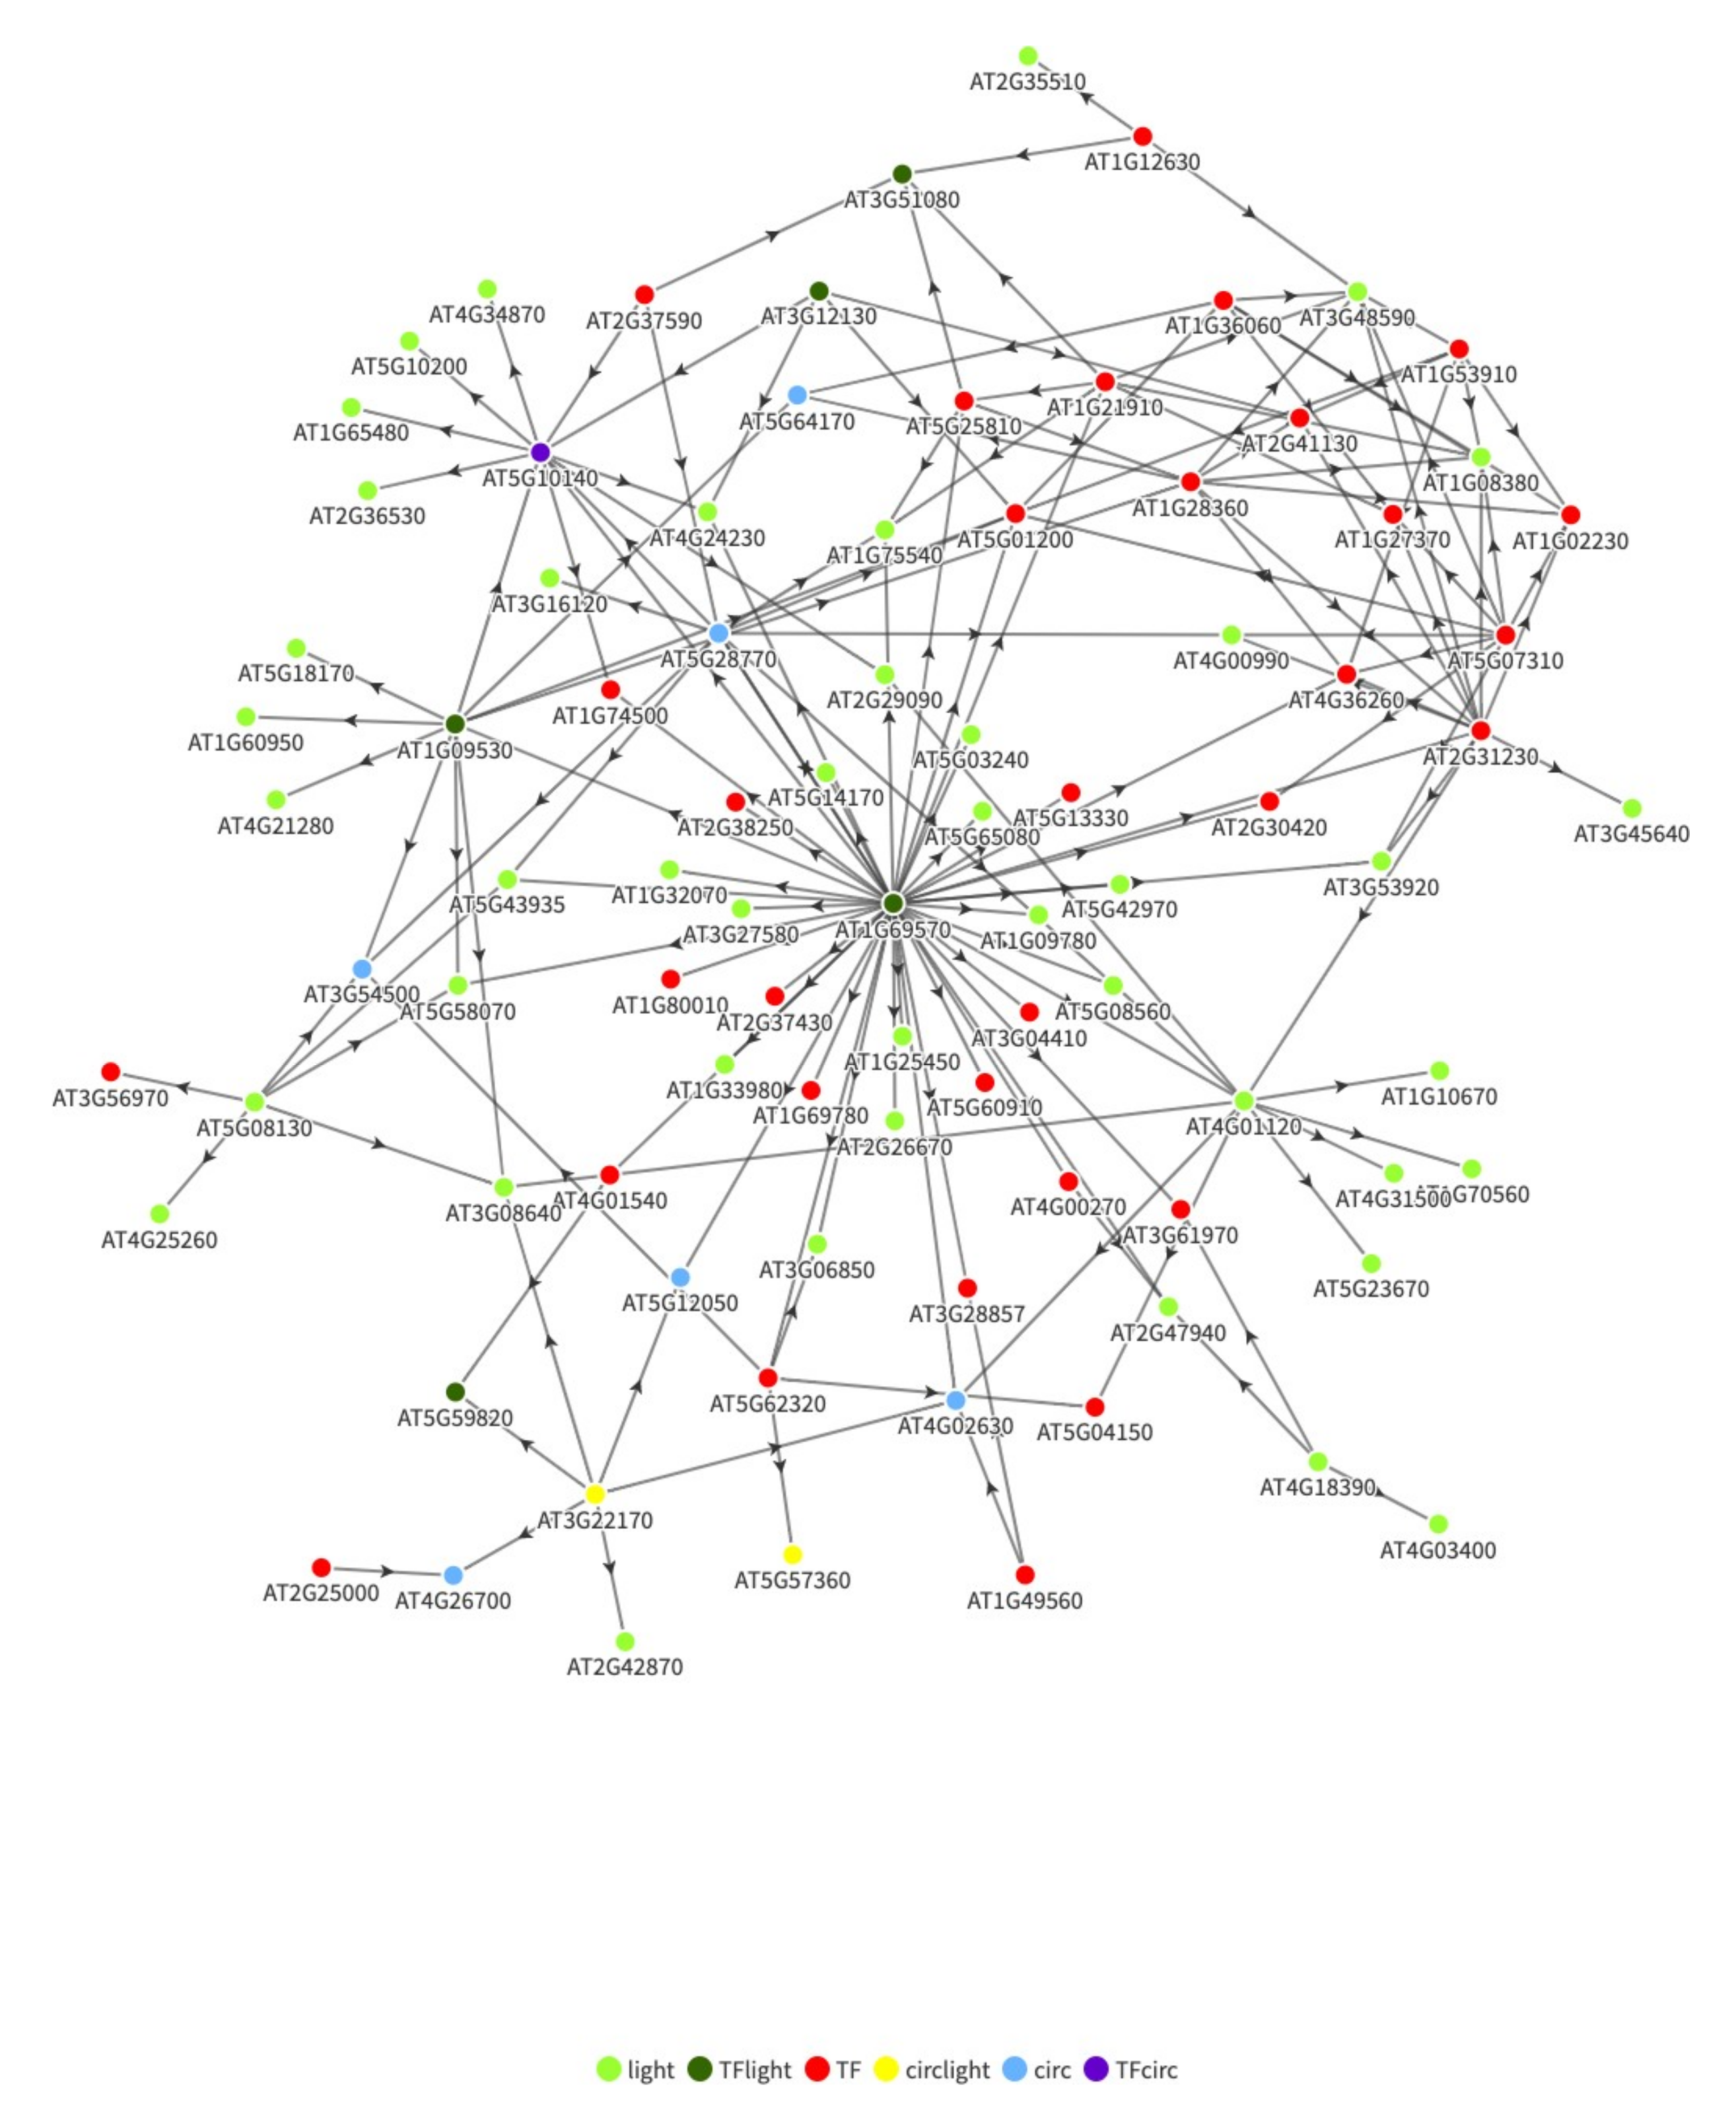
We compare the results of the fused graphical lasso in uncovering mutation causing genes with that of another algorithm, which is the Master Regulator Inference Algorithm (MARINa) [47]. Since the MARINa algorithm assumes transcription factors and not genes as the cause of mutations, as expected, the LNK1 and LNK2 genes are not present in the top 10 inferred master regulators, as shown in Table 6. However, the predicted transcription factors are found to be involved in flowering and light related pathways. We then used these results along with the publicly available TF-gene interactions for the Arabidopsis genes to investigate whether the LNK1/2 genes interacts with any of the predicted master regulators. Figure 1 shows the network of high confidence interactions from PlantTFDB [48] between the top 50 master regulators predicted using MARINa and 84 differentially expressed light and circadian related genes. The legends TFlight and TFcirc denote transcription factors involved in circadian and light related pathways, respectively, while light, circ and circlight denote genes involved in circadian, light and both pathways, respectively. Since LNK1 and LNK2 are involved in daylength regulated control of flowering, they are involved in both light and circadian pathways. As it can be observed, LNK1 (AT3G54500) and LNK2 (AT3G54500) are present in the MARINa predicted network. Additionally, the major hub genes in this network, CDF5 (AT1G69570) and FLC (AT5G10140), are well known genes in the circadian and flowering pathways [50]. However, unlike the graphical lasso, the algorithm is unable to rank the genes since there is no information regarding phenotype specific gene subnetworks. The differences in the two subnetworks obtained from using the fused graphical lasso were used for Interpro based enrichment to rank the genes. Additionally, the network created by graphical lasso was based only on the gene expression data without any additional TF-gene regulatory information. This is important for non-model crops such as wheat for which extensive regulatory information might not be publicly available. On the other hand, the Interpro information used for ranking the genes is widely available even for commercial crops.
4. Discussion
In this paper we proposed the use of a joint graphical lasso with fused penalty for identifying genes responsible for phenotypic differences in two Arabidopsis thaliana flowering phenotypes. Authors in [22] showed that the mutants resulting from knock out genes such as LNK1 and LNK2 in Arabidopsis thaliana have longer hypocotyls and delayed flowering times. By using publicly available circadian gene expression data from wild type and late flowering mutant from that study [22], we showed that the graphical lasso based analysis was able to identify the causal genes LNK1 and LNK2. In addition, network level changes in wild type and flowering mutant were also predicted and identified, which can assist biologists to learn and hypothesize about how mutation at just two genomic locations can result in genome wide transcriptional and regulatory changes. The gene interactions were verified against available biological knowledge and many novel interactions of LNK1/2 genes were predicted. One major disadvantage of this method is that it ignores the lowly expressed transcription factors (TF) since mRNA expression is not an accurate representation of TF activity. While another algorithm, MARINa, was not able to identify the genes LNK1 and LNK2 since it focuses only on TFs; the two algorithms might complement one another for developing stronger biological hypotheses.
Author Contributions
Conceptualization, A.D. and M.T.; methodology, R.K.; software, R.K.; validation, M.T.; formal analysis, R.K.; investigation, R.K. and A.D.; resources, M.T. and R.K.; data curation, R.K.; writing—original draft preparation, R.K.; writing—review and editing, R.K., A.D. and M.T.; visualization, R.K.; supervision, A.D. and M.T.; project administration, A.D. and M.T.; funding acquisition, M.T. and A.D. All authors have read and agreed to the published version of the manuscript.
Funding
This work was supported in part by the TEES-AgriLife Center for Bioinformatics and Genomics System Engineering (CBGSE) startup funds, the Texas A&M X-Grant Program and, in part, by the National Science Foundation under grant ECCS-1609236. The funding bodies did not play any role in the design of the study and the collection, analysis and interpretation of data or in writing the manuscript.
Institutional Review Board Statement
Not applicable.
Informed Consent Statement
Not applicable.
Data Availability Statement
The data used in this study are publicly available at NCBI with the accession number SRP018266.
Acknowledgments
We would like to thank Texas A&M High Performance Research Computing (HPRC) for providing the computational resources.
Conflicts of Interest
The authors declare no conflict of interest.
References
- Abberton, M.; Batley, J.; Bentley, A.; Bryant, J.; Cai, H.; Cockram, J.; Costa de Oliveira, A.; Cseke, L.J.; Dempewolf, H.; De Pace, C.; et al. Global agricultural intensification during climate change: A role for genomics. Plant Biotechnol. J. 2016, 14, 1095–1098. [Google Scholar] [CrossRef] [PubMed] [Green Version]
- Scheben, A.; Yuan, Y.; Edwards, D. Advances in genomics for adapting crops to climate change. Curr. Plant Biol. 2016, 6, 2–10. [Google Scholar] [CrossRef] [Green Version]
- Rosenzweig, C.; Iglesius, A.; Yang, X.B.; Epstein, P.R.; Chivian, E. Climate change and extreme weather events-Implications for food production, plant diseases, and pests. Glob. Chang. Hum. Health 2001, 2, 90–104. [Google Scholar]
- Batley, J.; Edwards, D. The application of genomics and bioinformatics to accelerate crop improvement in a changing climate. Curr. Opin. Plant Biol. 2016, 30, 78–81. [Google Scholar] [CrossRef] [PubMed] [Green Version]
- Schattenberg, P. Agricultural Losses from Winter Storm Exceed $600 Million. Available online: https://today.tamu.edu/2021/03/02/agricultural-losses-from-winter-storm-exceed-600-million/ (accessed on 25 March 2021).
- Nielsen-Gammon, J.W.; Banner, J.L.; Cook, B.I.; Tremaine, D.M.; Wong, C.I.; Mace, R.E.; Gao, H.; Yang, Z.L.; Gonzalez, M.F.; Hoffpauir, R.; et al. Unprecedented drought challenges for Texas water resources in a changing climate: What do researchers and stakeholders need to know? Earths Future 2020, 8, e2020EF001552. [Google Scholar] [CrossRef]
- Pourkheirandish, M.; Golicz, A.A.; Bhalla, P.L.; Singh, M.B. Global role of crop genomics in the face of climate change. Front. Plant Sci. 2020, 11, 922. [Google Scholar] [CrossRef]
- Kole, C.; Muthamilarasan, M.; Henry, R.; Edwards, D.; Sharma, R.; Abberton, M.; Batley, J.; Bentley, A.; Blakeney, M.; Bryant, J.; et al. Application of genomics-assisted breeding for generation of climate resilient crops: Progress and prospects. Front. Plant Sci. 2015, 6, 563. [Google Scholar] [CrossRef] [PubMed] [Green Version]
- Brown, J.K. A cost of disease resistance: Paradigm or peculiarity? Trends Genet. 2003, 19, 667–671. [Google Scholar] [CrossRef] [PubMed]
- Varshney, R.K.; Singh, V.K.; Kumar, A.; Powell, W.; Sorrells, M.E. Can genomics deliver climate-change ready crops? Curr. Opin. Plant Biol. 2018, 45, 205–211. [Google Scholar] [CrossRef]
- Korres, N.E.; Norsworthy, J.K.; Tehranchian, P.; Gitsopoulos, T.K.; Loka, D.A.; Oosterhuis, D.M.; Gealy, D.R.; Moss, S.R.; Burgos, N.R.; Miller, M.R.; et al. Cultivars to face climate change effects on crops and weeds: A review. Agron. Sustain. Dev. 2016, 36, 12. [Google Scholar] [CrossRef] [Green Version]
- Craufurd, P.Q.; Wheeler, T.R. Climate change and the flowering time of annual crops. J. Exp. Bot. 2009, 60, 2529–2539. [Google Scholar] [CrossRef] [PubMed] [Green Version]
- Blázquez, M.A.; Ahn, J.H.; Weigel, D. A thermosensory pathway controlling flowering time in Arabidopsis thaliana. Nat. Genet. 2003, 33, 168–171. [Google Scholar] [CrossRef]
- Jagadish, S.; Bahuguna, R.N.; Djanaguiraman, M.; Gamuyao, R.; Prasad, P.; Craufurd, P.Q. Implications of high temperature and elevated CO2 on flowering time in plants. Front. Plant Sci. 2016, 7, 913. [Google Scholar] [CrossRef] [Green Version]
- Putterill, J.; Laurie, R.; Macknight, R. It’s time to flower: The genetic control of flowering time. Bioessays 2004, 26, 363–373. [Google Scholar] [CrossRef] [PubMed]
- Pineiro, M.; Coupland, G. The control of flowering time and floral identity in Arabidopsis. Plant Physiol. 1998, 117, 1–8. [Google Scholar] [CrossRef] [PubMed] [Green Version]
- King, R.; Zeevaart, J.A. Floral stimulus movement in Perilla and flower inhibition caused by noninduced leaves. Plant Physiol. 1973, 51, 727–738. [Google Scholar] [CrossRef] [Green Version]
- Lang, A.; Chailakhyan, M.K.; Frolova, I. Promotion and inhibition of flower formation in a dayneutral plant in grafts with a short-day plant and a long-day plant. Proc. Natl. Acad. Sci. USA 1977, 74, 2412–2416. [Google Scholar] [CrossRef] [PubMed] [Green Version]
- Irish, E.; Jegla, D. Regulation of extent of vegetative development of the maize shoot meristem. Plant J. 1997, 11, 63–71. [Google Scholar] [CrossRef]
- Pouteau, S.; Nicholls, D.; Tooke, F.; Coen, E.; Battey, N. The induction and maintenance of flowering in Impatiens. Development 1997, 124, 3343–3351. [Google Scholar] [CrossRef]
- Mouradov, A.; Cremer, F.; Coupland, G. Control of flowering time: Interacting pathways as a basis for diversity. Plant Cell 2002, 14, S111–S130. [Google Scholar] [CrossRef] [PubMed] [Green Version]
- Rugnone, M.L.; Soverna, A.F.; Sanchez, S.E.; Schlaen, R.G.; Hernando, C.E.; Seymour, D.K.; Mancini, E.; Chernomoretz, A.; Weigel, D.; Más, P.; et al. LNK genes integrate light and clock signaling networks at the core of the Arabidopsis oscillator. Proc. Natl. Acad. Sci. USA 2013, 110, 12120–12125. [Google Scholar] [CrossRef] [Green Version]
- Harmer, S.L.; Hogenesch, J.B.; Straume, M.; Chang, H.S.; Han, B.; Zhu, T.; Wang, X.; Kreps, J.A.; Kay, S.A. Orchestrated transcription of key pathways in Arabidopsis by the circadian clock. Science 2000, 290, 2110–2113. [Google Scholar] [CrossRef] [PubMed]
- Casal, J.J.; Yanovsky, M.J. Regulation of gene expression by light. Int. J. Dev. Biol. 2004, 49, 501–511. [Google Scholar] [CrossRef] [PubMed] [Green Version]
- Malapeira, J.; Khaitova, L.C.; Mas, P. Ordered changes in histone modifications at the core of the Arabidopsis circadian clock. Proc. Natl. Acad. Sci. USA 2012, 109, 21540–21545. [Google Scholar] [CrossRef] [PubMed] [Green Version]
- Michael, T.P.; Mockler, T.C.; Breton, G.; McEntee, C.; Byer, A.; Trout, J.D.; Hazen, S.P.; Shen, R.; Priest, H.D.; Sullivan, C.M.; et al. Network discovery pipeline elucidates conserved time-of-day–specific cis-regulatory modules. PLoS Genet 2008, 4, e14. [Google Scholar] [CrossRef] [PubMed] [Green Version]
- Chen, L.Y.; Wei, K.C.; Huang, A.C.Y.; Wang, K.; Huang, C.Y.; Yi, D.; Tang, C.Y.; Galas, D.J.; Hood, L.E. RNASEQR—a streamlined and accurate RNA-seq sequence analysis program. Nucleic Acids Res. 2012, 40, e42. [Google Scholar] [CrossRef] [PubMed]
- Lewy, A.; Emens, J.; Songer, J.; Rough, J. The neurohormone melatonin as a marker, medicament, and mediator. In Hormones, Brain and Behavior Online; Elsevier Inc.: Amsterdam, The Netherlands, 2010; pp. 2505–2528. [Google Scholar]
- Love, M.I.; Huber, W.; Anders, S. Moderated estimation of fold change and dispersion for RNA-seq data with DESeq2. Genome Biol. 2014, 15, 550. [Google Scholar] [CrossRef] [PubMed] [Green Version]
- Alvarez, M.J.; Shen, Y.; Giorgi, F.M.; Lachmann, A.; Ding, B.B.; Ye, B.H.; Califano, A. Functional characterization of somatic mutations in cancer using network-based inference of protein activity. Nat. Genet. 2016, 48, 838–847. [Google Scholar] [CrossRef] [PubMed]
- Huala, E.; Dickerman, A.W.; Garcia-Hernandez, M.; Weems, D.; Reiser, L.; LaFond, F.; Hanley, D.; Kiphart, D.; Zhuang, M.; Huang, W.; et al. The Arabidopsis Information Resource (TAIR): A comprehensive database and web-based information retrieval, analysis, and visualization system for a model plant. Nucleic Acids Res. 2001, 29, 102–105. [Google Scholar] [CrossRef] [Green Version]
- Bolser, D.; Staines, D.M.; Pritchard, E.; Kersey, P. Ensembl plants: Integrating tools for visualizing, mining, and analyzing plant genomics data. In Plant Bioinformatics; Springer: Berlin, Germany, 2016; pp. 115–140. [Google Scholar]
- Lahiri, A.; Zhou, L.; He, P.; Datta, A. Detecting Drought Regulators using Stochastic Inference in Bayesian Networks. 2020. [Google Scholar]
- Lahiri, A.; Venkatasubramani, P.S.; Datta, A. Bayesian modeling of plant drought resistance pathway. BMC Plant Biol. 2019, 19, 1–11. [Google Scholar] [CrossRef] [Green Version]
- Arshad, O.A.; Datta, A. Towards targeted combinatorial therapy design for the treatment of castration-resistant prostate cancer. BMC Bioinform. 2017, 18, 5–15. [Google Scholar] [CrossRef] [PubMed] [Green Version]
- Kapoor, R.; Datta, A.; Sima, C.; Hua, J.; Lopes, R.; Bittner, M.L. A Gaussian Mixture-Model Exploiting Pathway Knowledge for Dissecting Cancer Heterogeneity. IEEE/ACM Trans. Comput. Biol. Bioinform. 2018, 17, 459–468. [Google Scholar] [CrossRef] [PubMed]
- Saraf, R.S.; Datta, A.; Sima, C.; Hua, J.; Lopes, R.; Bittner, M. An in-silico study examining the induction of apoptosis by Cryptotanshinone in metastatic melanoma cell lines. BMC Cancer 2018, 18, 1–13. [Google Scholar] [CrossRef] [PubMed]
- Saraf, R.; Datta, A.; Sima, C.; Hua, J.; Lopes, R.; Bittner, M.L.; Miller, T.; Wilson-Robles, H.M. In silico modeling of the induction of apoptosis by Cryptotanshinone in osteosarcoma cell lines. IEEE/ACM Trans. Comput. Biol. Bioinform. 2020. [Google Scholar] [CrossRef] [PubMed]
- Vundavilli, H.; Datta, A.; Sima, C.; Hua, J.; Lopes, R.; Bittner, M. Targeting oncogenic mutations in colorectal cancer using cryptotanshinone. PLoS ONE 2021, 16, e0247190. [Google Scholar] [CrossRef] [PubMed]
- Timmermann, T.; González, B.; Ruz, G.A. Reconstruction of a gene regulatory network of the induced systemic resistance defense response in Arabidopsis using boolean networks. BMC Bioinform. 2020, 21, 1–16. [Google Scholar] [CrossRef] [PubMed] [Green Version]
- Venkat, P.S.; Narayanan, K.R.; Datta, A. A Bayesian network-based approach to selection of intervention points in the mitogen- activated protein kinase plant defense response pathway. J. Comput. Biol. 2017, 24, 327–339. [Google Scholar] [CrossRef] [PubMed]
- Vijesh, N.; Chakrabarti, S.K.; Sreekumar, J. Modeling of gene regulatory networks: A review. J. Biomed. Sci. Eng. 2013, 6, 223. [Google Scholar] [CrossRef] [Green Version]
- Vundavilli, H.; Datta, A.; Sima, C.; Hua, J.; Lopes, R.; Bittner, M. Bayesian inference identifies combination therapeutic targets in breast cancer. IEEE Trans. Biomed. Eng. 2019, 66, 2684–2692. [Google Scholar] [CrossRef]
- Vundavilli, H.; Datta, A.; Sima, C.; Hua, J.; Lopes, R.; Bittner, M. Using Chou’s 5-steps rule to Model Feedback in Lung Cancer. IEEE J. Biomed. Health Inform. 2019, 24, 2430–2438. [Google Scholar] [CrossRef] [PubMed]
- Danaher, P.; Wang, P.; Witten, D.M. The joint graphical lasso for inverse covariance estimation across multiple classes. J. R. Stat. Society. Ser. B Stat. Methodol. 2014, 76, 373. [Google Scholar] [CrossRef] [PubMed]
- Boyd, S.; Parikh, N.; Chu, E. Distributed Optimization and Statistical Learning Via the Alternating Direction Method of Multipliers. Mach. Learn. 2010, 3, 1–122. [Google Scholar] [CrossRef]
- Lefebvre, C.; Rajbhandari, P.; Alvarez, M.J.; Bandaru, P.; Lim, W.K.; Sato, M.; Wang, K.; Sumazin, P.; Kustagi, M.; Bisikirska, B.C.; et al. A human B-cell interactome identifies MYB and FOXM1 as master regulators of proliferation in germinal centers. Mol. Syst. Biol. 2010, 6, 377. [Google Scholar] [CrossRef]
- Jin, J.; Tian, F.; Yang, D.C.; Meng, Y.Q.; Kong, L.; Luo, J.; Gao, G. PlantTFDB 4.0: Toward a central hub for transcription factors and regulatory interactions in plants. Nucleic Acids Res. 2016. [Google Scholar] [CrossRef] [Green Version]
- Lachmann, A.; Giorgi, F.M.; Lopez, G.; Califano, A. ARACNe-AP: Gene network reverse engineering through adaptive partitioning inference of mutual information. Bioinformatics 2016, 32, 2233–2235. [Google Scholar] [CrossRef] [PubMed] [Green Version]
- Fujiwara, S.; Oda, A.; Yoshida, R.; Niinuma, K.; Miyata, K.; Tomozoe, Y.; Tajima, T.; Nakagawa, M.; Hayashi, K.; Coupland, G.; et al. Circadian clock proteins LHY and CCA1 regulate SVP protein accumulation to control flowering in Arabidopsis. Plant Cell 2008, 20, 2960–2971. [Google Scholar] [CrossRef] [PubMed] [Green Version]
- Nelson, D.C.; Lasswell, J.; Rogg, L.E.; Cohen, M.A.; Bartel, B. FKF1, a clock-controlled gene that regulates the transition to flowering in Arabidopsis. Cell 2000, 101, 331–340. [Google Scholar] [CrossRef] [Green Version]
- Sawa, M.; Nusinow, D.A.; Kay, S.A.; Imaizumi, T. FKF1 and GIGANTEA complex formation is required for day-length measurement in Arabidopsis. Science 2007, 318, 261–265. [Google Scholar] [CrossRef] [PubMed] [Green Version]
- Li, X.; Ma, D.; Lu, S.X.; Hu, X.; Huang, R.; Liang, T.; Xu, T.; Tobin, E.M.; Liu, H. Blue light-and low temperature-regulated COR27 and COR28 play roles in the Arabidopsis circadian clock. Plant Cell 2016, 28, 2755–2769. [Google Scholar] [CrossRef] [Green Version]
- Xiao, J.; Li, C.; Xu, S.; Xing, L.; Xu, Y.; Chong, K. JACALIN-LECTIN LIKE1 regulates the nuclear accumulation of GLYCINE-RICH RNA-BINDING PROTEIN7, influencing the RNA processing of FLOWERING LOCUS C antisense transcripts and flowering time in Arabidopsis. Plant Physiol. 2015, 169, 2102–2117. [Google Scholar] [PubMed] [Green Version]
- Streitner, C.; Danisman, S.; Wehrle, F.; Schöning, J.C.; Alfano, J.R.; Staiger, D. The small glycine-rich RNA binding protein AtGRP7 promotes floral transition in Arabidopsis thaliana. Plant J. 2008, 56, 239–250. [Google Scholar] [CrossRef] [PubMed]
- Park, H.Y.; Lee, S.Y.; Seok, H.Y.; Kim, S.H.; Sung, Z.R.; Moon, Y.H. EMF1 interacts with EIP1, EIP6 or EIP9 involved in the regulation of flowering time in Arabidopsis. Plant Cell Physiol. 2011, 52, 1376–1388. [Google Scholar] [CrossRef] [Green Version]
- Chen, J.H.; Jiang, H.W.; Hsieh, E.J.; Chen, H.Y.; Chien, C.T.; Hsieh, H.L.; Lin, T.P. Drought and salt stress tolerance of an Arabidopsis glutathione S-transferase U17 knockout mutant are attributed to the combined effect of glutathione and abscisic acid. Plant Physiol. 2012, 158, 340–351. [Google Scholar] [CrossRef] [PubMed] [Green Version]
- Fleet, C.; Yen, J.; Hill, E.; Gillaspy, G. Co-suppression of AtMIPS demonstrates cooperation of MIPS1, MIPS2 and MIPS3 in maintaining myo-inositol synthesis. Plant Mol. Biol. 2018, 97, 253–263. [Google Scholar] [CrossRef]
- Krahmer, J.; Goralogia, G.S.; Kubota, A.; Zardilis, A.; Johnson, R.S.; Song, Y.H.; MacCoss, M.J.; Le Bihan, T.; Halliday, K.J.; Imaizumi, T.; et al. Time-resolved interaction proteomics of the GIGANTEA protein under diurnal cycles in Arabidopsis. FEBS Lett. 2019, 593, 319–338. [Google Scholar] [CrossRef] [Green Version]
- Kou, X.; Watkins, C.B.; Gan, S.S. Arabidopsis AtNAP regulates fruit senescence. J. Exp. Bot. 2012, 63, 6139–6147. [Google Scholar] [CrossRef] [Green Version]
- Son, O.; Hur, Y.S.; Kim, Y.K.; Lee, H.J.; Kim, S.; Kim, M.R.; Nam, K.H.; Lee, M.S.; Kim, B.Y.; Park, J.; et al. ATHB12, an ABA- inducible homeodomain-leucine zipper (HD-Zip) protein of Arabidopsis, negatively regulates the growth of the inflorescence stem by decreasing the expression of a gibberellin 20-oxidase gene. Plant Cell Physiol. 2010, 51, 1537–1547. [Google Scholar] [CrossRef] [PubMed] [Green Version]
- Cheng, X.F.; Wang, Z.Y. Overexpression of COL9, a CONSTANS-LIKE gene, delays flowering by reducing expression of CO and FT in Arabidopsis thaliana. Plant J. 2005, 43, 758–768. [Google Scholar] [CrossRef] [PubMed]
- Tripathi, P.; Carvallo, M.; Hamilton, E.E.; Preuss, S.; Kay, S.A. Arabidopsis B-BOX32 interacts with CONSTANS-LIKE3 to regulate flowering. Proc. Natl. Acad. Sci. USA 2017, 114, 172–177. [Google Scholar] [CrossRef] [PubMed] [Green Version]
- Yang, C.; Hu, H.; Ren, H.; Kong, Y.; Lin, H.; Guo, J.; Wang, L.; He, Y.; Ding, X.; Grabsztunowicz, M.; et al. LIGHT-INDUCED RICE1 regulates light-dependent attachment of LEAF-TYPE FERREDOXIN-NADP+ OXIDOREDUCTASE to the thylakoid membrane in rice and Arabidopsis. Plant Cell 2016, 28, 712–728. [Google Scholar] [CrossRef] [PubMed] [Green Version]
- Ciannamea, S.; Jensen, C.S.; Agerskov, H.; Petersen, K.; Lenk, I.; Didion, T.; Immink, R.G.; Angenent, G.C.; Nielsen, K.K. A new member of the LIR gene family from perennial ryegrass is cold-responsive, and promotes vegetative growth in Arabidopsis. Plant Sci. 2007, 172, 221–227. [Google Scholar] [CrossRef]
- Szklarczyk, D.; Gable, A.L.; Lyon, D.; Junge, A.; Wyder, S.; Huerta-Cepas, J.; Simonovic, M.; Doncheva, N.T.; Morris, J.H.; Bork, P.; et al. STRING v11: Protein–protein association networks with increased coverage, supporting functional discovery in genome-wide experimental datasets. Nucleic Acids Res. 2019, 47, D607–D613. [Google Scholar] [CrossRef] [PubMed] [Green Version]
- Nakamichi, N. The Transcriptional Network in the Arabidopsis Circadian Clock System. Genes 2020, 11, 1284. [Google Scholar] [CrossRef] [PubMed]
- Xie, Q.; Wang, P.; Liu, X.; Yuan, L.; Wang, L.; Zhang, C.; Li, Y.; Xing, H.; Zhi, L.; Yue, Z.; et al. LNK1 and LNK2 are transcriptional coactivators in the Arabidopsis circadian oscillator. Plant Cell 2014, 26, 2843–2857. [Google Scholar] [CrossRef] [Green Version]
- Shim, J.S.; Imaizumi, T. Circadian clock and photoperiodic response in Arabidopsis: From seasonal flowering to redox homeostasis. Biochemistry 2015, 54, 157–170. [Google Scholar] [CrossRef] [Green Version]
- Hwang, D.Y.; Park, S.; Lee, S.; Lee, S.S.; Imaizumi, T.; Song, Y.H. GIGANTEA regulates the timing stabilization of CONSTANS by altering the interaction between FKF1 and ZEITLUPE. Mol. Cells 2019, 42, 693. [Google Scholar]
- Song, Y.H.; Estrada, D.A.; Johnson, R.S.; Kim, S.K.; Lee, S.Y.; MacCoss, M.J.; Imaizumi, T. Distinct roles of FKF1, GIGANTEA, and ZEITLUPE proteins in the regulation of CONSTANS stability in Arabidopsis photoperiodic flowering. Proc. Natl. Acad. Sci. USA 2014, 111, 17672–17677. [Google Scholar] [CrossRef] [Green Version]
Figure 1.
Regulatory network between top 50 TF and differentially expressed light and circadian related genes.
Figure 1.
Regulatory network between top 50 TF and differentially expressed light and circadian related genes.


Table 1.
Topological properties of wild type and mutant subnetworks.
| Topological Properties | WT Subnetwork | Mutant Subnetwork |
|---|---|---|
| Number of subnetworks in each class | 1 | 1 |
| Number of edges in each class | 728 | 92 |
| Degree LNK1 gene (AT5G64170) | 5 | 0 |
| Degree LNK2 gene (AT3G54500) | 18 | 0 |
Table 2.
Hub genes in wild type and mutant subnetworks.
| Topological Properties | WT Hub | Gene Name | #edges | Mutant Hub | Gene Name | #edges |
|---|---|---|---|---|---|---|
| 1 | AT2G46830 | CCA1 | 155 | AT1G01060 | LHY | 70 |
| 2 | AT1G01060 | LHY | 153 | AT2G46830 | CCA1 | 12 |
| 3 | AT1G68050 | FKF1 | 43 | AT3G26740 | CCL | 12 |
| 4 | AT5G42900 | COR27 | 43 | AT1G01520 | RVE3 | 4 |
| 5 | AT1G73870 | COL7 | 40 | AT1G69490 | NAP | 4 |
| 6 | AT2G21660 | GRP7 | 39 | AT1G10370 | ATGSTU17 | 3 |
| 7 | AT3G12320 | LNK3 | 37 | AT3G21150 | EIP6,BBOX32 | 3 |
| 8 | AT3G26740 | CCL | 32 | AT3G61890 | ATHB12 | 3 |
| 9 | AT1G07180 | NDA1 | 29 | AT1G26790 | CDF6 | 2 |
| 10 | AT5G60100 | PRR3 | 27 | AT2G22240 | MIPS2 | 2 |
Table 3.
INTERPRO enriched terms in WT network specific genes.
| INTERPRO ID | Description | #Genes | Strength | FDR |
|---|---|---|---|---|
| IPRO39928 | LNK family | 4 of 4 | 2.34 | |
| IPRO24708 | Catalase active site | 2 of 2 | 2.34 | 0.0015 |
| IPRO24711 | Catalase, mono-functional, haem-containing clades 1 and 3 | 2 of 3 | 2.16 | 0.0023 |
| IPRO20835 | Catalase superfamily | 2 of 3 | 2.16 | 0.0023 |
| IPRO18028 | Catalase, mono-functional, haem-containing | 2 of 3 | 2.16 | 0.0023 |
| IPRO11614 | Catalase core domain | 2 of 3 | 2.16 | 0.0023 |
| IPRO10582 | Catalase immune-responsive domain | 2 of 3 | 2.16 | 0.0023 |
| IPRO002226 | Catalase haem-binding site | 2 of 3 | 2.16 | 0.0023 |
| IPRO039615 | Protein PHYTOCHROME KINASE SUBSTRATE | 2 of 4 | 2.04 | 0.0026 |
| IPRO000315 | B-boc type zinc finger | 14 of 34 | 1.95 |
Table 4.
Predicted interactions of LNK2 gene using a fused graphical lasso.
| Gene ID | Name | Strength |
|---|---|---|
| AT1G07180 | NDA1 | −0.05559 |
| AT1G10370 | ATGSTU17 | −0.03301 |
| AT1G68050 | FKF1 | 0.06481 |
| AT1G73870 | COL7 | −0.07189 |
| AT2G21130 | CYP19-2 | 0.00361 |
| AT2G21660 | GRP7 | 0.04804 |
| AT2G40080 | ELF4 | 0.05177 |
| AT2G46830 | CCA1 | −0.07997 |
| AT3G02380 | COL2 | −0.03379 |
| AT3G07650 | COL9 | 0.05028 |
| AT3G12320 | LNK3 | −0.06966 |
| AT3G20810 | JMJD5 | 0.04070 |
| AT4G33980 | COR28 | 0.04301 |
| AT5G06980 | LNK4 | −0.04090 |
| AT5G24120 | SIGE | −0.02336 |
| AT5G42900 | COR27 | 0.00917 |
| AT5G48250 | BBX8 | 0.00460 |
| AT5G60100 | PRR3 | 0.04671 |
Table 5.
Predicted interactions of LNK1 gene using a fused graphical lasso.
| Gene ID | Name | Strength |
|---|---|---|
| AT1G68050 | FKF1 | 0.05274 |
| AT1G73870 | COL7 | −0.04299 |
| AT2G21660 | GRP7 | 0.00164 |
| AT2G46830 | CCA1 | −0.29688 |
| AT3G12320 | LNK3 | −0.03224 |
Table 6.
Top 10 Master Regulators between wild type and lnk1/lnk2 mutant predicted by MARINa.
| Rank | Master Regulator | Size | NES | p-Value | FDR |
|---|---|---|---|---|---|
| 1 | FLC | 48 | 3.51 | 0.000452 | 0.291 |
| 2 | GT-3b | 25 | 3.34 | 0.000829 | 0.291 |
| 3 | ERF12 | 29 | 3.18 | 0.001460 | 0.291 |
| 4 | AT4G39160 | 49 | 3.13 | 0.001740 | 0.291 |
| 5 | PIF3 | 35 | 3.05 | 0.002250 | 0.314 |
| 6 | SRS2 | 92 | 3.00 | 0.002690 | 0.315 |
| 7 | ERF115 | 42 | 2.98 | 0.002880 | 0.315 |
| 8 | NAM | 34 | −3.12 | 0.001830 | 0.291 |
| 9 | BHLH038 | 65 | −3.15 | 0.001620 | 0.291 |
| 10 | NGA2 | 63 | −3.47 | 0.000529 | 0.291 |
Publisher’s Note: MDPI stays neutral with regard to jurisdictional claims in published maps and institutional affiliations. |
© 2021 by the authors. Licensee MDPI, Basel, Switzerland. This article is an open access article distributed under the terms and conditions of the Creative Commons Attribution (CC BY) license (https://creativecommons.org/licenses/by/4.0/).
Share and Cite
MDPI and ACS Style
Kapoor, R.; Datta, A.; Thomson, M. Fused Graphical Lasso Recovers Flowering Time Mutation Genes in Arabidopsis thaliana. Inventions 2021, 6, 52. https://0-doi-org.brum.beds.ac.uk/10.3390/inventions6030052
AMA Style
Kapoor R, Datta A, Thomson M. Fused Graphical Lasso Recovers Flowering Time Mutation Genes in Arabidopsis thaliana. Inventions. 2021; 6(3):52. https://0-doi-org.brum.beds.ac.uk/10.3390/inventions6030052
Chicago/Turabian StyleKapoor, Rajan, Aniruddha Datta, and Michael Thomson. 2021. "Fused Graphical Lasso Recovers Flowering Time Mutation Genes in Arabidopsis thaliana" Inventions 6, no. 3: 52. https://0-doi-org.brum.beds.ac.uk/10.3390/inventions6030052