Concept Paper

PeTaL (Periodic Table of Life) and Physiomimetics

1
NASA Glenn Research Center, Cleveland, OH 44135, USA
2
LERCIP, NASA Glenn Research Center, Cleveland, OH 44135, USA
3
NASA Glenn Research Center PhD Fellow, Cleveland, OH 44135, USA
*
Author to whom correspondence should be addressed.
Submission received: 31 May 2019 / Revised: 16 July 2019 / Accepted: 20 July 2019 / Published: 14 August 2019
(This article belongs to the Special Issue Advances in Biologically Inspired Design)

Abstract

:
The Periodic Table of Life (PeTaL) is a system design tool and open source framework that uses artificial intelligence (AI) to aid in the systematic inquiry of nature for its application to human systems. This paper defines PeTaL’s architecture and workflow. Biomimicry, biophysics, biomimetics, bionics and numerous other terms refer to the use of biology and biological principles to inform practices in other disciplines. For the most part, the domain of inquiry in these fields has been confined to extant biological models with the proponents of biomimicry often citing the evolutionary success of extant organisms relative to extinct ones. An objective of this paper is to expand the domain of inquiry for human processes that seek to model those that are, were or could be found in nature with examples that relate to the field of aerospace and to spur development of tools that can work together to accelerate the use of artificial intelligence, topology optimization and conventional modeling in problem solving. Specifically, specialized fields such as paleomimesis, anthropomimesis and physioteleology are proposed in conjunction with artificial evolution. The overarching philosophy outlined here can be thought of as physiomimetics, a holistic and systematic way of learning from natural history. The backbone of PeTaL integrates an unstructured database with an ontological model consisting of function, morphology, environment, state of matter and ecosystem. Tools that support PeTaL include machine learning, natural language processing and computer vision. Applications of PeTaL include guiding human space exploration, understanding human and geological history, and discovering new or extinct life. Also discussed is the formation of V.I.N.E. (Virtual Interchange for Nature-inspired Exploration), a virtual collaborative aimed at generating data, research and applications centered on nature. Details of implementation will be presented in subsequent publications. Recommendations for future work are also presented.

1. Introduction

The universe (nature) appears to be mathematical: it shows signs of patterns (such as spirals or tiles) that repeat across scales (sunflower, snail, and galaxy). Nature might thus lend itself to being replicated through modelling. We undertake these simulations daily, whether to model the flow in a turbine engine, to model the collision of galaxies or to model stresses in a bridge. Our efforts in most fields such as fluid dynamics, quantum physics, cosmology, structures and thermodynamics have led to a computational approach to understanding the universe in small pieces, and this search for the underlying rules of the universe comprises the core of modern physics, with mathematics being the language we use to describe physics. We have recently made giant strides in understanding human biology [1] and further yet, how non-human biological entities exist within nature [2]. The understanding of biological principles within a physics framework is a precursor to mimicking nature systematically. This is beneficial to us in the short term because it helps us design tools, technology and products that leverage the numerous natural experiments that have occurred from abiogenesis to the Anthropocene. In the long term, understanding natural systems that include living systems is vital because they help us understand all the iterations (adaptations) that have failed (relative to those that have been propagated). Evolution relies not on proactively adapting to stimuli by developing successful strategies, but rather by already-possessed attributes that allow an organism to survive while others perish. Understanding the processes that lead to life (abiogenesis) and analyzing the DNA of all lifeforms, extinct and extant is thus necessary if we are to move beyond what nature has accomplished. This involves genetic engineering [3], synthetic biology [4], artificial intelligence and many yet to be discovered fields of study. In fact, a future human or other civilization may refer to the age that we are presently entering as the Biocene or the age (epoch) of new life: a geological period that will follow the Anthropocene. As we enter the Biocene, humans start to look at living systems and systematically learn from natural principles that govern them. This will result in the creation of life-like machines, technology and systems that will demarcate this geological period for future generations. Artificial intelligence (AI) will be a contributing factor, but it will also be influenced by the way living systems think and act.
When pursuing such endeavors as creating organisms in a lab or a computer program that can reproduce and mutate, we need to build in strategies of natural systems that have shown merit for an extended period or at the very least have not been shown to fail in a relevant context. Thus, it is essential to ask why certain behaviors die out or why extinctions seem to impact a particular type of species or behavior more than others. We can build bio-inspired immune systems into our human systems that identify potential pitfalls or threats within our technological, social, economic and political systems. Eventually, we may be able to build simulations to house our minds that will follow these natural laws and thus propagate new natural systems, artificial intelligence, simulations and so on. If we each live in our own simulated reality, there would be no reason to encroach on each other’s space, fight for resources or for wealth. Personal satisfaction and well-being may be maximized while suffering is reduced to the levels necessary to stave off boredom. If we base our rules of living on fairness and empathy [5], a simulated reality could be the ultimate ethical universe. In the nearer term, we seek to develop technology to improve the way we interact with each other and the universe. To this end, we are moving toward flexible system architectures that are capable of multiple missions by real-time sensing of environment, adaptation to changes in the environment and assessment of system health, while not adversely impacting (may actually benefit) the environment or other systems in the ecosystem (natural and human-made). Such a system is shown in Figure 1. The system known as SOFTEE (Self Organizing Fluidcraft for Terrestrial and Extraterrestrial Exploration) would embody many features of the living world with the added ability to change form based on the environment it finds itself in. This is an example of a technology that our descendants might uncover in the Biocene. In order to know what form to assume based on available resources and the context (fundamental constraints) of the system, SOFTEE’s brain would need to have access to a combination of a vast database of natural history and computational resources to extract insights and optimize the data for a given situation. This requires efficient data science to replace brute-force simulations and modeling. The data science (including artificial intelligence) would in turn be influenced by natural cognition and information processing. The outcome of these philosophical speculations is that a platform or design system is required which enables the integration of data science tools, natural history and human technology. Periodic Table of Life (PeTaL) is a concept that attempts this integration.
Biomimesis is an amalgam of the Greek words bios (life) and mimesis (imitation) meaning imitation of life. The concept of biomimetics was originally developed by Otto Schmitt, with Jack Steele coining the term bionics (Greek for like life) at Wright-Patterson Air Force Base in Dayton, Ohio [6]. Figure 2 shows a timeline with important events that relate to the development of biomimesis as we know it. Given the close ties between aerospace and biomimicry, some key milestones in the attainment of human flight are noted. The chronology of events denoted by ‘~’ is uncertain while events with a ‘?’ denote events that are hypothesized or that have some degree of uncertainty associated with them. These events and times may eventually be resolved with some certainty as technology from various disciplines begins to permeate anthropology, paleontology and related disciplines, enabling more accurate and highly resolved investigations into our history. Ontology, a crucial part of philosophy, is the study of the nature of existence, the classification of things within existence and their relationships. An ontology would be the backbone of any tool that seeks to organize nature. The two main ontologies in human history have involved materialism and idealism. Materialism propounds that all things in nature are composed of matter and that the interaction of matter at various levels leads to mental and other non-physical effects. Idealism on the other hand contends that the mind or consciousness is the source of all existence. Such topics are fundamental to our understanding of nature, because they determine how we relate the ‘things’ or organisms and their interactions with the world around them. In this work, we take the materialistic standpoint in constructing an ontology of nature, assuming that an idealistic view may include such a materialistic model as a subset. Regardless of ontological standpoints, we have noticed that humans have made giant strides in understanding their history and in developing technology to navigate the universe we perceive ourselves to exist in.
Using nature for inspiration is a concept that has persisted from antiquity to the time of da Vinci, (who is generally credited as the first true practitioner of biomimetics) over a span of more than 4000 years. In that time, human dance borrowed from nature’s mating rituals or nature’s patterns. Examples abound in Native American culture and pagan rituals [7]. Martial arts through the ages borrowed heavily from nature to teach humans defensive and offensive techniques [8]. This started as a form of exercise in the 300 BCE timeframe in China. The ancient Chinese created kites in around 500 BCE [9] by mimicking birds or leaves and initially used them for play. Kites were created using fabrics on a frame structure presumably inspired by leaves and used for both military and civilian applications with bowlines added for stability. There are several recorded instances of tower jumping where individuals either voluntarily or through coercion leaped of elevated structures with feathered wings. One such record is of an English monk in 1010 CE named Oliver or Elmer or Eilmer of Malmesbury [10]. He was inspired by the mythical feats of Icarus and Daedulus and leapt off a tower at Malmesbury Abbey. He broke both his legs but did survive the crash landing. Not so fortunate was Yuan Huangtou, son of a deposed Chinese emperor who was forced off a tower on a kite in 559 CE. While Yuan survived the kite ride, he was later executed. More recently, and less dramatically, Portuguese settlers in Brazil (~1578 CE) may have learned to use cashew nuts for food by observing Brazilian capuchin monkeys that cracked open the hard-shelled nuts [11,12]. Most of these examples of humans learning from nature or lifeforms in particular were limited to mimicry of form. Leonardo da Vinci was the first recorded person to study life forms and to attempt to understand the principles by which they work. Thus, he produced inventions that deviated significantly from nature but were still inspired by it. This philosophy would later come to be known variously as bionics, biotechnik, biomimetics or biomimicry [13]. While practitioners have existed since the days of da Vinci, the big change is in the rise of educators and entrepreneurs who are promoting biomimicry in a holistic sense, from kindergarten through to employment opportunity. Even so several deficiencies remain. Some of these are addressed in the following sections. First, we examine some of the common misconceptions prevalent even in the biomimetic/biomimicry community. Then, we explore areas that have not been widely researched within the biomimetic field or that are considered distinct from biomimicry.

2. Misconceptions, Cautions and Opportunities

  • Life supports life or life supports conditions for life. There are many ways to interpret this statement. It is possible that an organism may inflict harm on another organisms, but that this is in fact a benefit to the larger ecosystem. An example of this is predation. Predation is beneficial to the predator because it provides an energy source. It keeps the population of prey in check and thus ensures ecosystem stability. If the rate of predation is too large this stability is no longer viable.
  • There is no waste in living systems and a corollary, all elements of a living system must have a purpose. The obvious exceptions are spandrels [14]. Spandrels are remnants from adaptations that may not have an obvious function. These may eventually turn out to be exaptations given a change in the external ecosystem. An example of this is the development of vectored ejection of noxious fluids by bombardier beetles [15] that could have resulted from the chemicals used in producing its exoskeleton.
  • Trade-offs are always the best way to identify solutions inspired by nature. Trade-offs are inevitable in any optimized design given a fixed set of resources [16,17]. An increase in one performance metric must result in a reduction of another assuming that the performance has been optimized globally. To apply trade-offs to natural systems we must assume that they are optimized in some manner. If not, trade-offs, the way engineers use them in a biological context:
    • Do not necessarily comport with the laws of logic, namely, given that there exists a claim p, then
      • Either p or “not p” must be true
      • p and “not p” cannot both be true
      • there are no other options other than p and not p.
      The statement p would take the form “denticles reduce drag on shark skin”. This does not imply that “denticles increase mass on shark skin” or “denticles reduce shark life”. These may very well be true, but there is no evidence that this is a general law. Energy and material may trade among numerous functions and one may not in fact see trade-offs between two variables that trade a particular quantity, because there are more than two functions trading that quantity. For human systems, by design, we have introduced trade-offs given the limitations of available energy, cost and resources to build and therefore, these trade-offs are an appropriate method of assessing systems or proposing solutions. In nature, trade-offs are more dynamic and comparing trade-offs amongst multiple species requires a way to scale from one species to another. This does not mean that trade-offs are not useful as an innovation tool. To go beyond suggesting solutions, we must define the quantity being traded (e.g., energy), the resulting functions that trade the quantity or quality (e.g., swim speed, turn radius, target tracking precision, body mass) and ensure that these are the only functions (or the major functions) involved in trading the quantity.
    • Assume linearity in trades—given that we have the complete set of contradictions over which quantities such as energy or matter are traded, we assume that an increase in one, necessarily correlates with a decrease in the other. They are thus only a reflection of our understanding of biology in an engineering context and may not help us develop multifunctional systems without additional data.
    • Can be used for a relatively (to the number of species available) limited (but large in number) class of problems. There are some organisms and living systems that do in fact show clear trades between two functions [18,19] such as speed and accuracy. This does not mean other functions are not varying, but rather that these are the primary functions involved in trading the particular quantity.
    • Multivariate trade-offs, by virtue of being a necessary feature of optimized systems, are a great way of characterizing multifunctional ideas such as structural heat exchangers or social strategies such as leadership. In nature, leadership takes many forms. The alpha male in a group of chimpanzees may show more empathy toward others, favor egalitarianisms and objectivity in disputes. At the same time, populations may give the leader or dominant individual(s) a majority of food or other resources in exchange for protection. The two scenarios seem contradictory. However, if viewed through the lens of context they make sense. As the population (team) becomes more stable with fewer threats from the organization or environment, leadership is more about getting the most out of the team. If the team is focused mostly on self-preservation, then it makes sense for the team to invest in defensive capability (by feeding the dominant individuals for example). This is an example of a trade-off between progressive and conservative values that depend on the perceived or real stability in the environment.
  • Biological systems are tending toward some optimal or best design. In reality, there are numerous examples of features that are clearly not optimal, but are not fatal and thus persist. Some examples of these are:
    • Adaptations can be reversed. The Inaccessible Island Rail (Atlantisia rogersi) is the smallest extant flightless bird [20]. Atlantis elpenor, Aphanocrex podarces and Atlantisia rogersi are believed to have shared a common ancestor that was blown to isolated islands where all three species evolved into flightless birds. The Island rail lacks mammalian predators and thus flight is not selected for. In fact, reducing flight muscle size results in energy savings. In addition, the bird has low basal metabolic rate. Evidence thus points to an adaptation that was once useful but is no longer necessary and might actually be a waste of energy.
    • Context is key. Adaptations are based on the history of the system and thus, even successful adaptations are not optimal. An example is the human optical system [21].
    • For the greater good: Some adaptations are not particularly beneficial to the individuals or the species itself, but do result in benefits to the super system. Squirrels burying nuts results in wasted energy. However, the nuts that are not found result in new trees. Ants forming an ant bridge do not all survive, but this emergent behavior is beneficial to the ant colony.
    • Adaptations favor short term gains: While successive selection pressures may eventually lead to a robust set of adaptations, no particular adaptation is suited to long term benefit [22]. Clune et al. [22] used digital simulations to show that natural selection preferred mutation rates that were suboptimal in the long run.
    • There are other areas of philosophical conflict such as the differences and similarities between bio-utilization and biomimicry. In one sense, bio-utilization, or the use of biology directly in technology can be thought of as the most sustainable form of biomimicry. For example, recreating the earth’s ecosystem on another planet to minimize the use of terrestrial technology would save on energy and mass of raw materials that need to be sent off-world. In another sense, bio-utilization such as the use of leather or other animal products may require the use of large quantities of water energy for processing and are associated with ethical questions. In this case bio-utilization is not sustainable. Thus, the question is not so much about terminology but about sustainability.
Given 3 and 4, it is unclear that there is a clear way to determine how to understand whether a given model organism is ‘worth’ emulating. It may not have been through sufficient selection pressures to lead to an optimized system or it may be burdened by constraints that render it unable to adapt to rapidly changing environments. Our judgement of biology may be clouded by our relative immaturity in the geological timescale, both past and future. We may be on a technology curve where many human solutions are inferior to biological solutions. However, both may be suboptimal and the task of biomimetics may be to speed up our ascent on the curve to some future state by using our existing knowledge of the natural world as a training data set for artificial intelligence that will use advanced computing to synthetically evolve natural and human solutions.

3. Expanding Our Domain of Inquiry

3.1. Physioteleology

Seeking inspiration and mimicking the natural processes that lead to the ‘life goal’ or the sustainability of life. It may be possible to determine a function, goal or strategy underlying biological processes or natural systems (as opposed to individual organisms or organs). This is termed physioteleology (study of the purpose of nature). There are two aspects to this. The first aspect is closely coupled to abiogenesis or the origin of life from non-life, namely, is there a tendency for systems to become life-like? This question is arguably more suited to philosophical consideration given the lack of data available to evaluate any hypotheses that may be made. The second has to do with comparing the relative ‘fitness’ of two or more biological models or systems. This aspect is more suited to scientific examination. To distinguish this metric from evolutionary fitness, we may call it biomimetic fitness or bio-fitness. The criteria may be applied for an organism or parts of the organism (organs, tissues, and patterns on the organism such as branching structures or plates or spirals). Depending on the type of problem we are solving and the models under consideration not all criteria may be applicable. This is especially true for non-living systems, such as rivers or galaxies, that nonetheless exhibit patterns such as branches and spirals respectively, that are also seen in living systems. Criteria for evaluating bio-fitness may include:
  • Longevity of species, L (years): The average lifespan of a species is between 1 and 10 million years [23]. For mammals, the average is 1 million years. If a species survives longer than this time it is reasonable to expect that it has survived minor climatic variations, ecosystem pressures or competition from other species adapted to its environment. Examples of this are living fossils such as goblin sharks (origin in fossil records 125 Mya) or horseshoe crabs (origin in fossil records 450 Mya) that have remained virtually unchanged over millions of years [24,25]. This criteria alone is not sufficient to evaluate the bio-fitness of an organism. Photosynthetic cyanobacteria for example, existed for billions of years but caused an oxygen crisis due to there not being any organisms to breathe oxygen. Thus, we may want to give the lifespan more weight if the total number of species alive at the time is large.
  • Longevity of adaptation, La (years): This metric would count the time a particular adaptation has existed, such as the eye, in a stable form. Adaptations that exist together within a given species may then be thought of as highly compatible and successful. An example is denticles on sharks.
  • Variation in genus, Vg (number of species in the genus): This is an indicator of the success of the general body plan, set of adaptations or morphology. A related criteria may be convergence.
  • Convergence, C (number of times a given body plan or feature has evolved independently): Computer vision may be used to create clusters of body plans. In the short term, it may be sufficient to identify genera and compare similar genera and note the number of species per genera as a metric.
  • Survival of extinction events, Next (number of mass extinction events survived in same geographic location): This may be an indicator of adaptability to large variations in climate, atmospheric composition, temperature, pressure or seismic events. The adaptations may be behavioral, such as being able to burrow or exist on the surface, or morphological, such as extremophiles that survive cosmic radiation.
    • Types of events and reasons for surviving
      • Adaptations that allow the species to survive drastic changes.
      • Sufficient geographic extent: Some members of species were wiped out but those in a different geographical location persisted. This would mean that survival was largely due to chance but having wide geographic extent is in itself a merit.
  • Evolutionary fitness, f: This is a measure of reproductive success of an organism and is characterized by absolute or relative fitness.
  • Ecosystem diversity and networking, Ed (number of species connected to a given species through food web or other interactions given Es, the total number of species in the ecosystem): This is an indication of the size of ecosystem supported and the number of connections within the ecosystem. For practitioners of biomimetics, choosing an appropriate model organism is useful to minimize contradictions between the system being designed and the inspirational model. The connections may be gleaned from an ontology that identifies connections between species through NLP (natural language processing) using sources such as Animal Diversity Web [26] or Encyclopedia of Life [27].
  • Ecosystem stability (temporal), Et (turbulence of the ecosystem or rms (root mean square) deviation form basal extinction rate): This answers the question of how the ecosystem reacts to change. Typically this is measured by global parameters such as biodiversity, but we could also study the individual components of an ecosystem to see how long the system has remained relatively unchanged (extinction rate of species that are part of the ecosystem). Eavg is the average life of an ecosystem.
  • Number of ecosystems supported, En: For the geographical range of a species, how many ecosystems does it support? Etot is the total number of ecosystems with overlap.
  • Scalability, S (Variance of spatial scales with 0 indicating high specialization and Smax being the maximum variance ever found in nature): For a species or pattern, this metric would indicate the morphological spatial scalability. This may be measured by relating the patterns that comprise the overall morphology to functions. The patterns in turn have mathematical rules that can be scaled. For example, the venation patterns on dragonfly wings may be characterized by angles, cell widths and thicknesses of veins. Given the knowledge of performance at different scales, one can determine what kind of design is required for thermal, aerodynamic and structural performance at a new scale. Given sufficient information, we may use nondimensional scaling parameters such as Reynolds number, Froude number and Biot number to display natural system information in a manner that is directly applicable to engineering application.
  • Suitability of a model may then be calculated by applying the formula:
    S m   =   L a × V g × f × C × E d × E t × E n × S L × V o × E s × E a v g × E t o t × S m a x  
This is not an exhaustive list of metrics, but as developers of biomimetic tools collect and organize data, this list provides a starting point for the type of data to collect and present to the user. The usefulness of a given species may then be evaluated as a function of these metrics. As the performance of bio-inspired products is characterized, we may refine the functional relationship between the metrics and bio-fitness. Table 1 shows some examples of these metrics with data obtained from Wikipedia [28], Animal Diversity Web [26] and other sources [29,30,31,32,33] referenced in the table. Data is shown for polar bear fur and for Gentoo penguin feathers along with data science methods that may be needed to obtain the data. By having knowledge of the pattern (branching) that enables the function (insulation), the environmental conditions associated with the function (temperatures, pressure etc.) and the scaling parameters that govern the function, we can view a range of natural system solutions as a function of environment. As an example, we can discern that high flapping frequency and amplitude are a hallmark of flight for small birds and insects, while low frequency and amplitude are associated with the flight of larger birds [34]. Furthermore, the flapping mechanisms are different for the two cases. Figure 3 shows a sketch of some possible ways in which data may be viewed to gain engineering insight. We may plot functions against mechanisms and patterns or functions against biomes and metrics. When multiple functions are plotted against each other for a known overall resource constraint, we can observe trade-offs and obtain a response surface. We may then select a point on the response surface to understand what patterns lie in that region and what mechanisms are associated. The labels for patterns such as tiles, branching and spiral are associated with numeric values (1, 2, 3…) such that they are amenable for plotting against quantitative data. If we are attempting to design a multifunctional structure for thermal management for example, we might be interested in natural systems (such as the vascular system of a penguin) that are primarily engaged in functions related to thermal management (transport of fluid, conversion of energy, minimization of convection etc.), but we also want to know the structural properties of the responsible system (what stresses can be withstood by the arteries and veins?). If we find a region on the response surface with a suitable distribution of strength and thermal conductivity, we can then look at the scalability of the system. In the sketch shown in Figure 3, branching structures appear to show scalability. We can then discern the mechanism and apply the topology to our engineering problem and optimize it using genetic algorithms or topology optimization. We should also note that in nature there is significant variation in the dimensions of features even within a single organism. For example, the leaves of a tree or the size of scales on a snake. With new manufacturing methods such as additive manufacturing and synthetic biology, and new materials and structures such as ceramic matrix composites (CMCs), is it possible to design products that use the inherent variation in the processes or materials as a feature rather than picking a mean or optimal? This is an open question, but the intent of PeTaL is to support such design and to investigate the applicability of this hypothesis through application to model problems such as design of a simple heat exchanger.
It is also possible to identify adaptations that are compatible using this approach. These compatible adaptations may then be morphed into one design. For example, a wing with overlapping ‘feathers’ that possesses a microstructure with superhydrophobicity, thus combining the features of penguin feathers and the structure of a lotus leaf.

3.2. Anthropomimesis

Seeking inspiration from our hominin ancestors including prehistoric hominins (not merely Homo sapiens).
Our human ancestors (not merely Homo sapiens) should be considered as biological models especially when considering processes such as urban development, sanitation and food systems. This is termed anthropomimesis (learning from hominins). While modern humans evolved from primates as the result of a slow and gradual change over the last 2 million years, a few key events marked our divergence from the behaviors of other organisms on this planet. These include the discovery of fire, language, the agricultural revolution, the first and second industrial revolutions, and more recently, the digital revolution. Each of these allowed humans to take control of their environment and decoupled the feedback between evolutionary fitness and adaptations to the environment. In ancient times, humans used dendriforms in architecture [35]. The use of these branching structures for structural support rather than aesthetics diminished in the medieval period due to the readily available high strength materials of modern manufacturing such as cement, iron and steel. Cities in the desert used radiative sky cooling [36] to create ice in the absence of freezers, Igloos maintained acceptable temperatures inside them even in the frigid arctic. Practitioners are now returning to these ancient techniques while using the advanced manufacturing and materials that we have developed to save resources and minimize the impact on the environment.

3.3. Paleomimesis

Seeking inspiration and mimicking extinct lifeforms and ecosystems as inspiration for modern problem solving.
Humans should consider using extinct lifeforms and ecosystems as inspiration for modern problem solving. This is termed paleomimesis (mimicking or learning from the past). Life has survived numerous extinction events separated by millions of years. Organisms can only evolve within the framework of conditions that are available to them. Adaptations to deal with extinction events such as asteroids, mega-volcanoes or sudden and drastic climate change are thus not an obvious evolutionary shortcoming on small timescales. The organisms that go extinct are not necessarily less ‘fit’ than the ones that survive except that they may lack fortuitous adaptations that may allow them to weather a particular climatic change or random proximity to volcanoes, earthquakes or celestial disturbances. One can compare the venation of extinct Meganeura [37] with extant dragonflies and simulate the aerodynamic and structural properties of each. Phenomena such as gigantism, dwarfism and globally rare species afford researchers an opportunity to study scaling laws. In the case of a dragonfly wing for example, we look at the variation in vein cells with size and support this analysis with computations.
While looking for solutions to problems that do not need to take into account dramatic events, it is justifiable to look at all life for inspiration and not merely the ones that survive in the Holocene. Moreover, the periods between each extinction event harbor unique ecosystems, geographical and atmospheric adaptations that could apply to technology for harsh environments on earth and beyond. It is sometimes difficult to deduce the behavior and function of extinct creatures from their fossils alone but comparisons to similar living organisms could provide the link between extinct form and modern function.
Using modern simulation tools and through controlled testing, it is possible to simulate artificial environs and to create new ecosystems and evolutionary traits that may be of benefit to extraterrestrial exploration and terrestrial problems such as energy and resource conservation. This approach does not require a separate terminology and falls under the current definition of biophysics or artificial evolution. Several efforts are underway to understand the relationship between genotype and phenotype. It may thus, eventually, be possible to use a DNA sequence library as a database for biomimetics. In some cases synthetic biology might be appropriate and we would bio-utilize, while in others, the existing genotype would inform technical design.

4. PeTaL (Periodic Table of Life)

4.1. Intent of PeTaL

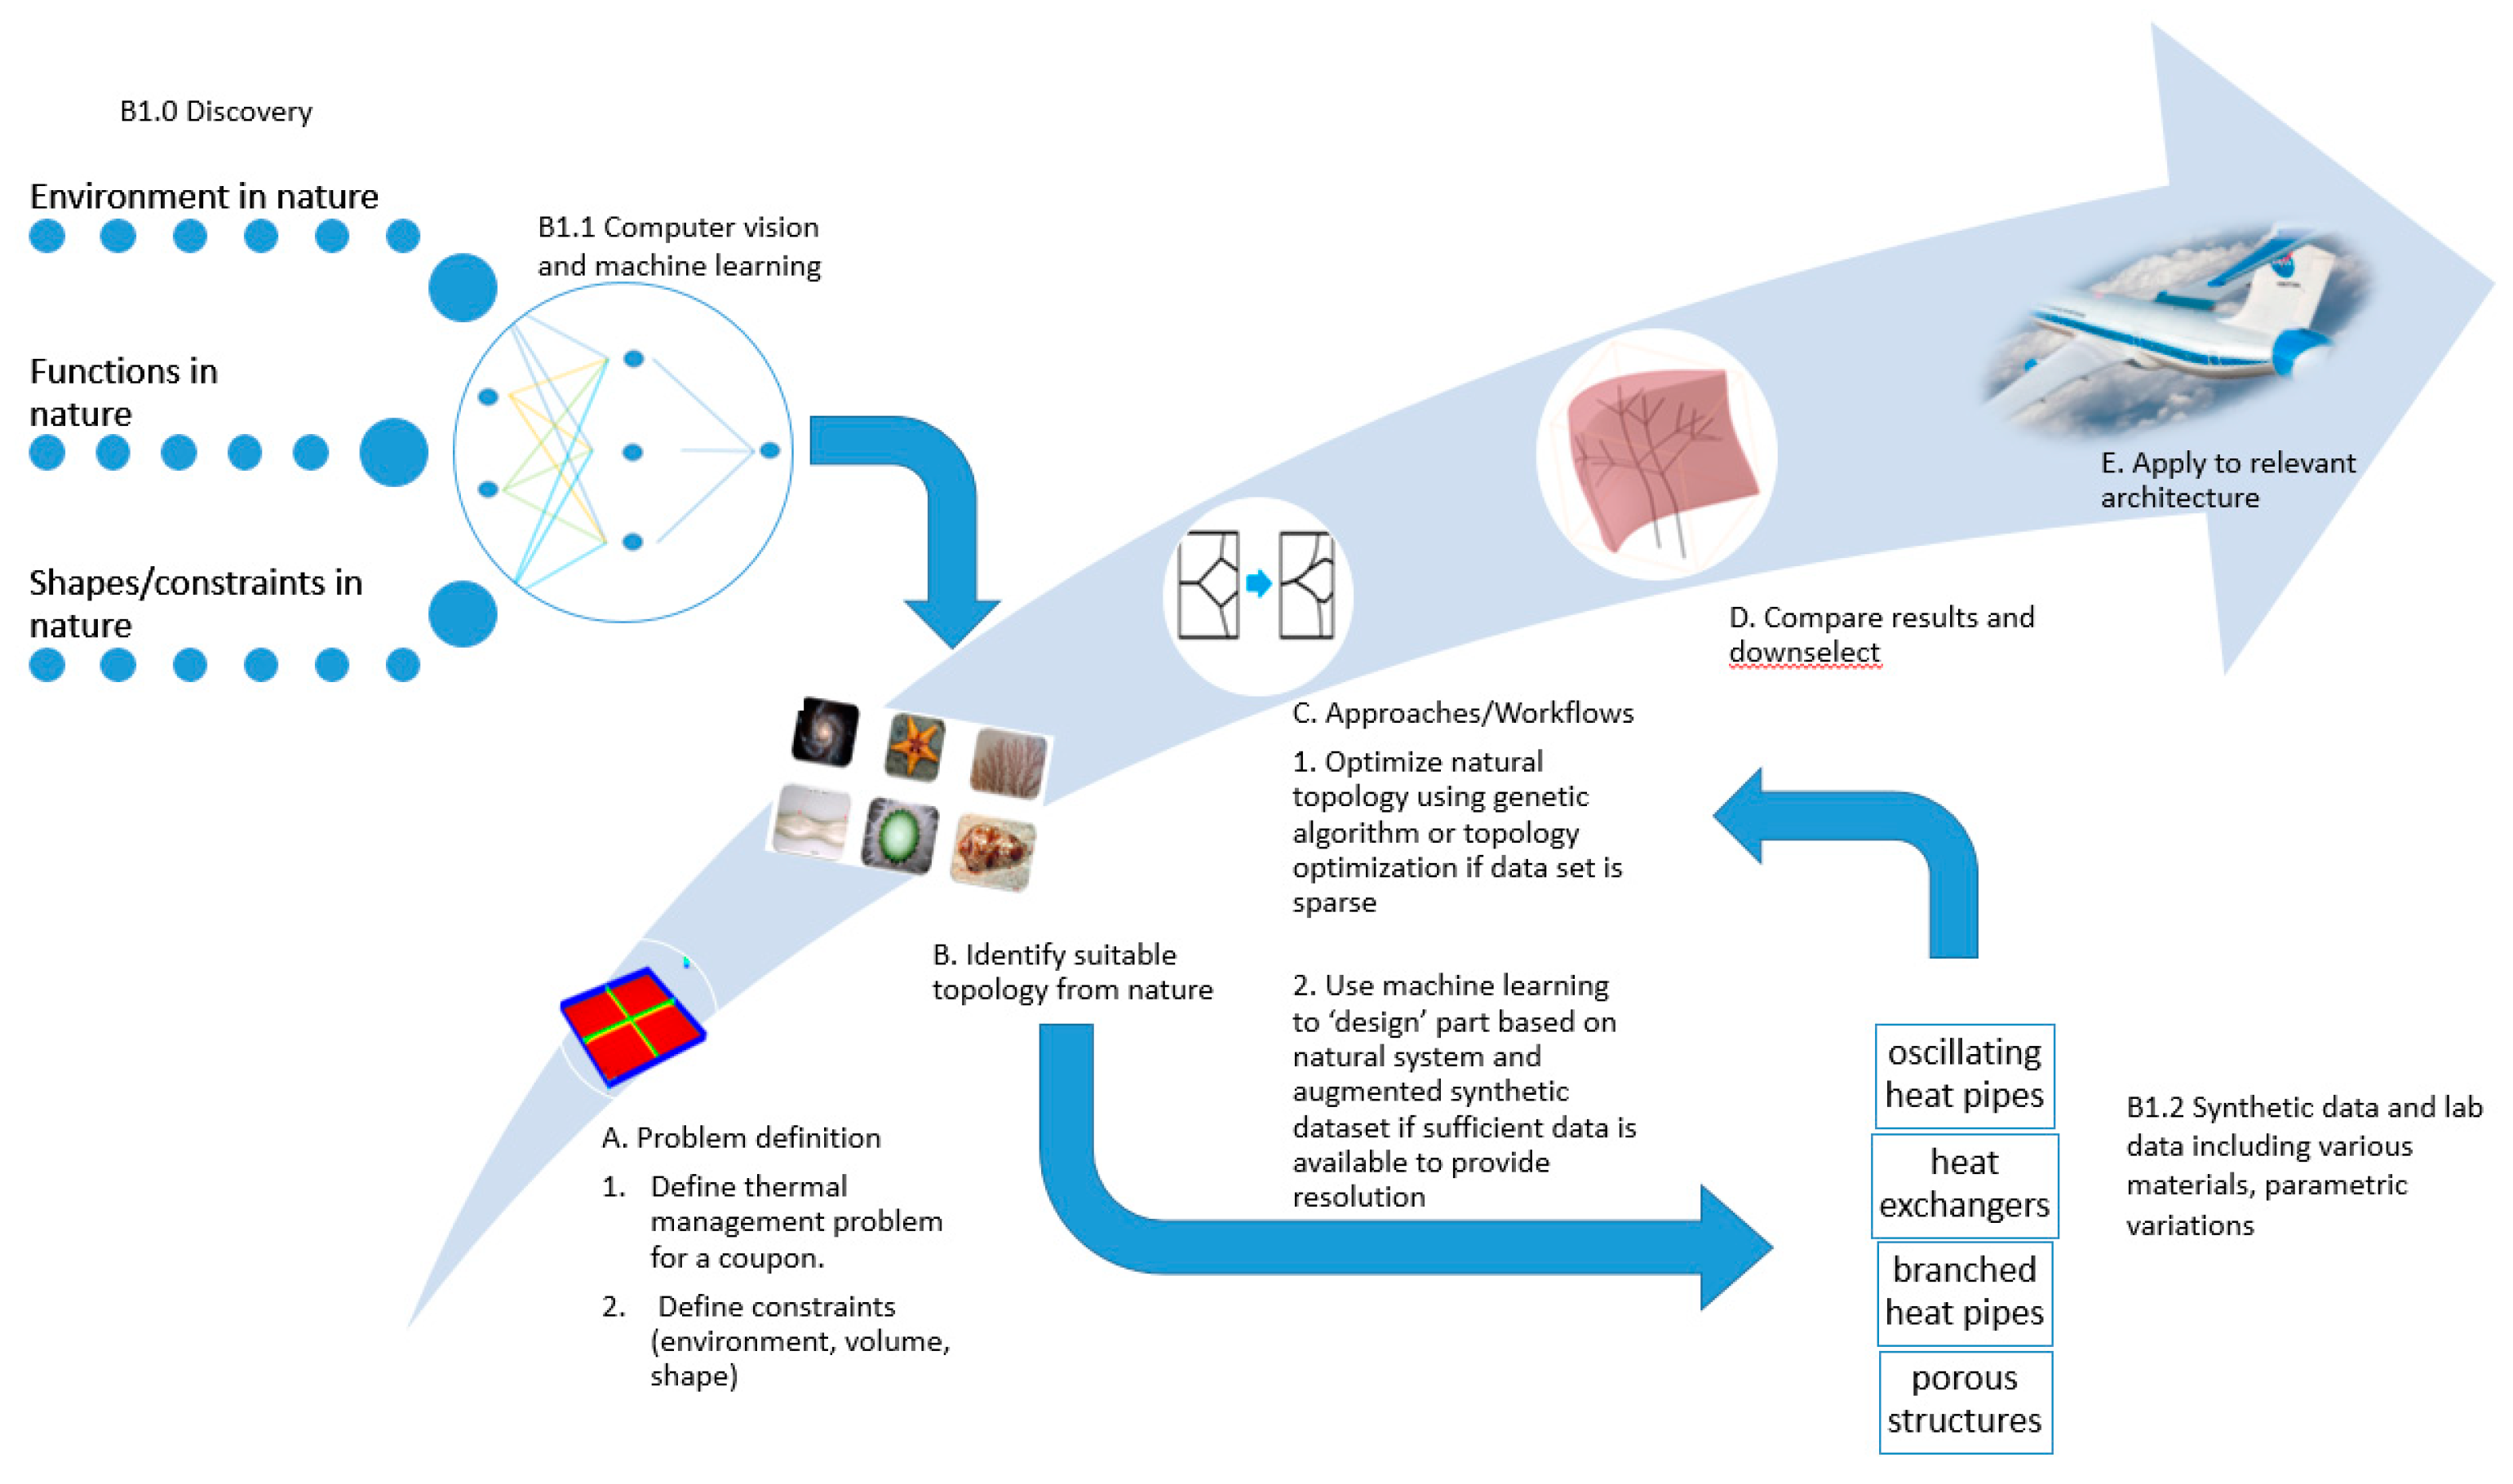
An example is shown below of a thermal management problem in aerospace. Given a control volume and boundary conditions, what is the minimum material that needs to be used to allow Q watts to be dissipated while withstanding σ
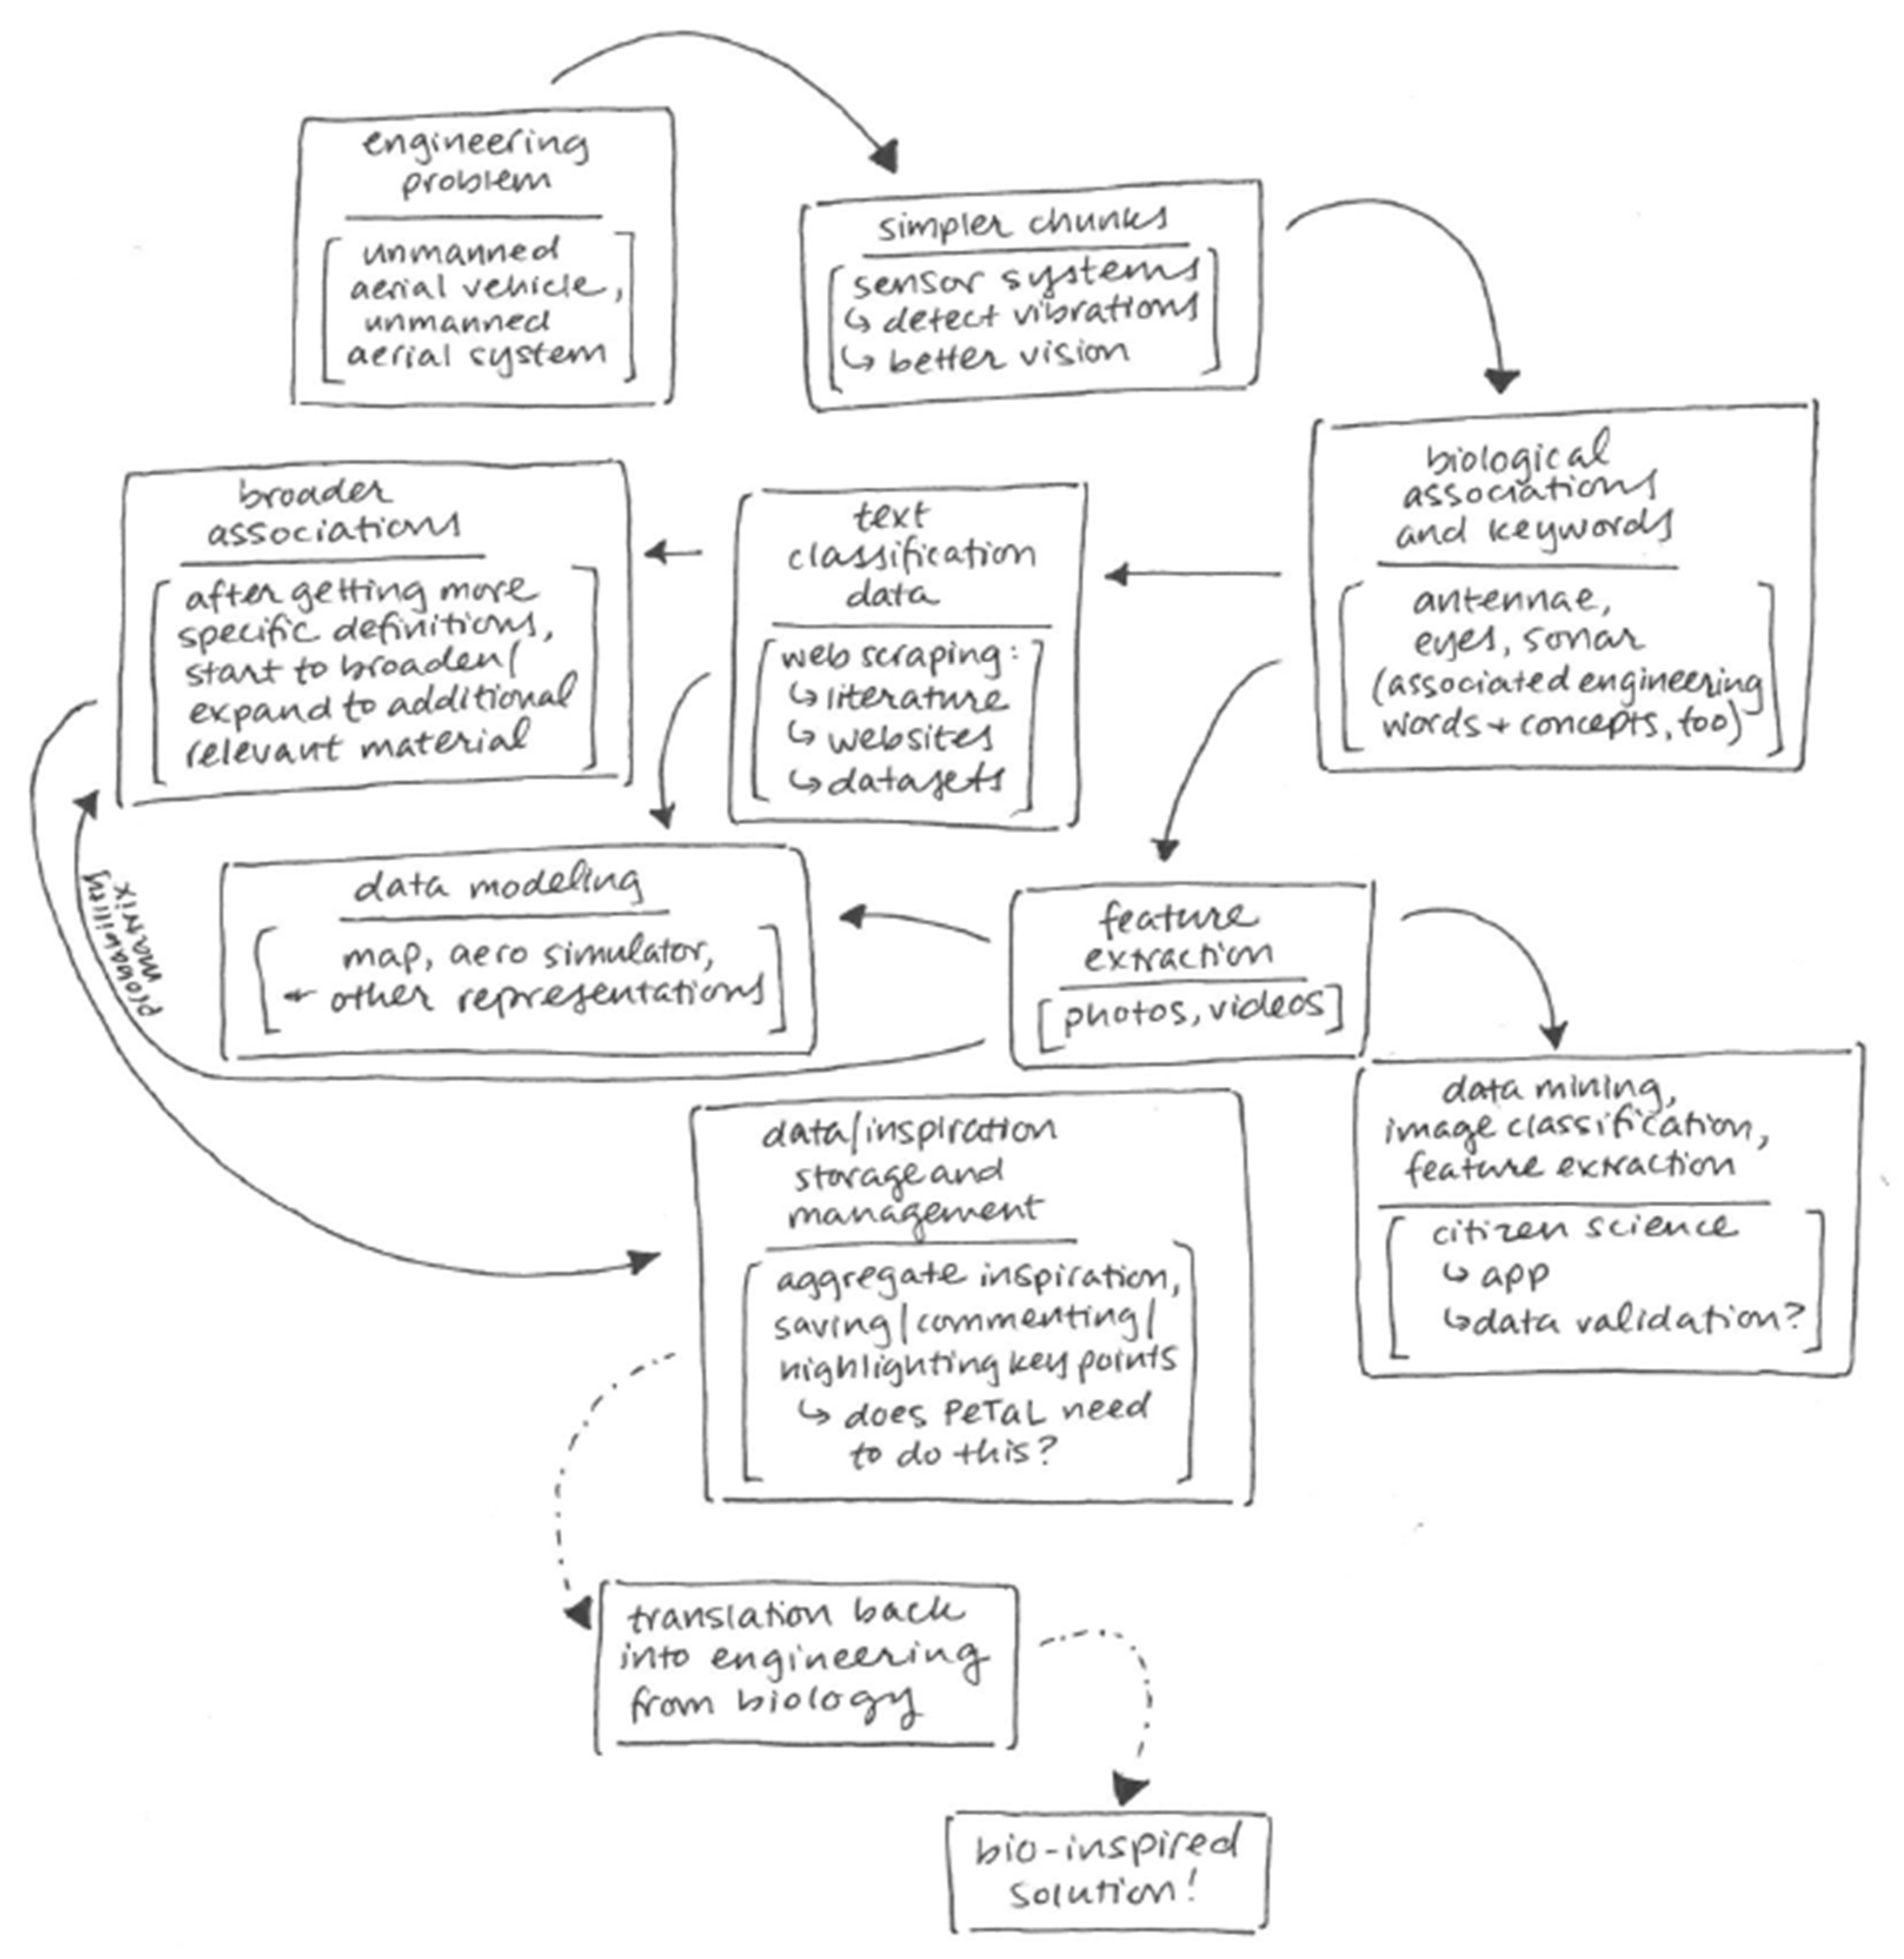
x Pa of loading? There are natural systems and adaptations that deal with the distribution of fluids (rivers, trees, sponges), thermal management (pores on leaves, vascular systems), and managing structural loads (hierarchical structures, lattices, honeycombs). There are also human solutions to these challenges such as heat pipes or photovoltaics and materials with properties vastly different from those found in nature such as silicon carbide composites that can withstand 3000 F. The key to solving the problem is linking the patterns and mechanisms (or principles) in nature to the materials and processes available to humans. In some cases, we may discover new process and add these to our ‘human toolbox’. This may be done for a specific component or a group of components (system). The challenge with large systems is to identify appropriate analogies in nature (living or otherwise) by identifying entities, connections and the flow of resources between the entities. Abstractions of specific mechanisms allows for the learning of principles from natural history. There are numerous approaches that may be used so we show one here as an example. One way to design a system would be to find inspiration from nature and then apply human materials and technology to scale the natural system model. This would entail knowing the design requirements, having access to sources of knowledge (journals, the internet or databases), being able to abstract the requirements and connecting them to the contents of the sources of knowledge, extracting insights and being able to implement these insights. Such a process is shown in Figure 4.
The problem solving methodology, shown in Figure 4 is the following:
(a)
Problem definition
  • Identify a set of words or phrases (topics) relevant to the field (not exhaustive): distribution, generation, management of heat, energy, stress, convection, conduction, cooling, heating, evaporation, condensation. These terms form the basis for searching articles in the literature, patents, blogs or books. Ideally, these words themselves are connected in a ‘bag of words’ to related terminology to broaden the search and reduce the burden on the user.
  • Define the problem as a set of goals (minimum heat flux, maximum stress and minimum weight), boundary conditions (temperature, pressure, humidity, volume) and constraints (gravity, material must be continuous and supported, properties must exist in the natural world).
(b)
Identify possible models based on historical work
  • Human generated literature
    i.
    Patents, literature: Use NLP (natural language processing) to identify articles related to the problem at hand through search terms related to the problem. The objective is to uncover solutions that have direct implementation, data that may be used to train models, or literature that identifies human technology (heat pipes, pulsating heat pipes, pins, heat exchangers, fluidic devices, cooling schemes for turbines, anti-icing technology) that may be further investigated thought the generation of synthetic data.
  • Natural databases: The objective is to identify strategies in nature that enable solutions to the problem at hand. In the case of thermal management, one would search for articles that discuss distribution, generation, management of heat, energy, stress, convection, conduction, cooling, heating, evaporation, condensation. These terms form a word cloud. If articles from the literature are already classified or clustered into word clouds, then the search is greatly simplified. This may be done through the use of a search tool that translates user search terms to biology or through algorithms that find occurrences of noun, verb, noun combinations that represent function, object, and environment. Sources may include:
    ii.
    natural data sets such as Encyclopedia of Life, iDigBio, Wikipedia provide general information on organisms.
    iii.
    research data and information that may be gleaned from publications such as the Journal of Experimental Biology.
(c)
Based on the models identified, identify the structure, pattern or mechanism associated with the specific function(s) being performed by the model (whether natural or human-made). For example, given tuna, penguins, toucan bills, falcon wings as models, we would identify that a vascular system or loop-like system should be considered with a hierarchy of diameters, branches and lengths for a set of structural, weight and heat exchange requirements.
  • Unsupervised learning (clustering or topic modeling for example) may be used to determine the parameter set associated with the environment we are designing for. Due to the sparse nature of most data available today, we may only be able to glean qualitative trends such as ‘more branches on the heat sink’ or more layers leads to increased heat flux. This may lead us to design a counter current heat exchanger system with parameters derived from a model that is most suitable. We may also see that certain types of thermal management solutions co-occur with a certain type of structure.
  • Synthetic data sets may be generated based on the patterns found in nature to train machine learning algorithms that can provide insights into the relationship between form and multiple functions.
  • Optimization may be conducted to customize the structure to meet a specific distribution of objectives.
(d)
Down-select by comparing metrics (weight, heat flux, structural loads) to reference architecture or goals.
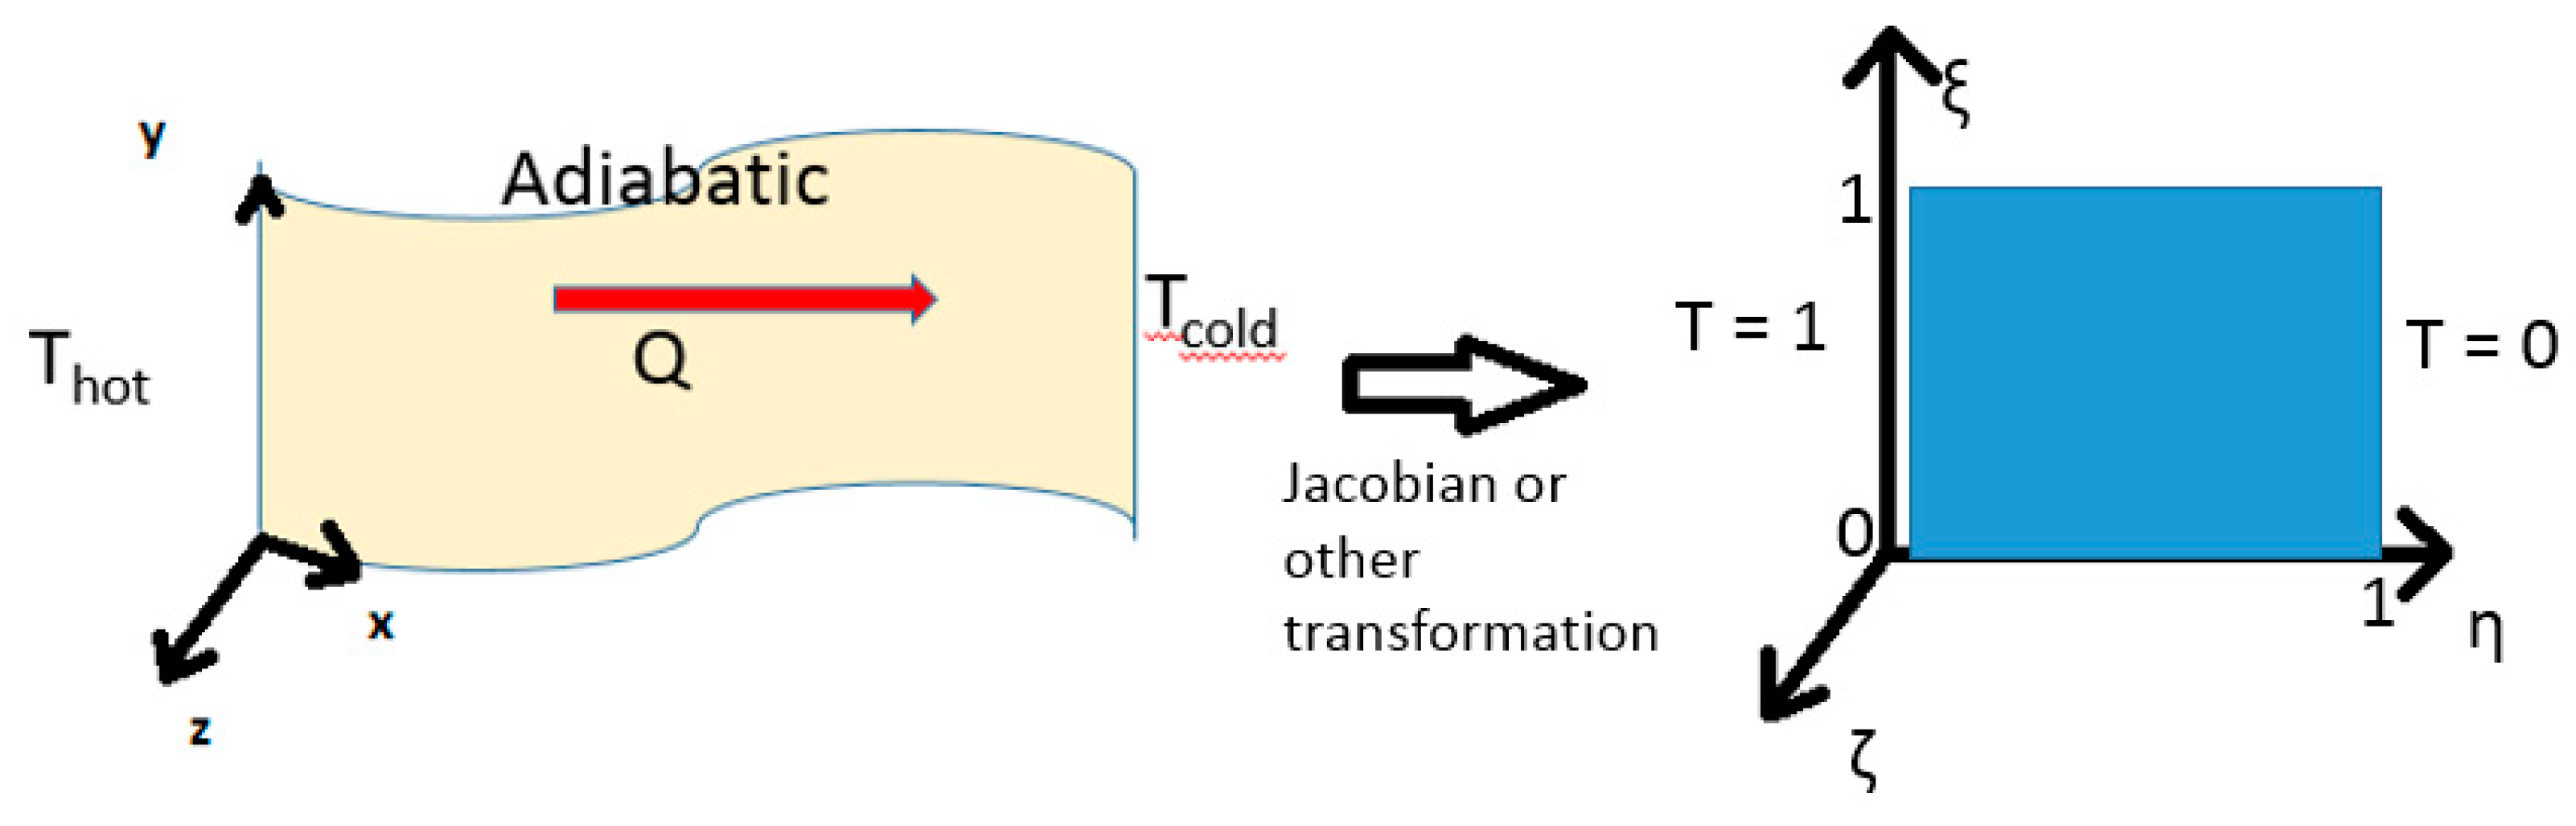
Scaling a solution from nature is difficult without an understanding of physics. This is where machine learning or artificial intelligence can play a role (step 6 above). By training machine learning algorithms to understand the relationship between form and function we can assess the performance of biological form using synthetic materials. We can also use mapping techniques to transform arbitrary 3D volumes to normalized domains (Figure 5). These normalized domains may then be populated with natural forms such as branches or lattice structures. First, topologies must be parameterized. For example, a branching structure may be represented as angles, a primary thickness, ratio of lengths, ratios of thickness, number of fins per unit area, and roughness. These parameters would exist across length scales from the macro (diameters), the micro (roughness) and the nano (porosity). Another key parameter that should be noted is the functional degrees of freedom of the structure or process. Functional degrees of freedom (FDOF) are the mechanisms by which the structure or process may be flexible to accomplish objectives beyond that of the original structure. For example, the lid of a coffee cup from Starbucks® does not seal the cup merely by seating it over the cup. It requires the user to flex the lid and snap it into place. The FDOF here would be flexibility or sealing effectiveness and is driven by the modulus of elasticity of the material. This is the kind of data that researchers should store in databases that are intended for use in bio-inspired design. The data should be normalized across the entire dataset for scalability. For example, when creating a dataset of dragonfly wings, the largest and smallest chords, spans, Reynolds numbers etc., should be used to scale the data rather than any individual parameter.
A hybrid approach may be used that couples machine learning and topology optimization. Machine learning can be used to determine grid densities locally in a domain that is to be optimized using a high fidelity method such as topology optimization. The domain might be meshed with individual cells being marked for grid refinement. Once intelligent adaptive gridding is accomplished, topology optimization may proceed at significantly reduced cost. It is also possible to use a purely machine learning approach. We may train Bayesian classifiers or neural networks on selected biological models to understand relationships between the distribution of geometric coordinates, (x, y, z) and performance (specific power, pressure drop) as a function of material properties and environment (boundary conditions). A combination of natural system data, industry data including healthcare, automotive, aerospace and synthetic data may be used to ‘teach’ physics to the algorithms. The intent of PeTaL is, thus, not to serve as a purely bio-inspirational tool, but rather to link human and biological ontologies through machine learning and advanced computing to directly provide engineering solutions.
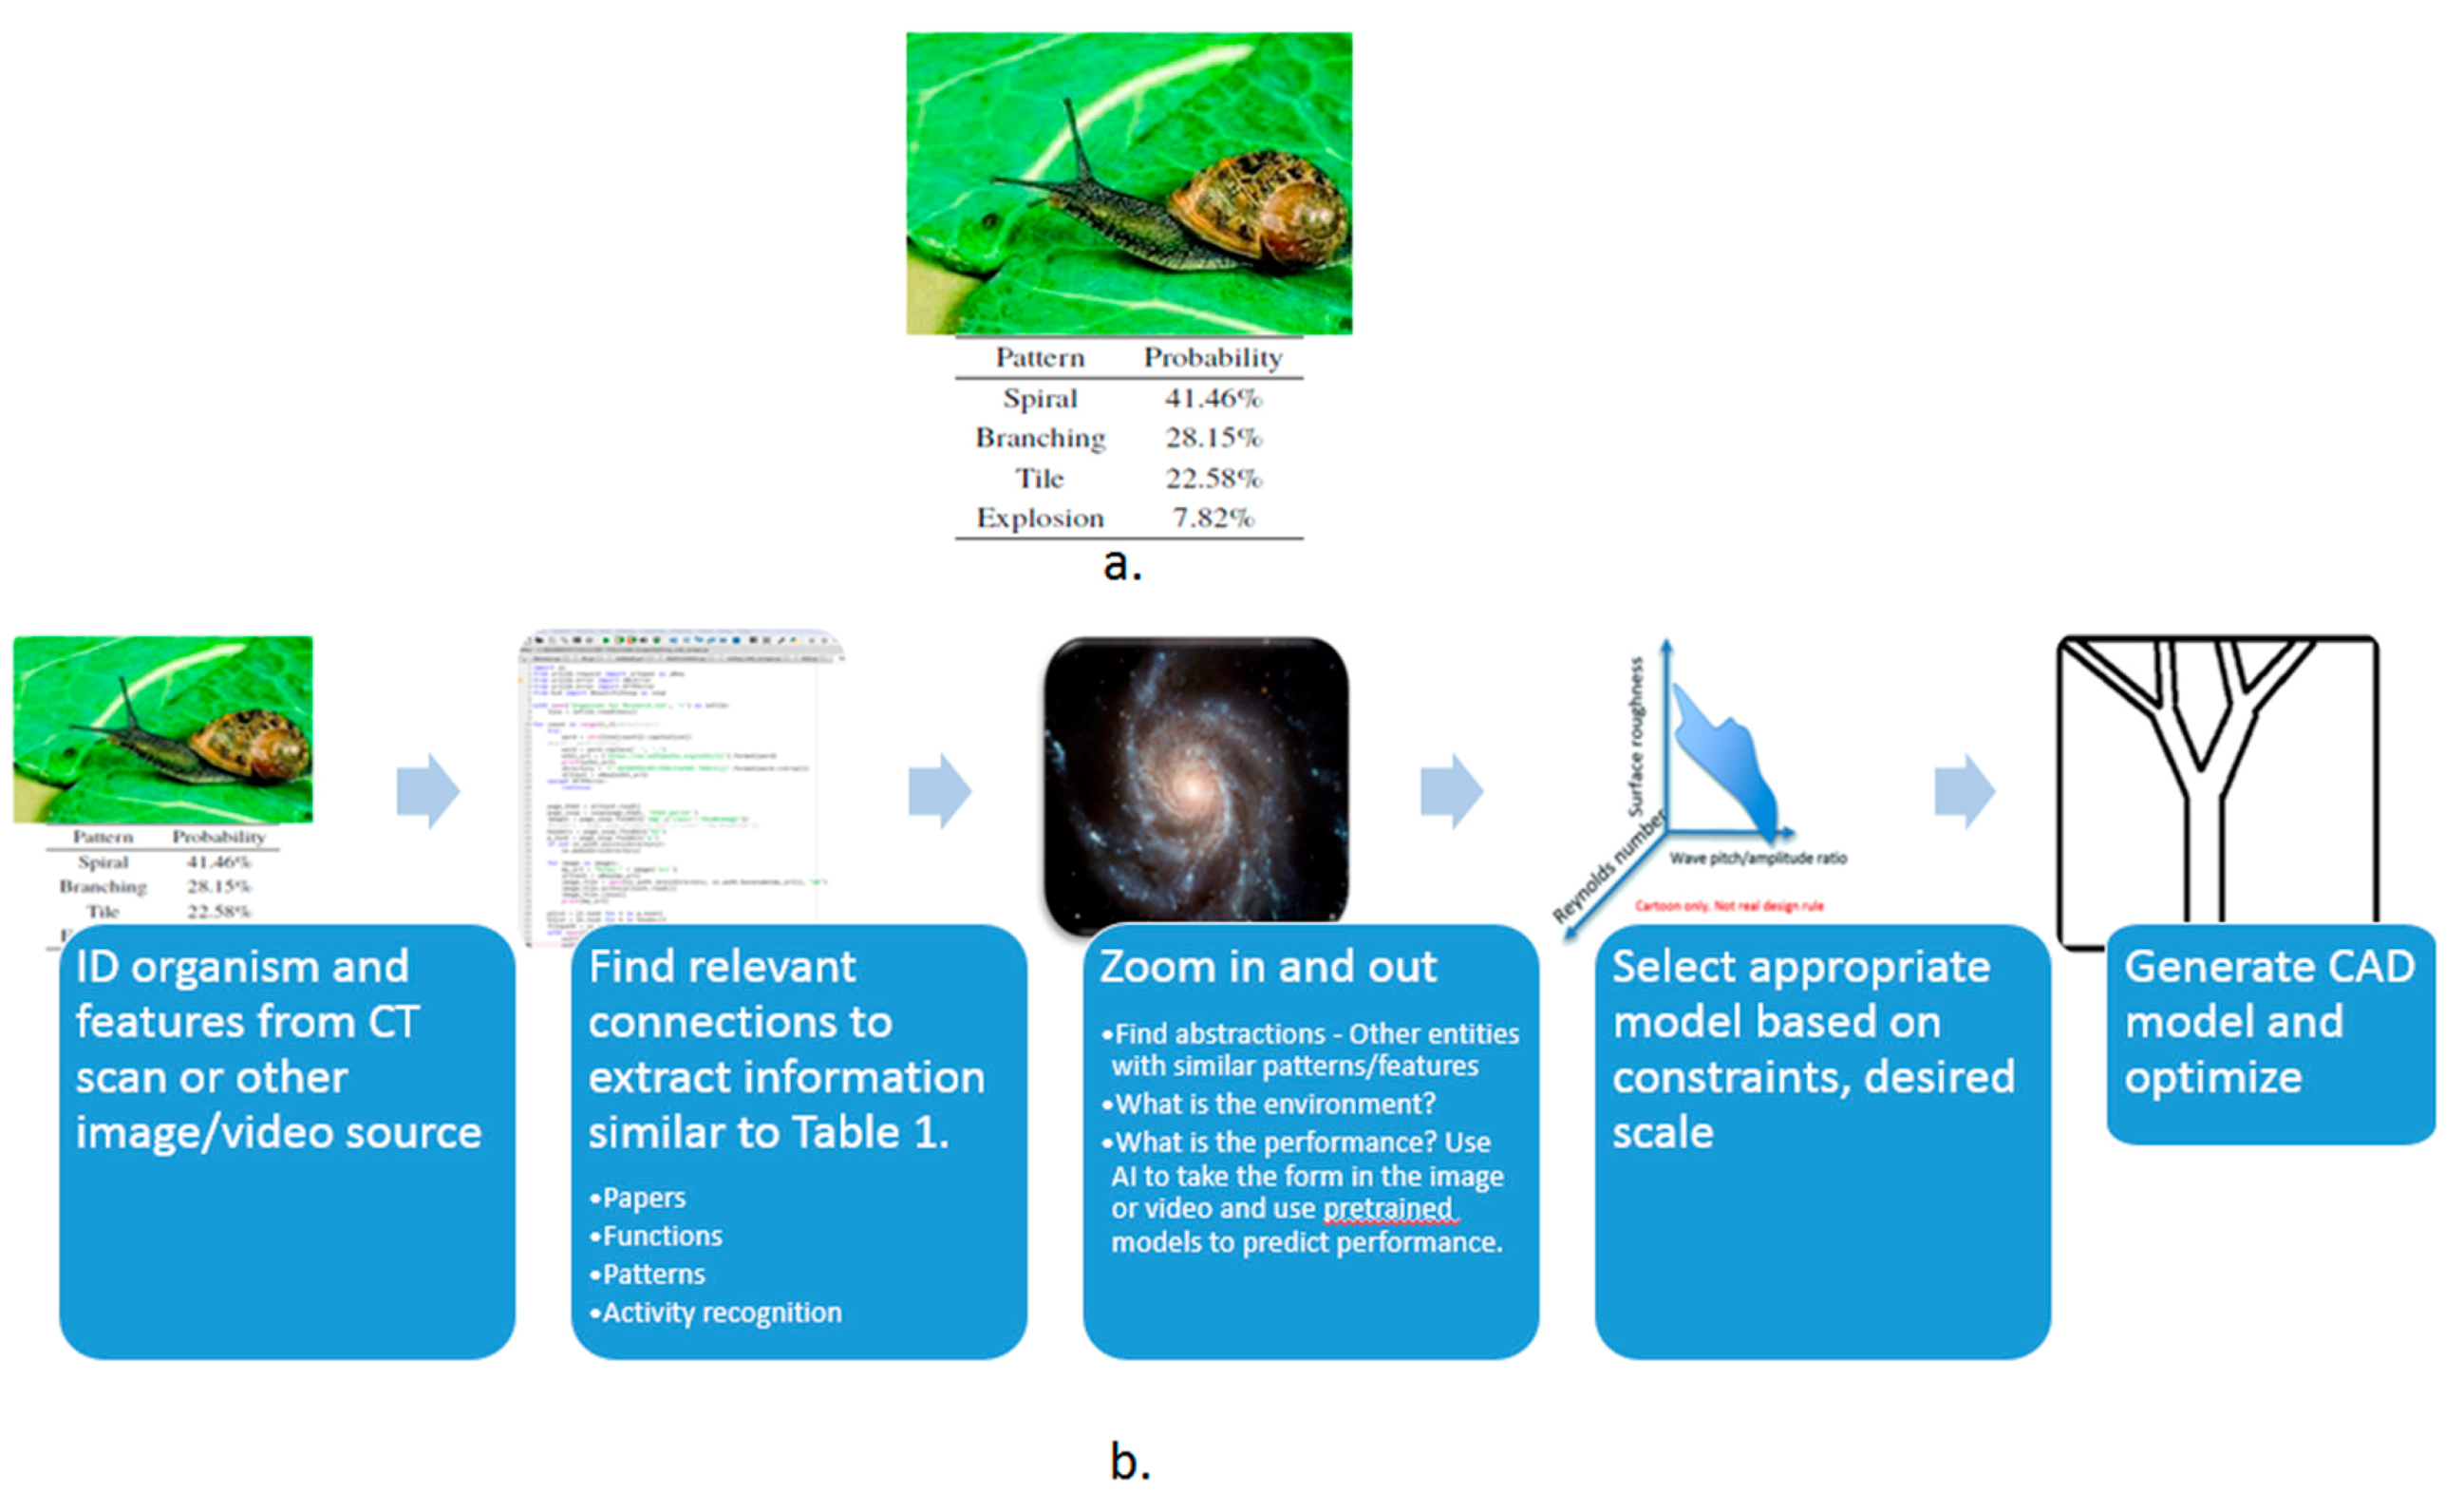
The association of pattern with function may be achieved by first classifying a biological feature by pattern composition (e.g., 50% lattice, 20% branching, 10% wavy, 20% explosion, and bilateral symmetry). Each pattern composition is associated with a use case from engineering that is multifunctional (e.g., primary factor: strength, secondary: heat transfer, tertiary: mobility). An example of this is shown in Figure 6. Once the association is known, parametric variations on the particular pattern composition may be undertaken to optimize for engineering. A similar procedure may be followed for challenges related to other fields of study. A manual example of this approach used for a turbine blade is described in [38]. Discovery of patterns in nature was first conducted, followed by an extraction of relevant parameters. Parametric variations were then simulated (such as varying the amplitudes and pitch of the waveforms along the span of the blade) and the results compared to a baseline. Work is in progress to extend this quasi-3D (designed for a cascade rather than rotating rig) design to 3D for general applicability in a turbine engine.
Comprehensive overviews of the current biomimetic toolkit are presented by Goel et al. [39] and Wanieck et al. [
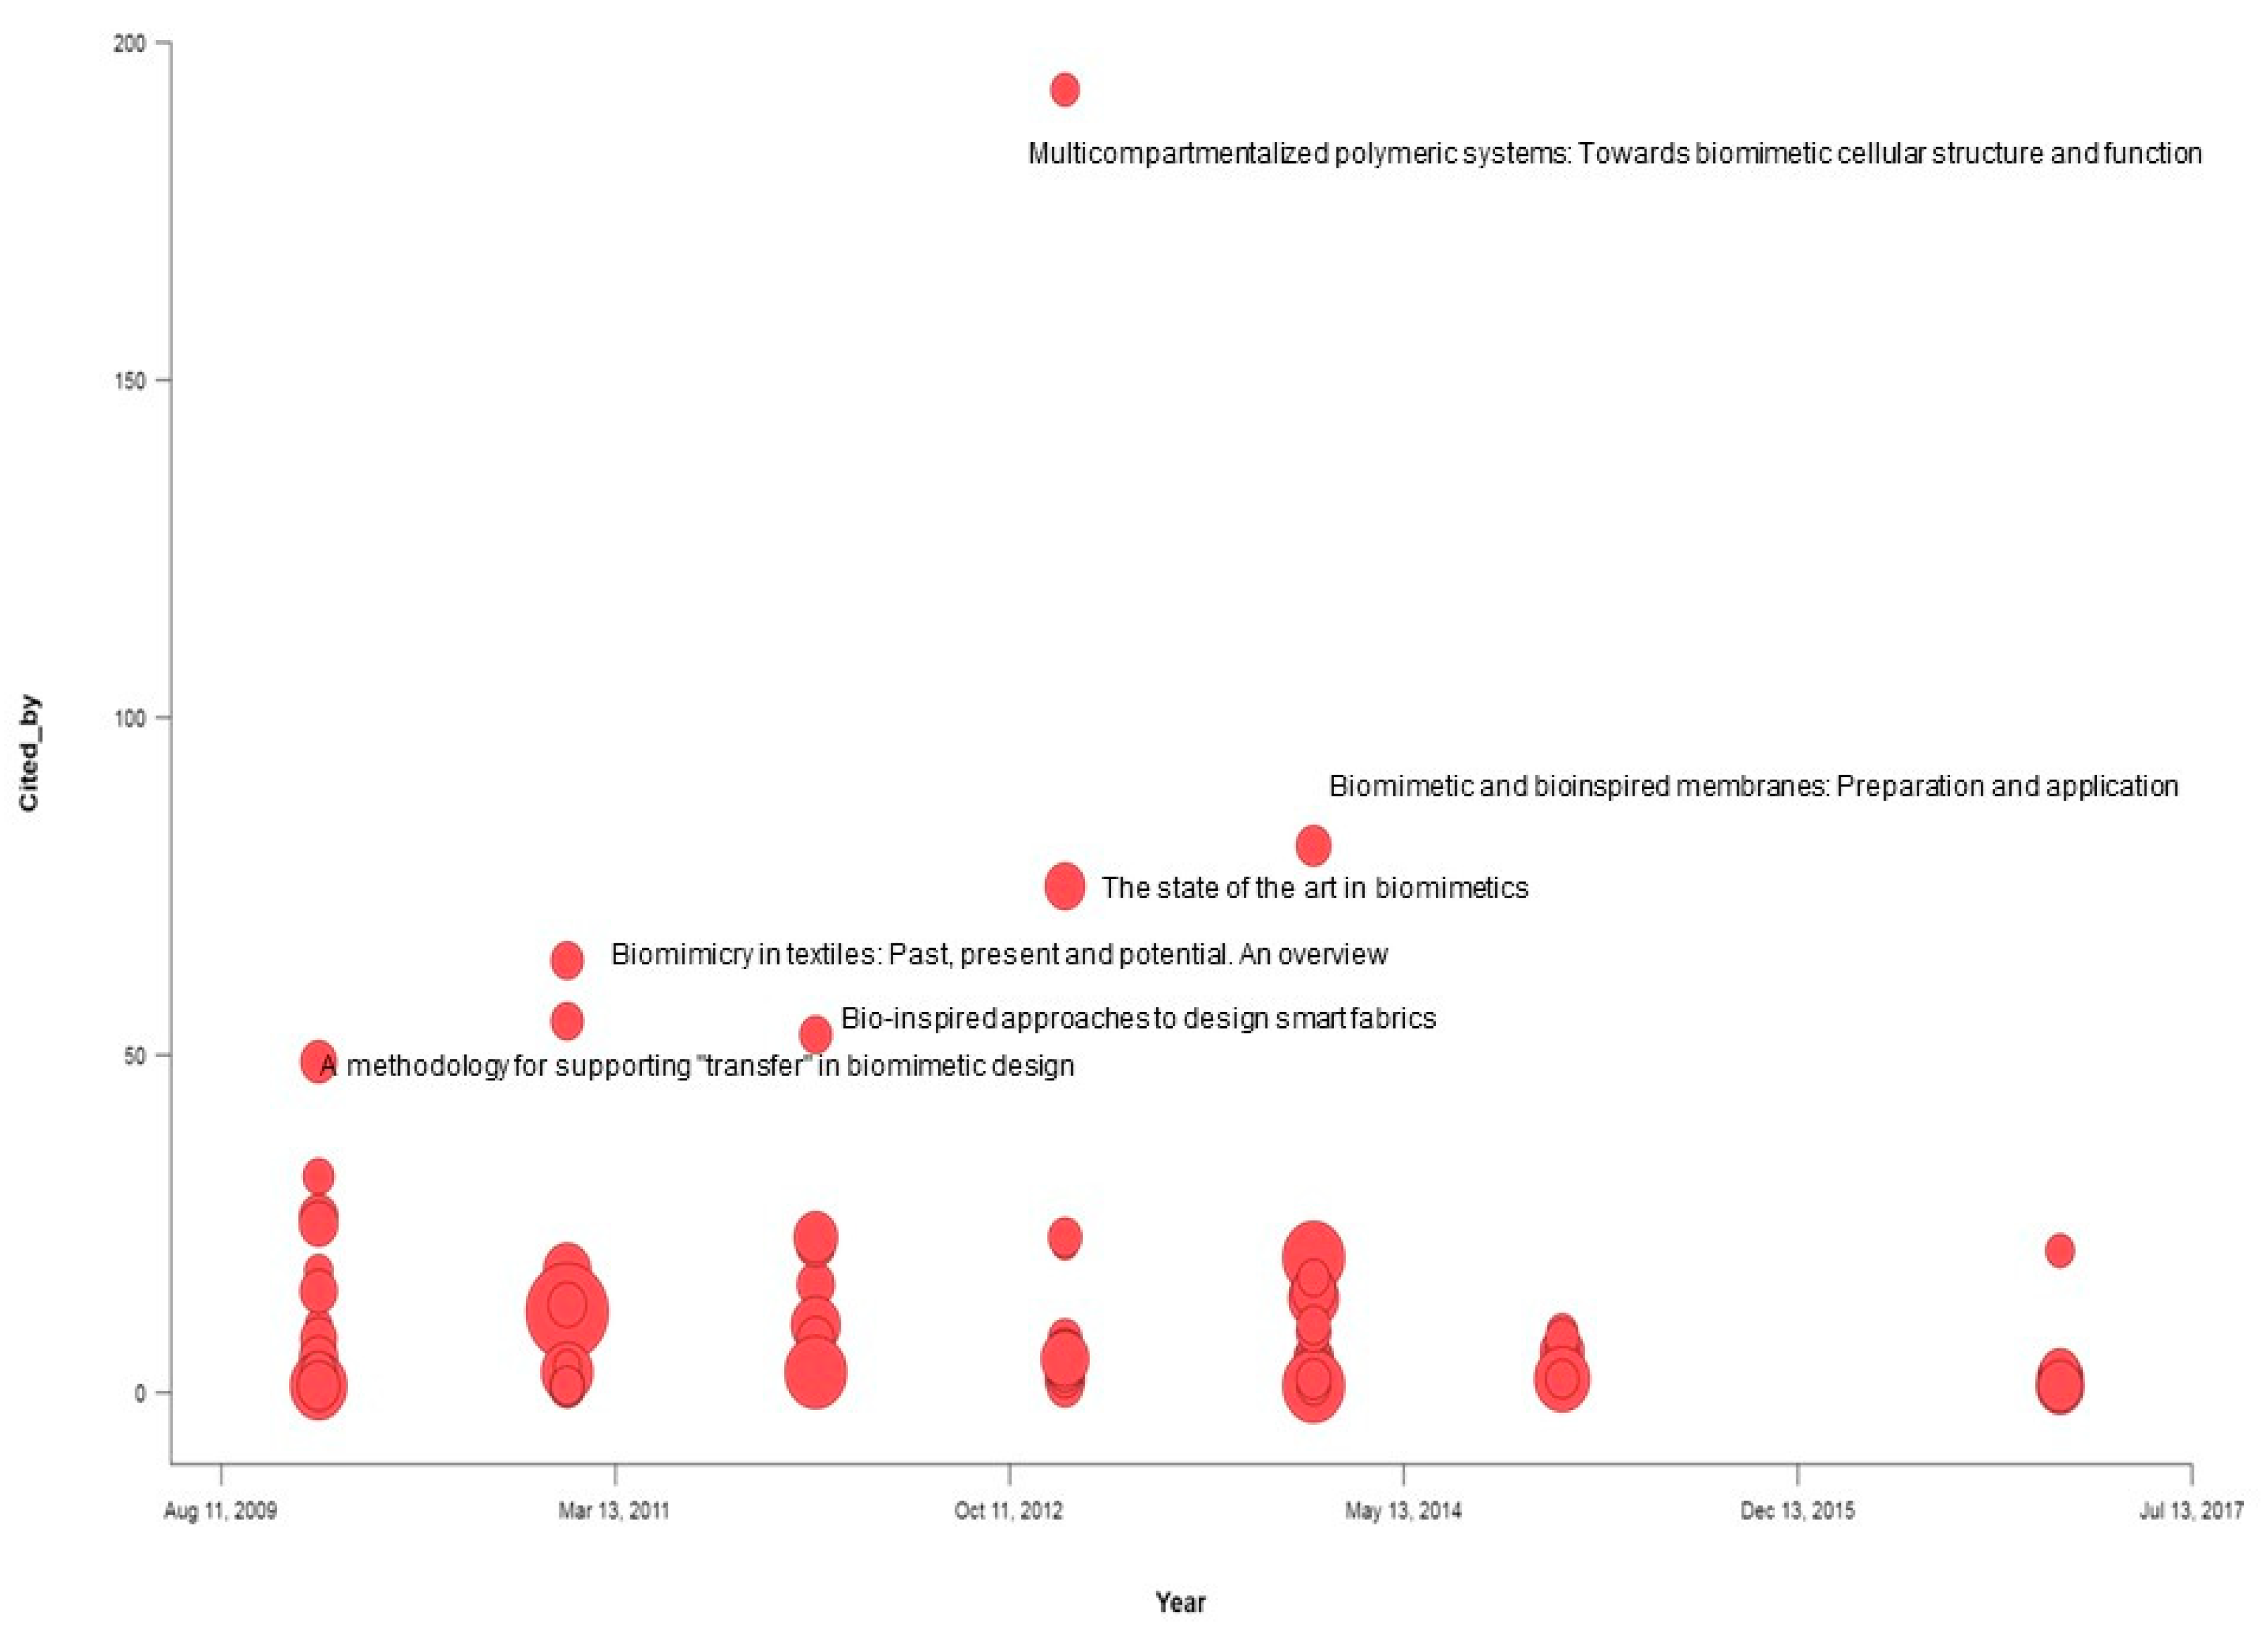
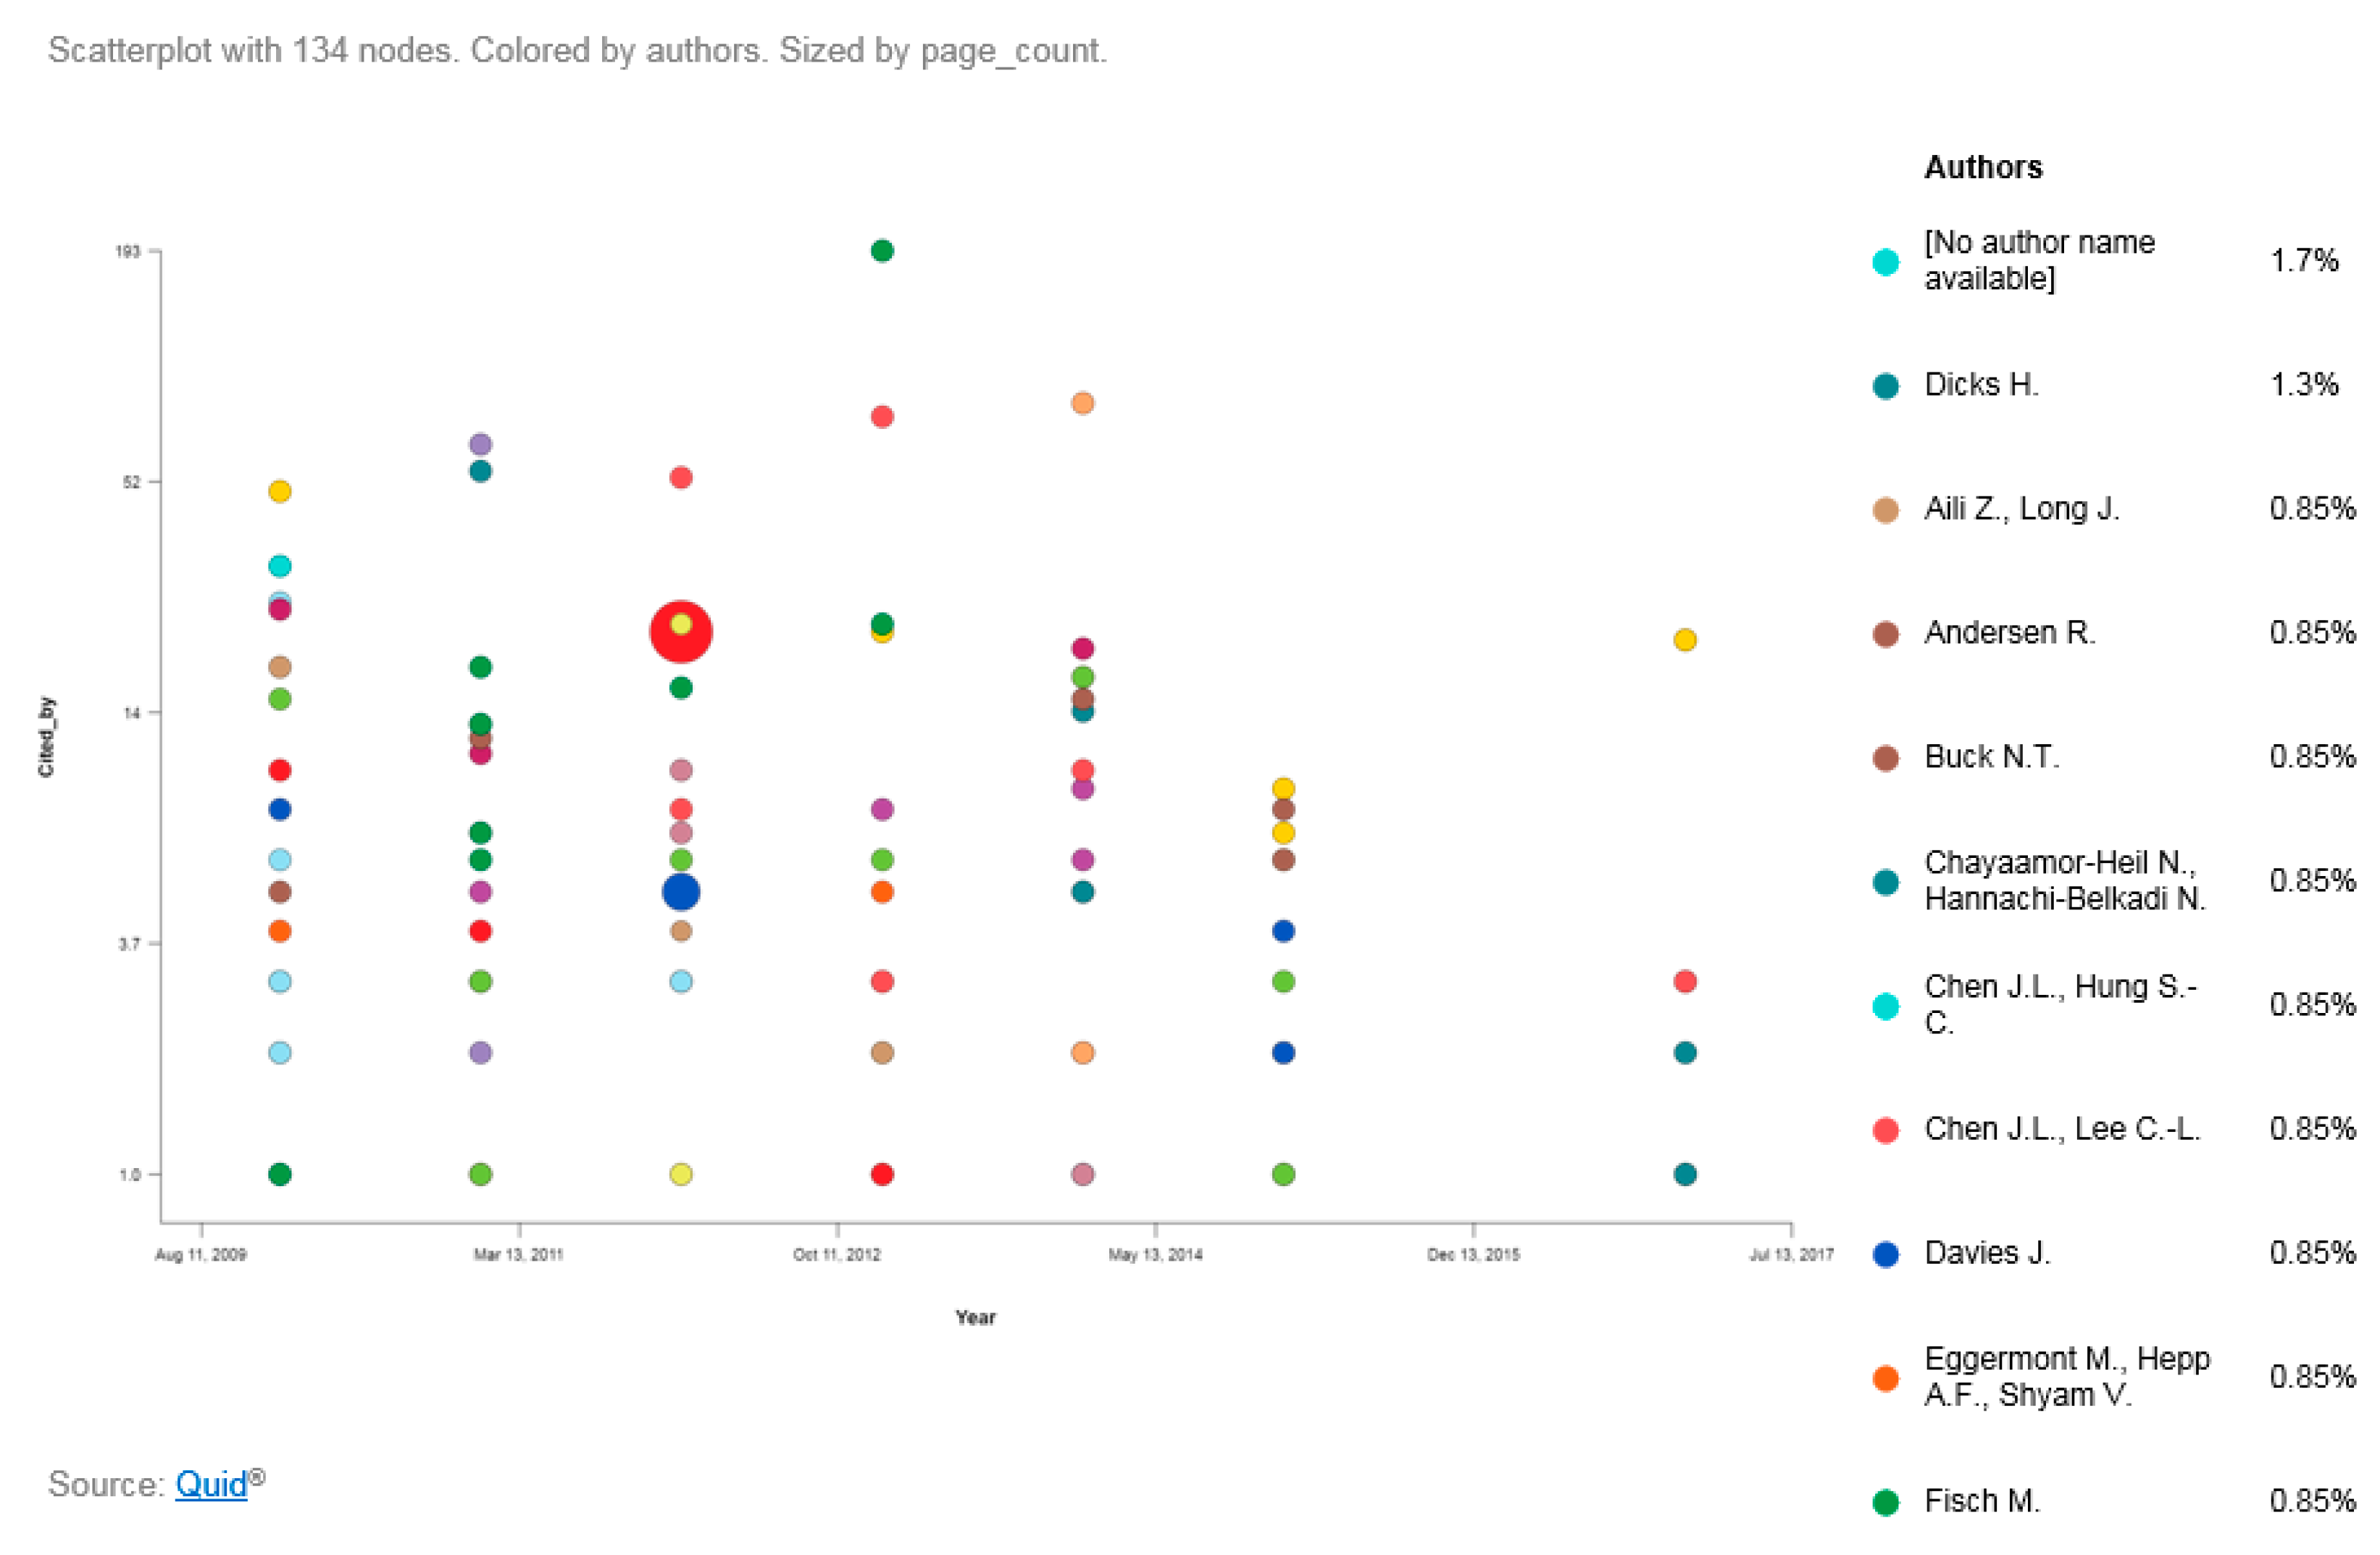
40]. Wanieck et al. show that there are a large number of databases to aid in biomimetics, there are few ontologies and fewer taxa and thesauri. Furthermore, there are gaps in the biomimetic process especially in translation of biological solutions to technology. It is stated that 77% of classified tools have shown their potential for usage. A landscape survey was conducted using the discovery tool QUID® to identify whether any significant works have been missed. Titles and abstracts for the period between 2003 and 2017 from SCOPUS [41] were scraped and used as input data for the analysis. The results are shown in Figure 7 and 
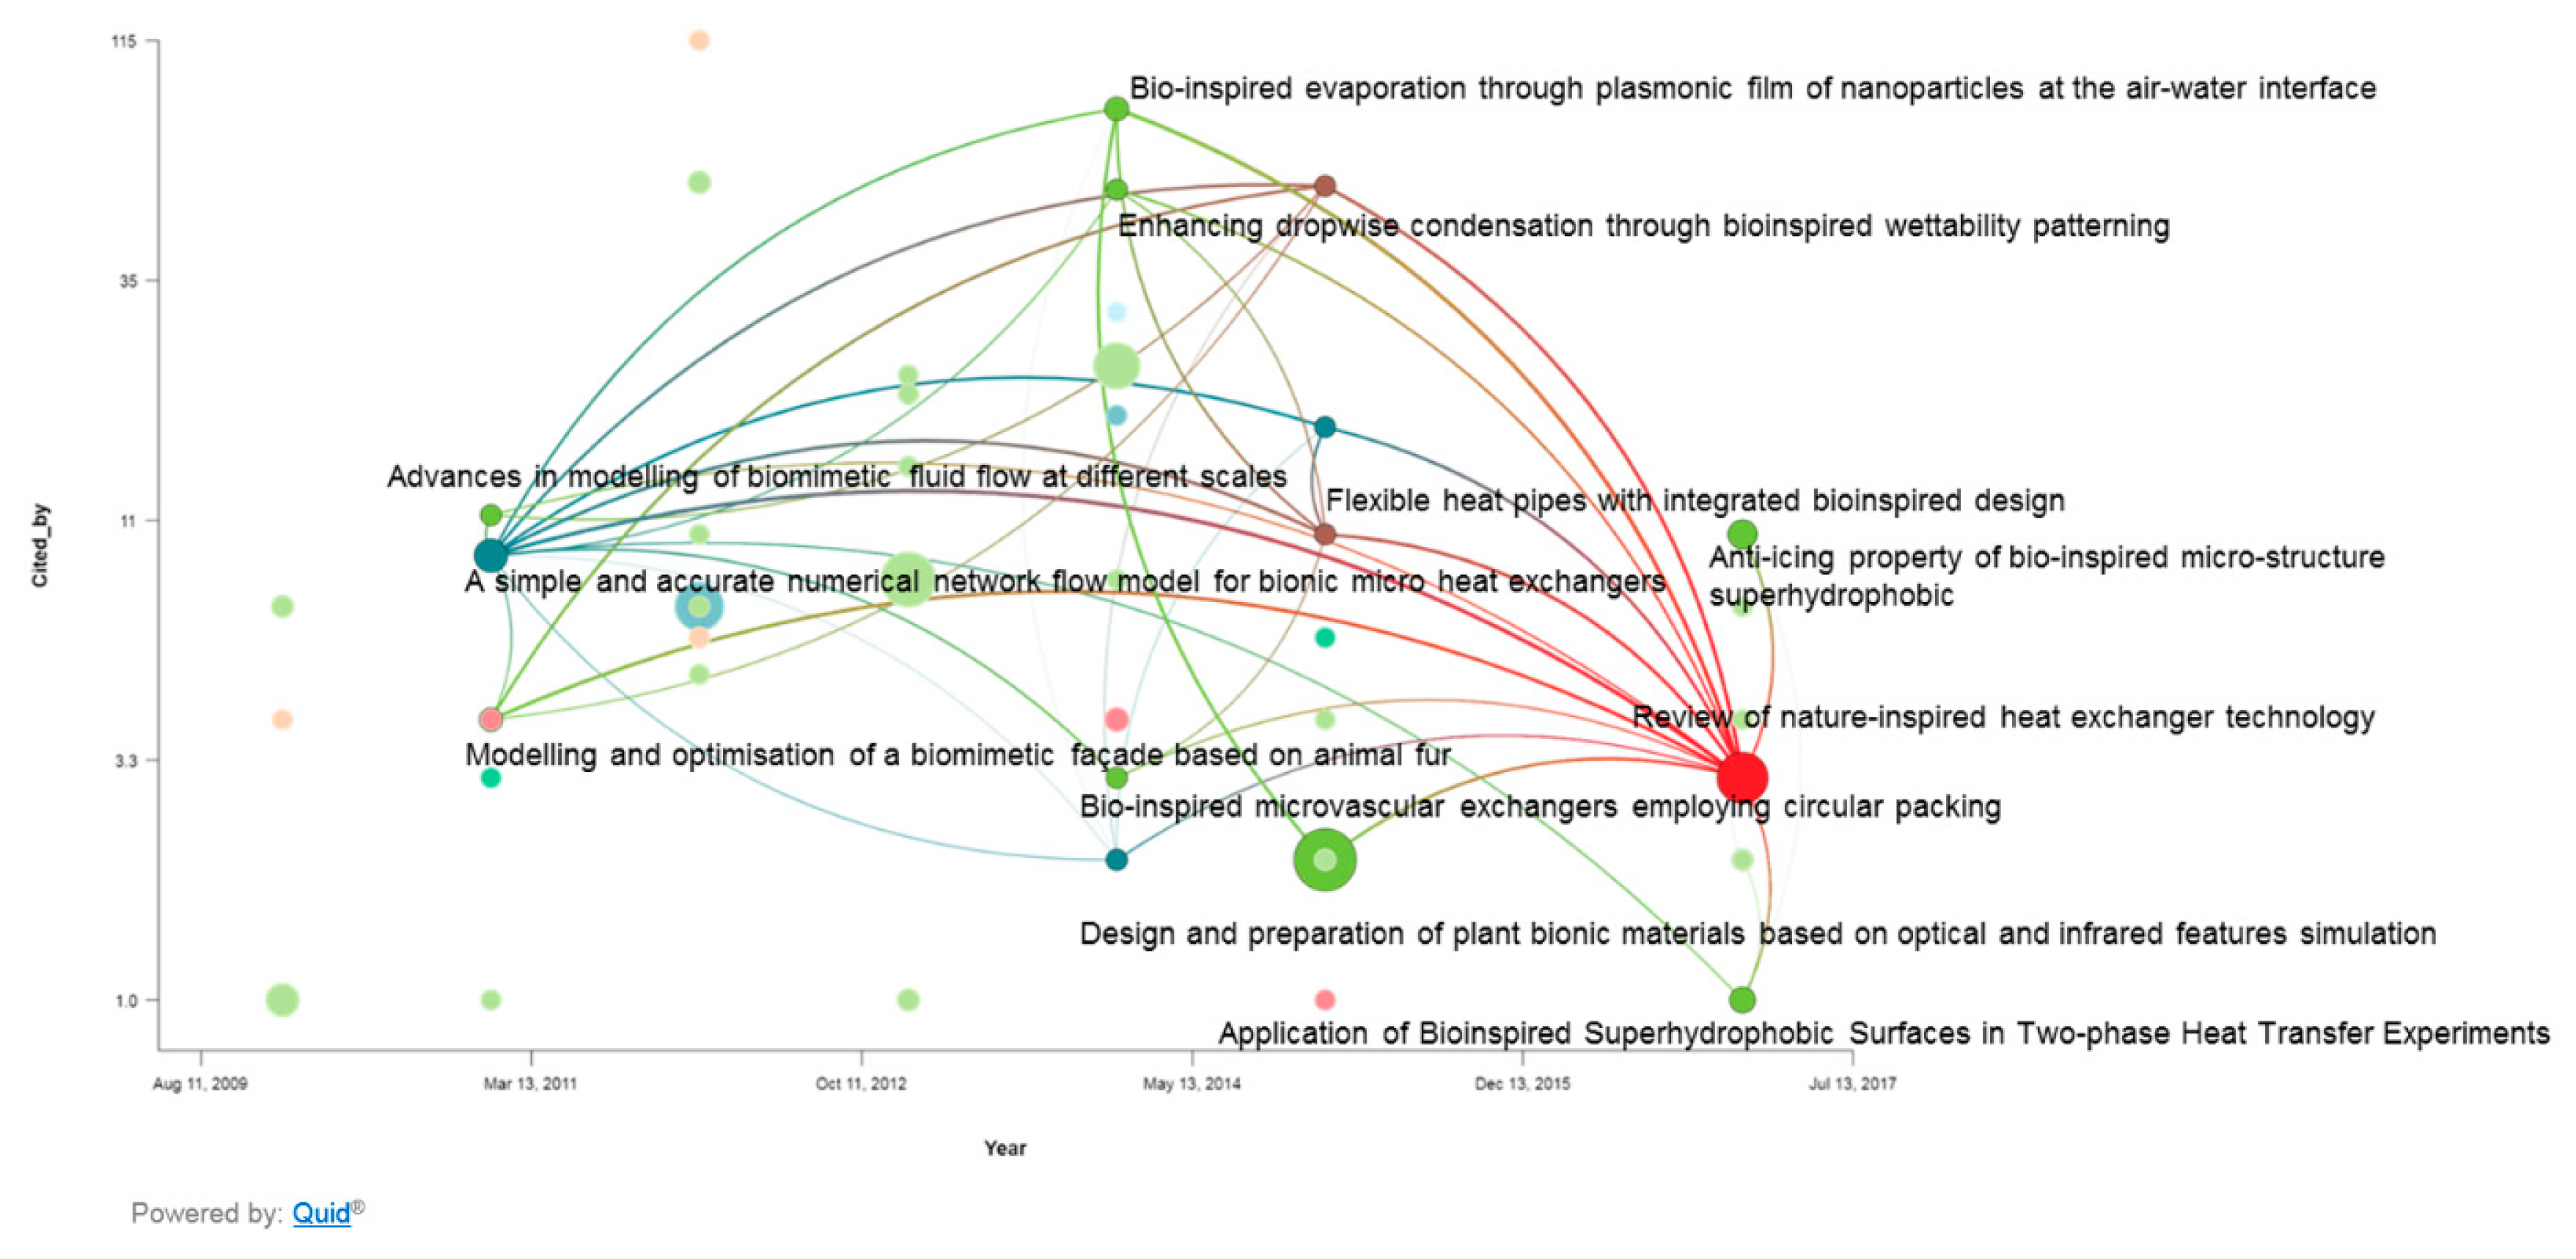
Figure 8. The results indicate that while there is a large interest in biomimetics and bio-inspired design methods, there is not a sustained effort by any one group. This is clear from the lack of connections between publications. A healthy (or healthier) network should look like 
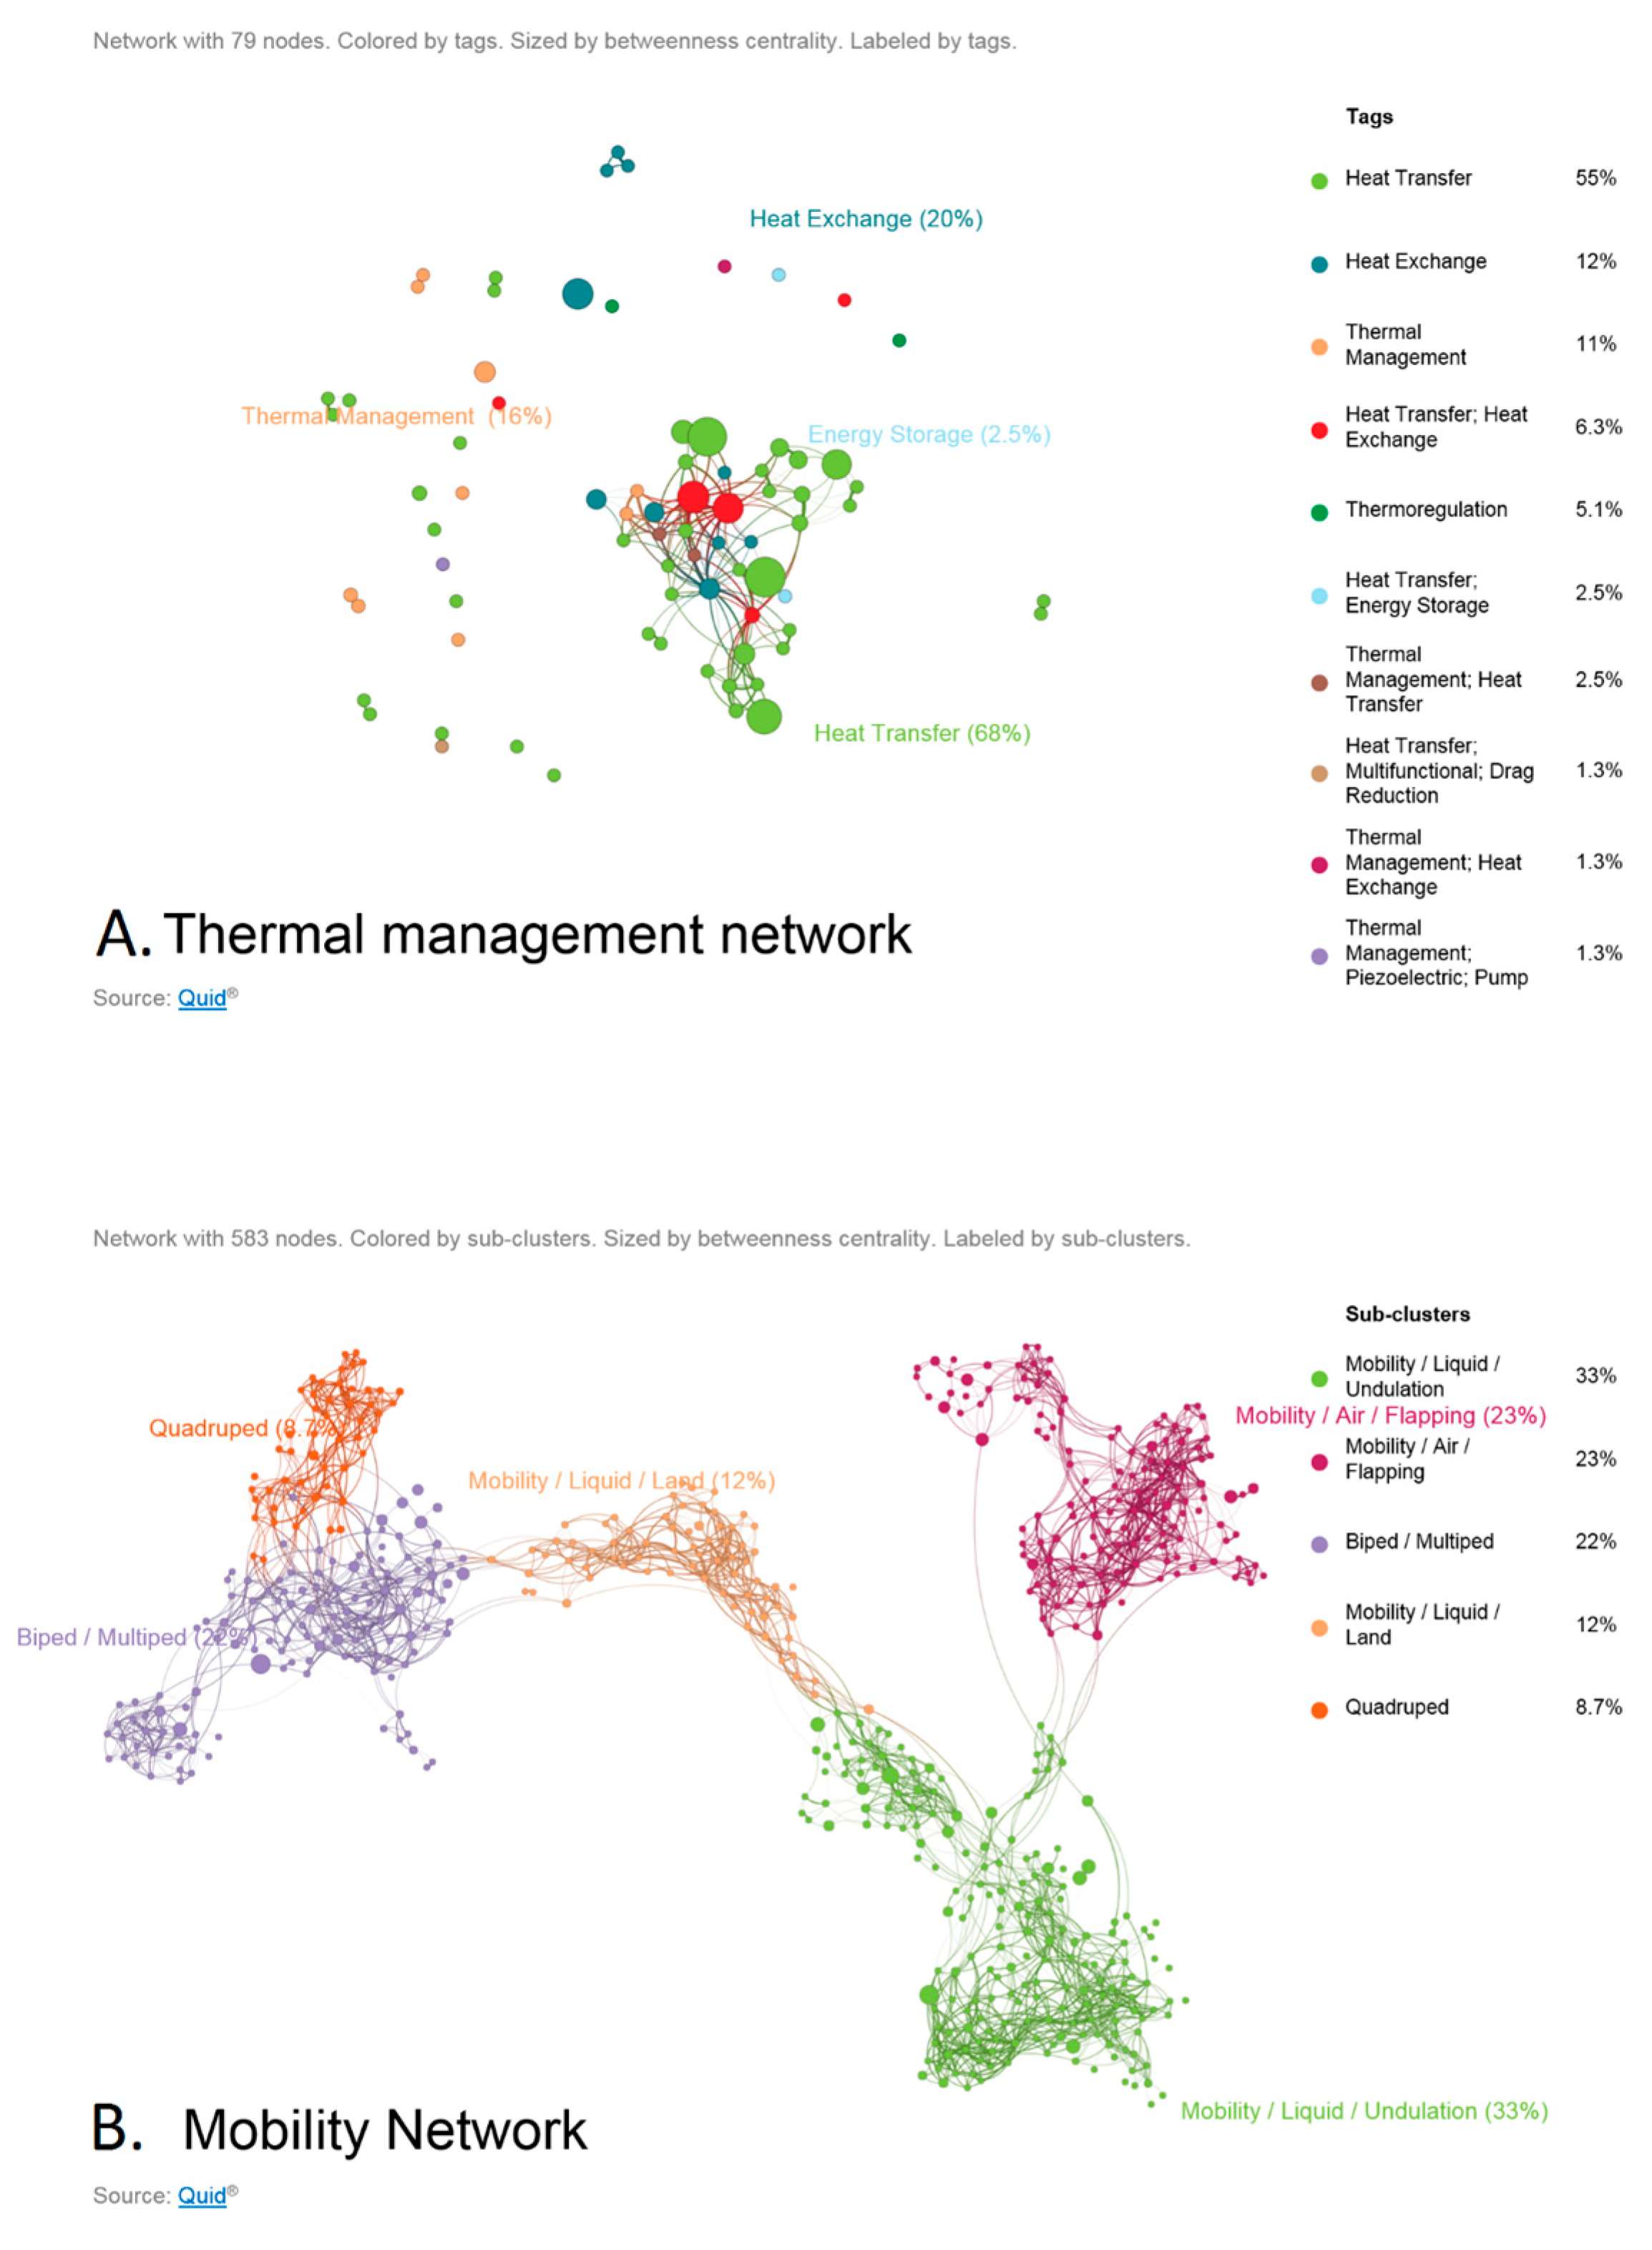
Figure 9 that shows research in the field of heat exchangers inspired by biology. There are several references to previous publications with many nodes being a part of multiple sub-networks. The heat exchange and thermal management network is however one of the weaker areas of bio-inspired design from an application standpoint. This could be due to difficulties in understanding how to scale the operating environment of biological models to the high temperature world that we as humans require our heat exchangers and thermal management systems to survive in. This contrast is shown in 
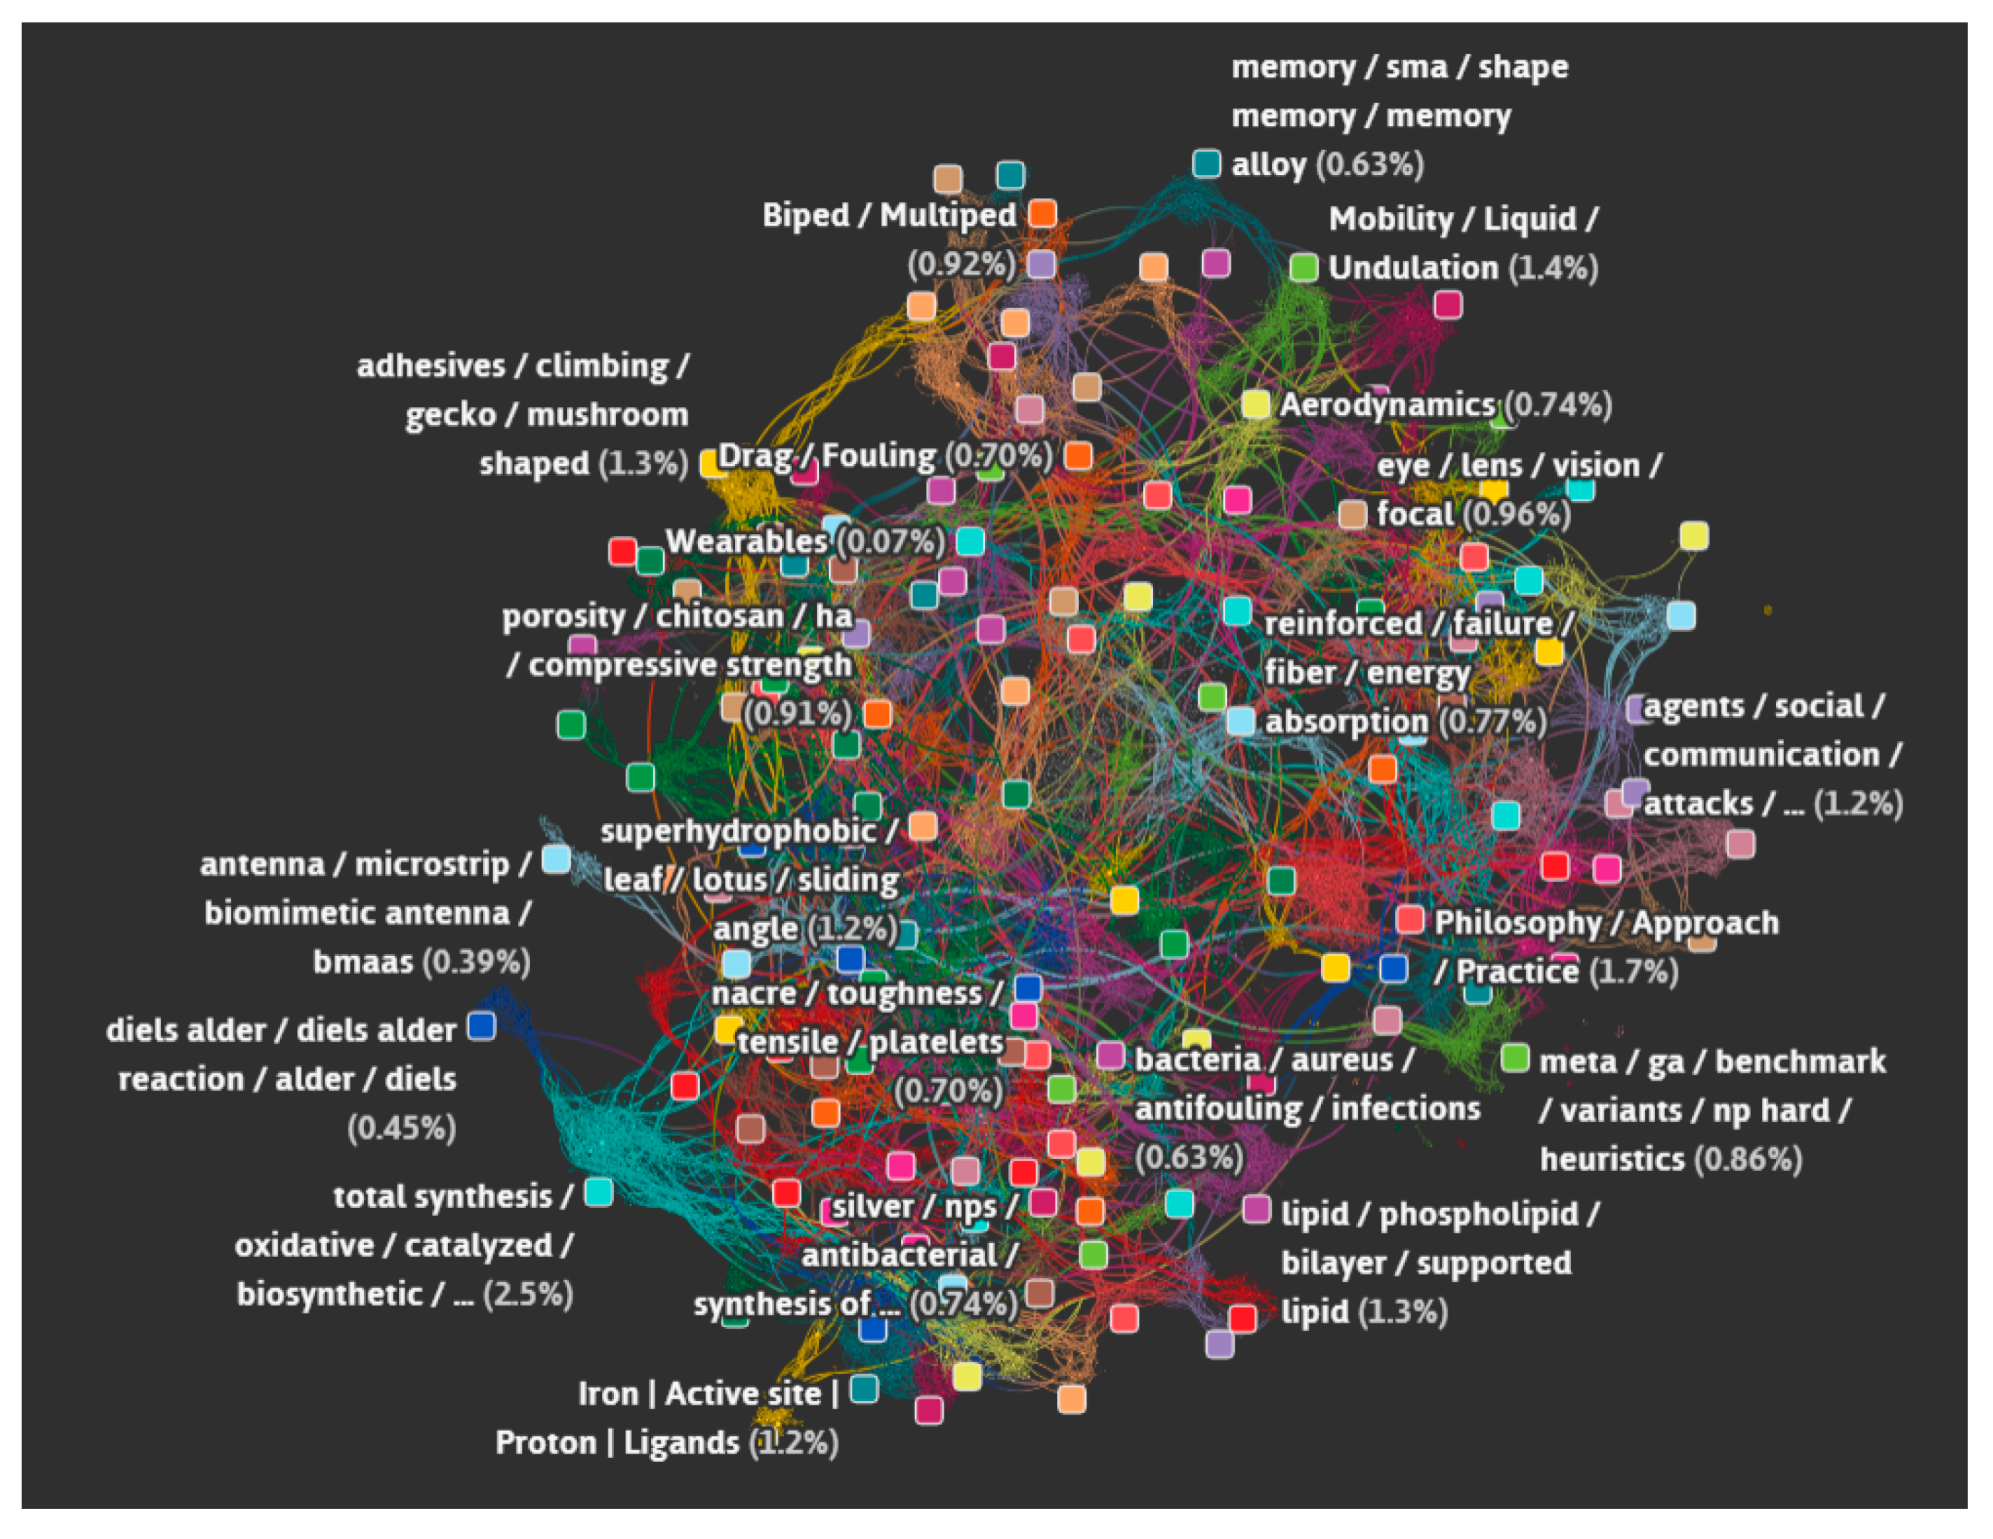
Figure 10. Mobility is a field that is more accessible and has been studied for a much longer time than heat exchange. This may explain why the number of articles focusing on thermal management is considerably lower than that for mobility. Also, the number of articles of land and air mobility are far greater than those for aquatic applications. This is again to be expected given the lack of resources available for and challenges involved in marine exploration. The entire landscape of biomimetics in the academic literature is visualized in Figure 11. Mobility (robotics in particular) is a prominent cluster. Other dominant clusters are adhesives, synthesis, superhydrophobics, aerodynamics and synthesis.
There is a need to provide a way for tools to communicate with each other and to share an underlying framework or ontology that would enable this. PeTaL is intended to be an open source platform to allow new and existing tools to be developed and to interact with each other. With this in mind, some requirements arise:
  • To enable broad access to the platform and development of code by all interested entities, the platform must be open and use an open source language. Python was chosen for this purpose although early development and proof of concept was carried out in R and RStudio. The platform must be accessible and a way of doing this is through a virtual environment or website. V.I.N.E. (Virtual Interchange for Nature-inspired Exploration) [42] is intended to be that virtual location and is described in subsequent sections.
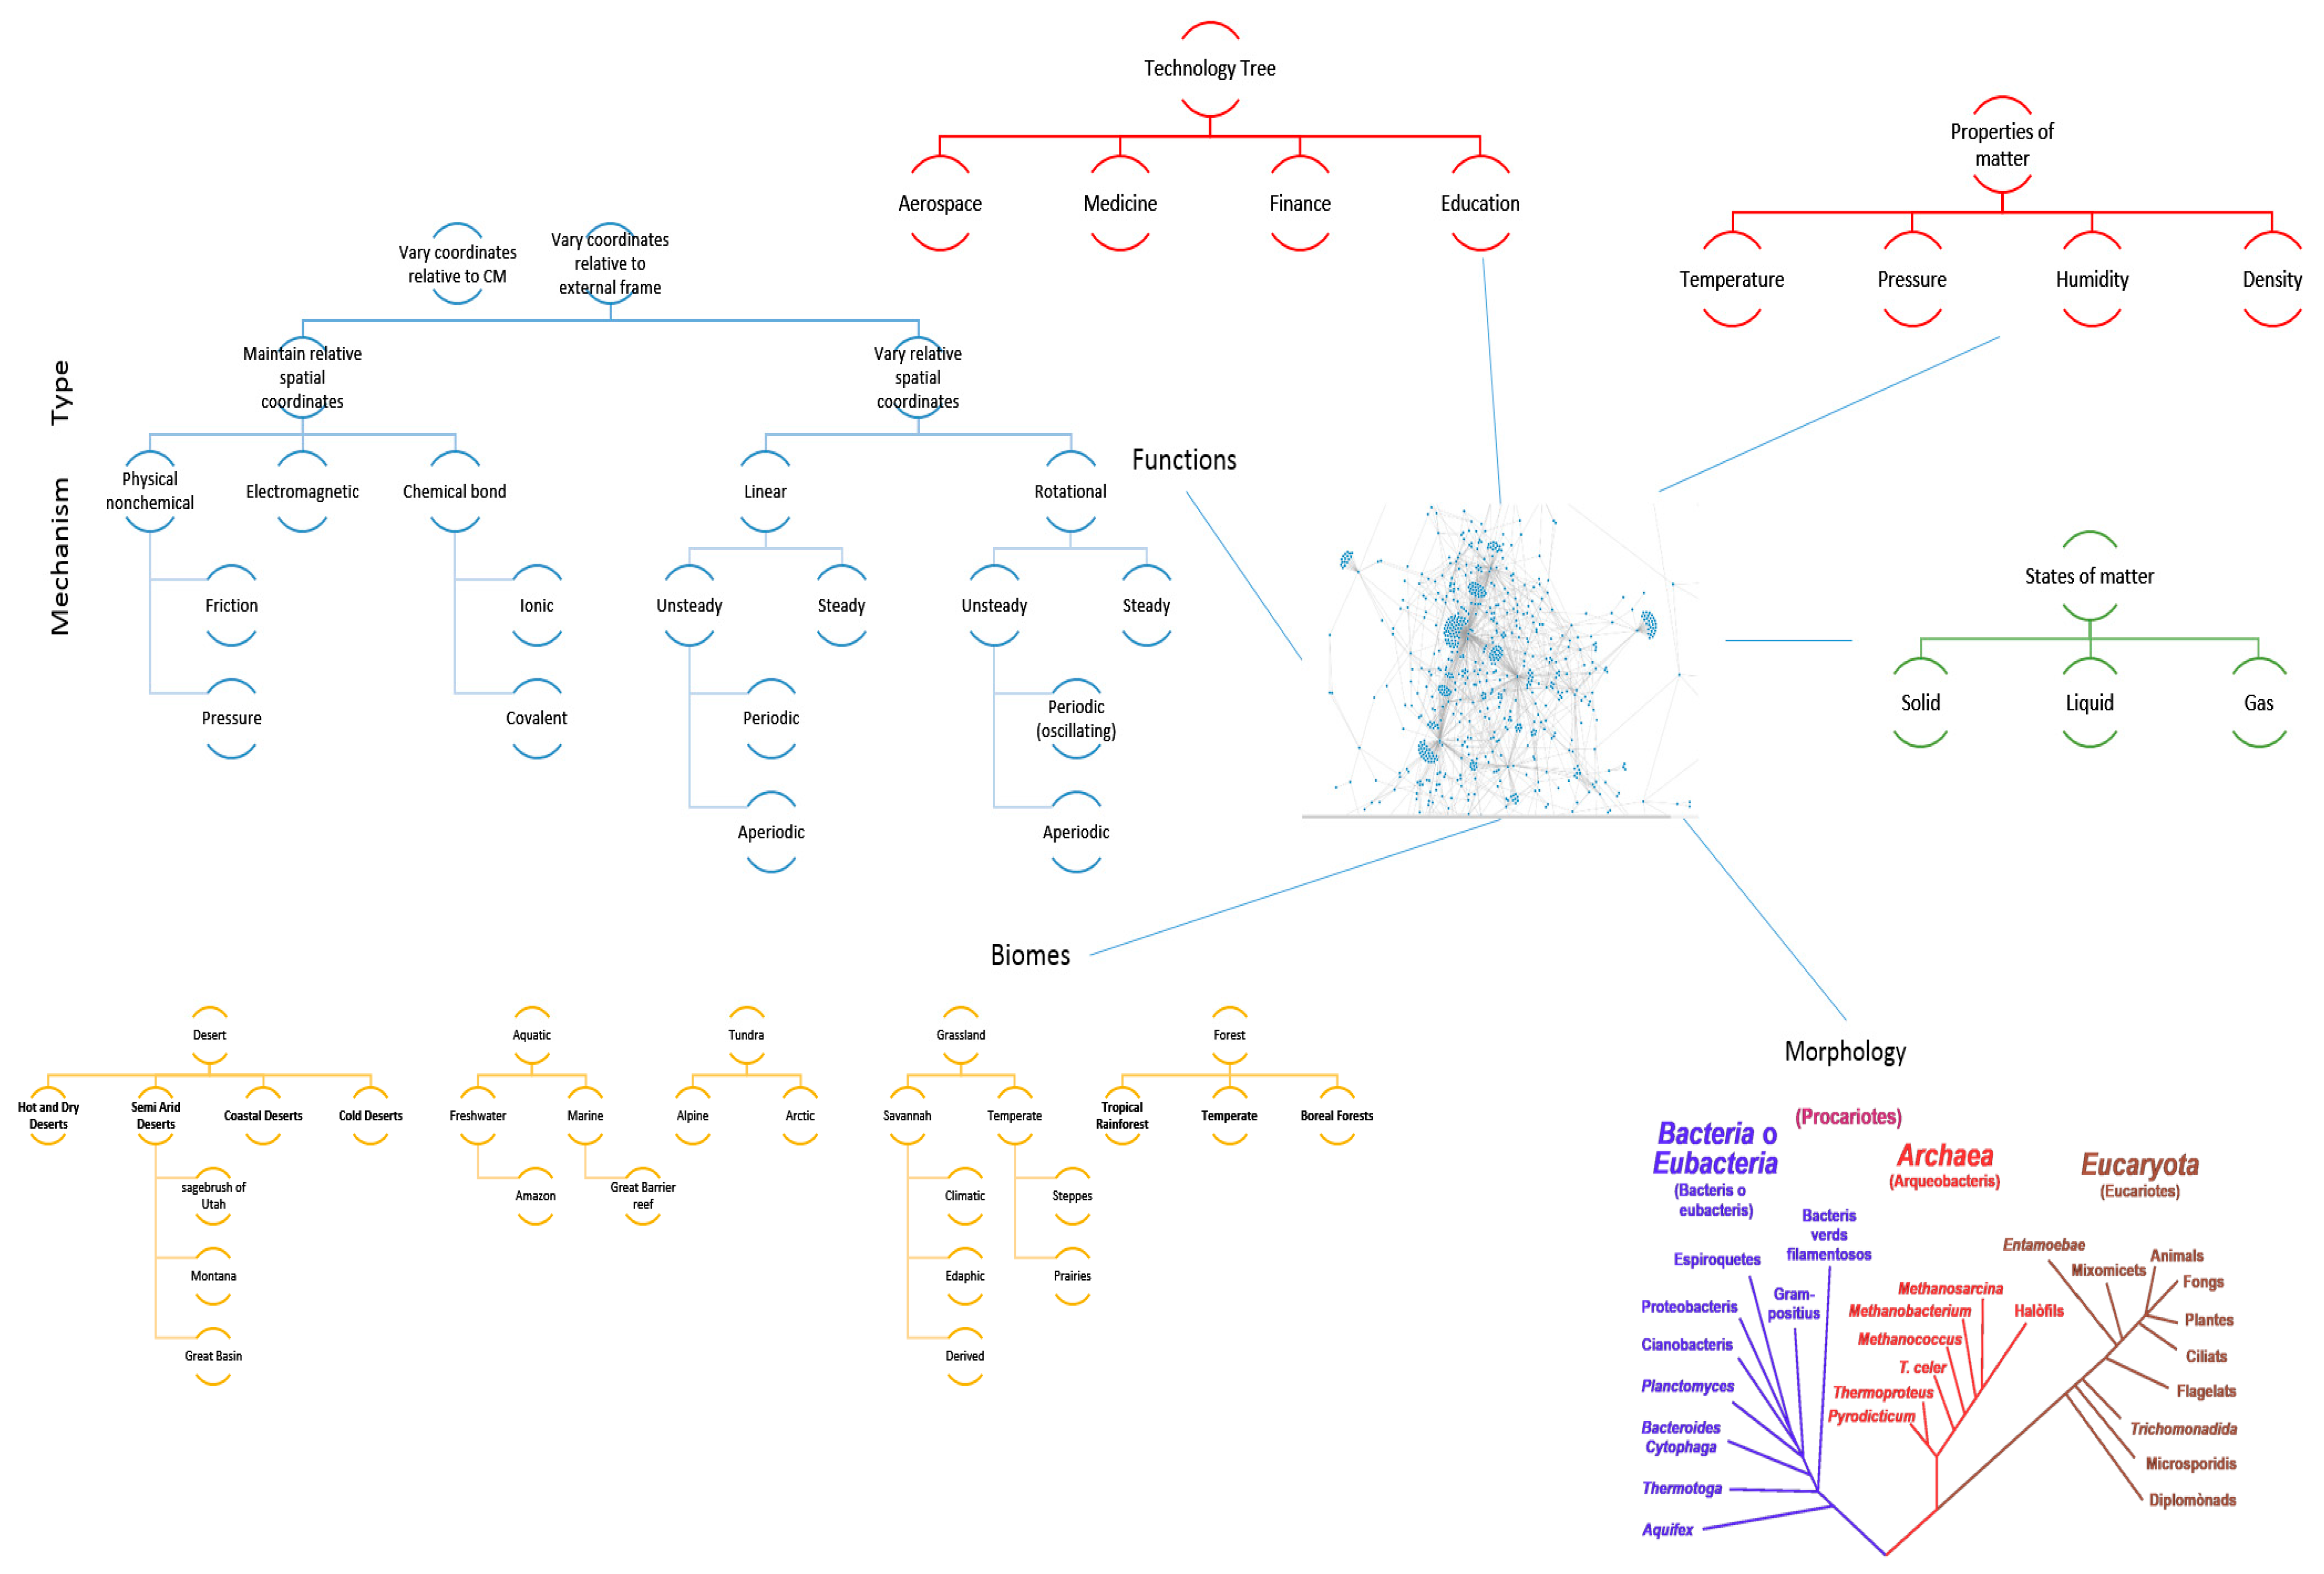
  • The platform must enable new apps and tools to communicate through some common language and have some common reference of the universe. To this end an ontology is proposed that uses existing ontologies for morphology (phylogenetic tree), physics, ecosystems, and states of matter and properties of matter. The ontology must relate biological organisms to their ecosystem or habitat that includes descriptions of environment. The environment must include descriptions of states of matter such as solid, liquid or gas and these must in turn connect to properties such as temperature, pressure, density, specific heat capacity etc. The phylogenetic tree must include evolutionary history of organisms and their inner composition, down to the cellular level. This gives the ability to zoom in on any part of the organism and to consider it as a model system for analysis. Thus, the entire ontology has the ability to define ecosystems. Given a network diagram and having performed a clustering operation on this network, such ecosystems may emerge visually. Alternatively, clustering algorithms may produce similar groups in evolutionary time or in function. Figure 12 shows an example of such an ontology. The entities shown must be connected by the laws of physics (force is mass times acceleration, pressure is force per unit area etc.) A distinguishing feature from existing tools is the presence of a ‘human’ ontology. Given biological solutions such as ‘a snake, shark jaw and bat ultrasound’ inspired sensor, one must be able to identify materials that are flexible and poses the strength, finish and other qualities dictated by the biological model to realize a technological analog. This requires classification of human technology and a method of translation across domains.
  • The platform must provide a common database where data related to the elements of the ontology may reside. Data may be in the form of videos, images, text, or numerical values. An unstructured database would be a suitable choice, for example, MongoDB.
  • Tools must be able to communicate with the base entities of the platform (ontology, database) regardless of domain specificity or level of user expertise. Thus a natural language processing method is essential. One solution may be a thesaurus that takes queries or variables from users or user-defined tools and translates them to a form amenable to the PeTaL platform.
  • Given a platform and a set of tools such as classification algorithms, image analysis, design or modeling tools, there should be a machine learning wrapper that navigates these tools in a manner that is likely to produce better outcomes given a particular set of user objectives, design philosophy and constraints. An example of such an algorithm is random forest, where several decision trees may be navigated depending on the set of input parameters, quality and quantity of data, time available to solve the problem, computational resources. The idea here is to mimic the evolutionary process where several mutations are permitted and the ones that are not flawed, propagate. Thus, the platform is the earth consisting of an ontology, database and language. These are themselves subject to change over time. The organisms are the tools that rely on the platform. The user problems and constraints are the forcing functions that ensure that problem solving pathways are constantly updated. Some deviations from evolution may be beneficial such as lack of extinction (storing old tools that may be shown to have a place in the toolset at a later time). 
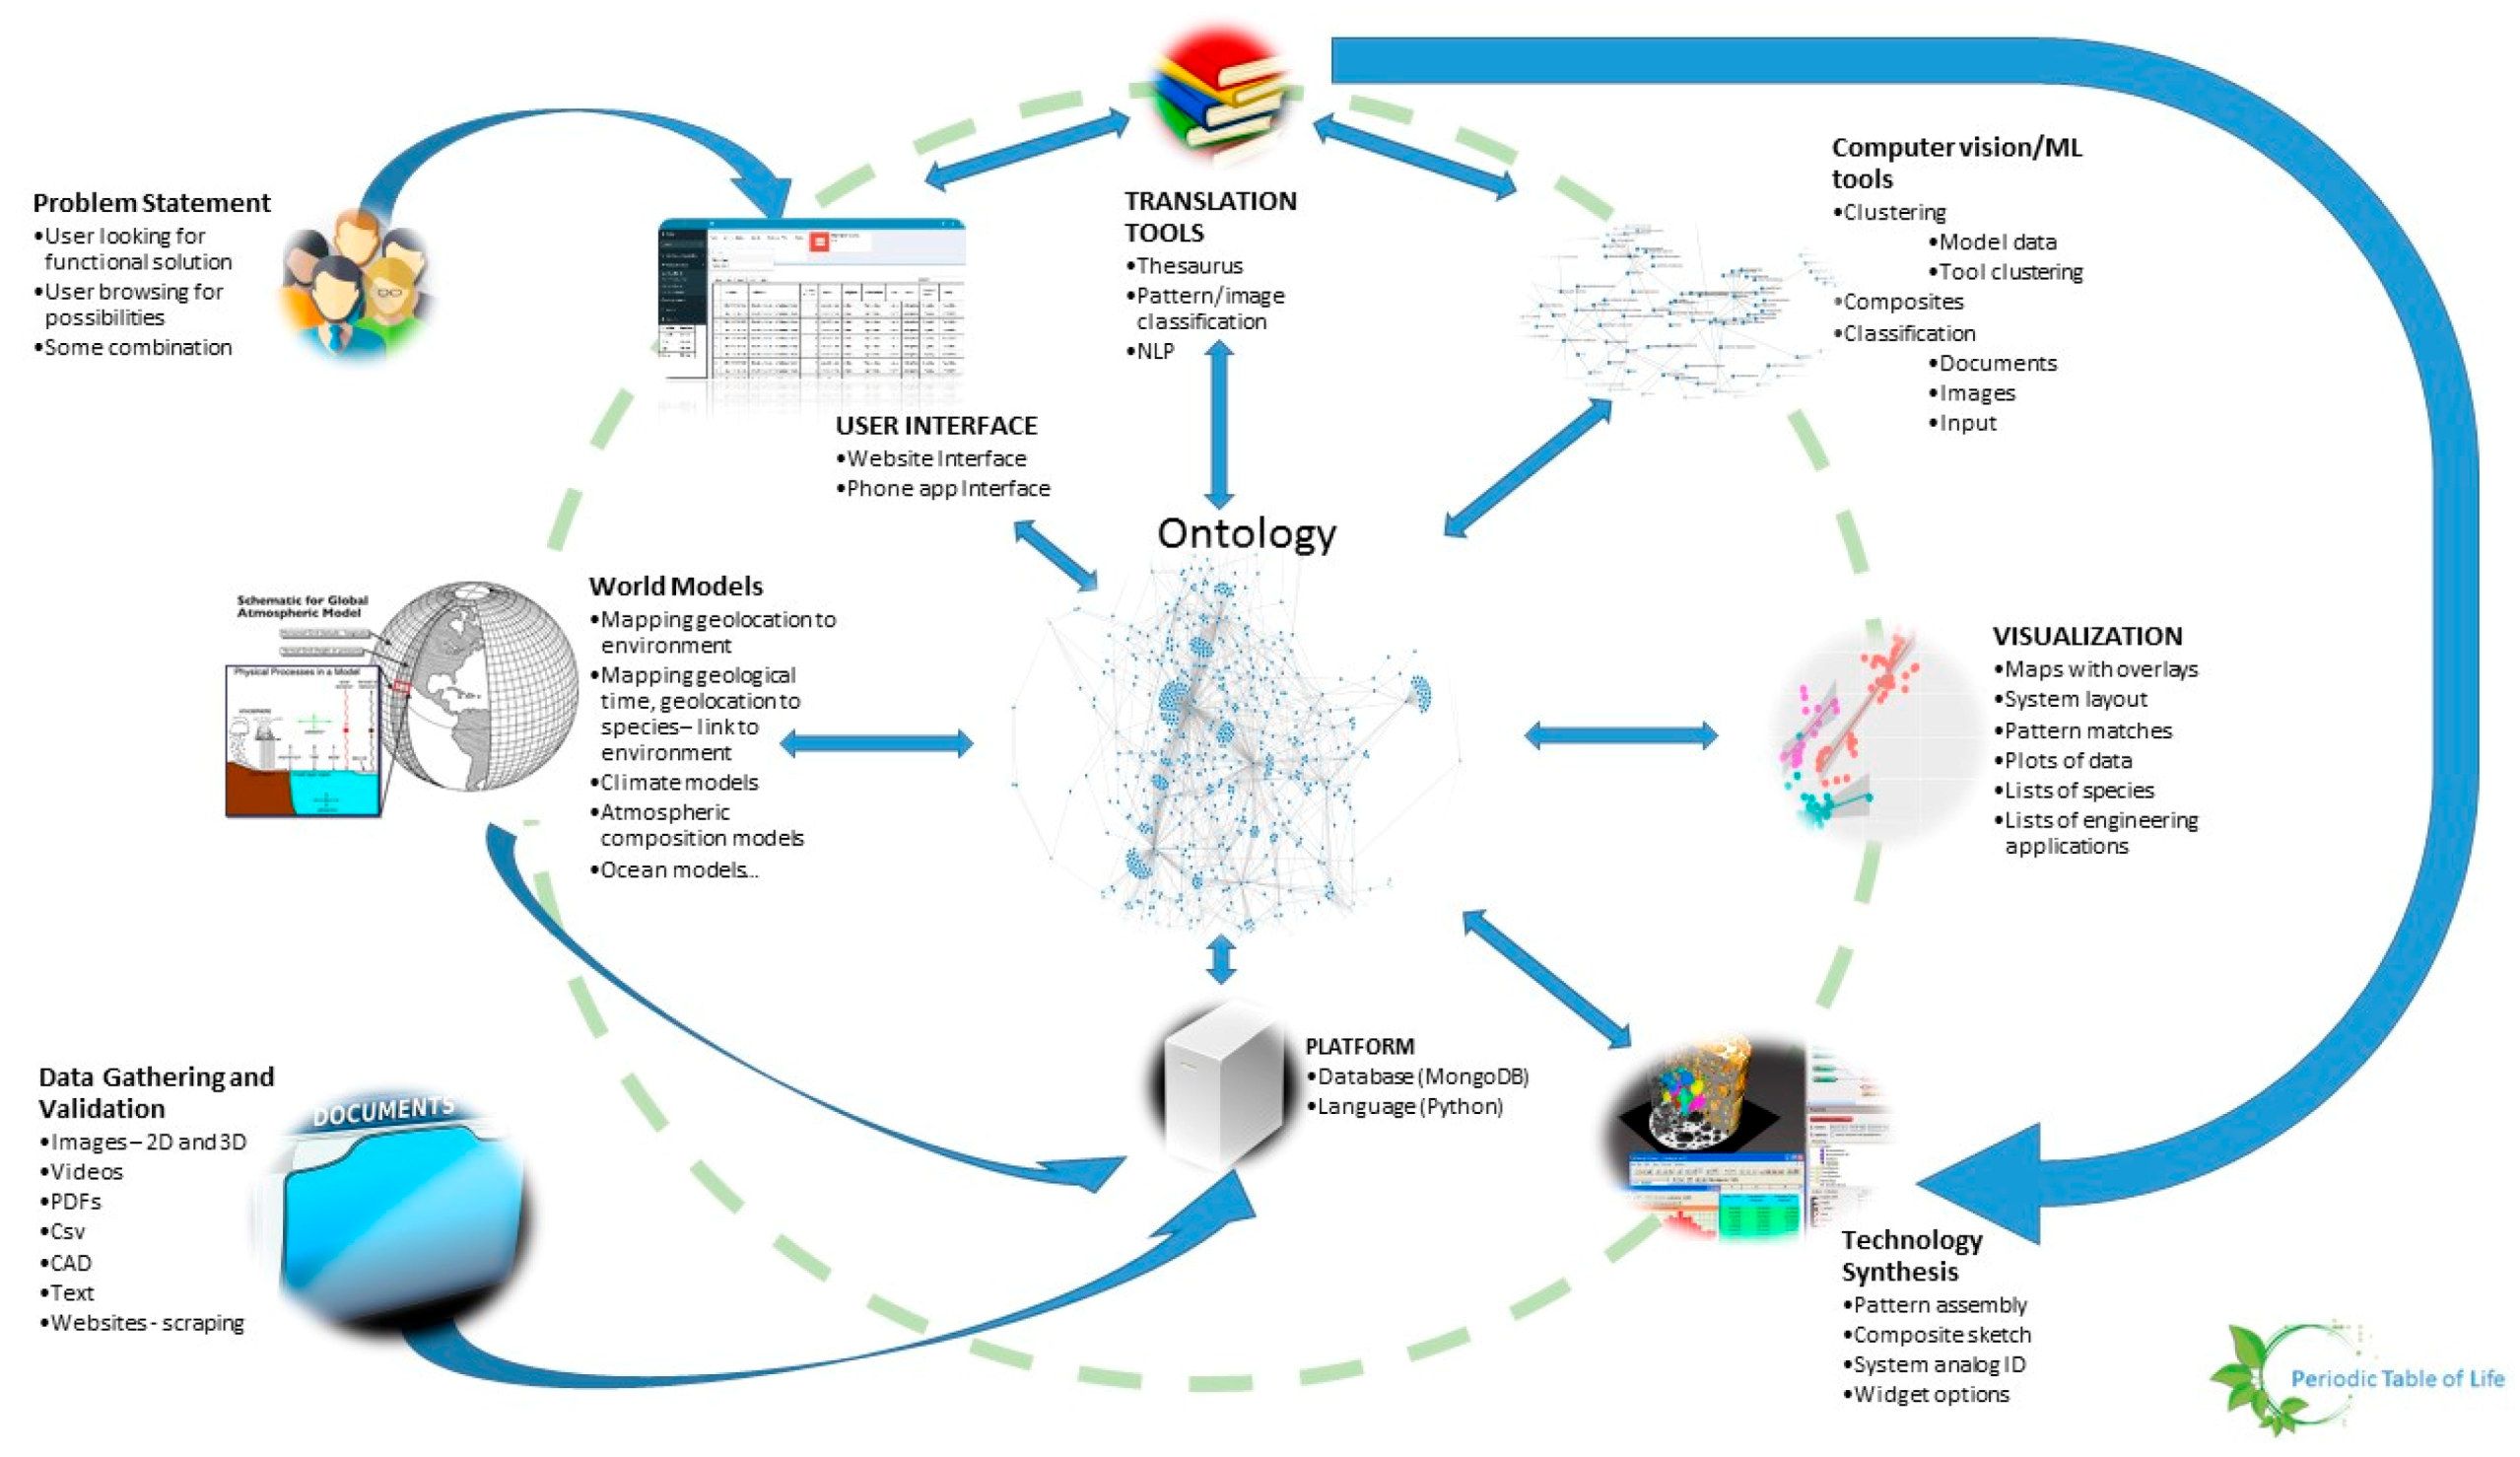
Figure 13 shows the architecture of PeTaL. The primary components include:
    • User Interface
    • Ontology and database
    • Translation Tools such as thesauri, mapping tools, abstraction tools
    • Data science/machine learning/computer vision tools
    • Physical models such as relationship between geolocation (including under water bodies) and temperature, pressure, density, humidity.
    • Data management (validation, entry, modification)
    • Technology synthesis tools (given solutions and known constraints and resources, how to construct a functioning system?)

4.2. Taxonomy

In order to integrate tools and process information from variegated sources and domains, it is necessary to establish a taxonomy or language that an algorithm might use to perform tasks such as classification, clustering, data scraping and translation. Several taxa are available in the biomimetic landscape, but arguably, the most widely used is the Biomimicry Taxonomy, used by AskNature [43]. The taxonomy was constructed by domain experts but it is unclear if such a taxonomy is generally applicable or reproducible. These two qualities are necessary if used within a data science context. We therefore ask ourselves whether it is possible to construct a taxonomy that is objective and uses data science to discern topics base on the published literature. Due to the bias in the literature toward research topics that have been accessible to researchers thus far (as seen in Figure 11), unsupervised clustering of articles is unlikely to yield a taxonomy of terms that is mutually independent and exhaustive. Hypothetically, one should be able to take a large body of work from, say, the Journal of Experimental Biology, and perform topic modeling on the corpus to reveal underlying themes. One might expect that we would discern clusters that correspond to environment, organisms and structures but also to functions that could then inform our taxonomic approach. Each cluster would then be the highest taxonomic level. Sub-clusters would then be created within each cluster for refined searches. This taxonomy would be updated periodically to reflect the literature that is being generated. The entire PeTaL architecture is therefore dynamic. In the short term however, it may be advantageous to leverage the existing taxonomy from AskNature [43] and develop a classification tool to label articles of interest to a user by the AskNature functions.
Text classification was conducted through a collaborative construction from a team of NASA researchers of a manually labeled training data set. Articles used for training the algorithm were provided by a collaborator, Dr. Julian Vincent [19], and labels were created by assigning 1 of the 8 primary tiers from the Biomimicry Taxonomy from AskNature [43] to 100 different articles. The training data set was crafted to represent a balanced distribution of labels from each of these 8 primary tiers. A total of 90 of these articles were randomly selected as the training data set, and 10 were used in a “hold out” validation/testing scheme. The process required converting the text of interest into a Corpus document and then the removal of punctuation, numbers, common English terms (referred to as stop words), and any terms found in more than 50% of the documents. The remaining words were then stemmed to reduce them to their common prefixes. The documents were then transformed into Document Term Matrices consisting of word frequencies and applied to an XGBoost [44] algorithm. In a process of hyper-tuning, the max_depth, eta, gamma, subsample, colsample_bytree, min_child_weight, max_delta_step parameters of the XGBoost [44] algorithm were each concurrently randomized over 10,000 iterations of 5-fold cross validation. The parameters which achieved the lowest testing error rate using the mlogloss evaluation criteria were then applied alongside the saved corresponding seed value (to reproduce the random-value environment responsible for generation of the model) towards construction of the final text classification model. 
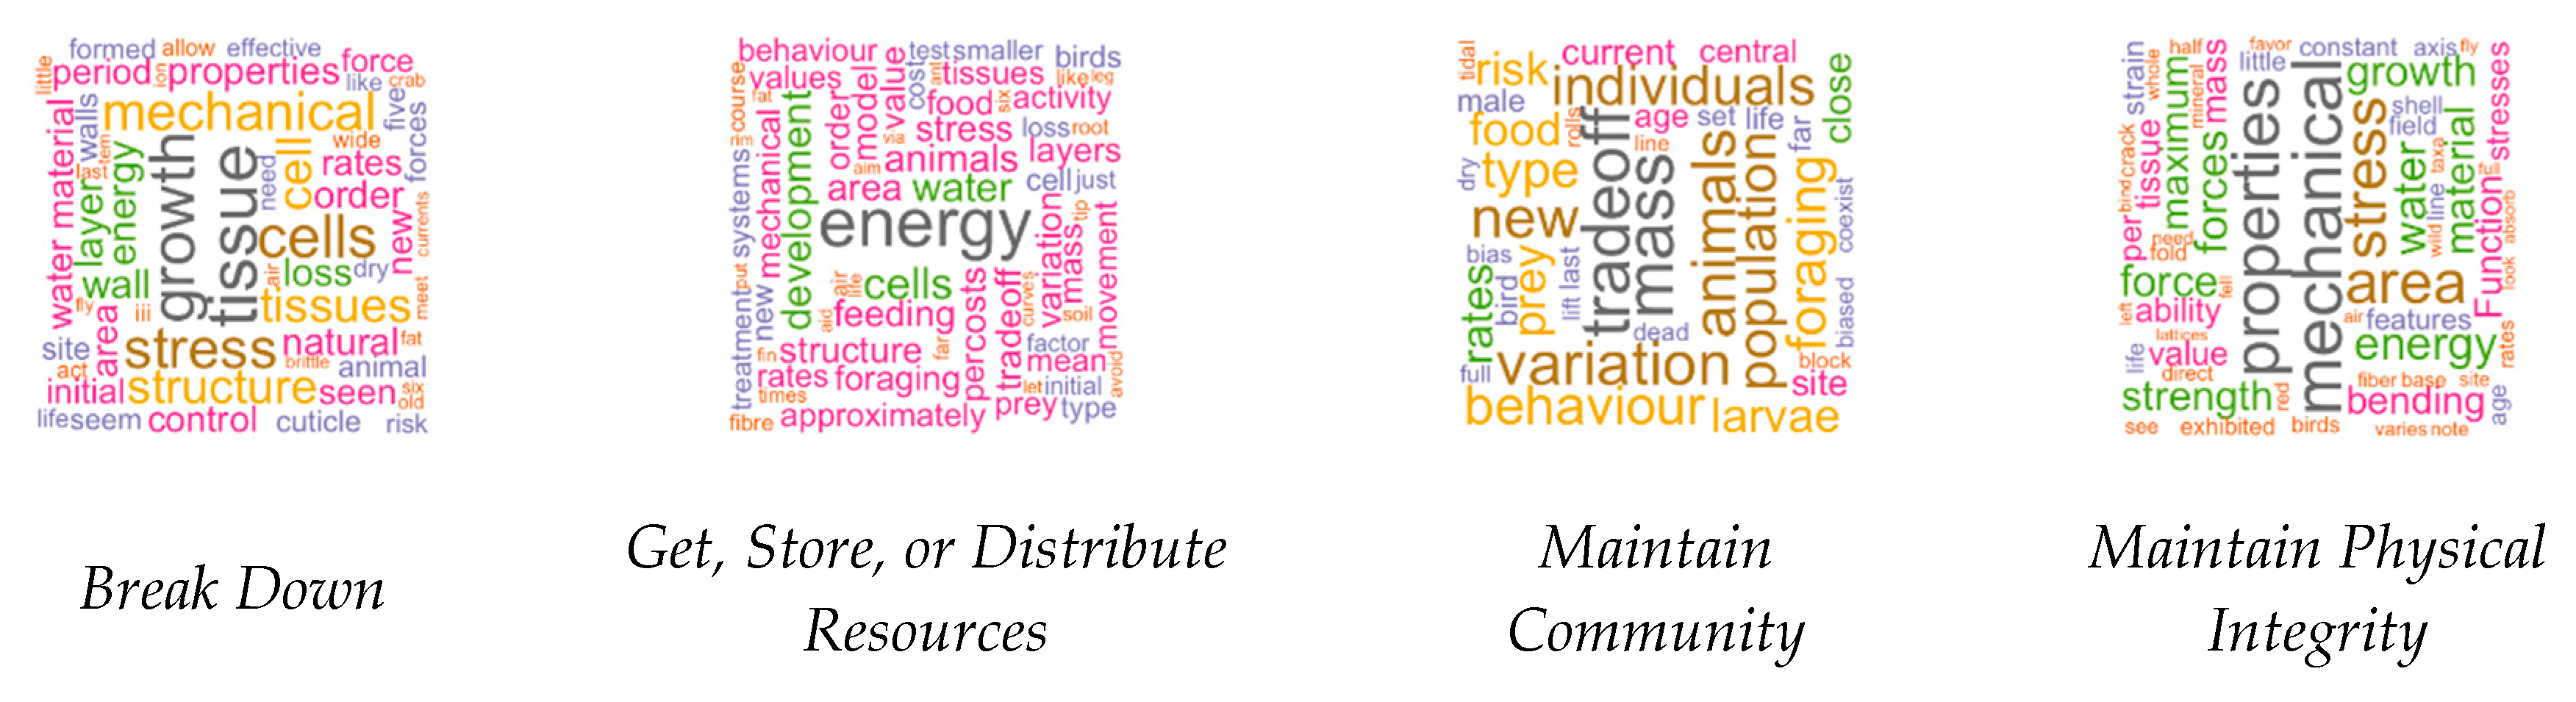
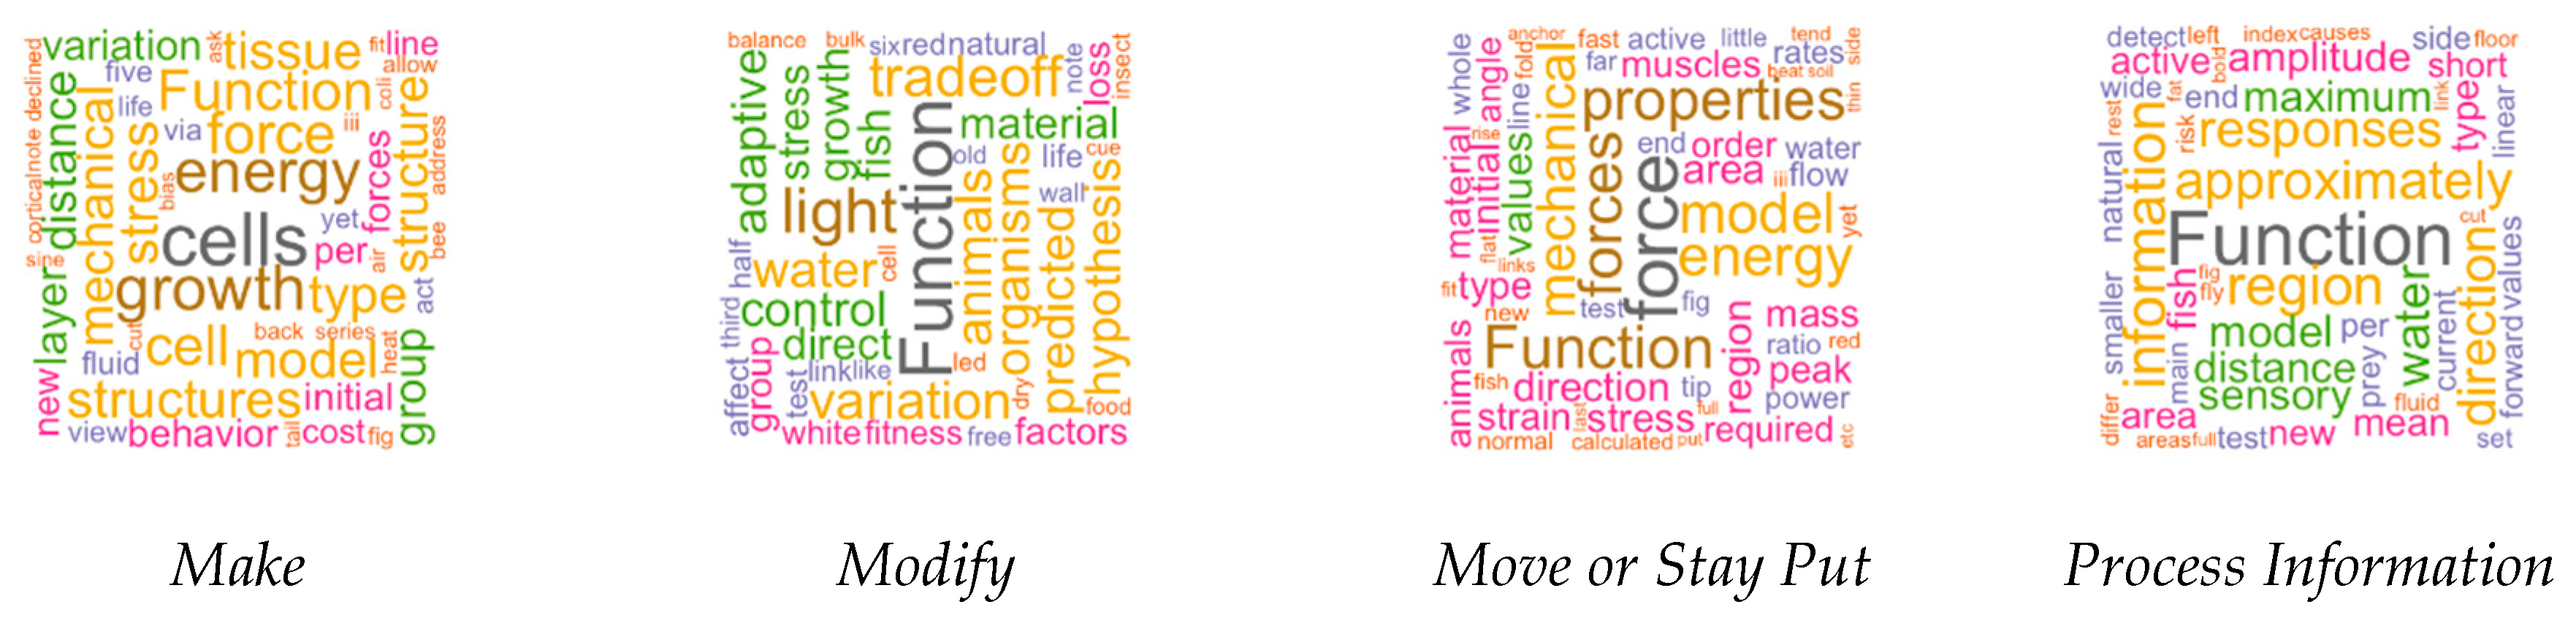
Figure 14 shows word clouds displaying the highest terms found in each of the classes/labels for the 90 articles used to train the XGBoost classification algorithm.
After creating the XGBoost model, the hold-out testing set was then classified to determine the level of harmonization as compared to the human label curation methodology. Once the classification tool was developed, it was also necessary to determine whether an unsupervised approach would yield a breakdown of topics similar to that of the AskNature taxonomy [43] keeping in mind that there may be overlap in terms or an alternative way to view topics. Exploratory analysis of the text composition was carried out through an unsupervised application of a random forest machine learning algorithm, which was used to generate a proximity matrix to apply towards a partition around medoids (PAM) algorithm [45]. The optimal k or number of clusters was analyzed, and a k = 8 was selected to determine the degree of possible concordance between the manually assigned labels and the PAM clusters. Latent Dirichlet Allocation (LDA) [46] was then also applied to the data by specifying 8 topics to compare concordance between the manually assigned labels and the PAM clusters. The classification model was then also applied to a set of un-labeled articles focusing on extremophile and microbiology literature as a demonstrative use case for the algorithm’s capabilities, as well as towards the aggregated and unstructured text data gathered through webscraping to attempt to identify functional biomimetic engineering correlations with different species of interest. The hyper-tuned XGBoost algorithm’s 5-Fold Cross Validation obtained a minimum logloss value of 1.846 after 35 rounds, as shown in Table 2.
The results of this model, as applied to the hold-out testing data, set are displayed in Table 3. Orange cells indicate the articles that were not classified in concordance with the manually assigned labels. The darkest blue cells indicate the highest probability scores from the XGBoost model’s results, while the lighter shade of blue indicates the second highest probability score, and the lightest shade of blue represents the third highest probability score. The dark green cells indicate the article was classified by the algorithm as the highest probability in concordance with the manually assigned label, the lighter shade of green indicates that the article’s second highest probability score from the algorithm matches the manually assigned label, and the lightest shade of green indicates that the 3rd highest probability score matches the manually assigned label. In an effort to examine the underlying statistical trends existing within the training data set, unsupervised analysis was carried out via PAM through a random forest proximity matrix and LDA (Latent Dirichlet Allocation). PAM analysis was performed with a k = 8 clusters and LDA with
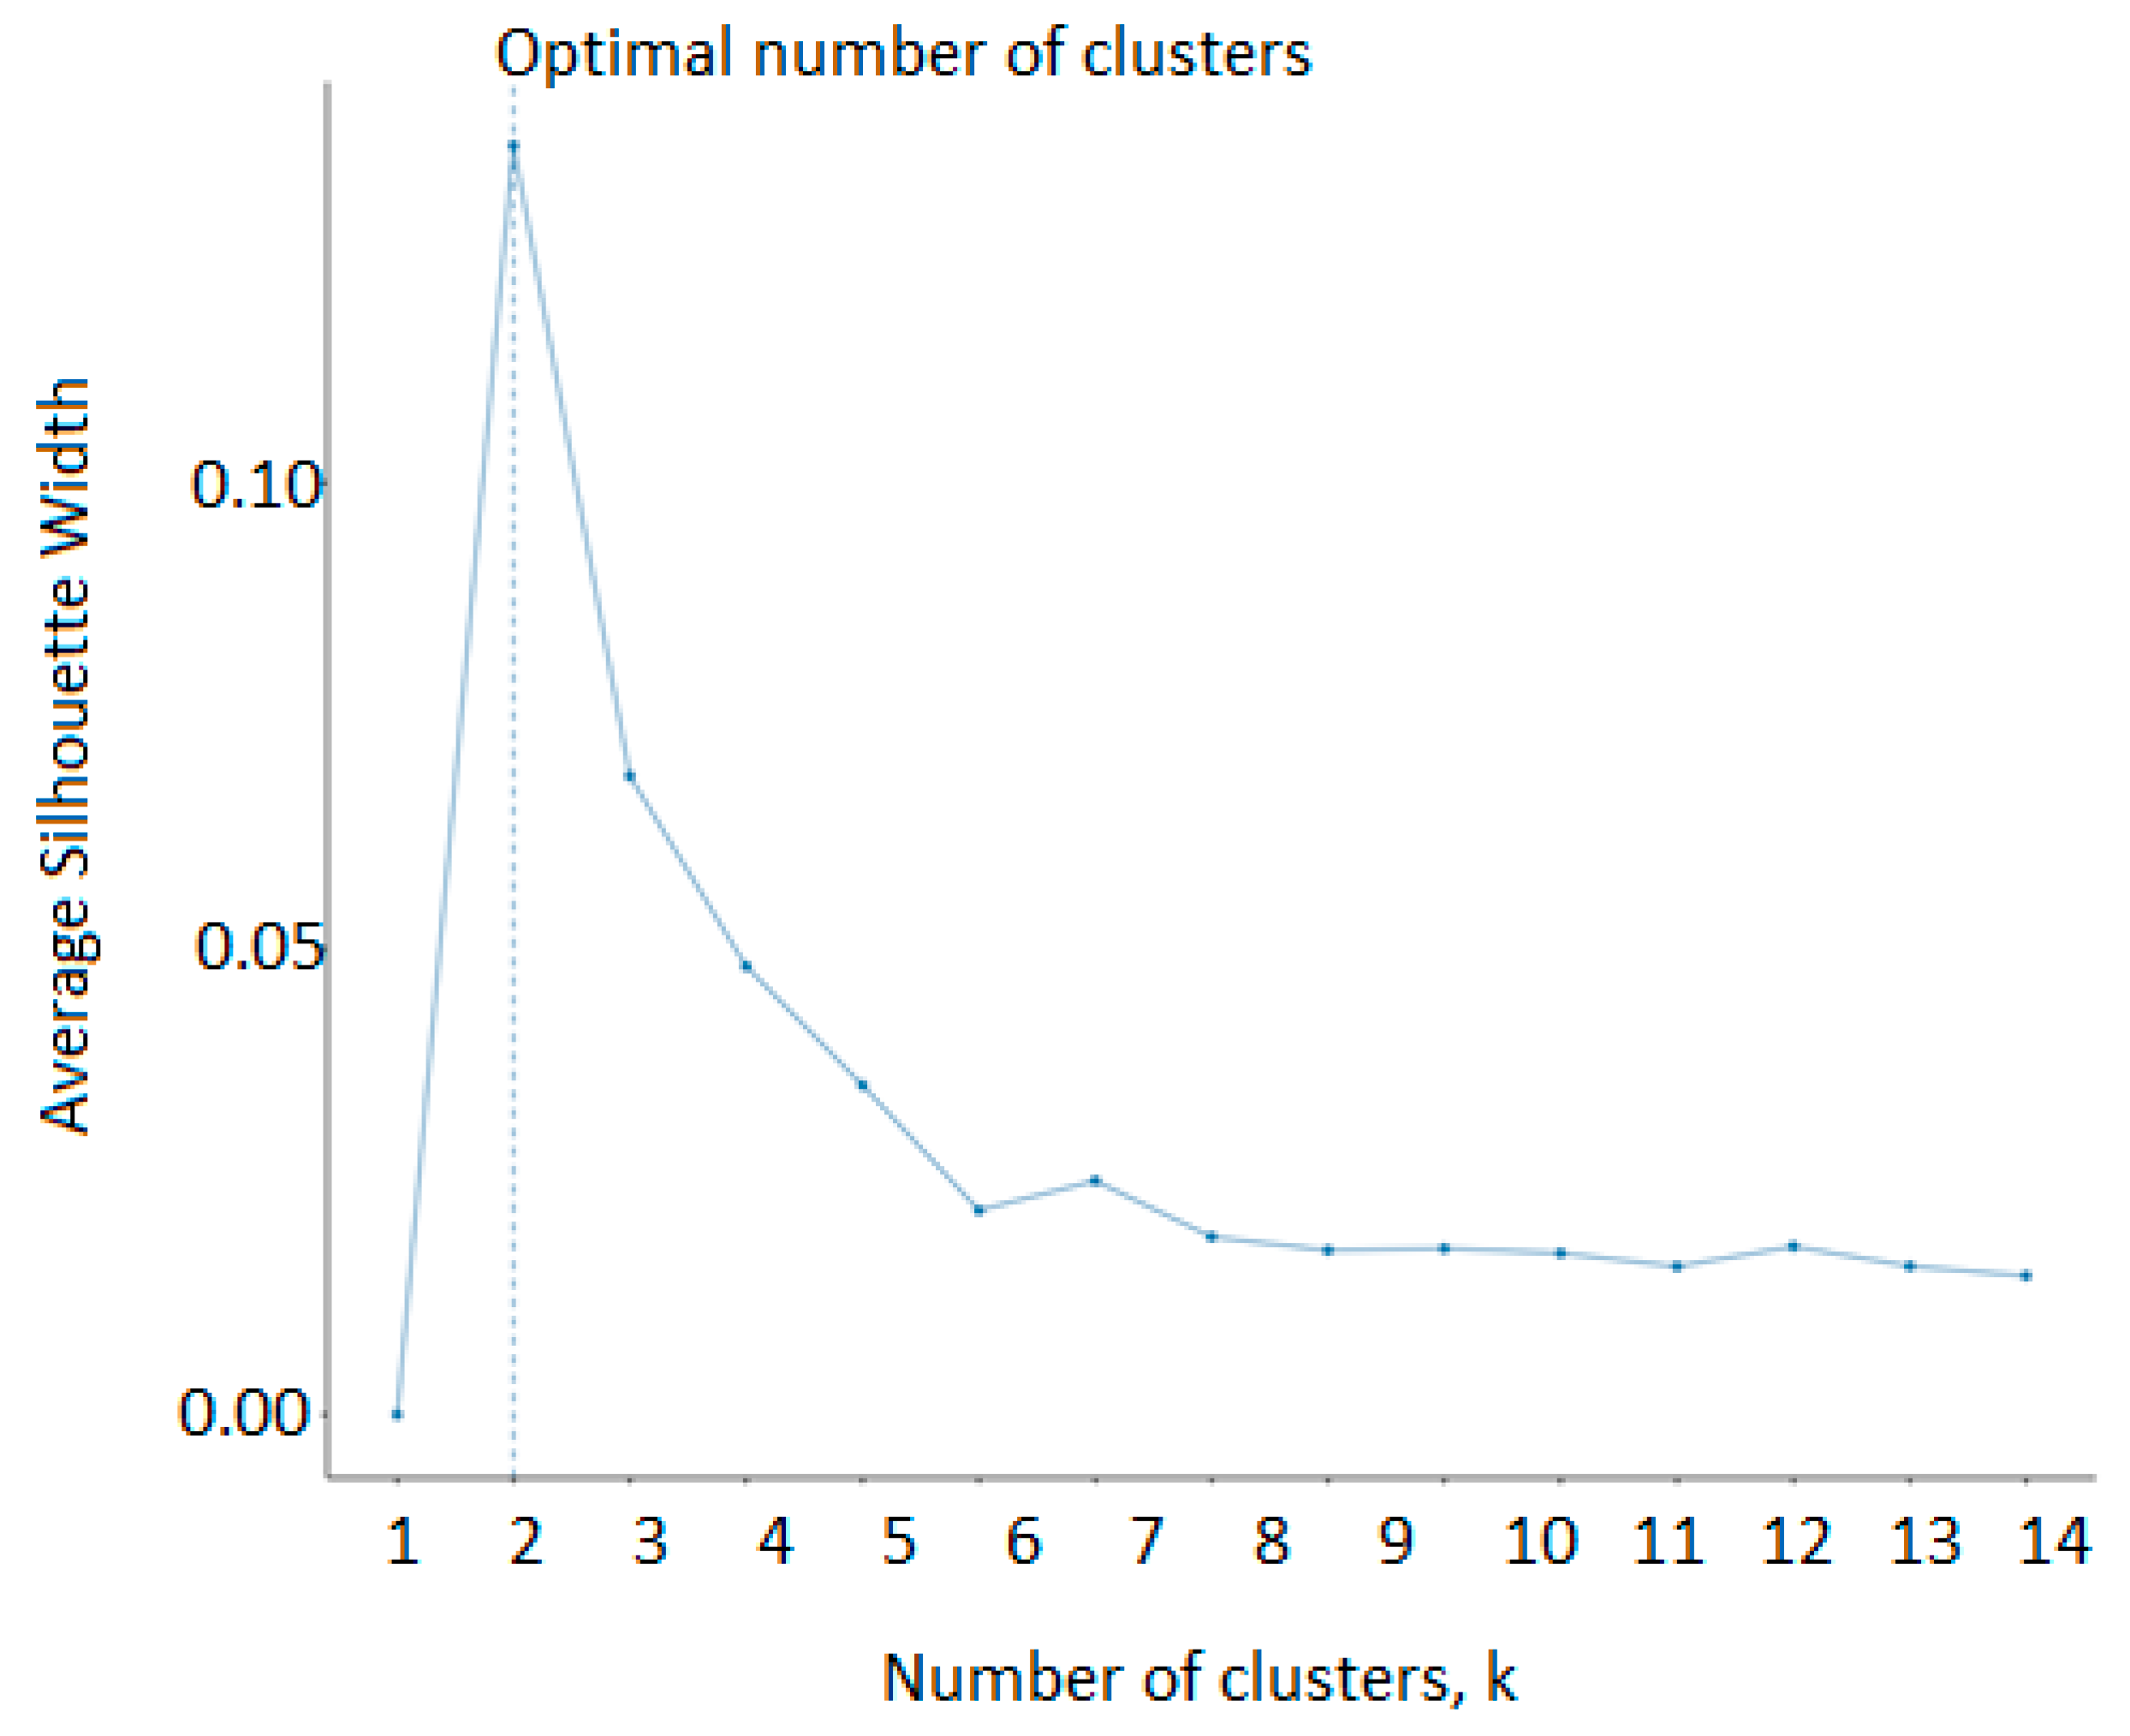
 k = 8 topics. In Figure 15, a silhouette profile was generated for the purposes of PAM clustering and depicted optimal clustering with k = 2 as well as a slight peak around 
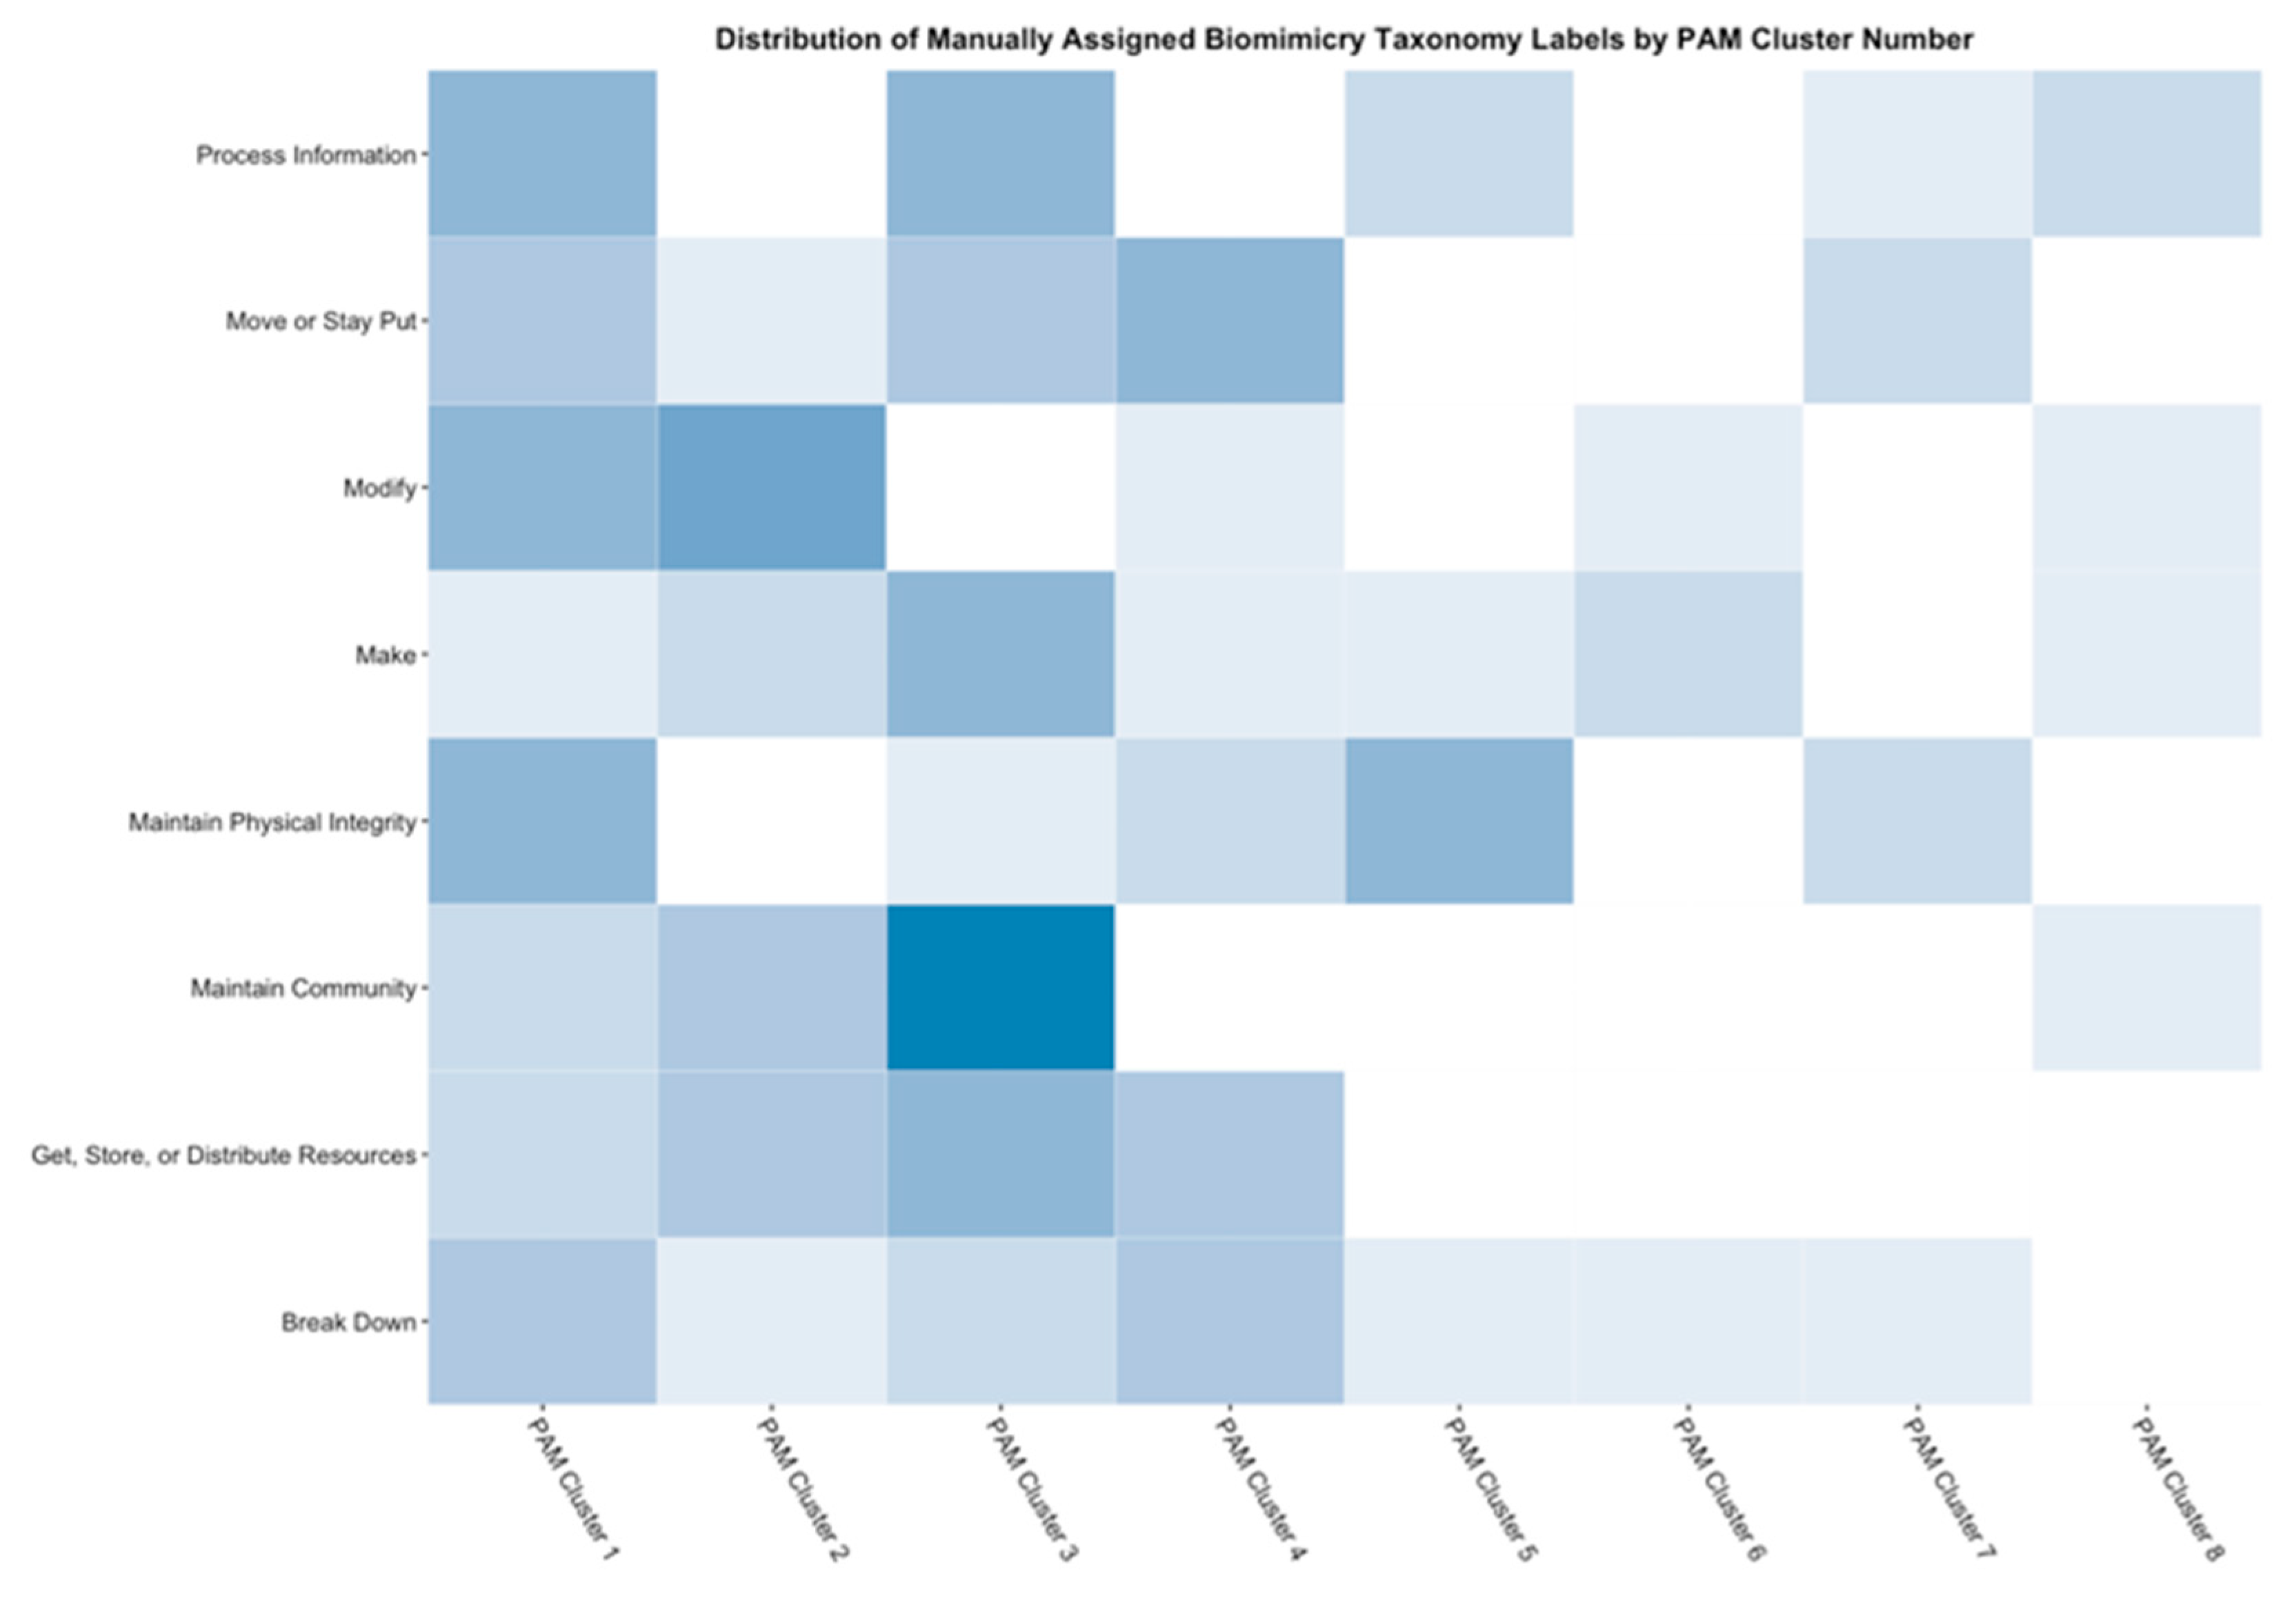
k = 7. Examining the heat map in Figure 16 depicts the co-localization between PAM clusters and the manually assigned Biomimicry Taxonomy labels, where it can be observed that PAM cluster 3 appears to contain a significant proportion of the “Maintain Community” labels, as well as a rough distribution of different labels across each cluster.
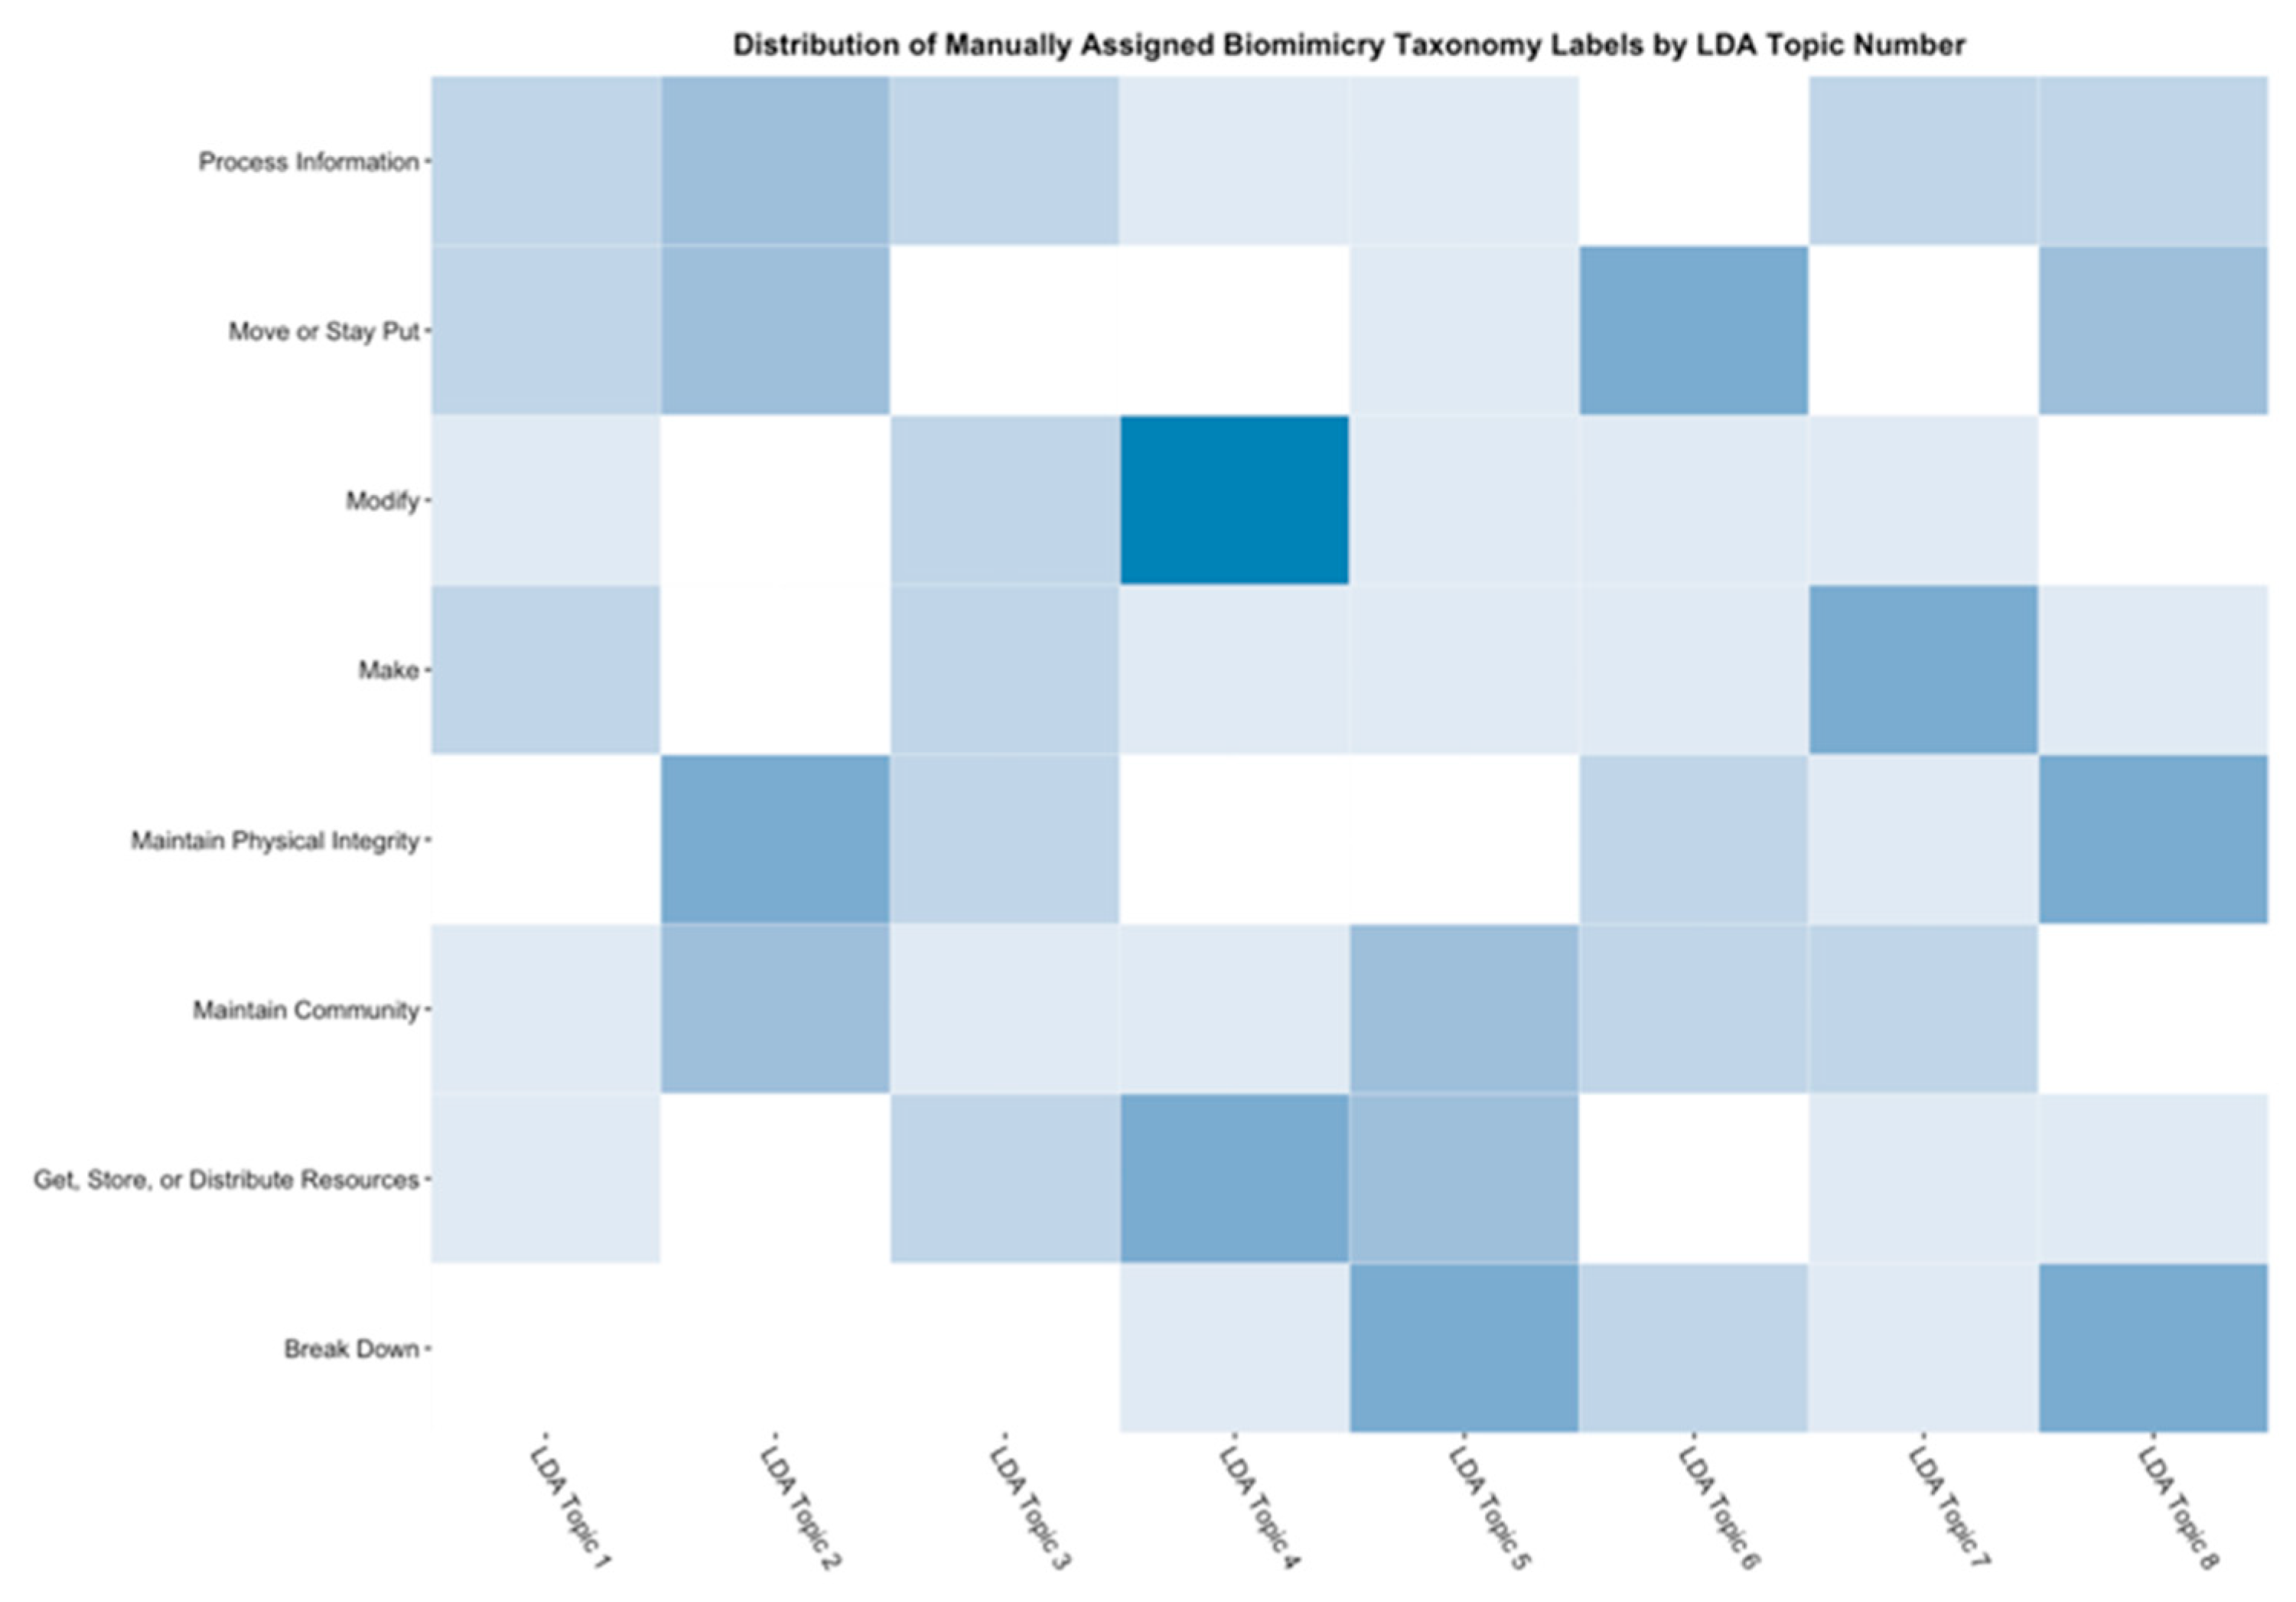
Analysis of the peak in the silhouette profile and the level of concordance between clusters and manual labels within the heatmap could thus possibly indicate the existence of a limited statistical basis underlying the results of the manual labeling strategy, despite ambivalent cluster distributions for several labels. The heat map in Figure 17 demonstrates the co-localization between LDA topics and the manually assigned Biomimicry Taxonomy labels, where we observe a potentially significant correlation between the “Modify” label and LDA Topic 4, as well as a somewhat discernable scattered concentration of the manually assigned labels across LDA topics.
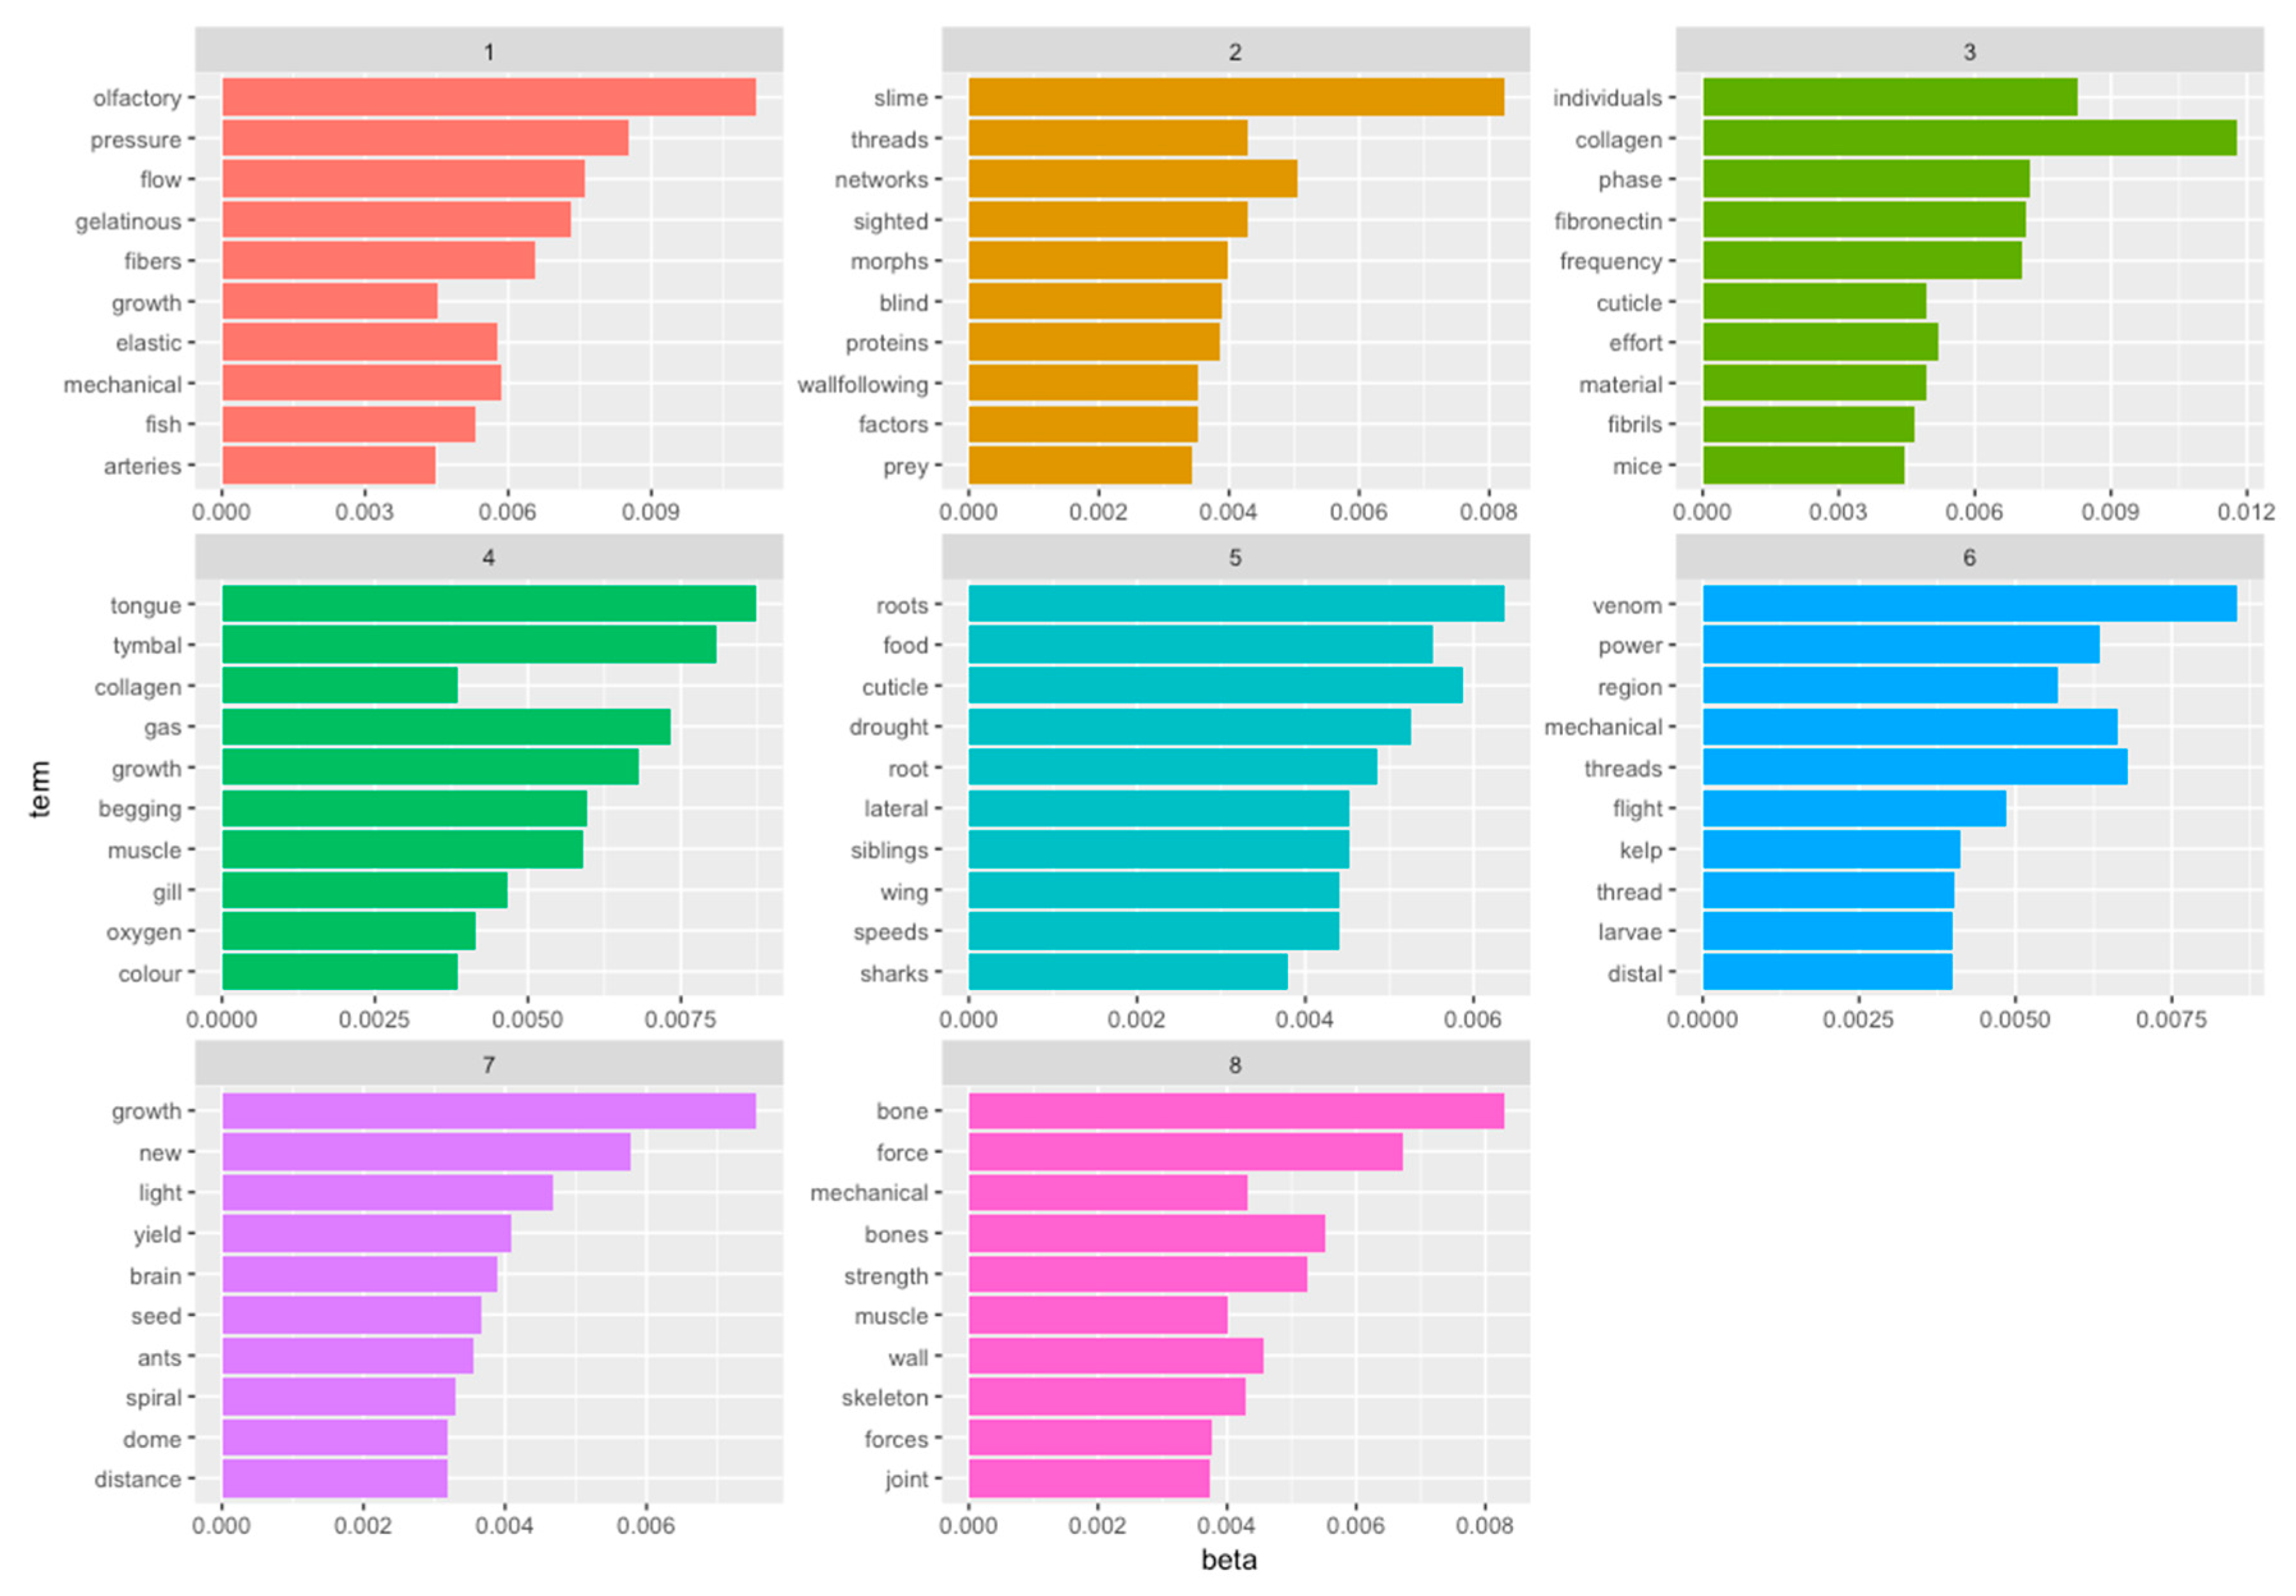
An analysis of the LDA topic highest word frequencies is shown in 
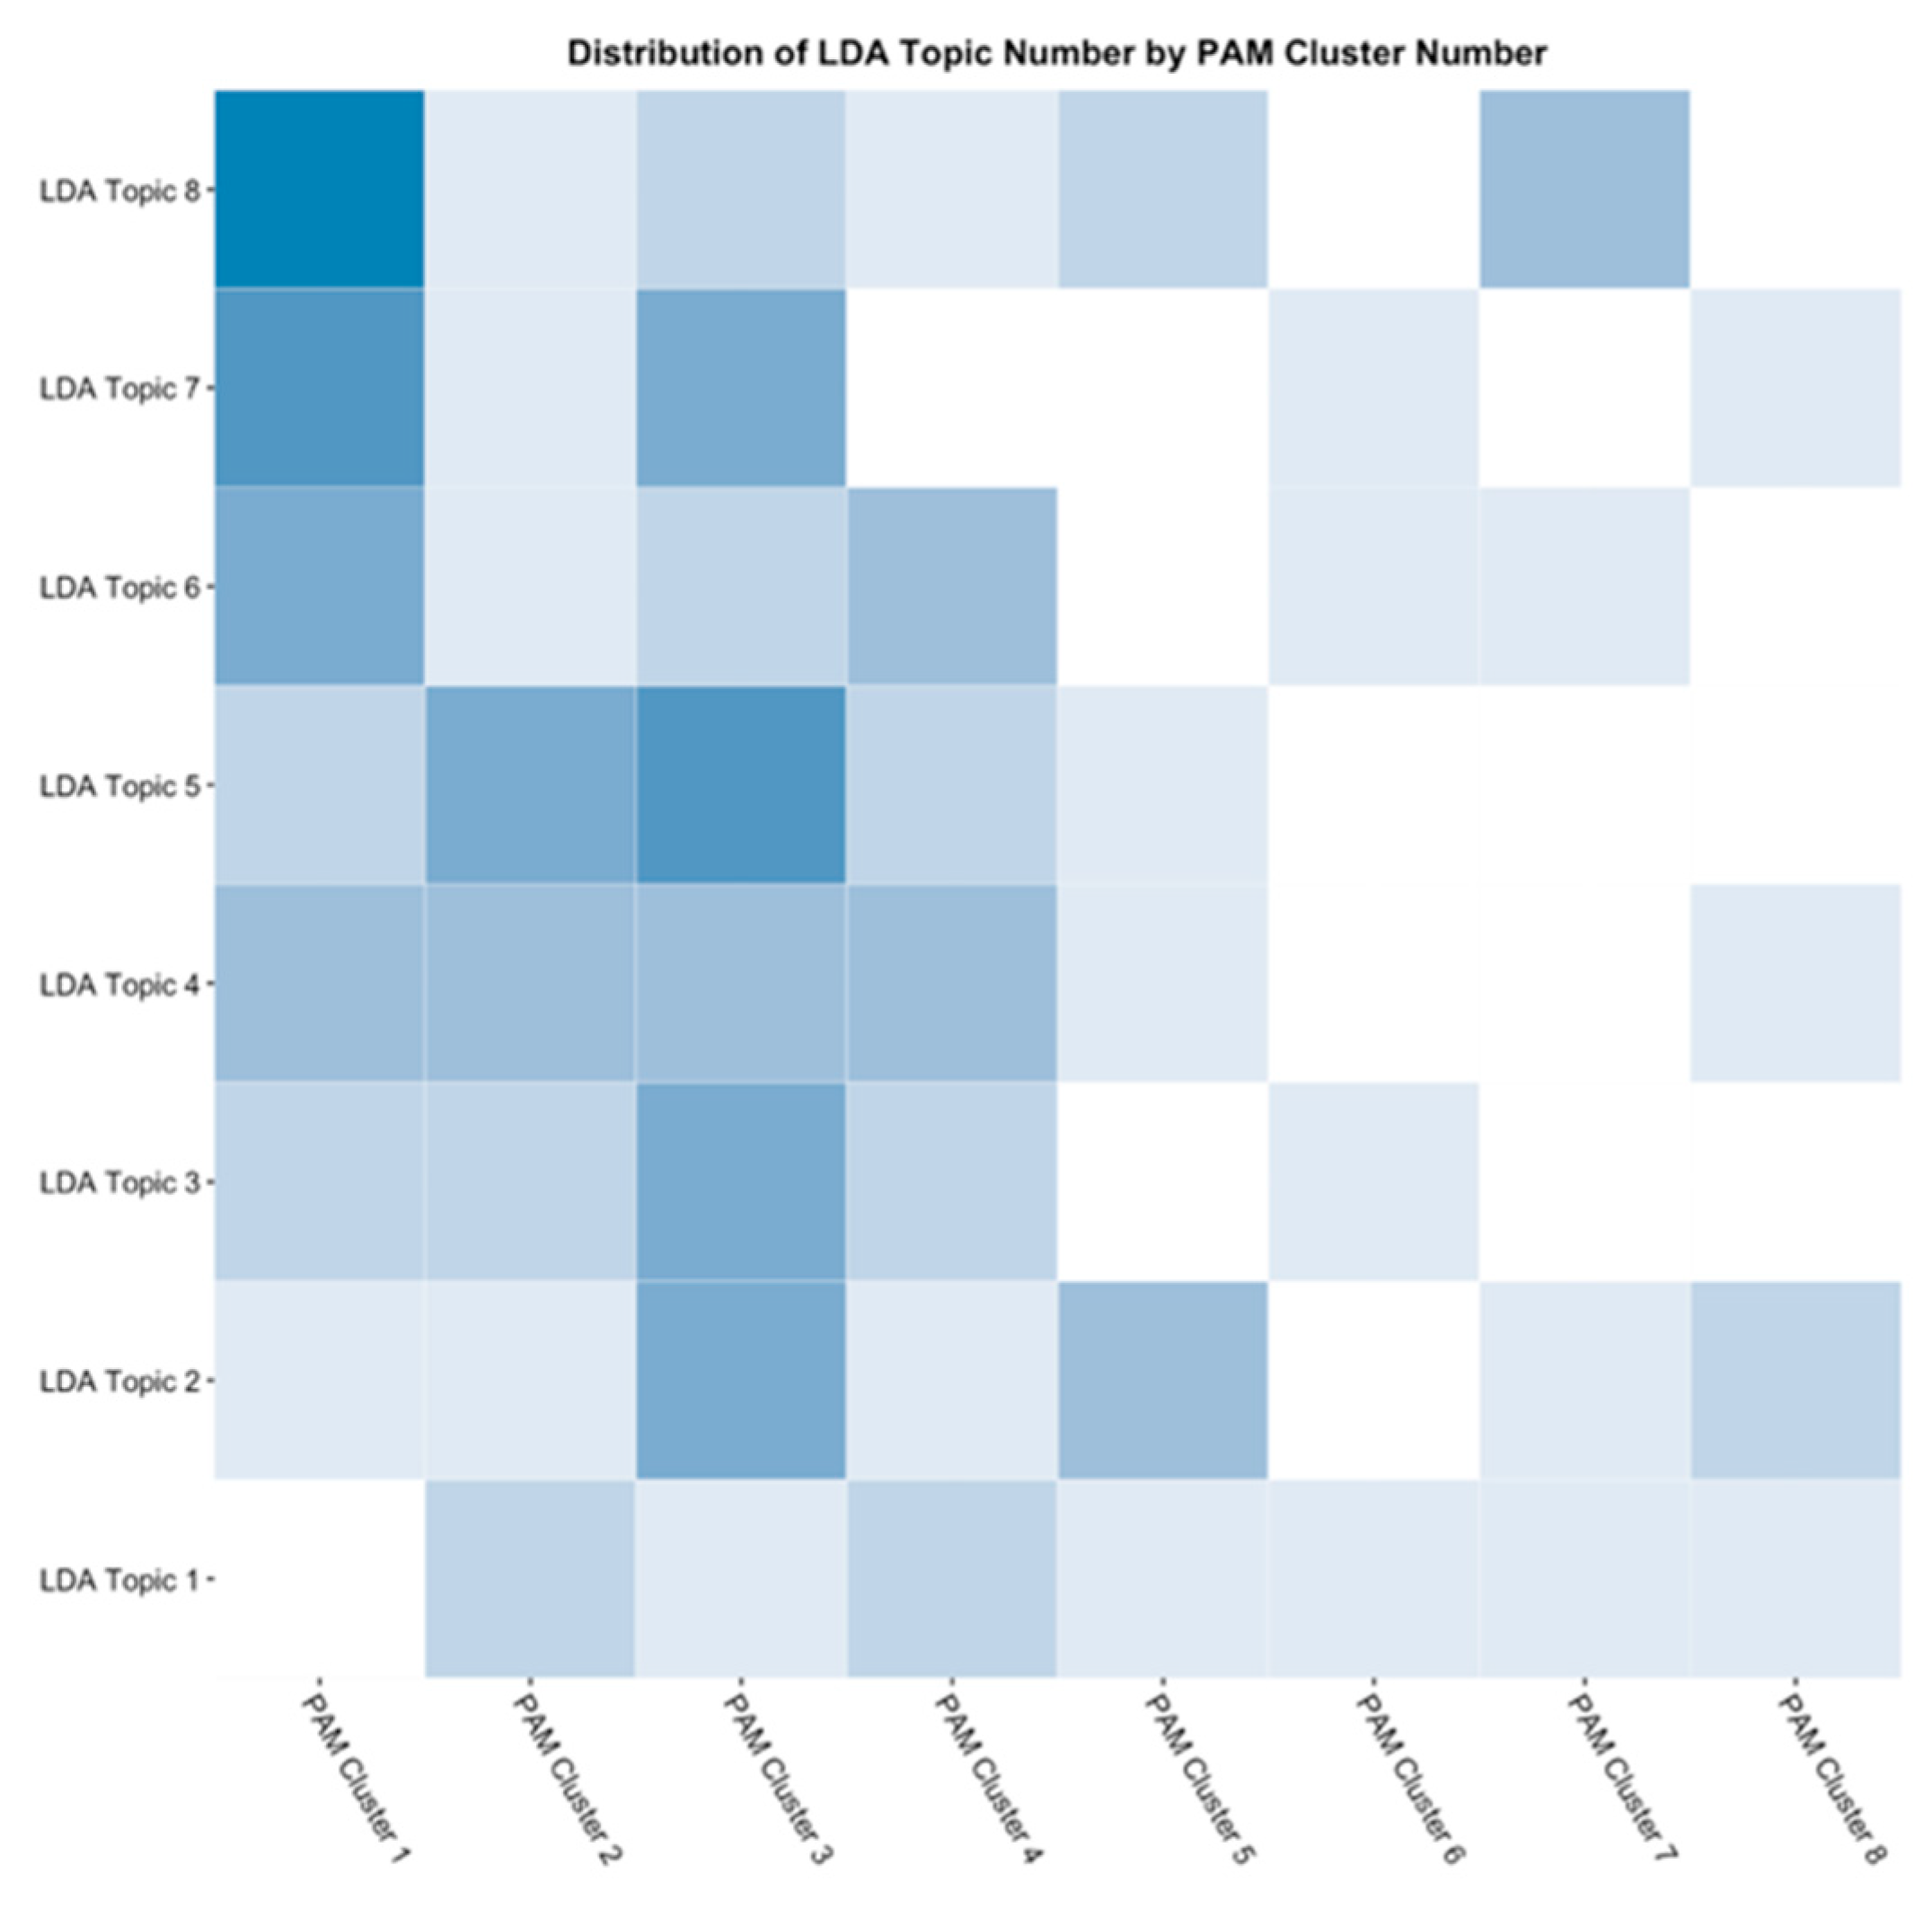
Figure 18. Finally, from the heat map in Figure 19 that compares articles found in the LDA topics vs. the PAM clusters, we can observe a potential relationship between PAM cluster 1 and LDA topic 1 with less overall concordance across topics and clusters reflecting the different statistical methodologies inherent to these analytic techniques.
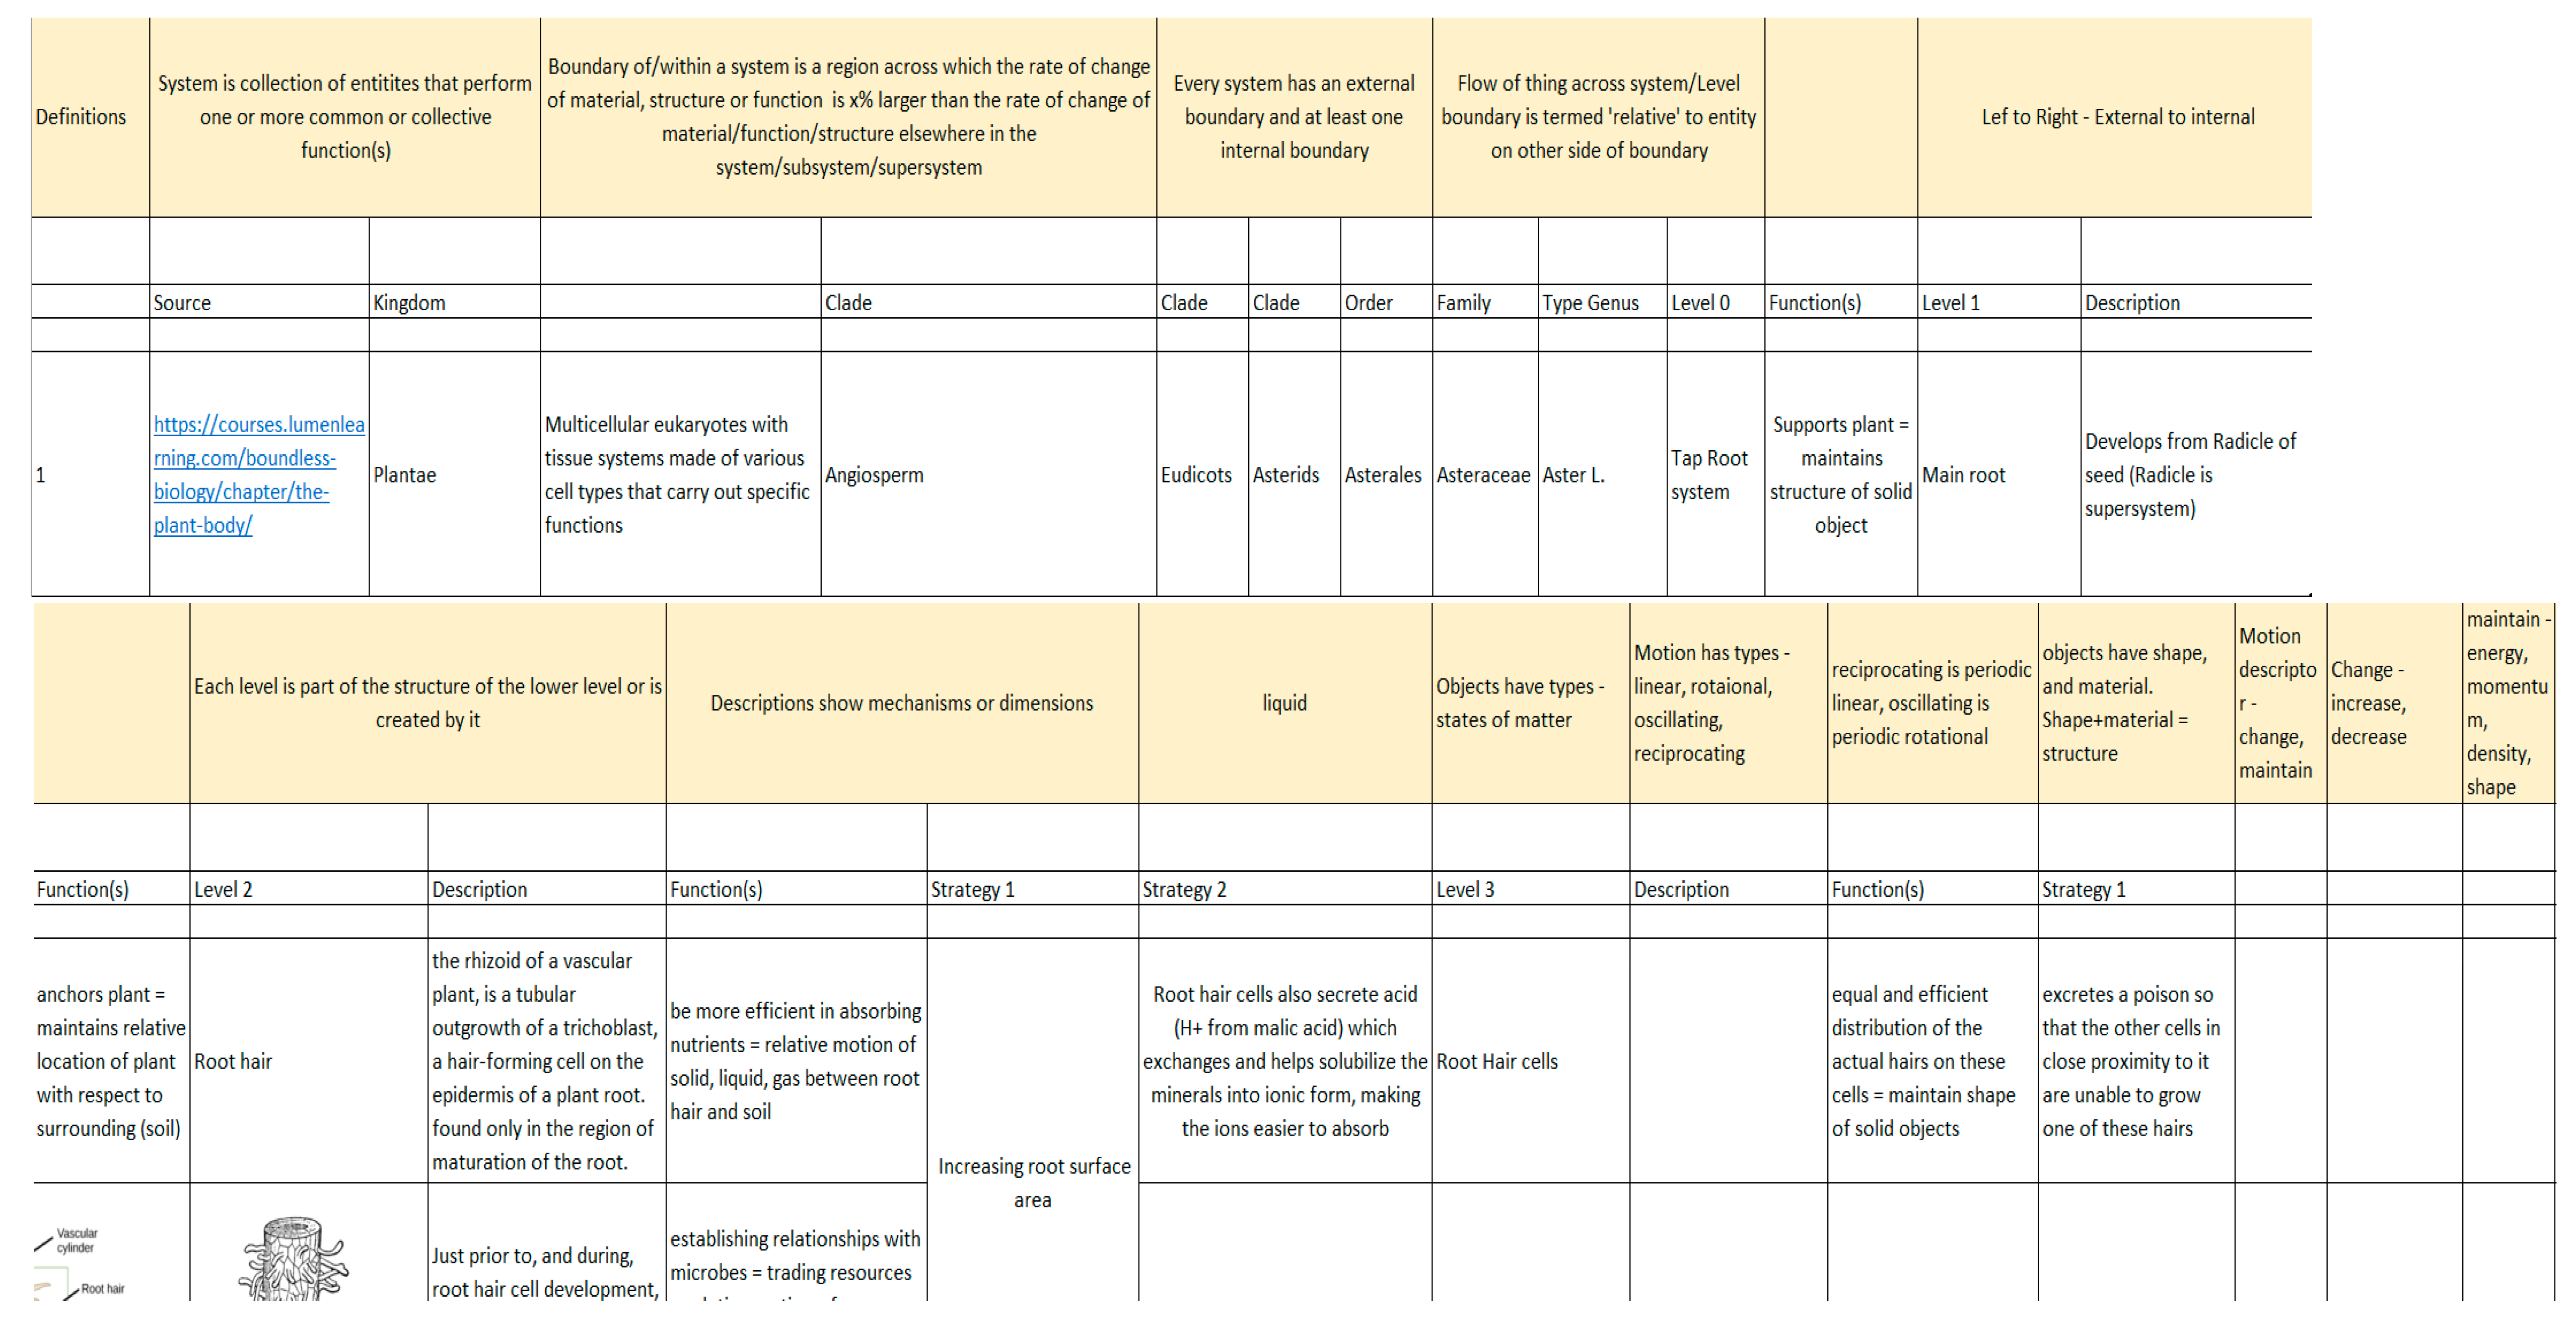
Another approach taken to develop a taxonomy is shown in Figure 20. Here, a system is defined as a collection of entities that perform one or more common or collective function(s). The entities may be called subsystems as they in turn are a collection of entities that perform one or more functions. A collection of systems may then be termed a super system. Every system except perhaps the universe has an external boundary (interface to super systems) and at least one internal boundary (interface to subsystems). Identification of system boundaries is a complex subject that has been explored by many authors [57]. We assume that a boundary is dependent on the action or function of interest as identified by the flow of resources, energy or information across it. This flow or travel may occur completely within the system control volume, between the system and the environment or between the system and another system directly. The approach involves identifying a genus (Aster) and breaking it down into organ systems (root system, reproductive system etc.). The premise is that within a genus, the morphology exhibits sufficient similarities to ensure that the same hierarchy of taxonomy exists across species. This is not to say that there is no inter-species variation but that in general all species within a genus exhibit similar morphology. The organ systems were then further broken down into subsystems. At each level, the action, object of the action, interface of the object and the entity performing the action, the result of the action (change or lack of change), state of the entity and object were noted. This was done in a manner specific to a genus. The exercise was repeated with human organ systems as the systems of interest [58]. Once specific functions for each system were identified, then the functions, resources and environment were abstracted to attempt to create a building block set of attributes. For example, the statement “Lung is an organ to exchange carbon dioxide and oxygen” is abstracted to “exchange of chemicals from liquid to gas”. We may break this down further to “a change in chemical composition of the lung system (increase of oxygen, decrease of carbon dioxide) through a physical mechanism”. Conversely, the process also results in a change in chemical composition of the air (decrease of oxygen, increase of carbon dioxide) through a physical mechanism. It emerged that, beyond a certain level, the functions and morphology for a species share much in common with other species in the genus and we do not need to research at a species level except for species-specific features or functions.
Some of the patterns that emerged are shown in Table 4 (with a focus on changing states rather than maintaining states) with the final column of Table 4 showing a mapping to the AskNature taxonomy [43] and the third column showing a mapping to the tertiary terms of the engineering to biology thesaurus [59]. The non-abstracted functions show 10 high level topics similar to that of AskNature’s taxonomy [43]. The functions that emerged were Generate, Destroy, Attach, Detach, Transport, Transfer, Exchange, Regulate, Promote, Inhibit. These may be reduced to 7 if we combine Generate and Destroy, Attach and Detach, and Promote and Inhibit. However, upon abstraction (column 1), it appears that it may be possible to create a standardized way of identifying functions as shown in Table 5. By combining 1 element from each column, we can create functional statements that correspond to each action in Table 4. As an example, the statement that relates the attachment of a burr to a pair of trousers may be specifically written as “A solid is hooked (attached) to another solid” and abstracted to “A solid maintains its mass interface with another solid through physical mechanism”. This disambiguates mass interface from energy interface which may be applicable in the case of two magnets that are attached or connected by their fields.
Due to the preliminary nature of the building block taxonomy shown in Table 5, we use the AskNature taxonomy [43] as a starting point to classify journal articles, and the engineering to biology thesaurus to perform search queries in PeTaL. However, the taxonomy and ontology are easily modified through editable input files.
Figure 21 shows a possible workflow for PeTaL, while Figure 22 shows multiple possible pathways for a problem solving process. Inspiration for this process could come from quantum biology. The intent of looking to quantum biology to determine workflow is to enable multiple approaches to be weighed simultaneously before choosing one that is appropriate for the task. Initially multiple pathways should be followed to build a robust training set upon which to train the algorithm. The particular details are left to future work. The decision on which workflow to traverse would depend on such factors as:
  • Type of question or problem being posed
    • Abstract problem: Ways to move through a fluid. Identify articles that have been classified with terms related to fluid flow and efficiency using topic modeler. A bag of words will be used for the classification based on unsupervised clustering or online dictionaries. Unsupervised clustering would be performed on articles, a subset of which contain references to fluid flow or motion.
    • Well-posed problem—design a widget or change something: Reduce drag on aircraft wing. We may use existing natural language processing tools to identify the noun, verb and adverb triad (wing, drag, reduce). We associate these triads with their respective bags of words. Then, we search classified articles for biological models that match the triad bags of words.
    • Well-posed problem at system level: Break into subsystems and follow process for step 1.b.
  • Type of solution sought
    • Background resources regarding a topic: Provide articles, websites or images based on classification results.
    • Inspiration for design without a specific end goal: Use the visual graph network to enable the user to click and explore data.
    • Proposed solutions given a problem: Once the problem has been abstracted and a set of possible biological models has been identified, show the data on a plot to allow the user to assess feasibility.
    • Completed system solution for a high level challenge: This requires completion of a tool to create a human technology ontology and mapping from biology to technology. Supporting tools such as the ontology graph and clustering tool would be common between biological entities and human technology entities. This would require the abstraction of biological systems to enable their comparison to human systems perhaps using the taxonomy in Table 5 in addition to knowledge of degrees of freedom.
  • Format of question
    • Image: The user may submit a picture of an organism or a man-made entity. Computer vision would be used to identify the primary pattern in the image, identify the entity or organism and the environment of the entity. Feature recognition would be valuable. Once identified, the data in PeTaL that is tagged with the features, patterns or organism would be available. Similar patterns may be suggested for inspiration or functions associated with the pattern may be presented as a suggestion.
    • Video: Use of activity recognition would enable explanation of mechanisms and their relationship to functions and morphology.
    • Text, key phrases: This relates to 1.b. and the manner of data classification and tagging.
  • Amount of data available
    • For Insights on patterns, features and applications beyond a single use case, a large quantity of data is required that contains sufficient connections to other entities.
    • For scaling:
      • Qualitative
        • Clusters are sufficient and sparse data sets may be able to provide this information. For example, we know that thick, cambered airfoils generate high lift and drag compared to thin airfoils without camber.
      • Quantitative
        • Sufficient data required to generate statistics across scales.
    • For inspiration:
      • Number of articles, models, case studies available
      • Soundness of NLP to identify linkage between query and model.
  • Quality of data available
    • Is data from respected source like journal or curated database? How do we measure this: number of citations, impact factor?
    • Is data resolution sufficient?

4.3. Status of PeTaL

PeTaL is currently being prepared for open-source deployment through NASA’s Software Portal. A prototype was initially created using R and Rshiny, but was later transitioned to Python for scalability and customizability. 
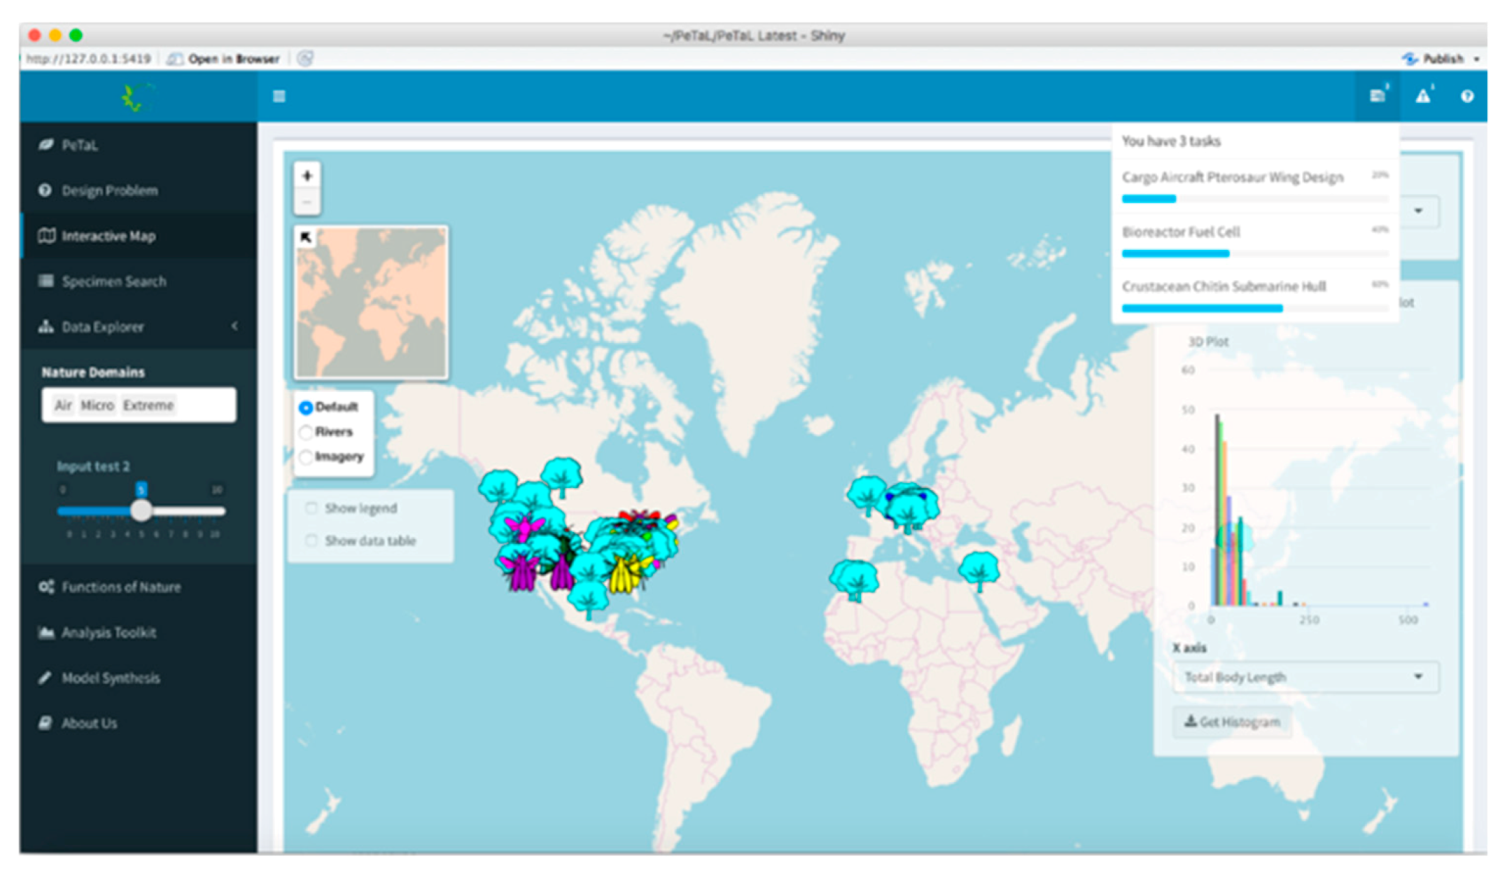
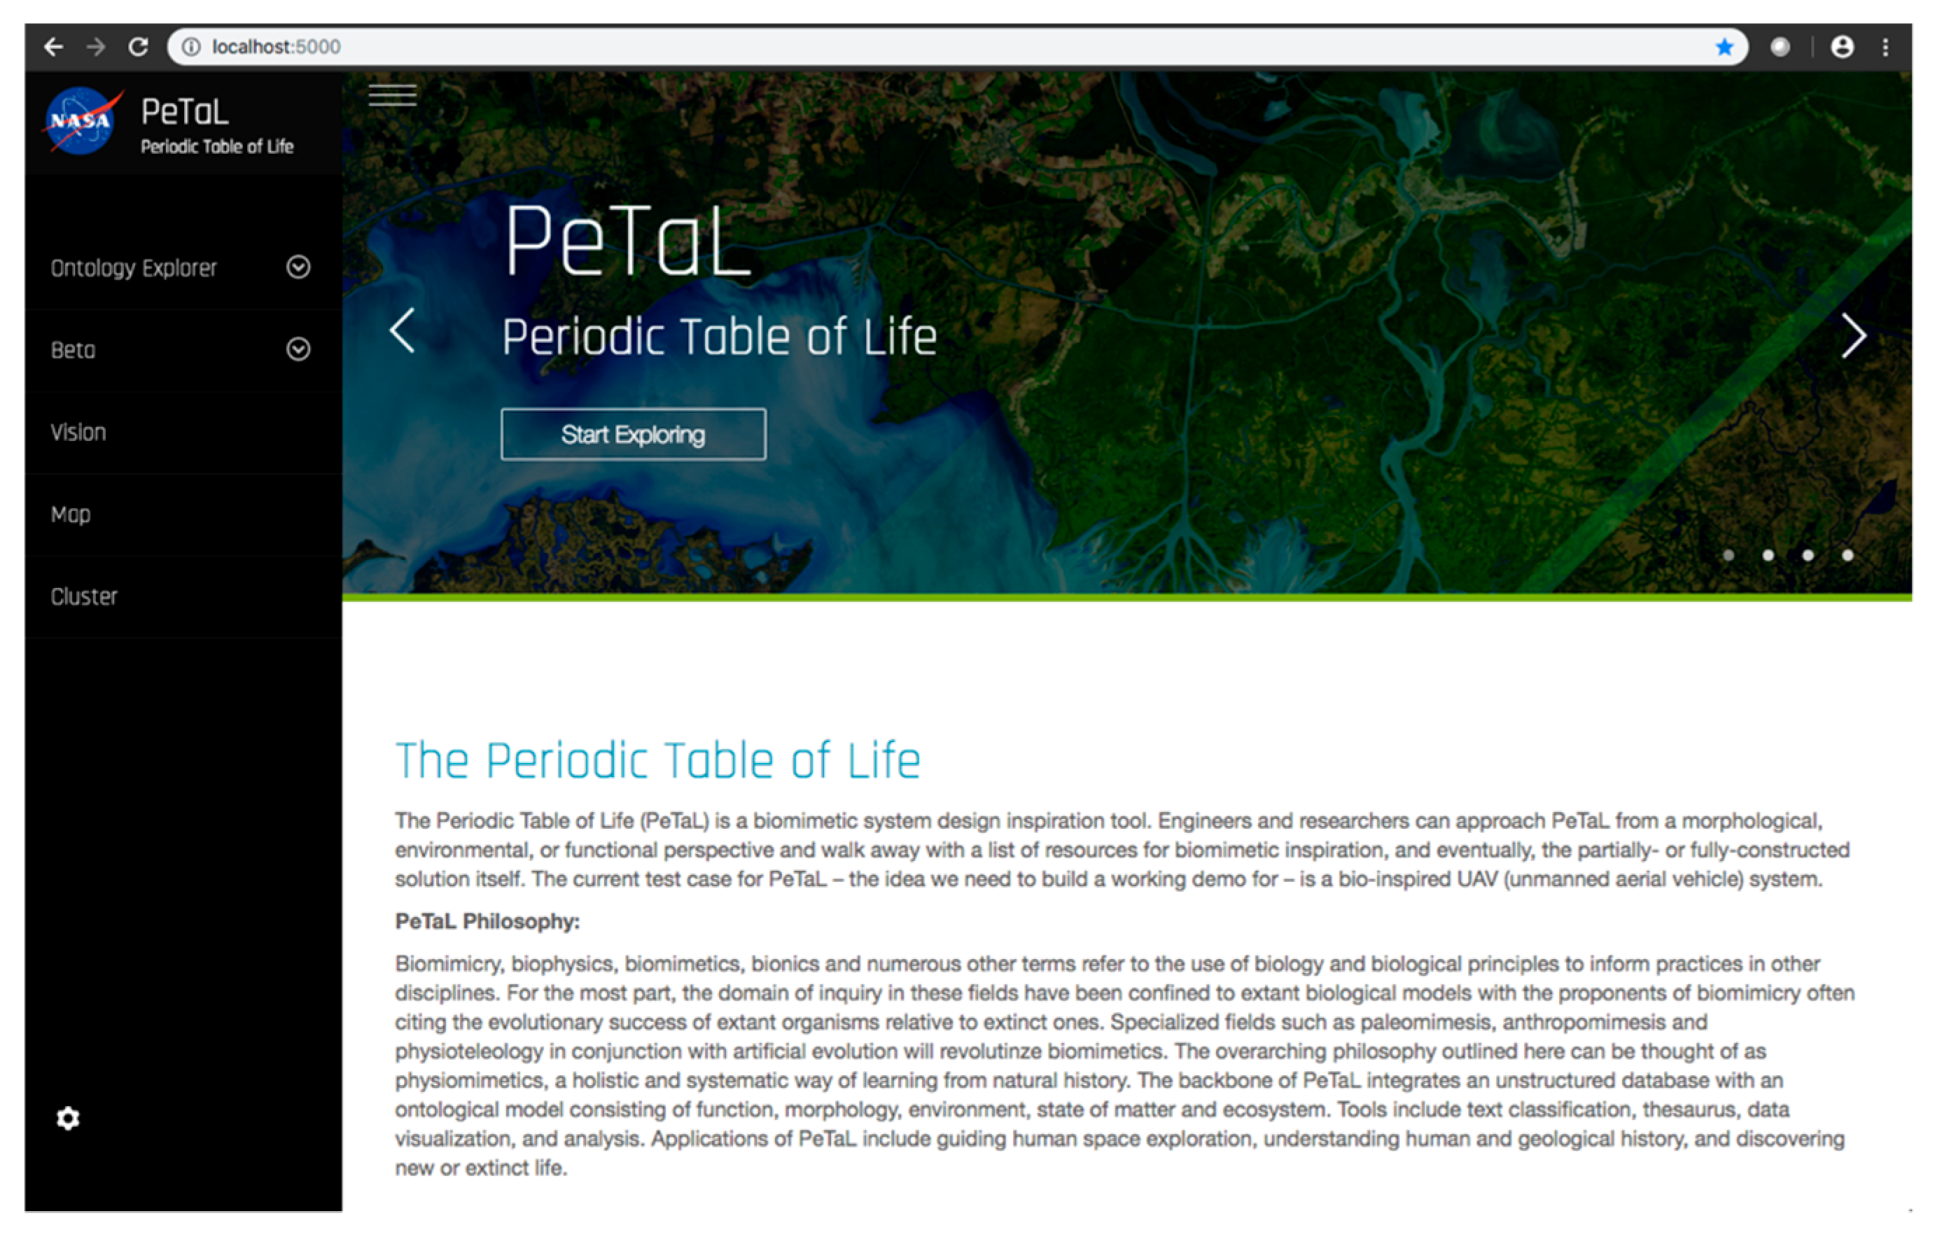
Figure 23 shows the original PeTaL user interface.
Refer to the components of PeTaL in Section 4.1 (Figure 13) to understand the relationship between the tools and capabilities that follow and the PeTaL architecture.
a.
User Interface: HTML, CSS, and JavaScript were used to create a barebones PeTaL user interface with a home, profile, map, vision, and graph page, implemented using the Bootstrap framework. The python-based home page for PeTaL is shown in Figure 24. SCSS, a superset of CSS, was introduced that allowed the writing of maintainable CSS in an object-oriented manner and enabled speeding up the process of styling elements and introducing new features and sections for the site. CSS was moved to more structured SCSS files. Doing so facilitated creating consistency and enhancing the platform with interactions, such as subtle SCSS driven scroll-triggered animations. Proper use of version control Git was key to develop new features and debugging. To reduce loading time of the application the number of HTTP requests was minimized.
b.
Ontology and database: The diversity and size associated with “Big Data” endeavors have enforced the adoption of non-traditional data storage systems. Thus, we have witnessed the dawn of NoSQL systems that allows for drastic increases in size over time, a concept known as scalability, as well as flexibility in formatting [
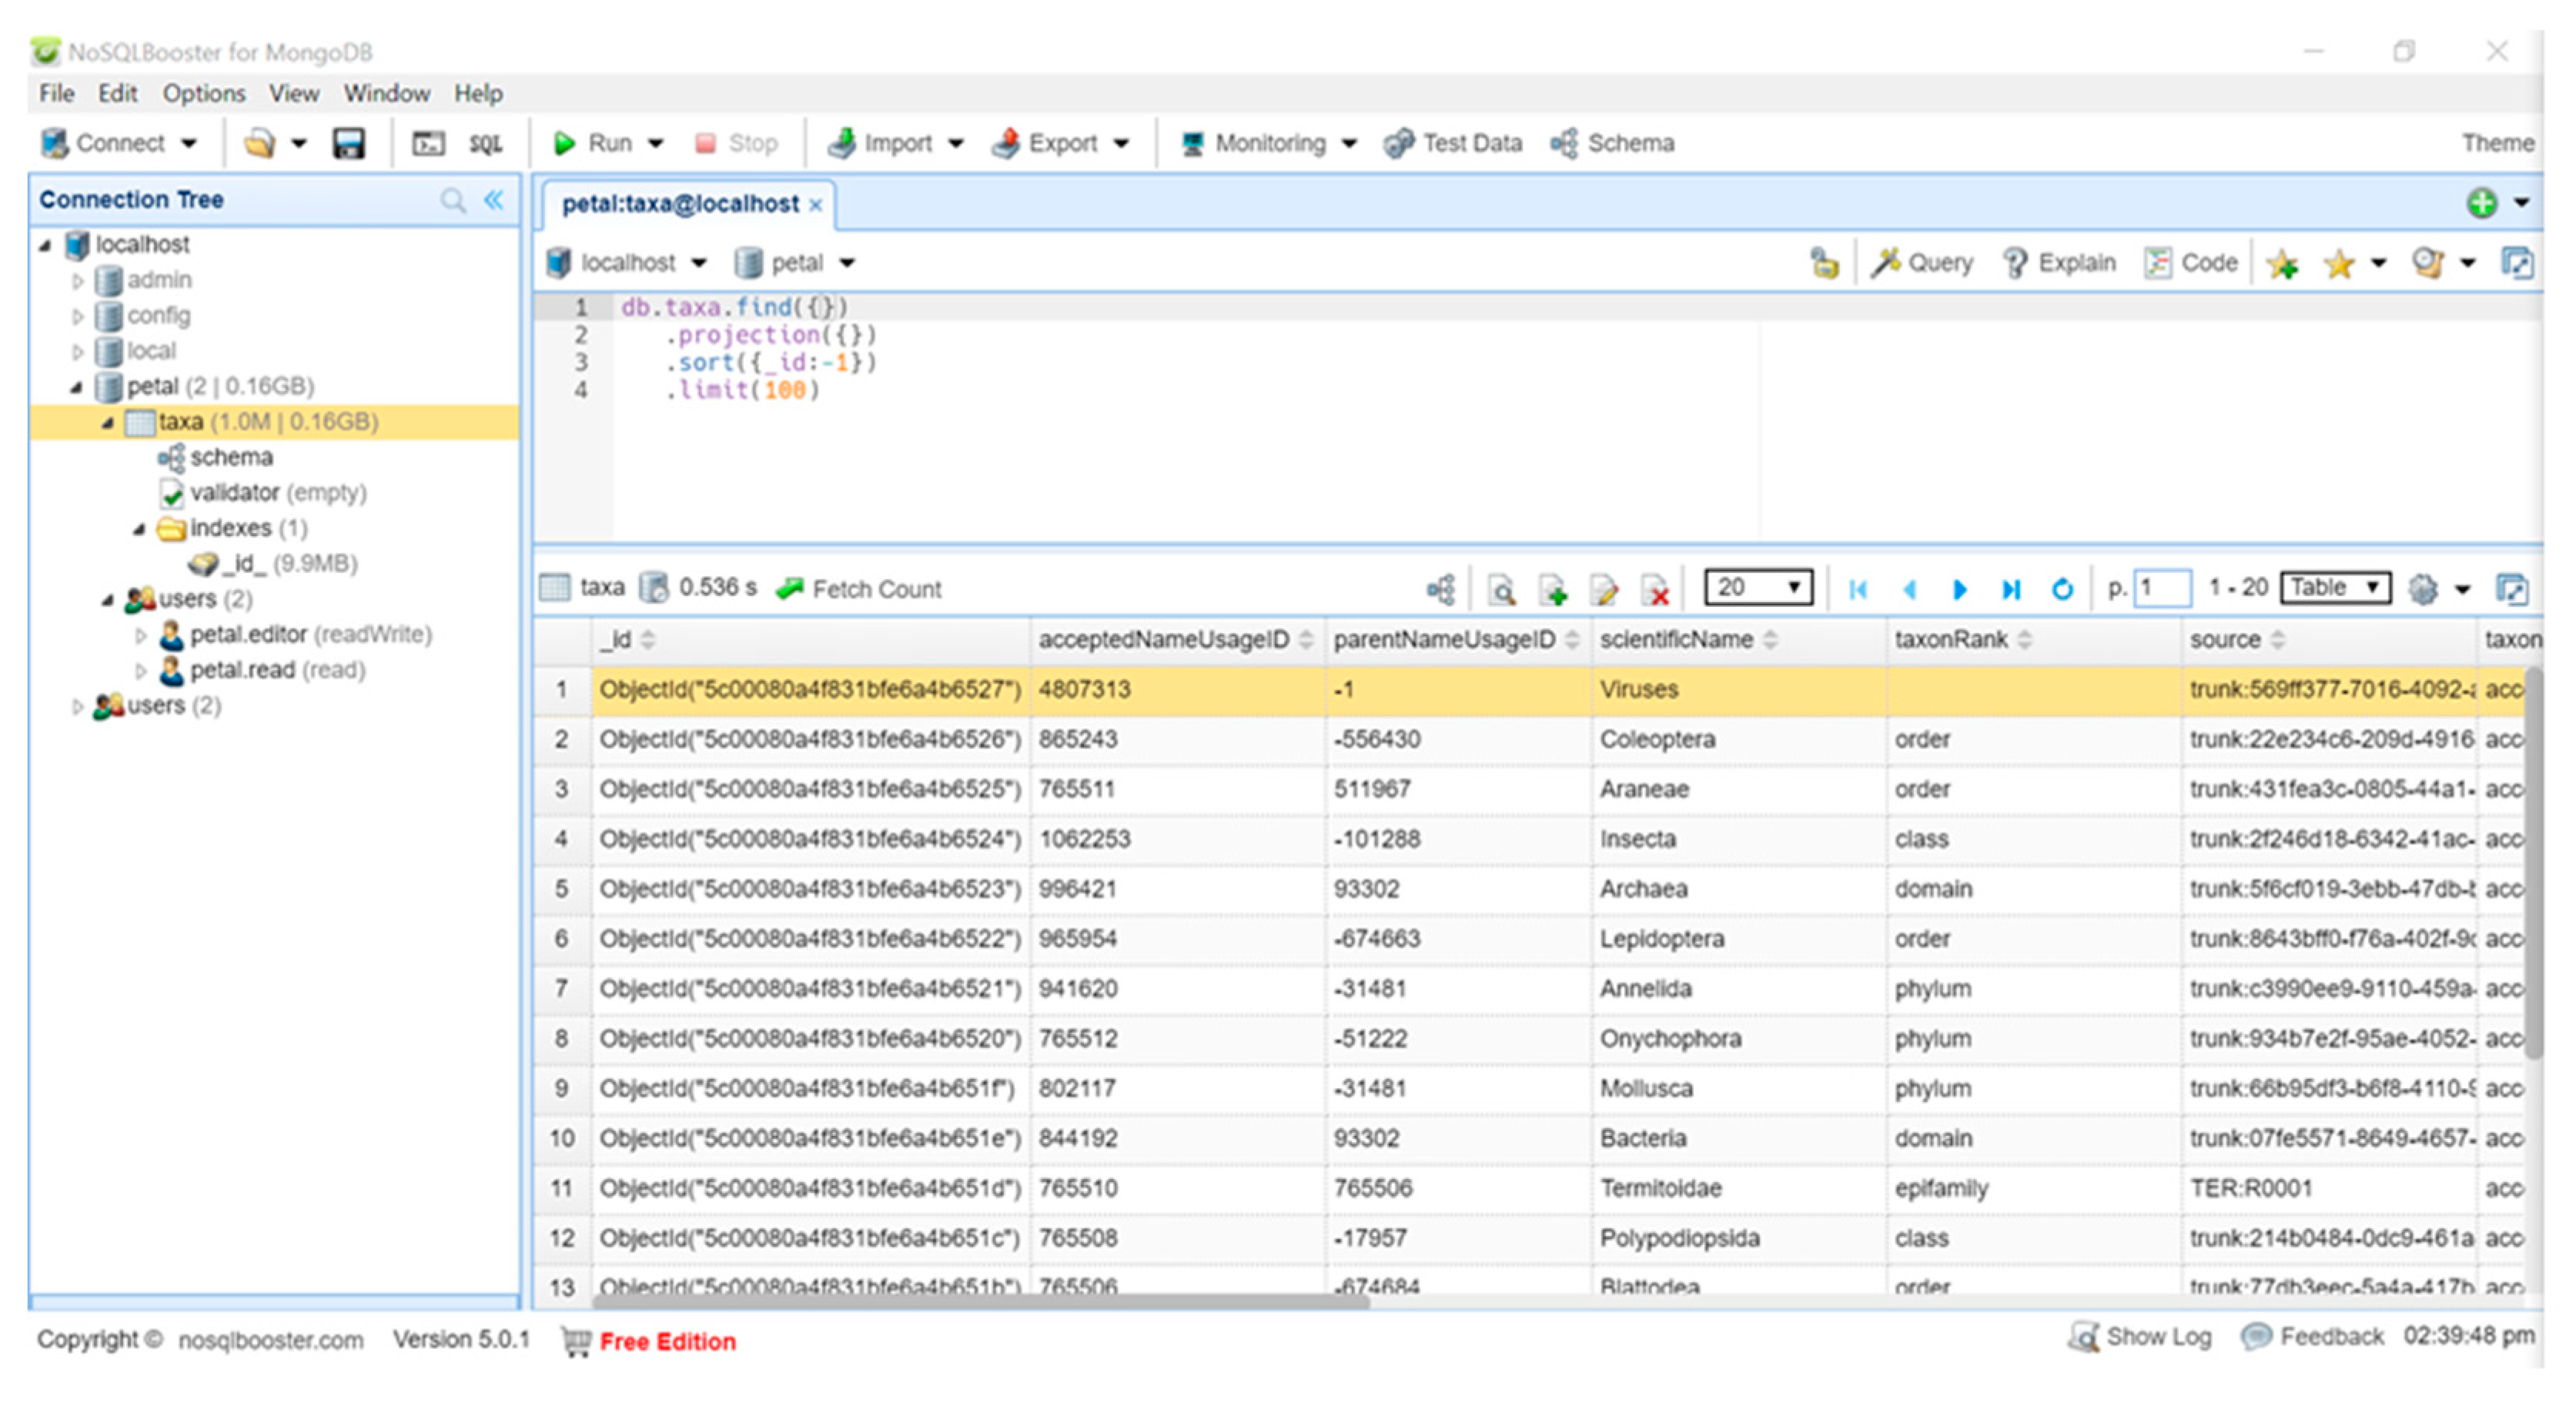
60]. From this order of database systems there exists the genus of “Document-Oriented Databases” that utilize key-value systems to store data encoded in standardized language encoded documents. One particular species of note from this genus is known as MongoDB and has been widely lauded by industry and academia for its combined strengths of speed and schema-less formatting. PeTaL uses this database to store data. This database uses the Binary Javascript Object Notation (BSON) format, which is extremely similar to the popular Javascript Object Notation (JSON) format [61]. Figure 25 depicts the PeTaL database being represented in the NoSQL Booster [62]. The database has given each entry its own ObjectId. The intent is to store data gathered from researchers, citizen scientists and other databases in this format.
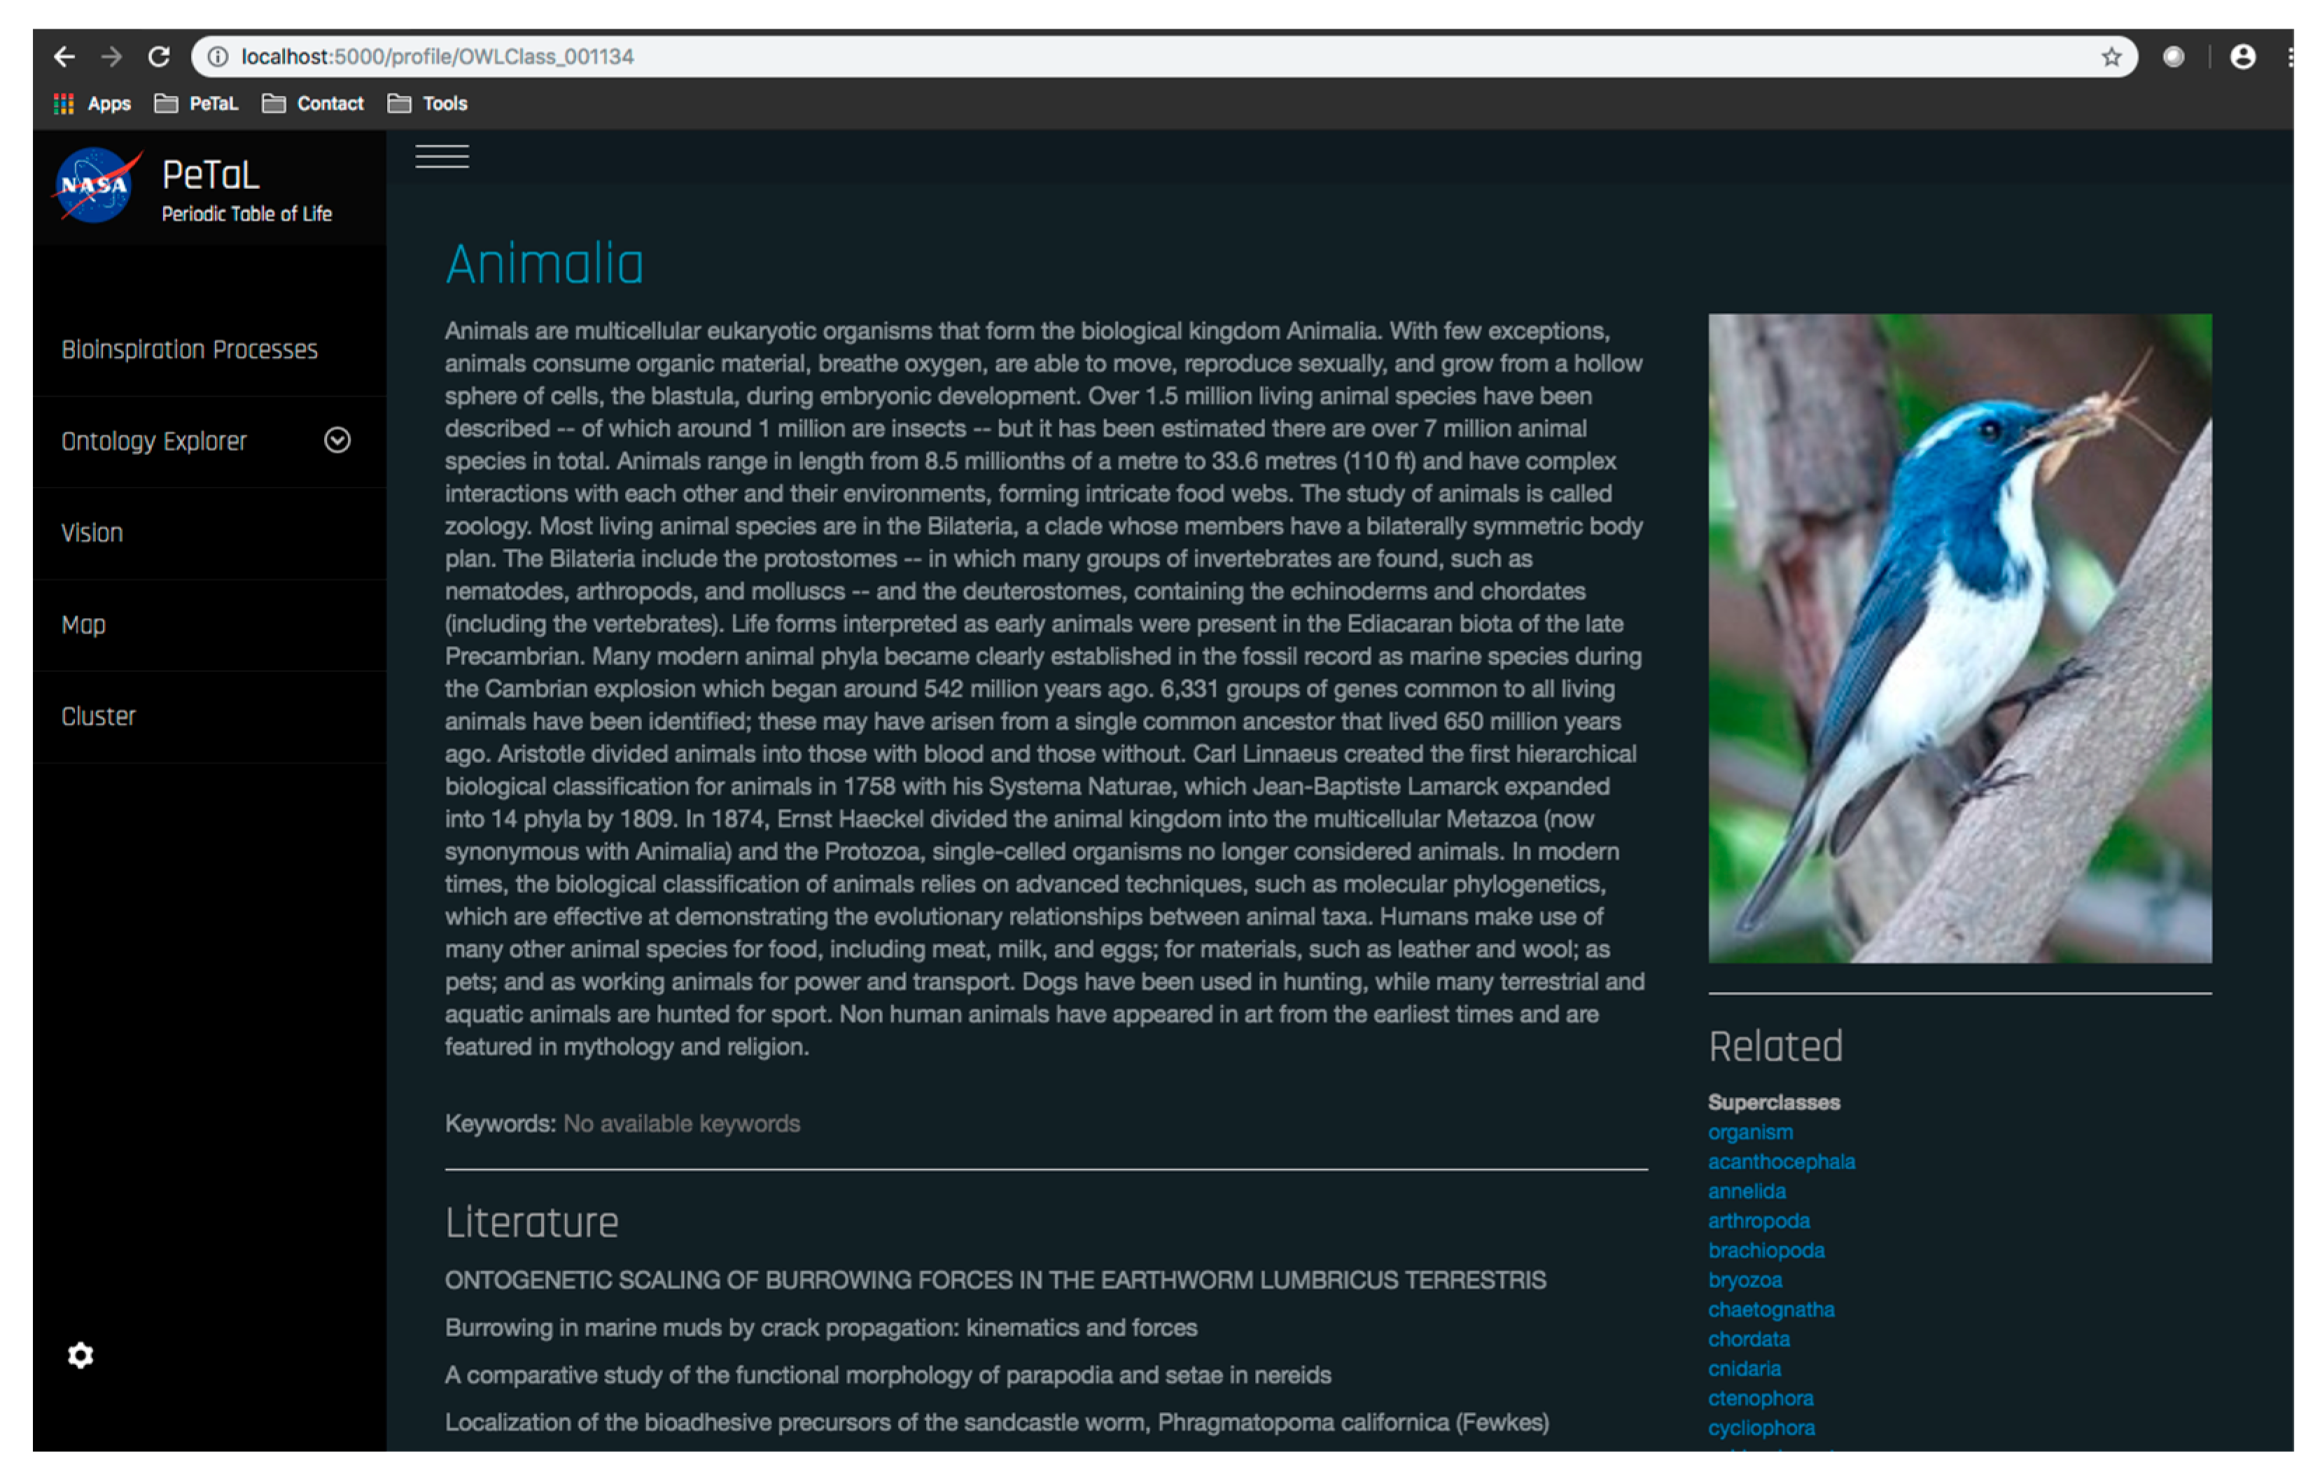
A NetworkX graph—a compilation of ontology elements, literature, and the connections between them—was built from PeTaL’s OWL (Web Ontology Language) file, and then had information from the abstract dataset appended to it as additional nodes. This graph is primarily accessed via PeTaL’s profile pages, as shown in Figure 26. The profile pages display the ontology element, as well as associated data such as a description, image, linked elements, and relevant literature. The D3 force layout enables a full view of the PeTaL ontology that can be zoomed and manipulated. Upon mouse-over, the visualization highlights the relevant node and all its nearest neighbors, and upon a double click event, it leads to the associated profile page. The visualization allows for a more comprehensive understanding of the PeTaL ontology and the significant relationships between its elements that facilitates the bio-inspiration process. To populate the ontology with data autonomously, several sources and tools were considered including Animal Diversity Web, Encyclopedia of Life, ITIS, and Wikipedia. 
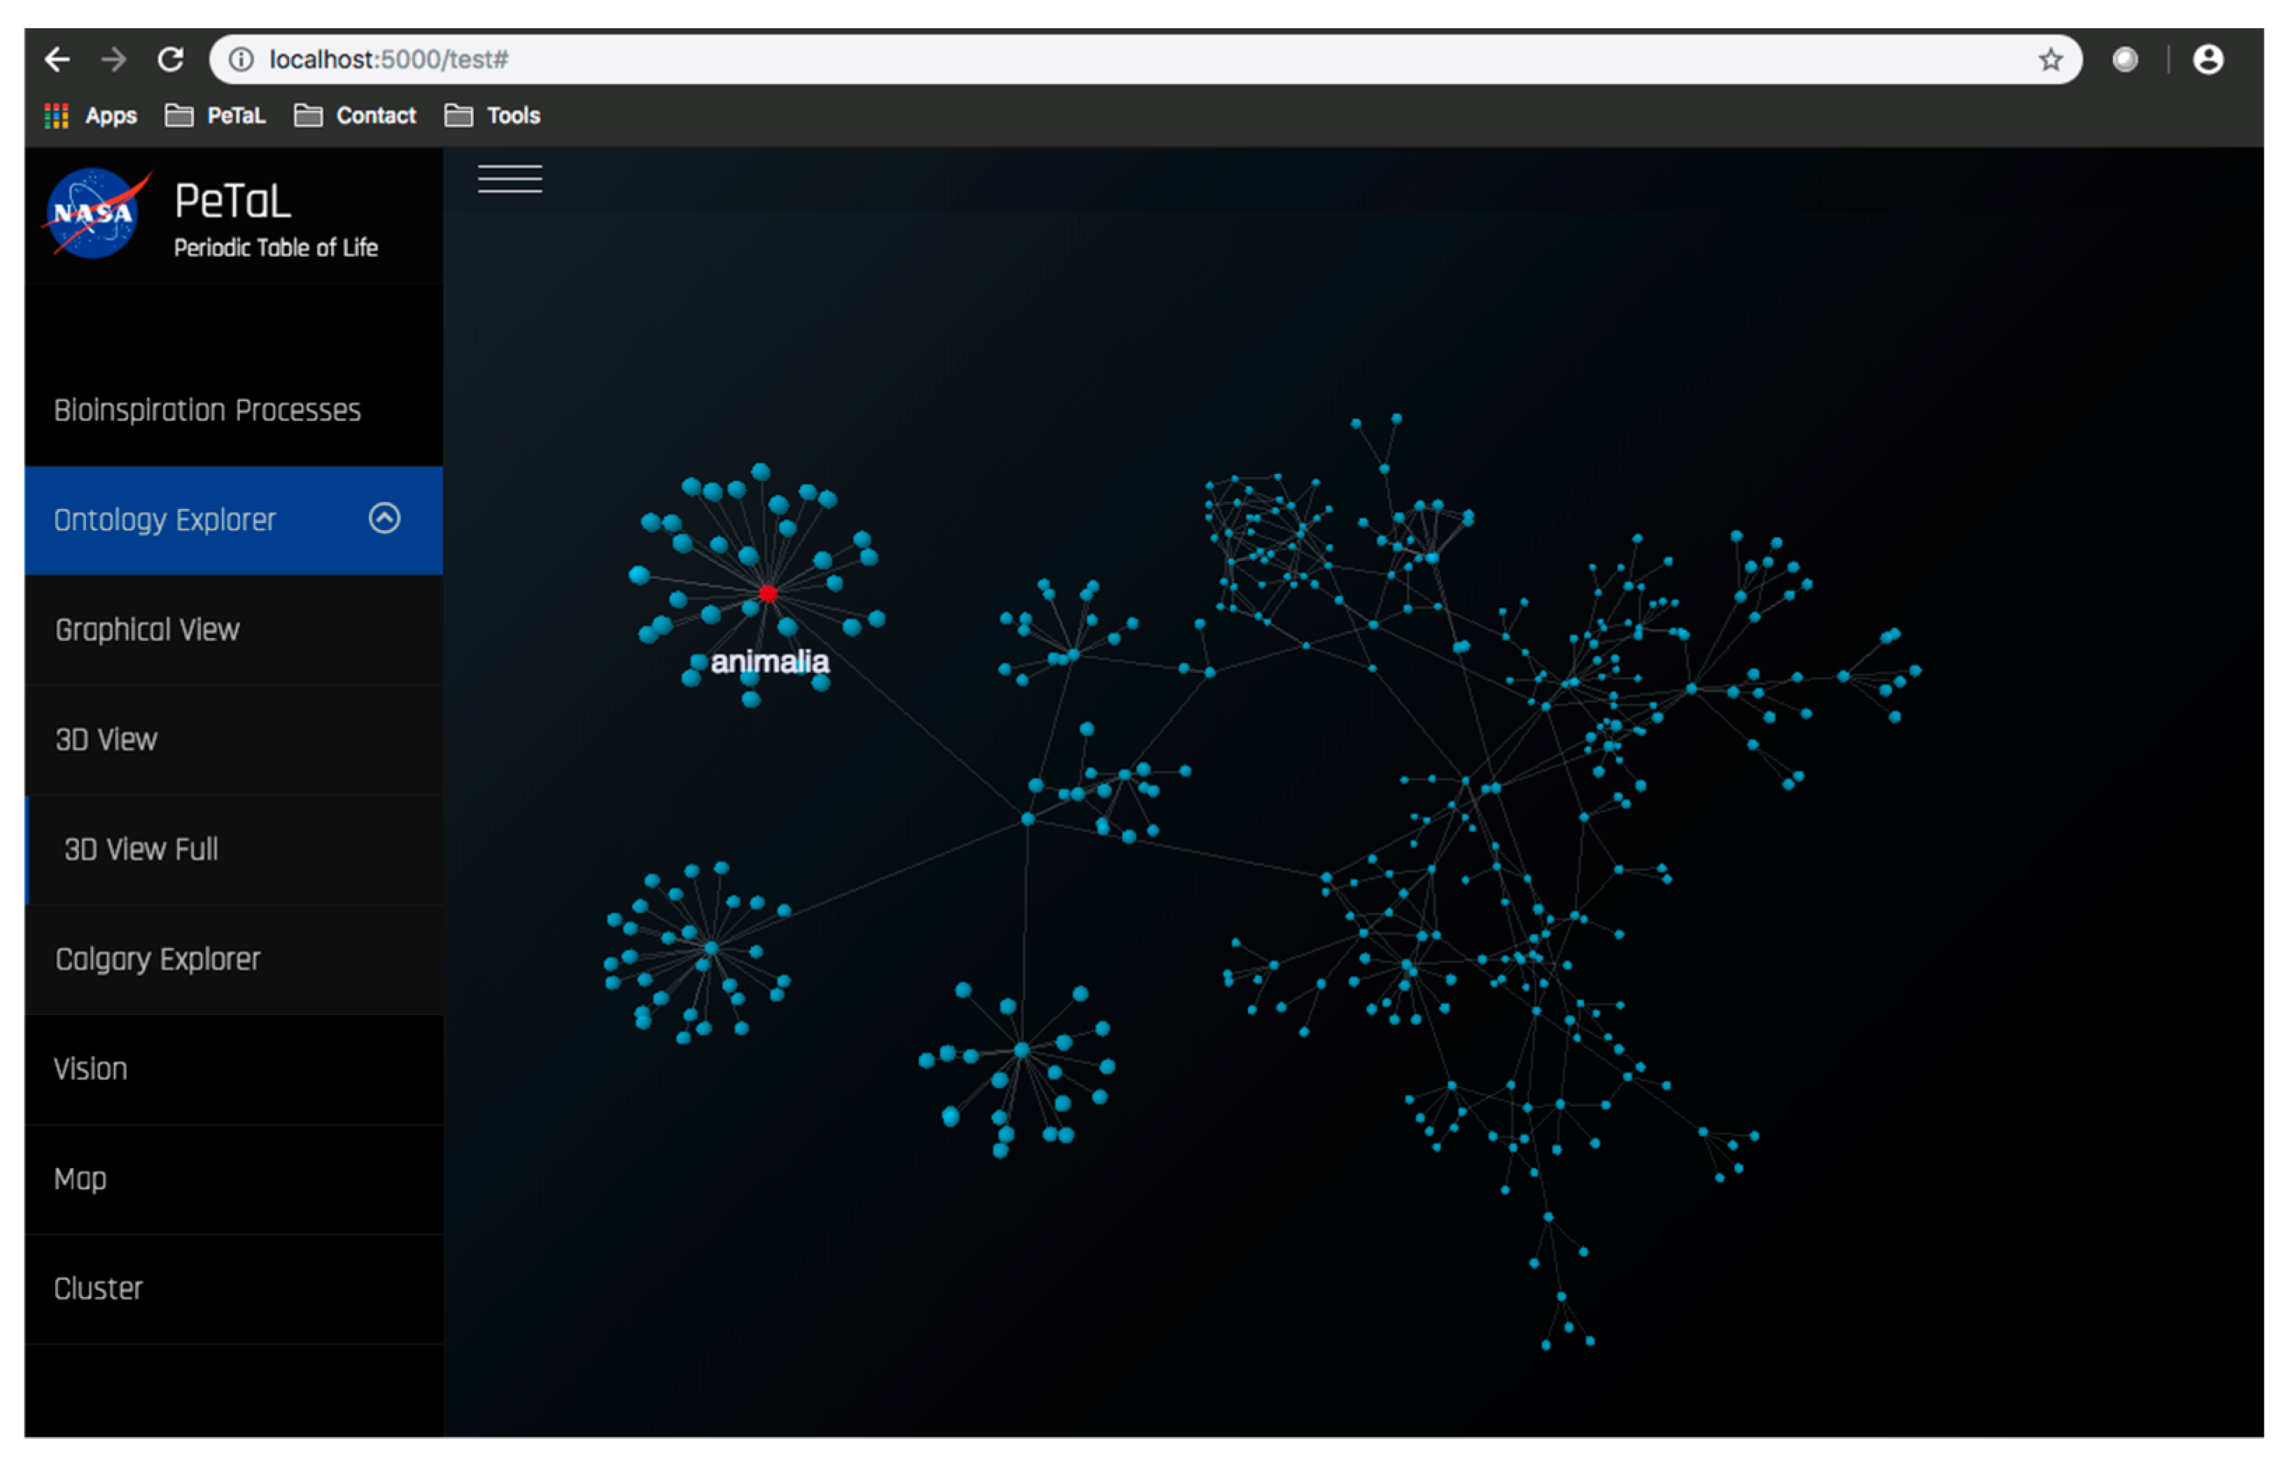
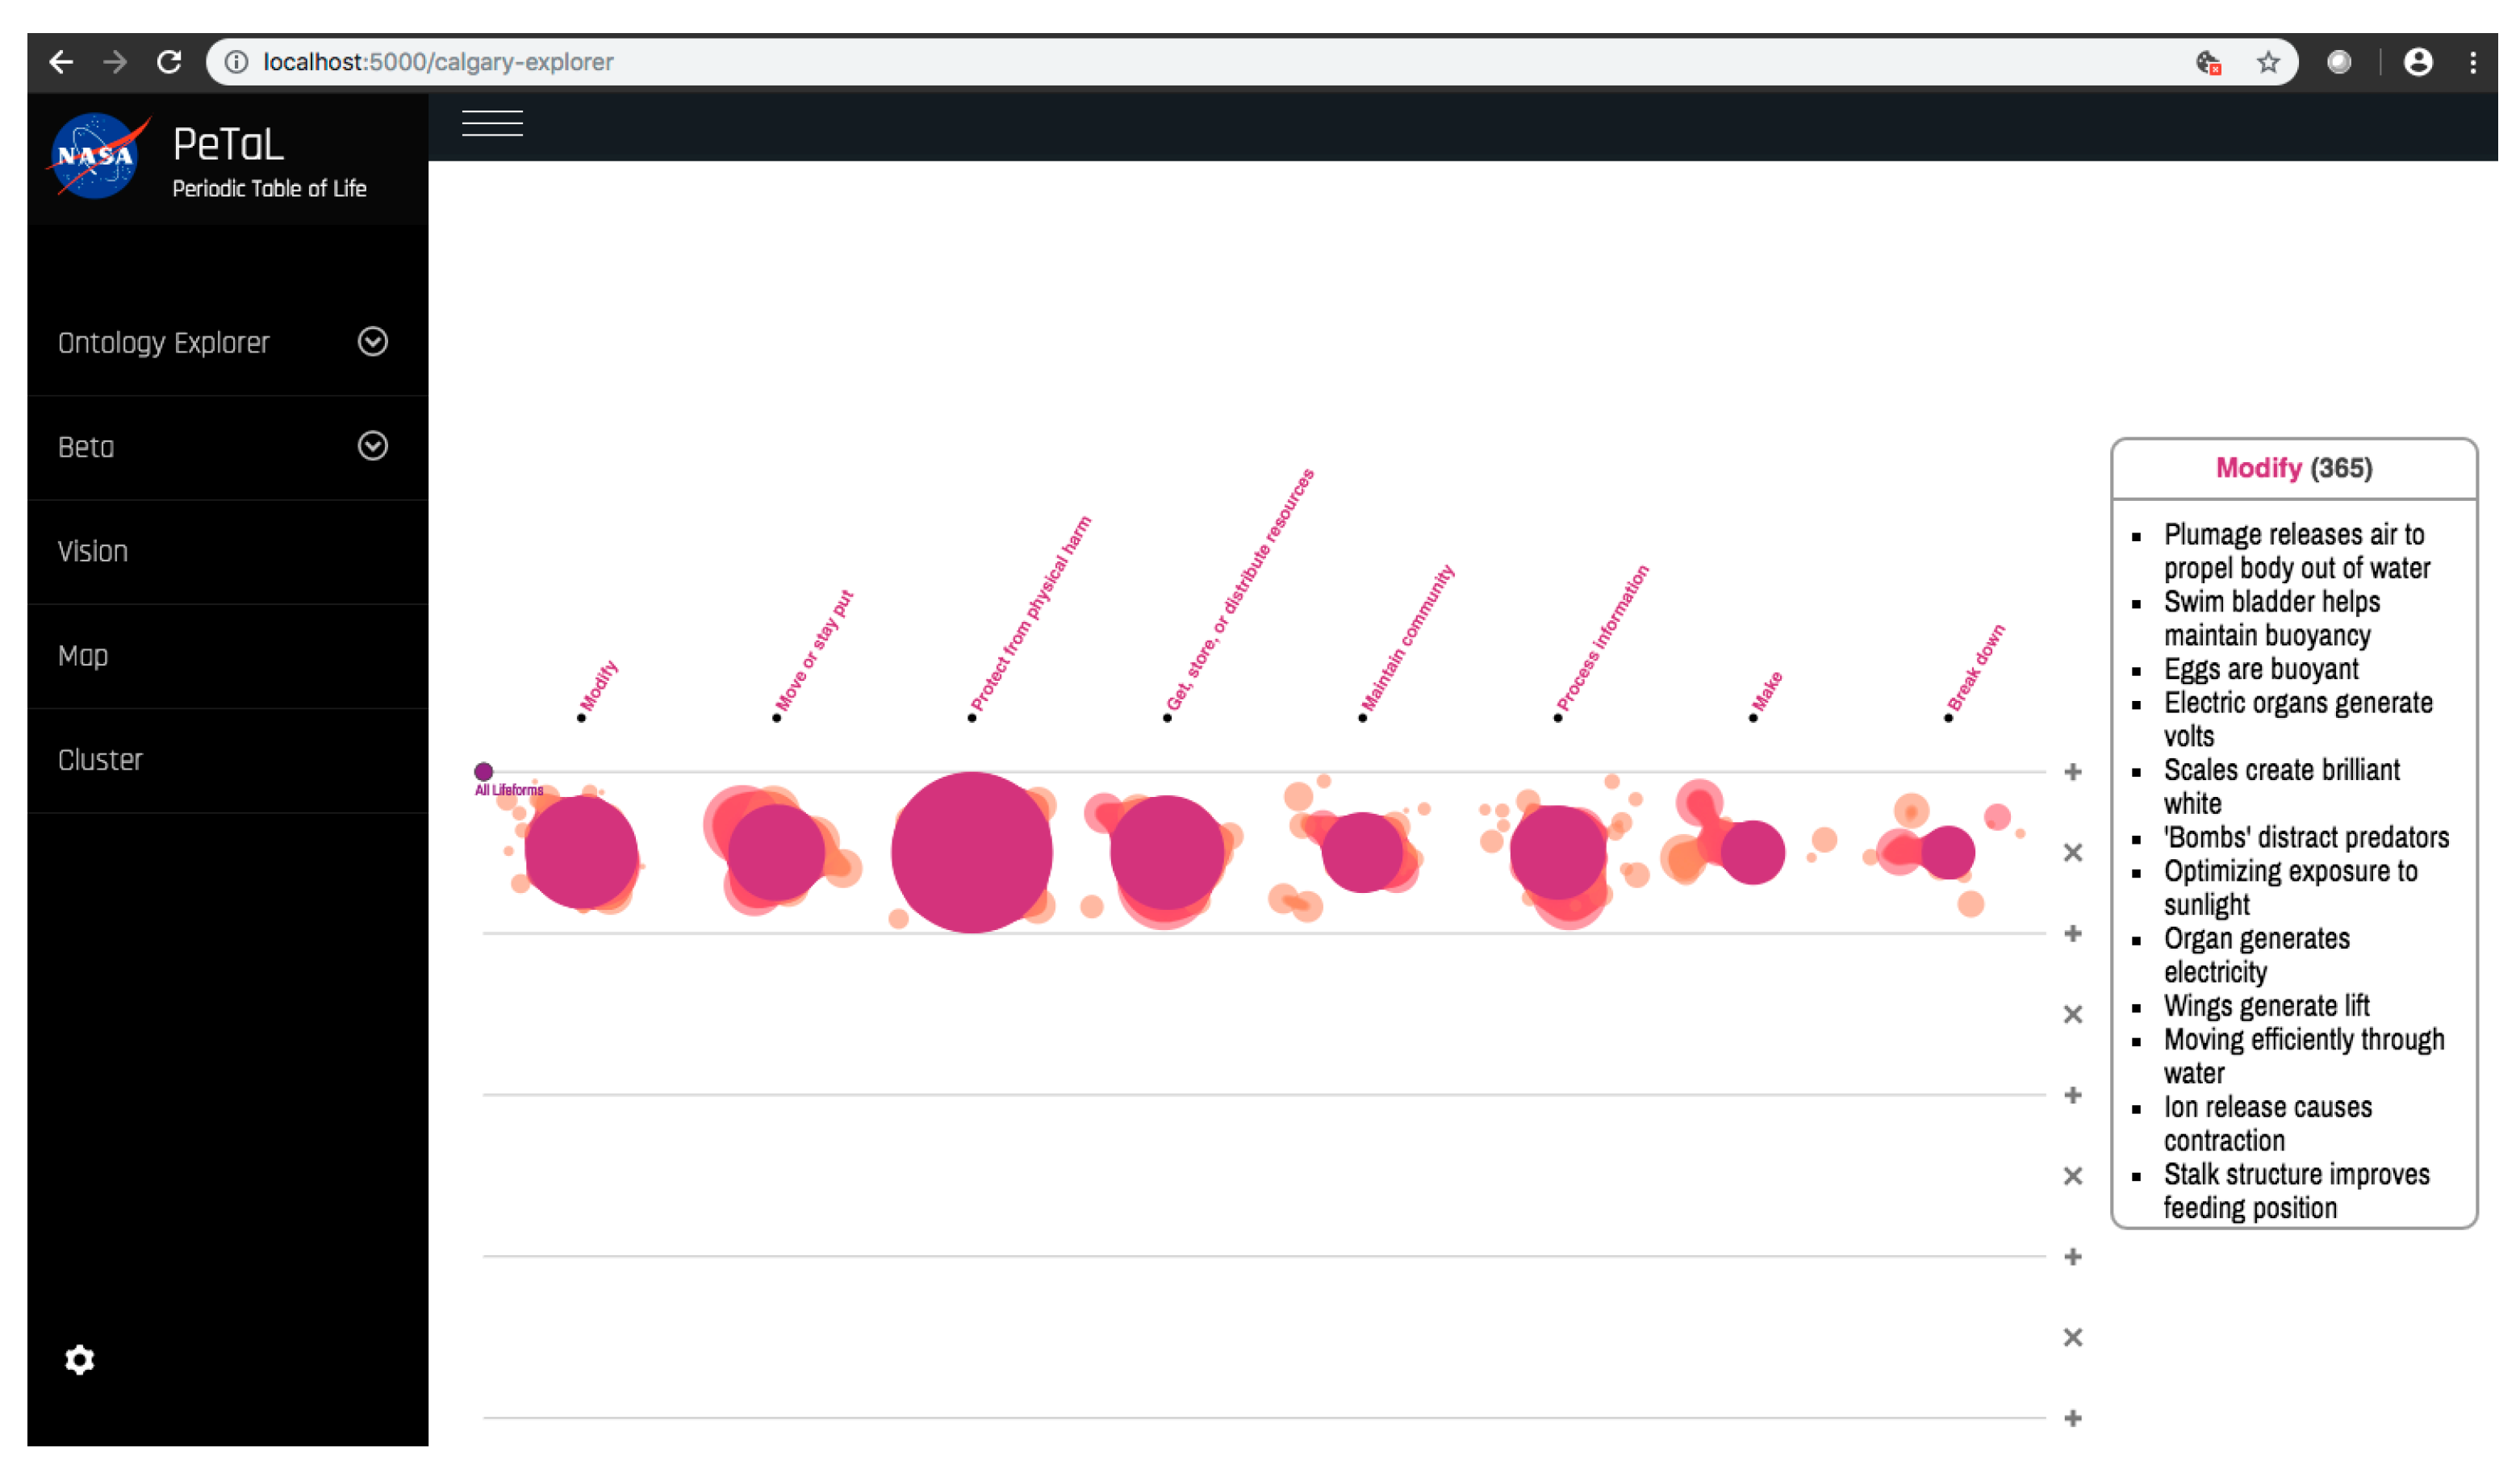
Figure 27 shows a view of the ontology within PeTaL. The nodes can be clustered according to function, morphology or environment and can be clicked for more information. The ontology graph is rendered in 3D using various javascript libraries and WebGL. Rendering the graph in 3D facilitates exploring the ontology dataset by allowing users to distinguish relationships between the nodes as well as allowing rotation of the graph in 3D space. This graph implements a force-directed algorithm to minimize or completely avoid edges crossing with one another, so as to achieve a cleaner and easier to interpret graph.
c.
Translation Tools such as thesauri, mapping tools, abstraction tools: 
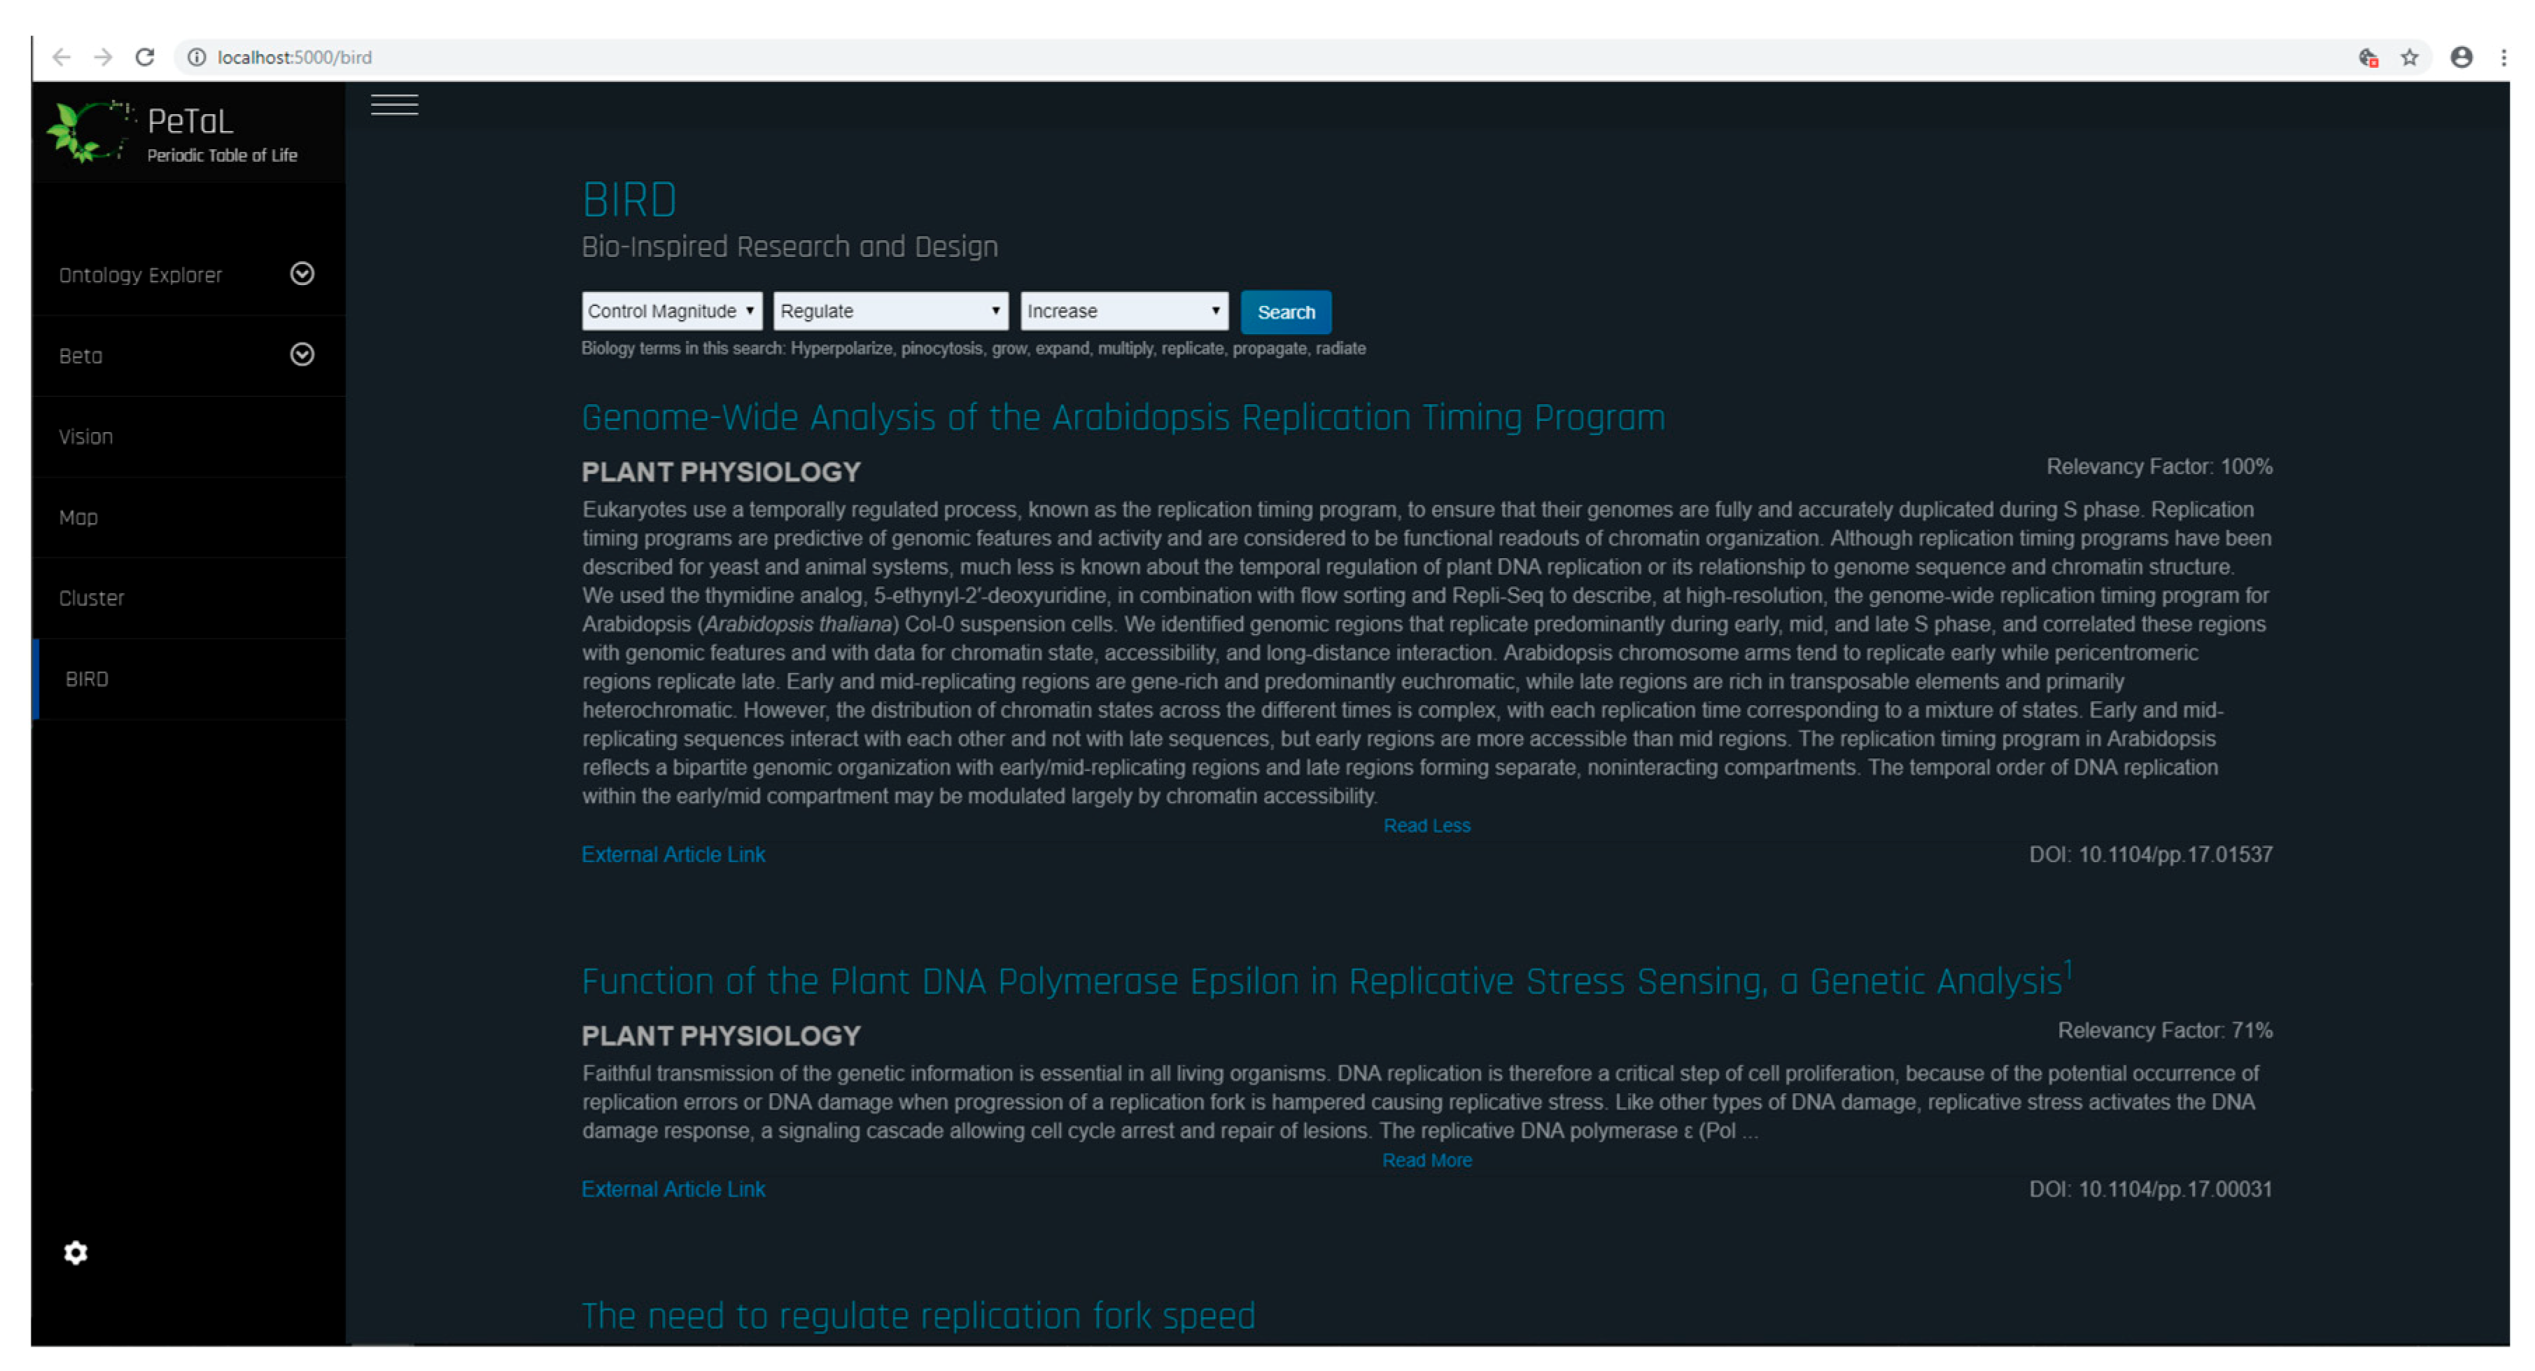
Figure 28 shows the bio-inspired research and design (BIRD) tool for the PeTaL interface. This tool provides easy to use biology data engineering services for engineers. Because the translation and discover phases are often the most difficult to overcome when beginning a biomimicry project, BIRD provides specific tools to overcome these challenges. At the heart of BIRD is a JSON file that translates common engineering functions to their biology counterparts in the appropriate language. The program takes biology primary research articles and scrapes them against this list of relevant biology terms, ranks the top 50 results, and displays them back to the user. The output of this literature search can be either in the format to be human readable as shown in Figure 28, or in a format compatible for use with PeTaL’s clustering tools. 
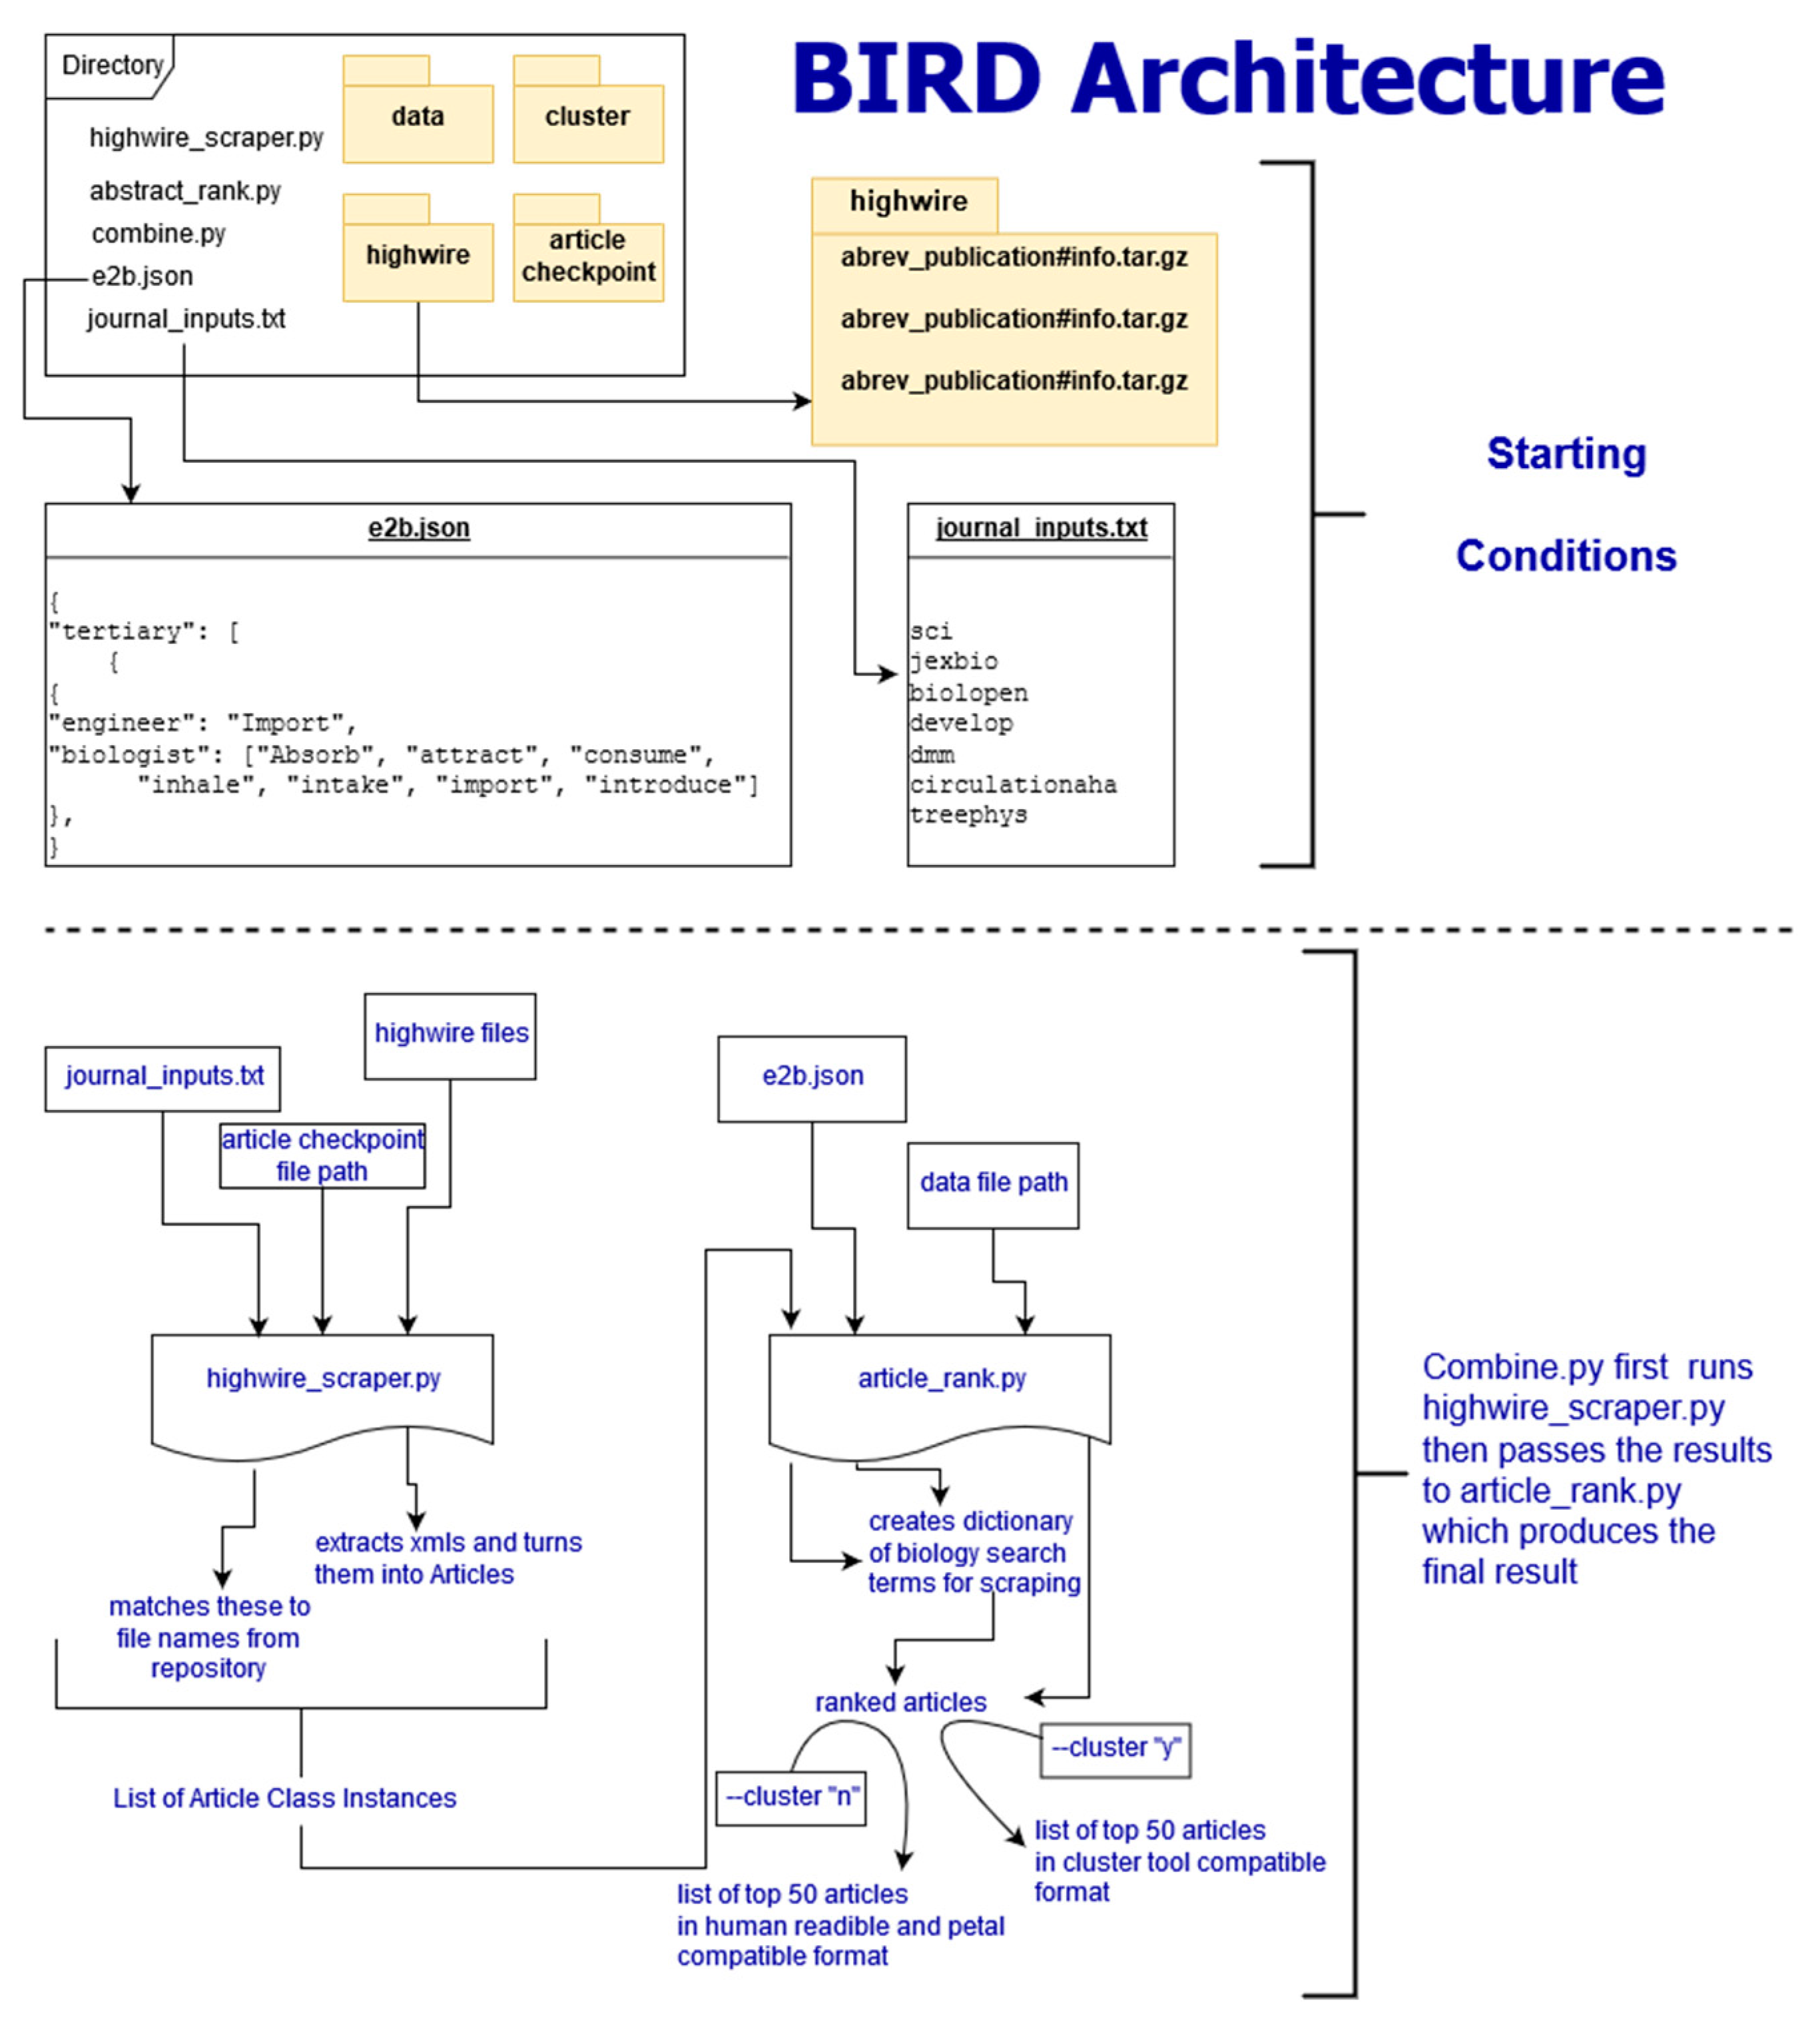
Figure 29 shows the software architecture of BIRD’s back end. One of the largest benefits of using BIRD is the high degree to which a user can customize their search. Figure 29 shows the overall structure of BIRD as it is presented to future users upon download. The working directory has a folder labeled “highwire” that contains all of the tar.gz files taken from the HighWire [63] repository. Additionally, there are 3 other empty folders labeled cluster, data, and article checkpoint. The text file “journal_inputs.txt” contains a list of journal abbreviations that the user can update to add or remove journals from their search. The “e2b.json” file contains the modified engineering to biology thesaurus. Both the e2b and the journal_inputs files were designed to be highly manipulated by the user to enable a custom experience. Throughout the process, at designated checkpoints the dataclass instances are exported as pickle files into the folder “article_checkpoint” which is originally presented empty. In combine.py, the user is able to specify whether they want the output of the ranking and sorting tool to be in human and PeTaL compatible format, or in a format compatible with a clustering tool also housed in PeTaL. If the user specifies human readable output, the final text files representing the top 50 results for each engineering term are written to the “data” folder. If the user specifies the cluster compatible output, the text files are written to the “cluster” folder. Overall, combine.py will run highwire_scrapter.py and hand off the result, a list of Article dataclass instances, to article_rank.py which produces the final output. Figure 30 shows a contributed tool that uses AskNature [43] by Dr. Marjan Eggermont [64]. The intent is to continue adding tools from contributing developers. Several independent projects have already begun to combine tools so as to enable easier integration into PeTaL.
d.
Data science/machine learning/computer vision tools: 
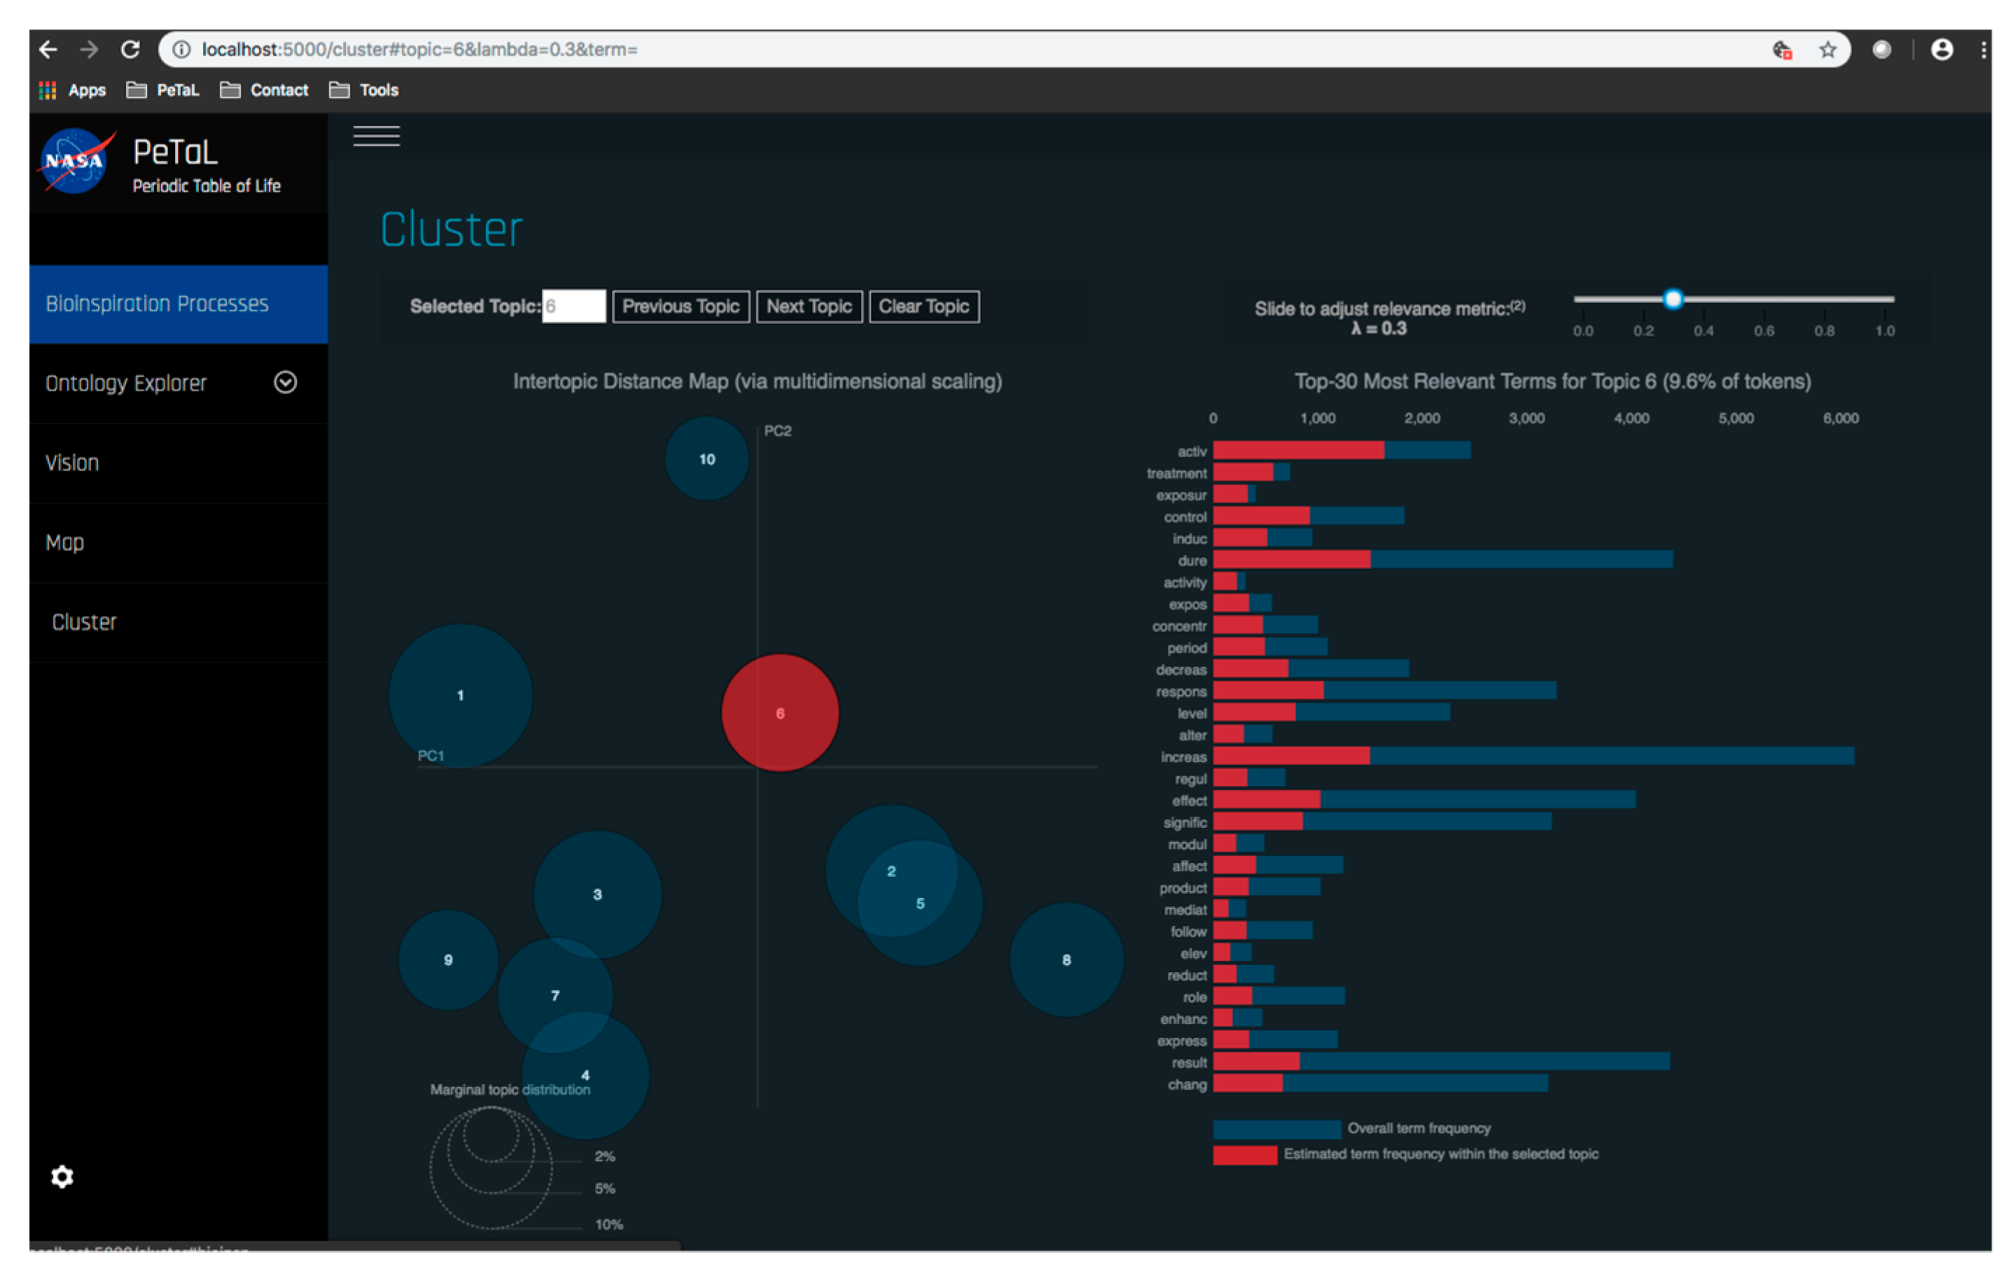
Figure 31 shows a topic modeling tool that helps researchers identify models for inspiration in the short term and provides a method to generate automated taxonomies in the long term based on the methods that are presented in Section 4.2. Given a set of input documents (a corpus), Latent Dirichlet Allocation (LDA) and nonnegative matrix factorization (NMF) with Kullback–Leibler (KL) divergence are used to provide topic clusters to the user. Topic clusters are the latent underlying themes of a body of text. For the text modeling problem, NMF-KL is the equivalent of probabilistic latent semantic analysis. Both LDA and NMF-KL are preferred modeling tools within the topic modeling community [65,66,67,68,69]. These tools are used to identify biological specimens relevant to the user. The user can search for a cluster with relevant topics, find articles and identify the biological models and mechanisms associated with the function of interest. It is also possible to sub-cluster a given topic to learn of underlying topics. Another tool developed for PeTaL is an image classifier that determines the organism(s) and patterns present in an image. Convolutional neural networks (CNN) have demonstrated an impressive ability to learn abstract features from raw pixel information in order to classify images [70,71]. ResNet [72], pretrained on 1000 ImageNet classes, was used for organism classification. This was implemented with the Keras Applications package and no training or validation was required. The relevant output classes that pertain to organisms in PeTaL are mapped to their respective phylum page for relevant information and literature within the PeTaL platform. For geometric pattern classification, a standard convolutional neural network was trained with four convolution layers, each followed by batch normalization, ReLU non-linear activation, and max pooling. We will simply refer to this model as the CNN. A more complex CNN architecture, called MobileNet [73], was also trained. MobileNet is an image classification network designed to perform well with limited computing resources. MobileNet was chosen because it is a good compromise between classification performance and required time to train. The classifier was trained on naturally occurring patterns [74]. Examples include trees and roots for branching, dandelions for explosion, spiral galaxies and staircases for spiral, and tile roofing and giraffe spots for tile. Images were sourced from ImageNet. Images were automatically gray-scaled to avoid biasing patterns to certain colors. All images were down-sampled to 224 × 224 resolution. 
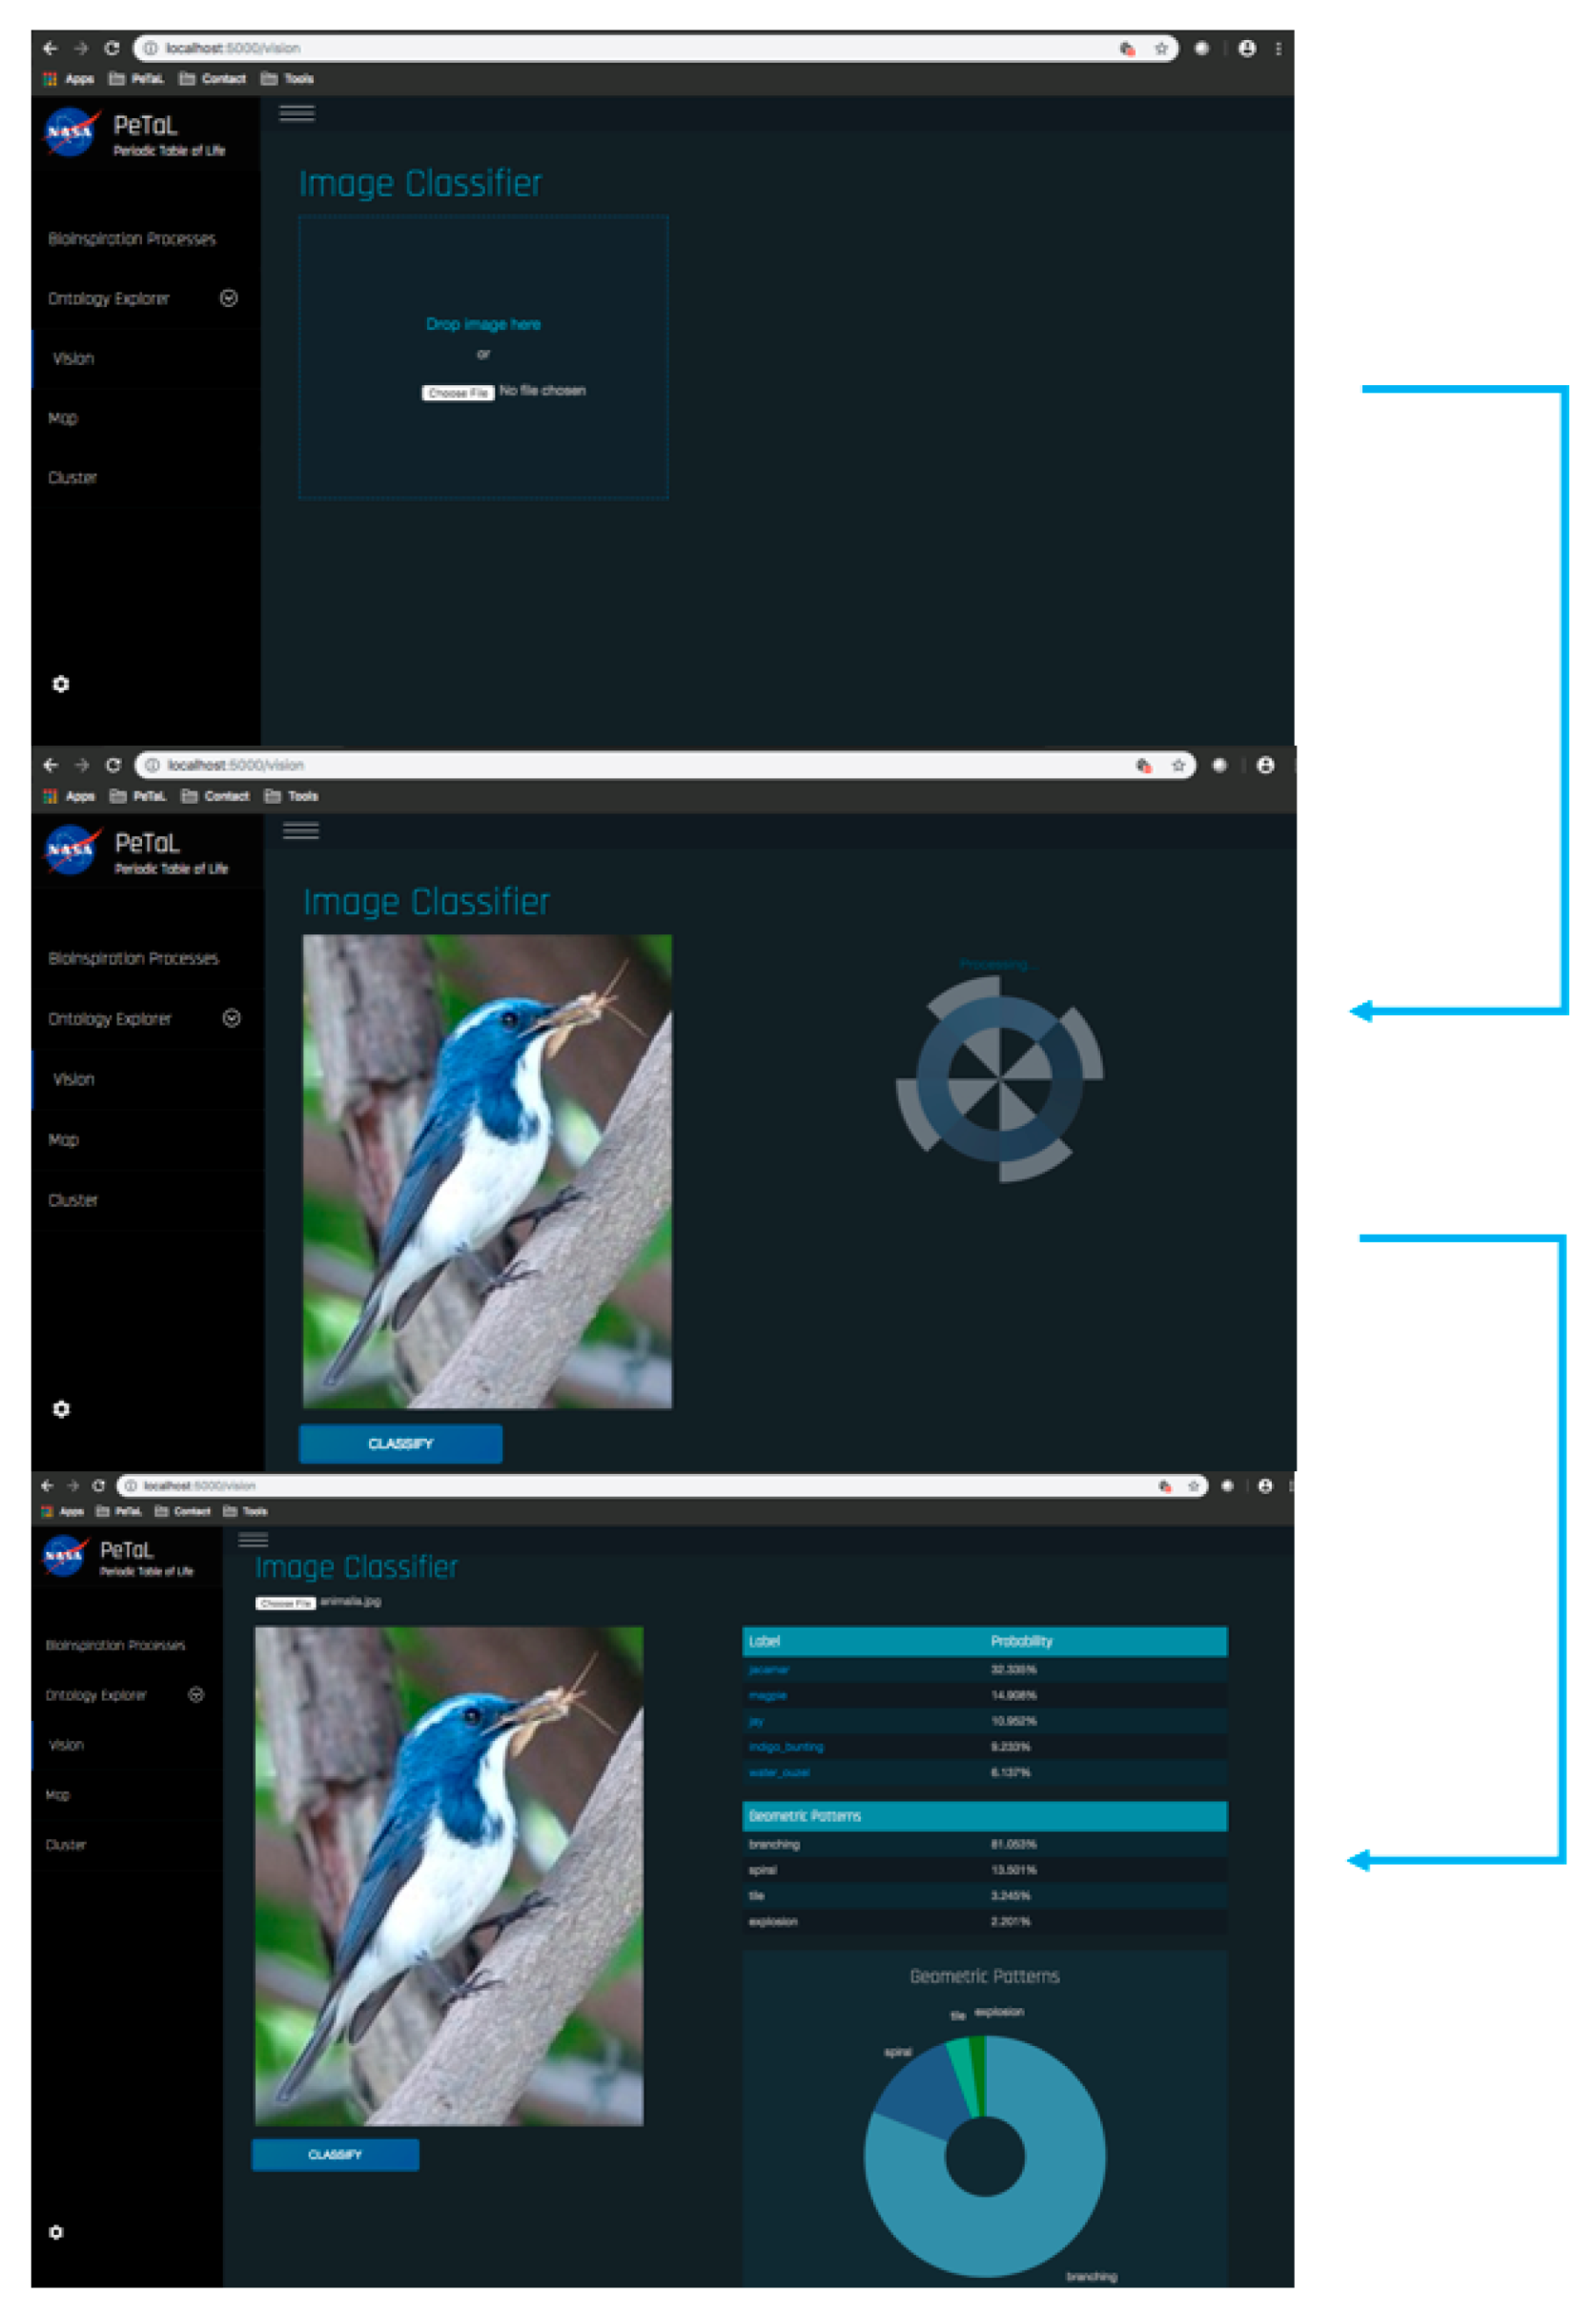
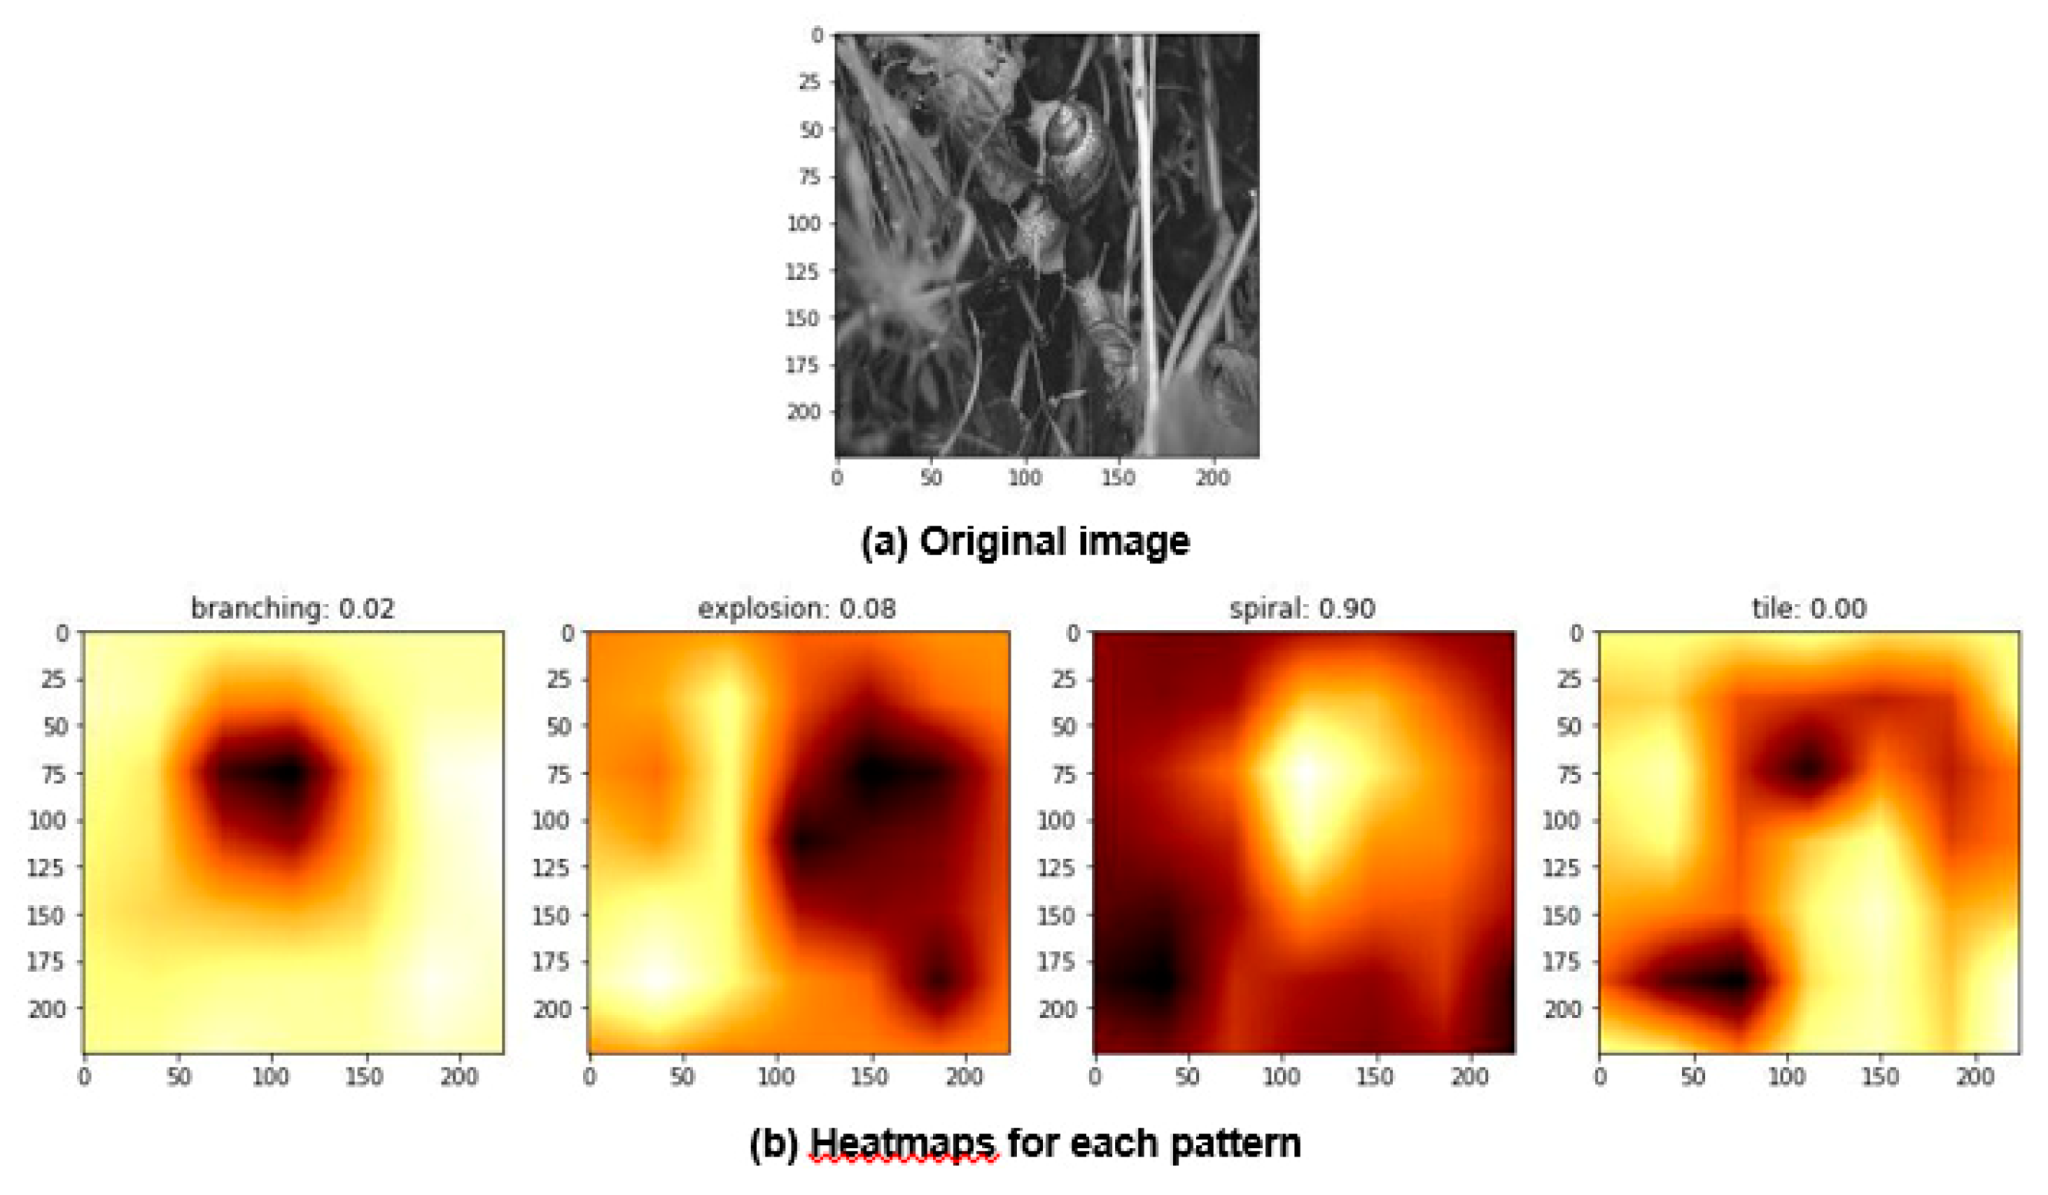
Figure 32 shows the image classifier workflow in PeTaL. Ongoing work includes identifying pattern locations on the images using heatmaps (Figure 33) to allow for verification of the classification tool and to also enable extraction of multiple patterns and organisms from an image to reveal connections of systems to their environment. Eventually, computed tomography (CT) scans might be available for large databases of specimen and an autonomous approach to identifying the relationship between function, morphology and pattern might be useful.
In addition to the tools and online databases that have been utilized, an effort was made to determine best practices for raw data collections for quantitative insights. Data was collected at the Cleveland Museum of Natural History (CMNH) in Cleveland OH, the Cincinnati Museum Center (CMC) in Cincinnati OH, and the Smithsonian National Museum of Natural History in Washington D.C. to use as a test set for PeTaL’s user interface. The initial data collection focused on Odonata at CMNH because all the specimens in that collection have been digitized [75]. Hymenoptera were also characterized. These two orders were selected because of the easy access to their wings. Another large group in the database are trilobites. Trilobites are easy to characterize and show large inter-species diversity. A sample of three to five specimen per species, two species per family, were characterized. Not all families were represented at the aforementioned museums.
Three hundred specimens have been characterized so far. Measurements were taken with a Leica microscope with the Leica Application Suite (LAS) for the CMNH entomology specimens, vernier calipers for the fossil specimens at the CMNH and at the CMC. For the Smithsonian specimens, an Olympus microscope was used to collect the data. 
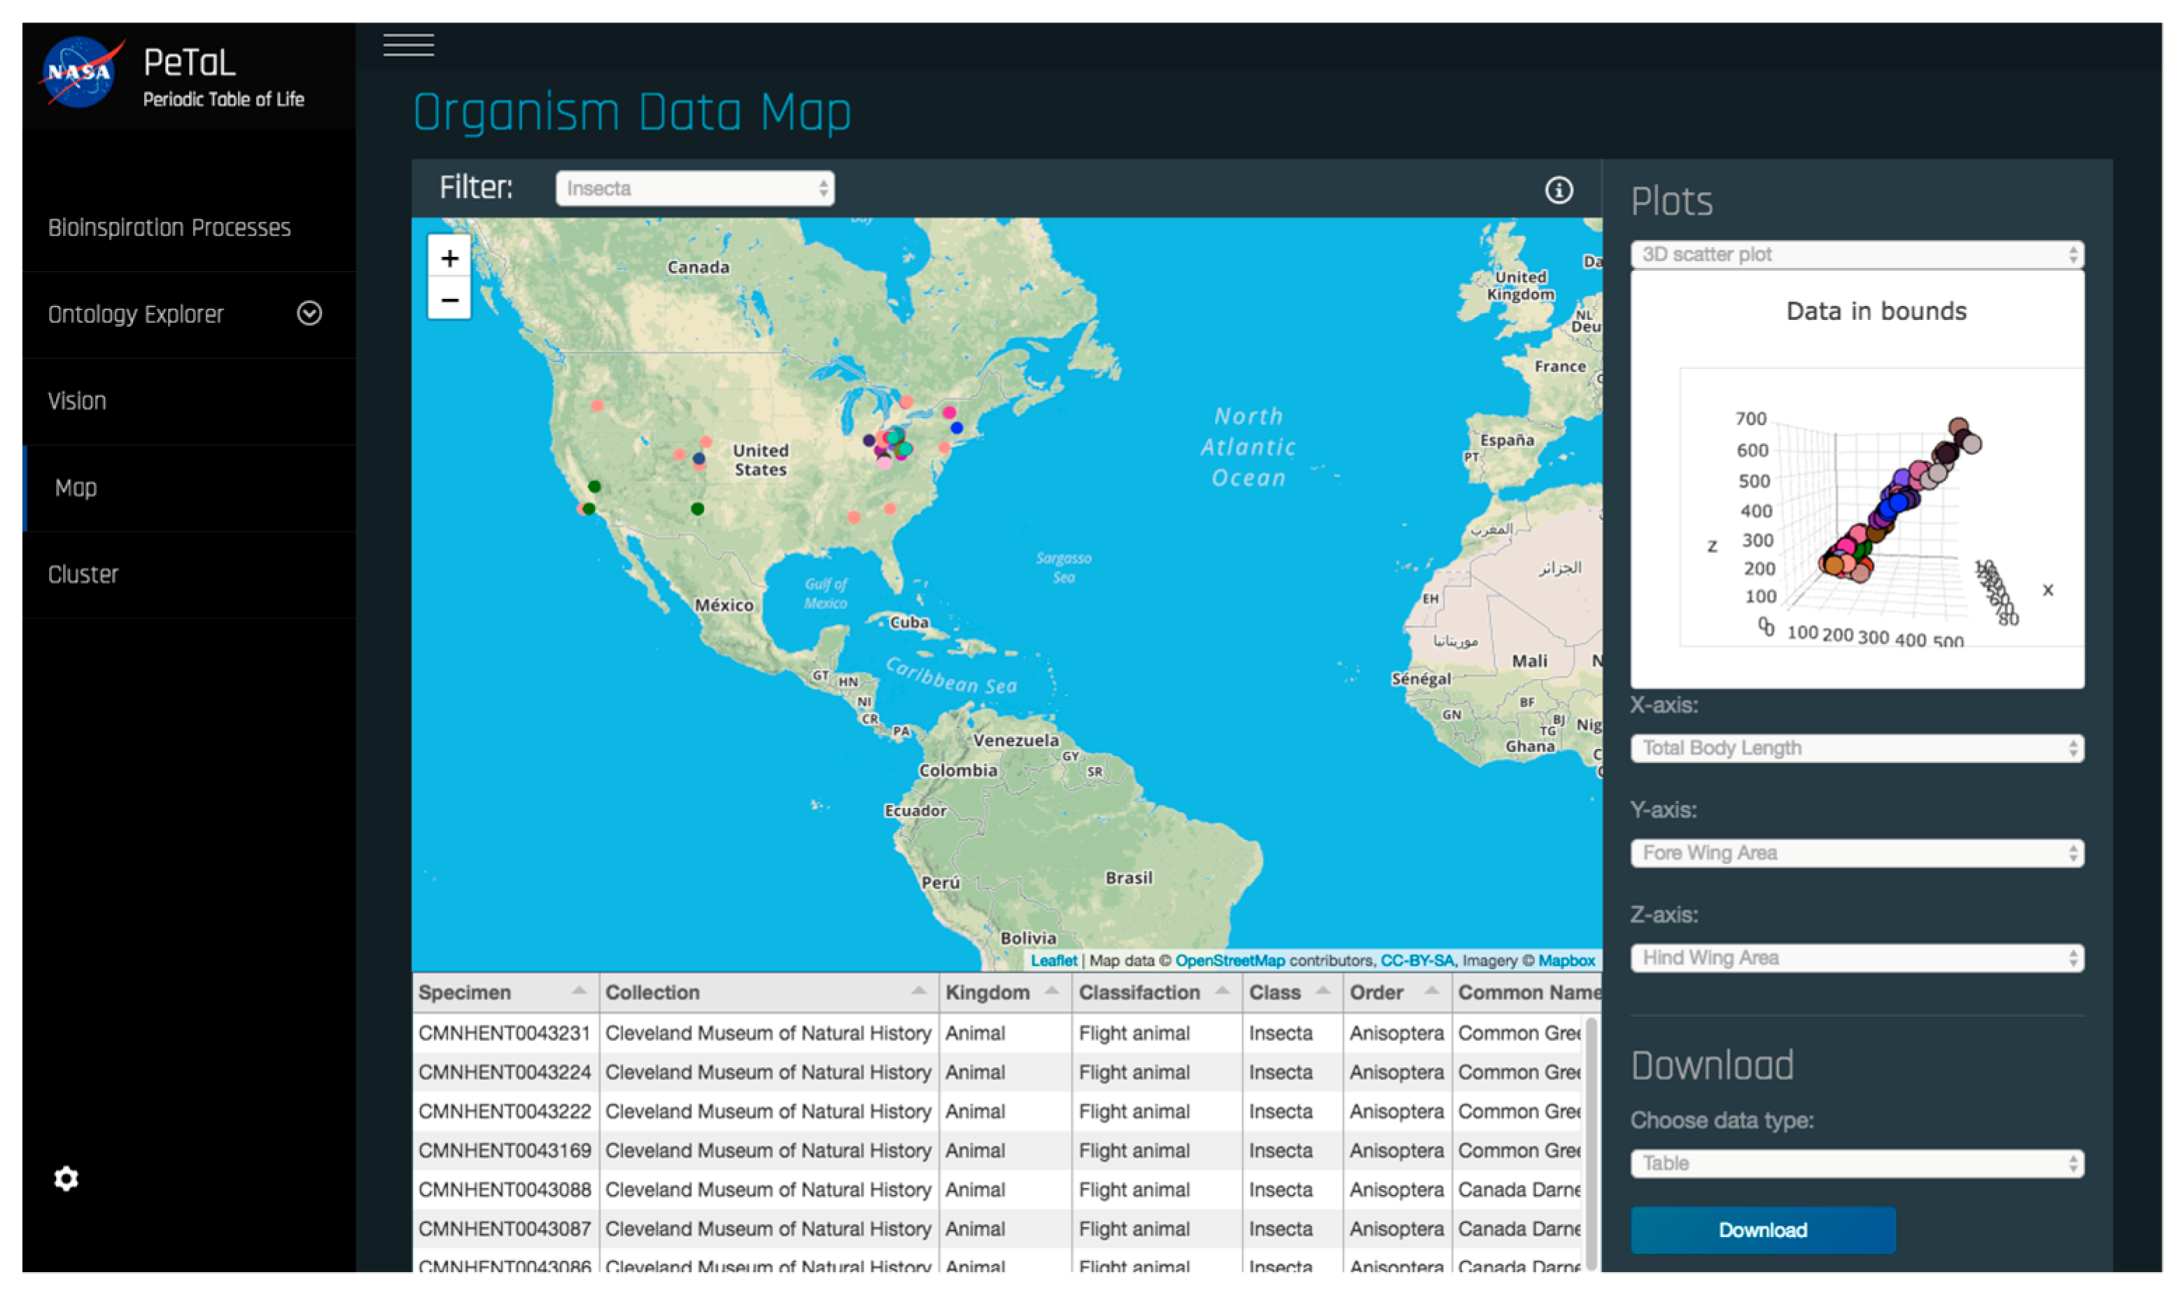
Figure 34 shows the data captured through direct measurement in the PeTaL user interface.
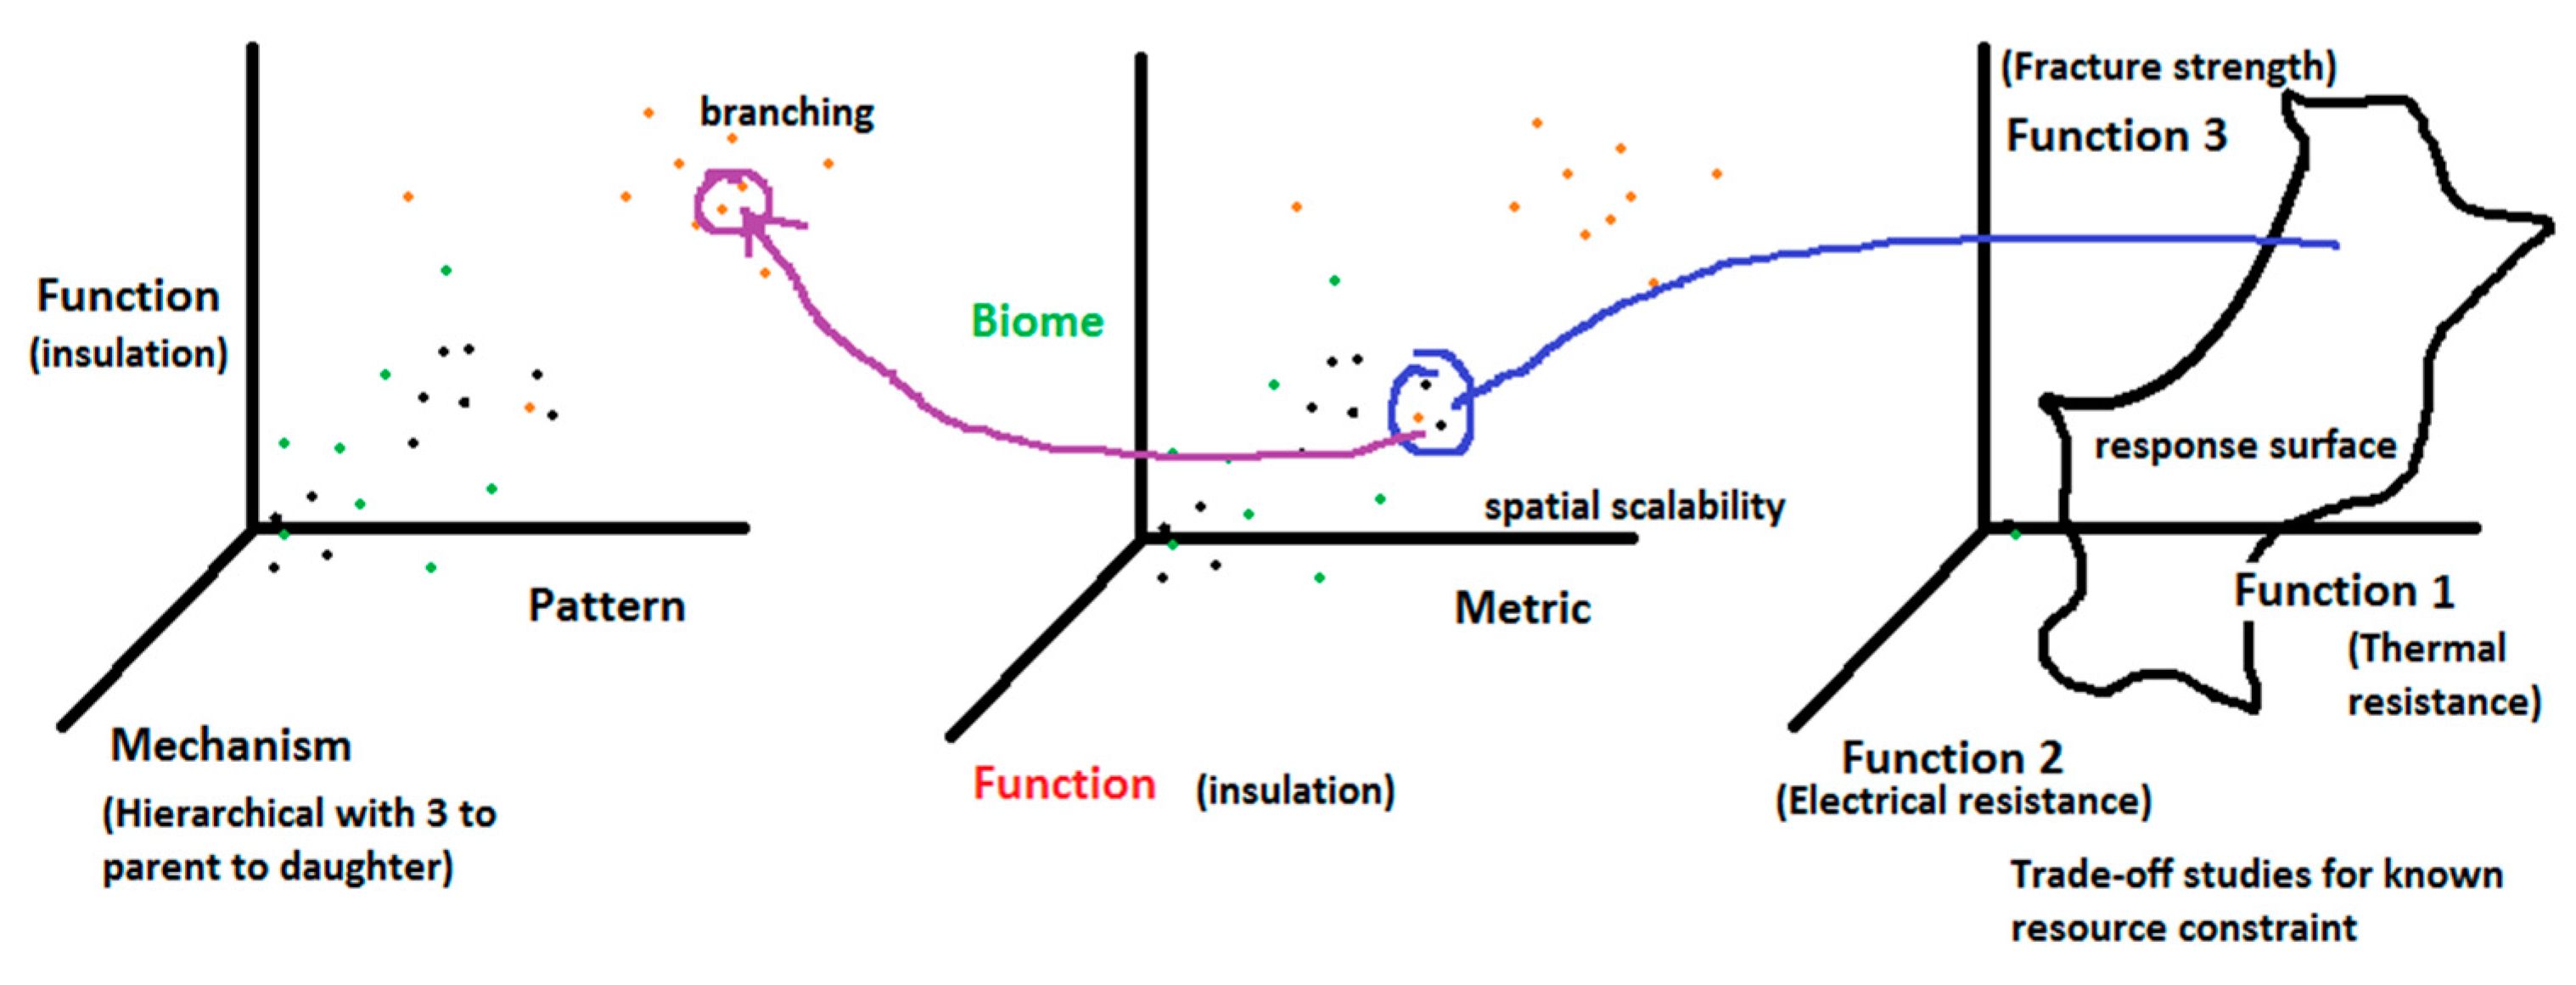
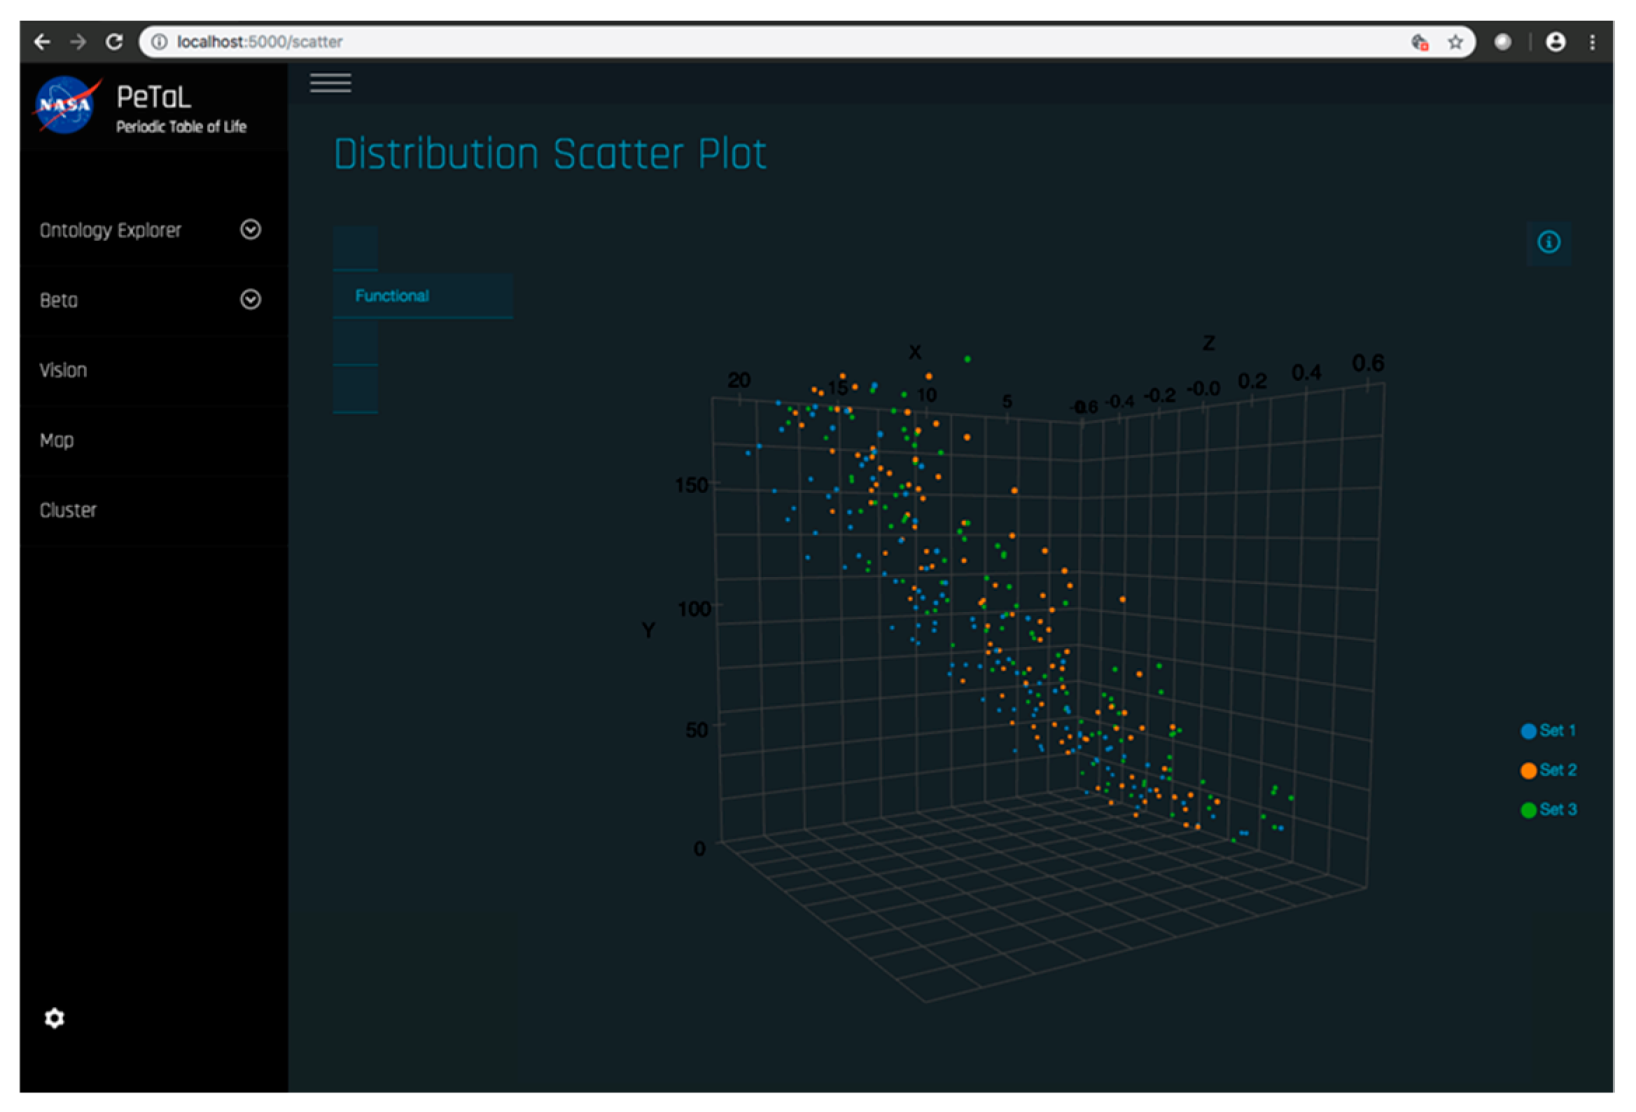
Figure 35 shows a 3D scatter plot with randomly generated data. The intent is to enable the user to change axes and view multiple datasets simultaneously to gain insights into patterns or trends over various scales thus implementing the concept in Figure 3 in addition to allowing the user to perform comparative studies and find gaps in the literature or phylogenetic tree.
As an open source platform, PeTaL seeks data contributions from researchers of varying expertise. Ongoing efforts are exploring opportunities for collaboration with universities and other organizations to develop a standardized way for non-proprietary data to be curated for PeTaL (e.g., a web interface) that is accessible to all.

4.4. V.I.N.E. (Virtual Interchange for Nature-Inspired Exploration)

One of the primary challenges to systems such as PeTaL is access to large volumes of curated data. To address this challenge, institutions such as museums, zoos and aquariums should cooperate to create workflows and standards that benefit research and application. NASA’s Glenn Research Center created V.I.N.E. (Virtual Interchange for Nature-inspired Exploration) in August 2016 as an online global community to pioneer nature-inspired pathways for the benefit of all. NASA V.I.N.E. was established to encourage collaborations between academia, industry, government and citizen scientists around the central theme of physiomimetics. The intention is to encourage academic researchers to contribute data to PeTaL, to encourage government organizations to fund fundamental research to generate data and to motivate industry to apply solutions and share designs. Membership is voluntary and open to all. The group is composed of ‘clusters’ (shown in Table 6) of technology areas led by a volunteer from any organization.
More information may be found online at https://www.grc.nasa.gov/vine/. The vision, mission, goals and objectives of V.I.N.E. are listed below: Vision: To pioneer nature-inspired pathways for the benefit of all; Mission: With physiomimetics as its driving framework, V.I.N.E. seeks to solve NASA’s biggest challenges—in collaboration with academia, industry, and other government agencies.

4.4.1. Goals

  • Establish clusters of researchers, scientists, engineers, and subject matter experts.
  • Select areas for focused biomimetic exploration and/or application.
  • Establish workspaces (both traditional and virtual) where network members can connect and collaborate.
  • Convene at least one annual Biomimicry Summit, at a NASA Center or other agreeable venue.

4.4.2. Objectives of each V.I.N.E. Technology Cluster

  • Convene and leverage a diverse network of multi-disciplinary practitioners and experts, with the purpose of utilizing bio-inspired philosophies, tools, and research to benefit NASA, the nation, and the planet.
  • Contribute standardized data to PeTaL.
  • Assess current policies, plans, programs, funds, research, and technology.
  • Recommend steps for future research.
  • Recommend steps to ensure a viable posture for future funding.

5. Recommendations and Future Work

  • A collaboration between academia and industry is vital for the success of this endeavor. Industry can supply design databases to train algorithms at the system level. These data points do not need to be state of the art.
  • Blockchain and privacy preserving technology may be vital in allowing open source design tools such as PeTaL to democratize design and yet protect intellectual property. It is possible that blockchain could solve the issue of sharing proprietary data by using weights as the quantities that are bookkept and updated. Contributions would be tracked and any resulting intellectual property could be traced to contributing sources. This would allow for zoos, museums and other institutions to provide consulting services with proceeds going to research and conservation.
  • Funding organizations such as the National Science Foundation (NSF), Department of Defense (DoD) and National Aeronautics and Space administration (NASA), must include the collection and curation of datasets and databases as a requirement for proposed work. We must move beyond the existing Darwin Core standards to include data such as shown in Table 1 as well as functional information described earlier in this paper.
  • Work will continue on expanding PeTaL’s database, tools and applications. We project public and private contributions once the tool becomes available as an open source platform. Workshops for tool development, optimization, and integration with others and within the PeTaL framework will be held [42], along with the development of an interface through which researchers and subject matter experts may contribute data in a standardized format. Future work would include a more robust neural network architecture that is more tailored to the task of geometric pattern recognition than MobileNet. One architecture that seems promising is Microsoft’s PatternNet. It is a more generalized network that looks for repetitions in images and identifies them as patterns. After the pattern recognition, it makes use of a deConvolutional Neural Network to localize this pattern in the original image. Furthermore, it would be valuable to use a multi-headed neural network with binary classification for each individual pattern since multiple patterns can be detected in one image.
  • Researchers must determine metrics and ways to evaluate design choices. A preliminary study conducted at NASA Glenn Research Center including 19 individuals form varying backgrounds (age, expertise, gender, race) showed that few individuals down select ideas. This is shown in Figure 36 and Figure 37. The participants were asked to improve the process used to procure food for their households. It is possible that the problem was too generic or that the sample size is too small. This study should be repeated. The problem solving steps of Wanieck et al. [40] were used to study the link between personality type and steps pursued. No obvious pattern emerged. One possibility is that there is no correlation between the way people solve certain problems and the way they identify their personalities. The Meyers Briggs personality test (MBTI®) was used for this study. Both the sample size and the personality test should be varied and the test repeated for a range of problems to extract meaningful insight.
  • Creating a useful interactive design tool requires iteratively integrating feedback from use cases. Two preliminary demos of discovery tools on the PeTaL interface were shared with engineers at NASA Glenn Research Center to demonstrate current features and access points. Work will continue offering demos and use case opportunities to researchers in academia and industry, and other potential users.
  • Several applications of this tool are either underway or planned through NASA-funded contracts as well as NASA-internal work to add data, explore probabilistic design (stochastic design) and to use machine learning algorithms to quantify the performance of systems based on images and videos.

Author Contributions

Conceptualization, V.S.; methodology, L.F., B.W., N.B., J.D., B.B., M.J., I.R., A.N., N.S., V.K., A.C., R.O.R.I., V.S., C.R., H.S., C.U.; software, L.F., B.W., N.B., J.D., B.B., M.J., I.R., A.N., N.S., V.K., A.C., K.G., D.G.; validation, M.J., L.F., J.D., V.S.; resources, V.S., H.S., C.R.; data curation, M.J., A.C., N.B., R.O.R.I., N.S., V.S., C.U.; writing—original draft preparation, V.S.; writing—review and editing, H.S., N.B., B.W., L.F., R.O.R.I., C.U.; visualization, N.B., A.C., I.R., L.F., K.G., M.J., J.D., B.B., A.N., V.S.; supervision, C.R., H.S., V.S.; project administration, V.S.; funding acquisition, V.S.

Funding

This work is funded by a PECASE (Presidential Early Career Award for Scientists and Engineers) for the first author and through the Aeronautics Mission Directorate (ARMD) of NASA (National Aeronautics and Space Administration).

Acknowledgments

The first author would like to thank Randy Anway from New Tapestry for several intellectual conversations and for his architectural expertise. We are grateful to Jacquelyn Nagel and Marjan Eggermont for advice and access to their software and tools. We thank Julian Vincent for providing us with a curated set of publications to experiment with for our machine learning algorithms. We thank Amanda vonDeak (Mori Associates Inc.) for her boundless energy, positivity, for her role in the organization of VINE, including conferences and workshops and for her mentorship of students. We acknowledge the contributions of Shaun McKeehan (NASA GRC) for setting up a server for MongoDB. Paht Juangphanich and Ezra McNichols from NASA GRC are also acknowledged for providing images within Figure 4. We acknowledge the support of Lucinda Allen (Alcion Technologies) and Wendy Berndt (NASA GRC) for their logistics and organizational support. We would also like to thank NASA’s Office of Education for support with internship opportunities and access to design challenges to engage students.

Conflicts of Interest

The authors declare no conflict of interest.

References

  1. Bai, H.; Guo, X.; Narisu, N.; Lan, T.; Wu, Q.; Xing, Y.; Zhang, Y.; Bond, S.R.; Pei, Z.; Zhang, Y.; et al. Whole-genome sequencing of 175 Mongolians uncovers population-specific genetic architecture and gene flow throughout North and East Asia. Nat. Genet. 2018, 50, 1696–1704. [Google Scholar] [CrossRef]
  2. Koren, S.; Rhie, A.; Walenz, B.P.; Dilthey, A.T.; Bickhart, D.M.; Kingan, S.B.; Hiendleder, S.; Williams, J.L.; Smith, T.P.L.; Phillippy, A.M. De novo assembly of haplotype-resolved genomes with trio binning. Nat. Biotechnol. 2018, 36, 1174–1182. [Google Scholar] [CrossRef]
  3. Anon. The future of human genome editing. Nat. Genet. 2017, 49, 653. [Google Scholar] [CrossRef]
  4. Luisi, P.L. The Emergence of Life: From Chemical Origins to Synthetic Biology, 2nd ed.; Cambridge University Press: Cambridge, UK, 2016. [Google Scholar]
  5. Goodall, J. The Chimpanzees of Gombe: Patterns of Behavior; Harvard University Press: Cambridge, MA, USA, 1986. [Google Scholar]
  6. Bar-Cohen, Y. Biomimetics: Mimicking and inspired-by biology. In Proceedings of the Smart Structures and Materials 2005: Electroactive Polymer Actuators and Devices (EAPAD), San Diego, CA, USA, 7–10 March 2005; Volume 5759, p. 1. [Google Scholar] [CrossRef]
  7. Taylor, B. Encyclopedia of Religion and Nature; Bloomsbury: London, UK, 2008; Volume 1. [Google Scholar]
  8. Green, T.A. Martial Arts of the World: Encyclopedia; ABC-CLIO: Santa Barbara, CA, USA, 2001; Volume 1: A-Q. [Google Scholar]
  9. Needham, J. Science and Civilization in China: Physics and Physical Technology, Part 1, Physics; Cambridge University Press: Cambridge, UK, 1962; Volume 4. [Google Scholar]
  10. White, L.T., Jr. Eilmer of Malmesbury, an Eleventh Century Aviator: A Case Study of Technological Innovation, Its Context and Tradition. Technol. Cult. 1961, 2, 97–111. [Google Scholar] [CrossRef]
  11. Haslam, M.; Luncz, L.V.; Staff, R.A.; Bradshaw, F.; Ottoni, E.B.; Falótico, T. Pre-Columbian monkey tools. Curr. Biol. 2016, 26, R515–R522. [Google Scholar] [CrossRef]
  12. Haslam, M.; Hernandez-Aguilar, A.; Ling, V.; Carvalho, S.; de la Torre, I.; DeStefano, A.; Du, A.; Hardy, B.L.; Harris, J.; Marchant, L.; et al. Primate archaeology. Nature 2009, 460, 339–344. [Google Scholar] [CrossRef]
  13. Eggermont, M. Biotechnik and the Bauhaus. Personal Communication, 2016. [Google Scholar]
  14. Gould, S.J. The exaptive excellence of spandrels as a term and prototype. Proc. Natl. Acad. Sci. USA 2015, 94, 10750–10755. [Google Scholar] [CrossRef]
  15. Arndt, E.M.; Moore, W.; Lee, W.-K.; Ortiz, C. Mechanistic origins of bombardier beetle (Brachinini) explosion-induced defensive spray pulsation. Science 2015, 348, 563–567. [Google Scholar] [CrossRef] [Green Version]
  16. Bourg, S.; Jacob, L.; Menu, F.; Rajon, E. How evolution draws trade-offs. bioRxiv 2017, 1–12. [Google Scholar] [CrossRef]
  17. Roff, D.A.; Mostowy, S.; Fairbairn, D.J. The evolution of trade-offs: Testing predictions on response to selection and environmental variation. Evolution 2002, 56, 84–95. [Google Scholar] [CrossRef]
  18. Weinstein, B.S. Evolutionary Trade-Offs: Emergent Constraints and Their Adaptive Consequences. Ph.D. Thesis, University of Michigan, Ann Arbor, MI, USA, 2009. [Google Scholar]
  19. Vincent, J.F.V. The trade-off: A central concept for biomimetics. Bioinspired Biomim. Nanobiomater. 2017, 6, 67–76. [Google Scholar] [CrossRef]
  20. Olson, S.L. Evolution of the rails of the South Atlantic islands (Aves: Rallidae). Smithson. Contrib. Zool. 1973, 152, 1–53. [Google Scholar] [CrossRef]
  21. Fishman, R.S. Evolution and the eye: The Darwin bicentennial and the sesquicentennial of the origin of species. Arch. Ophthalmol. 2008, 126, 1586–1592. [Google Scholar] [CrossRef]
  22. Clune, J.; Misevic, D.; Ofria, C.; Lenski, R.E.; Elena, S.F.; Sanjuán, R. Natural Selection Fails to Optimize Mutation Rates for Long-Term Adaptation on Rugged Fitness Landscapes. PLoS Comput. Boil. 2008, 4, e1000187. [Google Scholar] [CrossRef]
  23. Newman, M. A Model of Mass Extinction. J. Theor. Boil. 1997, 189, 235–252. [Google Scholar] [CrossRef]
  24. Stein, R.W.; Mull, C.G.; Kuhn, T.S.; Aschliman, N.C.; Davidson, L.N.K.; Joy, J.B.; Smith, G.J.; Dulvy, N.K.; Mooers, A.O. Global priorities for conserving the evolutionary history of sharks, rays and chimaeras. Nat. Ecol. Evol. 2018, 2, 288–298. [Google Scholar] [CrossRef]
  25. Avise, J.C.; Nelson, W.S.; Sugita, H. A speciational history of “living fossils”: Molecular evolutionary patterns in horseshoe crabs. Evolution 1994, 48, 1986–2001. [Google Scholar] [CrossRef]
  26. ADW: Home. (n.d.). Available online: https://animaldiversity.org/ (accessed on 31 May 2019).
  27. Encyclopedia of Life. (n.d.). Available online: https://eol.org/ (accessed on 31 May 2019).
  28. “Polar Bear”, Wikipedia. (n.d.). Available online: https://en.wikipedia.org/wiki/Polar_bear (accessed on 31 May 2019).
  29. Simonis, P.; Rattal, M.; Oualim, E.M.; Mouhse, A.; Vigneron, J.-P. Radiative contribution to thermal conductance in animal furs and other woolly insulators. Opt. Express 2014, 22, 1940–1951. [Google Scholar] [CrossRef]
  30. Cui, Y.; Gong, H.; Wang, Y.; Li, D.; Bai, H. A Thermally Insulating Textile Inspired by Polar Bear Hair. Adv. Mater. 2018, 30, 1706807. [Google Scholar] [CrossRef]
  31. Porter, W.P.; Kearney, M. Size, shape, and the thermal niche of endotherms. Proc. Natl. Acad. Sci. USA 2009, 106, 19666–19672. [Google Scholar] [CrossRef] [Green Version]
  32. Dawson, C.; Vincent, J.F.; Jeronimidis, G.; Rice, G.; Forshaw, P. Heat Transfer through Penguin Feathers. J. Theor. Biol. 1999, 199, 291–295. [Google Scholar] [Green Version]
  33. Clarke, J.A.; Ksepka, D.T.; Salas-Gismondi, R.; Altamirano, A.J.; Shawkey, M.; D’Alba, L.; Vinther, J.; Devries, T.J.; Baby, P.; D’Alba, L. Fossil Evidence for Evolution of the Shape and Color of Penguin Feathers. Science 2010, 330, 954–957. [Google Scholar] [CrossRef] [Green Version]
  34. Norberg, U.M.L.; Norberg, R.A. Scaling of wingbeat frequency with body mass in bats and limits to maximum bat size. J. Exp. Biol. 2012, 215, 711–722. [Google Scholar] [CrossRef] [Green Version]
  35. Rian, I.M.; Sassone, M. Tree-inspired dendriforms and fractal-like branching structures in architecture: A brief historical overview. Front. Arch. Res. 2014, 3, 298–323. [Google Scholar] [CrossRef] [Green Version]
  36. Maleki, B.A. Traditional Sustainable Solutions in Iranian Desert Architecture to Solve the Energy Problem. Int. J. Tech. Phys. Probl. Eng. 2011, 3, 84–91. [Google Scholar] [CrossRef]
  37. Meganeura. Wikipedia. Available online: https://en.wikipedia.org/wiki/Meganeura (accessed on 13 September 2018).
  38. Shyam, V.; Ameri, A.; Poinsatte, P.; Thurman, D.; Wroblewski, A.; Snyder, C. Application of Pinniped Vibrissae to Aeropropulsion. In Turbo Expo: Power for Land, Sea, and Air, Volume 2A: Turbomachinery, V02AT38A023; ASME: New York, NY, USA, 2015. [Google Scholar] [CrossRef] [Green Version]
  39. Goel, A.K.; McAdams, D.A.; Stone, R.B. Biologically Inspired Design; Springer: London, UK, 2015. [Google Scholar]
  40. Wanieck, K.; Fayemi, P.-E.; Maranzana, N.; Zollfrank, C.; Jacobs, S. Biomimetics and its tools. Bioinspired Biomim. Nanobiomater. 2017, 6, 53–66. [Google Scholar] [CrossRef] [Green Version]
  41. Scopus Preview—Scopus—Welcome to Scopus. (n.d.). Available online: https://0-www-scopus-com.brum.beds.ac.uk/home.uri (accessed on 31 May 2019).
  42. V.I.N.E. (n.d.). Available online: https://www.grc.nasa.gov/vine/ (accessed on 31 May 2019).
  43. Biomimicry Institute 2016. Available online: http://www.asknature.org/ (accessed on 16 October 2017).
  44. Natekin, A.; Knoll, A. Gradient boosting machines, a tutorial. Front. Neurorobot. 2013, 7, 21. [Google Scholar] [Green Version]
  45. Hadi, A.S.; Kaufman, L.; Rousseeuw, P.J. Finding Groups in Data: An Introduction to Cluster Analysis. Technometrics 1992, 34, 111. [Google Scholar]
  46. Blei, D.M.; Ng, A.Y.; Jordan, M.I. Latent Dirichlet Allocation. J. Mach. Learn. Res. 2003, 3, 993–1022. [Google Scholar]
  47. Schimpf, N.G.; Matthews, P.G.D.; Wilson, R.S.; White, C.R. Cockroaches breathe discontinuously to reduce respiratory water loss. J. Exp. Biol. 2009, 212, 2773–2780. [Google Scholar] [CrossRef] [Green Version]
  48. Fudge, D.S. Composition, morphology and mechanics of hagfish slime. J. Exp. Biol. 2005, 208, 4613–4625. [Google Scholar] [Green Version]
  49. Cronin, A.L. Consensus decision making in the ant Myrmecina nipponica: house-hunters combine pheromone trails with quorum responses. Anim. Behav. 2012, 84, 1243–1251. [Google Scholar]
  50. Malcom, J.W. Evolution of Competitive Ability: An Adaptation Speed vs. Accuracy Tradeoff Rooted in Gene Network Size. PLoS ONE 2011, 6, e14799. [Google Scholar]
  51. Faury, G. Function-structure relationship of elastic arteries in evolution: from microfibrils to elastin and elastic fibres. Pathol. Biol. 2001, 49, 310–325. [Google Scholar]
  52. Penick, C.A.; Prager, S.S.; Liebig, J. Juvenile hormone induces queen development in late-stage larvae of the ant Harpegnathos saltator. J. Insect Physiol. 2012, 58, 1643–1649. [Google Scholar]
  53. Sharma, S.; Coombs, S.; Patton, P.; Perera, T.B.D. The function of wall-following behaviors in the Mexican blind cavefish and a sighted relative, the Mexican tetra (Astyanax). J. Comp. Physiol. A 2008, 195, 225–240. [Google Scholar]
  54. Alonso-Alvarez, C.; Pérez-Rodríguez, L.; Mateo, R.; Chastel, O.; Viñuela, J. The oxidation handicap hypothesis and the carotenoid allocation trade-off. J. Evolut. Biol. 2008, 21, 1789–1797. [Google Scholar] [CrossRef]
  55. Jasmin, J.-N.; Dillon, M.M.; Zeyl, C. The yield of experimental yeast populations declines during selection. Proc. R. Soc. B: Biol. Sci. 2012, 279, 4382–4388. [Google Scholar] [Green Version]
  56. Gage, J.D. Why are there so many species in deep-sea sediments? J. Exp. Mar. Biol. Ecol. 1996, 200, 257–286. [Google Scholar]
  57. Bunge, M. System Boundary. Int. J. Gen. Syst. 1992, 20, 215–219. [Google Scholar] [CrossRef]
  58. List of Systems of the Human Body–Wikipedia. (n.d.). Available online: https://en.wikipedia.org/wiki/List_of_systems_of_the_human_body (accessed on 31 May 2019).
  59. Nagel, J.K.S. A Thesaurus for Bioinspired Engineering Design. In Biologically Inspired Design; Goel, A., Stone, R.B., McAdams, D., Eds.; Springer: London, UK, 2014. [Google Scholar]
  60. Bhatia, J. NoSQL: A Panorama for Scalable Databases in Web. Int. J. Mod. Trends Eng. Res. 2017, 4, 142–147. [Google Scholar]
  61. Kumar, K.B.S.; Srividya; Mohanavalli, S. A performance comparison of document oriented NoSQL databases. In Proceedings of the 2017 International Conference on Computer, Communication and Signal Processing (ICCCSP), Chennai, India, 10–11 January 2017. [Google Scholar]
  62. NoSQLBooster—The Smartest GUI Admin Tool for MongoDB. (n.d.). Available online: https://nosqlbooster.com/ (accessed on 31 May 2019).
  63. HighWire Current. HighWire Press, Inc. Available online: http://highwire.stanford.edu/librarians/hwcurrent.dtl (accessed on 31 May 2019).
  64. Eggermont, M.; Knudsen, S.; Carpendale, S.; Pusch, R. Personal Communication, University of Calgary: Calgary, AB, Canada, 2018.
  65. Lee, D.; Seung, H. Algorithms for non-negative matrix factorization. In Advances in Neural Information Processing Systems; MIT Press: Cambridge, MA, USA, 2001; pp. 556–562. [Google Scholar]
  66. Sievert, C.; Shirley, K. LDAvis: A method for visualizing and interpreting topics. In Proceedings of the Workshop on Interactive Language Learning, Visualization, and Interfaces, Baltimore, MD, USA, 27 June 2014; pp. 63–70. [Google Scholar]
  67. Aggarwal, C. Machine Learning for Text, 2nd ed.; Chaps. 1, 3, 4; Springer International Publishing AG: Cham, Switzerland, 2018. [Google Scholar]
  68. Aggarwal, C.; Reddy, C. Data Clustering: Algorithms and Applications; Chaps. 3, 4; CRC Press: New York, NY, USA, 2014. [Google Scholar]
  69. Mabey, B. pyLDAvis. GitHub Repository. 2015. Available online: https://github.com/bmabey/pyLDAvis (accessed on 31 May 2019).
  70. Krizhevsky, A.; Sutskever, I.; Hinton, G.E. Imagenet classification with deep convolutional neural networks. In Advances in Neural Information Processing Systems; MIT Press: Cambridge, MA, USA, 2012; pp. 1097–1105. [Google Scholar]
  71. LeCun, Y.; Huang, F.J.; Bottou, L. Learning methods for generic object recognition with invariance to pose and lighting. In Proceedings of the 2004 IEEE Computer Society Conference on Computer Vision and Pattern Recognition, 2004. CVPR 2004, Washington, DC, USA, 27 June–2 July 2004; Volume 2, pp. 97–104. [Google Scholar]
  72. He, K.; Zhang, X.; Ren, S.; Sun, J. Deep residual learning for image recognition. In Proceedings of the IEEE Conference on Computer Vision and Pattern Recognition, Las Vegas, NV, USA, 27–30 June 2016; pp. 770–778. [Google Scholar]
  73. Howard, A.G.; Zhu, M.; Chen, B.; Kalenichenko, D.; Wang, W.; Weyand, T.; Andreetto, M.; Adam, H. Mobilenets: Efficient convolutional neural networks for mobile vision applications. arXiv 2017, arXiv:1704.04861. [Google Scholar]
  74. na2ure. (n.d.). Available online: https://www.na2ure.com/ (accessed on 31 May 2019).
  75. Hymenoptera Online (HOL) > Hymenoptera. (n.d.). Available online: https://hol.osu.edu/ (accessed on 31 July 2019).
Figure 1. System concept enabled through artificial intelligence (AI)-driven design and analysis.
Designs 03 00043 g001
Figure 2. A history of imitating nature—biomimicry timeline of the world.
Designs 03 00043 g002
Figure 3. Sketch of Periodic Table of Life (PeTaL) data visualization process for insights.
Designs 03 00043 g003
Figure 4. Hybrid machine learning and biomimetic approach to problem solving.
Designs 03 00043 g004
Figure 5. Mapping of general design space to machine learning data set space.
Designs 03 00043 g005
Figure 6. (a) Example of pattern distribution for an organism. It can be inferred that the organism system, as a whole, is geared toward structural integrity due to the predominance of the spiral and tile pattern in the composition. Spirals are associated with distribution of stress, fluid and energy. Tiles or lattices or tessellations are structural patterns. (b) Role of computer vision in discovery.
Designs 03 00043 g006
Figure 7. Papers on biomimetic approaches published between 2009 and 2017.
Designs 03 00043 g007
Figure 8. Publications between 2009 and 2017 colored by authors. Size of circle shows page count. There are a large number of authors publishing in the field of biomimetics with few sustained efforts.
Designs 03 00043 g008
Figure 9. Recent publications in the field of heat transfer showing connections between articles either through references, common topics or shared authorship.
Designs 03 00043 g009
Figure 10. A comparison between the use of bio-inspired design in the fields of mobility and thermal management. (A) Thermal management network. (B) Mobility network.
Designs 03 00043 g010
Figure 11. The biomimetic landscape based on academic publications accessible through SCOPUS.
Designs 03 00043 g011
Figure 12. PeTaL ontology framework. Individual ontologies may be swapped.
Designs 03 00043 g012
Figure 13. PeTaL architecture.
Designs 03 00043 g013
Figure 14. Word clouds displaying the highest terms found in each of the classes/labels for the 90 articles used to train the XGBoost classification algorithm. Word sizes scale to increase in size as they increase in frequency.
Designs 03 00043 g014aDesigns 03 00043 g014b
Figure 15. Silhouette Profile demonstrating the optimal k for clustering.
Designs 03 00043 g015
Figure 16. Plot demonstrating the distribution of each of the manually assigned labels amongst each of the partitioning around medoids clusters.
Designs 03 00043 g016
Figure 17. Plot demonstrating the distribution of each of the manually assigned labels amongst each of the LDA topics.
Designs 03 00043 g017
Figure 18. Latent Dirichlet Allocation plot that lists the highest frequency terms for an eight-topic analysis.
Designs 03 00043 g018
Figure 19. Plot demonstrating the distribution of each of the LDA topics amongst the different partitioning around medoids clusters.
Designs 03 00043 g019
Figure 20. Taxonomy development example using genus Aster L.
Designs 03 00043 g020
Figure 21. Sketch of possible workflow in PeTaL.
Designs 03 00043 g021
Figure 22. A few pathways available to select biological models for inspiration when solving a problem. The figure includes AskNature’s taxonomy [43] and an engineering to biology thesaurus [59].
Designs 03 00043 g022
Figure 23. Screenshot of the PeTaL R user interface showing geographic scatter of filtered data.
Designs 03 00043 g023
Figure 24. Home page of the Periodic Table of Life (PeTaL).
Designs 03 00043 g024
Figure 25. NoSQL Booster showing PeTaL database.
Designs 03 00043 g025
Figure 26. PeTaL node profile page showing information regarding specific node/entity from ontology and database.
Designs 03 00043 g026
Figure 27. Ontology explorer in PeTaL showing data that is clustered by similarity in taxon. Clicking on nodes shows information regarding the node(s) such as in Figure 26.
Designs 03 00043 g027
Figure 28. Bio-inspired research and design (BIRD) search interface.
Designs 03 00043 g028
Figure 29. Software architecture of BIRD’s back end.
Designs 03 00043 g029
Figure 30. AskNature explorer tool [64] in the PeTaL UI.
Designs 03 00043 g030
Figure 31. Topic modeling tool in PeTaL that automatically groups biological functions to form functional groupings for a bag of words approach.
Designs 03 00043 g031
Figure 32. Image classification with pattern distribution.
Designs 03 00043 g032
Figure 33. Heat map showing which parts of the image activated patterns. Brighter pixels correspond to a higher activation. Tile is mostly noise which is understandable since it has a 0% probability in the predicted output.
Designs 03 00043 g033
Figure 34. Map explorer that shows geographical distribution of species in the database. A scatter plot can show statistical relationships between morphology, function and environment or various morphological features.
Designs 03 00043 g034
Figure 35. Distribution scatter plot displaying semi-random generated data points.
Designs 03 00043 g035
Figure 36. Proportion of population that uses problem solving steps.
Designs 03 00043 g036
Figure 37. Problem solving step [40] and personality. No strong correlation observed.
Designs 03 00043 g037
Table 1. Metrics for characterization of natural models.
MetricPolar Bear FurPenguin FeathersMethod of Data Retrieval
FunctionInsulation [28]Containment of air [32]NLP: Journal of experimental Biology
MechanismsBackscattering (radiation), low thermal conductivity [29]reduce convection, radiation [32]NLP: Journal of experimental Biology
SupersystemPolar BearGentoo PenguinWeb Scraping: Animal Diversity Web, Wikipedia, Encyclopedia of Life
Subsystemunderhair, guard hair, oil [28]afterfeather (barbules, cilia) Web Scraping: Animal Diversity Web, Wikipedia, Encyclopedia of Life
Paralel adaptationsFat (buoyancy) [28]Fat, trapped air (insulation, drag reduction)NLP
Mass350–700 kg [28]4.5 kg–8.5 kg [26]Web Scraping: Animal Diversity Web, Wikipedia, Encyclopedia of Life
Size182 cm to 274 cm [28]70 cm to 95 cm [26]Web Scraping: Animal Diversity Web, Wikipedia, Encyclopedia of Life
Ecosystem ConnectionsPrey: Seals. Weak connections: walrus, whale carcasses, birds’ eggs, muskox, reindeer, rodents, crabs, other crustaceans and other polar bears, plants, berries, roots, and kelp. Dependencies: Foxes and gulls scavenge polar bear kills. Dependent on: abundance of ringed seals. Predators: Orcas, brown bears wolves may kill polar bear (cubs)Prey: crustaceans, such as krill, with fish making up only about 15% of the diet. Weak interactions: fish, squat lobsters, squid. Predators: leopard seals, sea lions, and killer whales. Dependencies: Skuas and giant petrels, kelp gulls, snowy sheathbill, parasites [26,27]Web Scraping: Animal Diversity Web, Wikipedia, Encyclopedia of Life
Ecosystems supportedArctic Ring of Life, polynya, Newfoundland to James Bay [28]Falkland Islands, South Georgia, and Kerguelen Islands; smaller populations are found on Macquarie Island, Heard Islands, South Shetland Islands, and the Antarctic Peninsula [32]Web Scraping: Animal Diversity Web, Wikipedia, Encyclopedia of Life
Longevity<500,000 years [28]38 Mya [32]Web Scraping: Animal Diversity Web, Wikipedia, Encyclopedia of Life
Longevity of adaptation(divergence of mammals) 220 Mya>36 Mya, feathers 75 to 80 Mya [33]Web Scraping: Animal Diversity Web, Wikipedia, Encyclopedia of Life
Variation in genus4 (black, brown, polar, asian black)3 (brush-tailed penguins)Web Scraping: Animal Diversity Web, Wikipedia, Encyclopedia of Life
convergence11NLP
extinction events survivedQuaternary extinction event (74,000, 13,000 years ago). Climate related eventK-T extinctionWeb Scraping: Animal Diversity Web, Wikipedia, Encyclopedia of Life
ecosystem stabilityUncertainLeast concern (conservation status) [26]Web Scraping: Animal Diversity Web, Wikipedia, Encyclopedia of Life
scalabilityTable 1 in [31][32]Data mining from technical articles
exaptation potentialsensory, non-hair epidermal structure, hydrophobicFlight, mobility through air, waterMulti-label classficiation of technical articles, computer vision
Temperature range−34 ℃ to −69 ℃ [28]−30 ℃ on land, −2.2 ℃ in water [26]Mixed
Speedlow (due to overheating)36 km/h in water [32]NLP
Function related parametersSink temperature: −34 to −69 ℃. Source: 37 ℃. Thermal conductivity: 0.0272 W/mK, Wind speed: Low [31]Table 1 in [32], 655ft dive depthData mining from technical articles.Technical databases with equations for nondimensional and scaling laws such as Graschoff number, Peclet number, Strouhal number, Knudsen number etc.
Function related patternDendritic (branching)networked, branched, chaoticComputer vision
Table 2. XGBoost text classification model cross-validation performance metrics.
Hypertuned XGBoost 5-Fold Cross Validation Results
Round No.Training Mlogloss MeanTraining Mlogloss Std.Testing Mlogloss MeanTesting Mlogloss Std.
350.34160.00571.8460.1046
Table 3. Classification probability scores for hold-out testing data set.
Hold-Out Testing XGBoost Results
Break DownGet, Store, or Distribute ResourcesMaintain CommunityMaintain Physical IntegrityMakeModifyMove or Stay PutProcess Information
Cockroaches breathe discontinuously to reduce respiratory water loss [47]
0.1662 0.1335 0.1153 0.1298 0.0978 0.1509 0.0984 0.1078
Composition morphology and mechanics of hagfish slime [48]
0.1006 0.1312 0.1513 0.1286 0.1003 0.1656 0.1098 0.1122
Consensus decision making in the ant Myrmecina nipponica house hunters combine pheromone trails with quorum responses [49]
0.2130 0.0890 0.1290 0.1235 0.1132 0.1607 0.0837 0.0874
Evolution of Competitive Ability An Adaptation Speed vs Accuracy Trade off Rooted in Gene Network Size [50]
0.0975 0.1273 0.1596 0.13070.1164 0.1606 0.0988 0.1087
Function structure relationship of elastic arteries in evolution from microfibrils to elastin and elastic fibres [51]
0.0888 0.0927 0.1031 0.09480.1563 0.2749 0.0902 0.0988
Juvenile hormone induces queen development in late stage larvae of the ant Harpegnathos saltatory [52]
0.0972 0.1356 0.1517 0.1232 0.1269 0.1600 0.1072 0.0979
The function of wall following behaviors in the Mexican blind cavefish and a sighted relative the Mexican tetra Astyanax [53]
0.0786 0.1189 0.1299 0.0956 0.0737 0.1342 0.0863 0.2824
The oxidation handicap hypothesis and the carotenoid allocation trade off [54]
0.1069 0.1272 0.1359 0.1458 0.1089 0.1779 0.0988 0.0982
The yield of experimental yeast populations declines during selection [55]
0.0984 0.1373 0.1353 0.1169 0.1067 0.1838 0.0997 0.1215
Why are there so many species in deep sea sediments [56]
0.1463 0.0936 0.1546 0.1249 0.13990.1465 0.0845 0.1092
Table 4. Derived taxonomy for PeTaL. Column 1 shows the abstracted action from the specific action in column 2. For brevity, the table is not populated completely.
Abstracted ActionAction Mirror/ Disambiguation if ExistsTertiary Terms (from E2B)Biological TermsContextMechanism of ActionSearch Terms (Specific Combinations of Action, Object, Mechanism)Asknature
Change quantity in selfGenerateincreaseproduce, create, spawn, form, originate, synthesize, meiosis, mitosisincrease within modelchemical, physical, electromagneticGenerate resources chemically in a solid, generate resources chemically in a liquid, generate resources chemically in a gas, generate resources physically in a solid...Make/Break Down
DestroydivideDivision, prophase, metaphase, anaphase, cleave, cytokinesis, differentiate, branchdecrease within modelchemical, physical, electromagnetic...
Change boundary condition/ InterfaceAttachcouple, join, linkbond, hook, interlock, join, adhere, adsorbbring into direct association with external modelchemical, physical, electromagneticattach resources to solid through chemicals, attach resources to solid through physical, attach resources to solid through electromagnetic...Stay Put
DetachseparateBleach, meiosis, abscission, mitosis, segment, electrophoresis, dialysis, denature, free, detach, release, divide, differentiate, disarticulate, branch, isolatedend direct association with external modelchemical, physical, electromagnetic...Move/Break Down
Change geometry of environmentTransportmove, push, pull, rotate, oscillate, remove, guidemove, push, pull, rotate, oscillate, remove, guideChange in spatial architecture of environment relative to modelchemical, physical, electromagnetictransport solid resources through chemicals, transport solid resources through physical, transport solid resources through electromagnetic...Move
Transfercopy, transmitCommunicate, transduce, signal, relay, reproduce, deliverInteraction of external environment(s) through modelchemical, physical, electromagnetictransfer resources to gas through chemicals, transfer resources to gas through physical, transfer resources to liquid through electromagnetic...Distribute
Change compositionExchangeimport, exporttrade, osmosis, reflect, react, communicate, remove, symportInteraction between model and environment resulting in composition (resource, energy, information) changechemical, physical, electromagnetic...N/A
Maintain configurationRegulateregulateHomeostasis, cling, hold, bind, connect, stabilize, balance, adjustMaintain internal statechemical, physical, electromagnetic...Protect, Maintain
Change external quantityPromoteactuate, changecatalyze, foster, enhance, increaseChange external statechemical, physical, electromagnetic...Modify
InhibitinhibitCamouflage, reduce, decreaseChange external statechemical, physical, electromagnetic...Modify
Table 5. Abstracted taxonomic building blocks.
ActionEntityNatureResourcePhaseMechanism
Modify/ChangeSelfCompositionEnergySolidPhysical
Maintain/KeepOtherQuantityMassLiquidElectromagnetic
GeometryGasChemical
InterfacePlasma
Table 6. Virtual Interchange for Nature-inspired Exploration (V.I.N.E.) clusters and points of contact as of 1/31/2019.
Technology ClusterCatalyst(s)
Big Data, Artificial Intelligence, Machine Learing, Sensors, RoboticsHerb Schilling
Synthetic Biology, Artificial Evolution and Human Persistence in Space (SHIPS)Anita Alexander Marjan Eggermont
Multi-functional Materials, Structures, ProcessingChris Maurer Tiffany Williams
In-Situ Resource Utilization (ISRU)/Hybrid and Alternative Manufacturing, Design, & Architecture (HAMDA)Andrew Trunek Emil Reyes
Information, Communication, Education (ICE)Marjan Eggermont
Systemology/Systems EngineeringJacquelyn Nagel Curt McNamara
PhotonicsTim Peshek

