Analyzing Transportation Sustainability in the Canary Islands Archipelago
by
 , , and
Rui Alexandre Castanho
1,2,3,4,* ,
,
Arian Behradfar
5 ,
,
Ana Vulevic
3,6 and
and
José Manuel Naranjo Gómez
3,4,7 1
Faculty of Applied Sciences, WSB University, 41-300 Dąbrowa Górnicza, Poland
2
School of Business and Economics and CEEAplA, University of Azores, 9500 Ponta Delgada, Portugal
3
VALORIZA-Research Centre for Endogenous Resource Valorization, 7300 Portalegre, Portugal
4
CITUR-Madeira-Centre for Tourism Research, Development and Innovation, 9000-082 Madeira, Portugal
5
Department of Geomatics and Spatial Information Engineering, College of Engineering, University of Tehran, 1439957131 Tehran, Iran
6
Institute of Transportation—CIP, Department of Urban Planning and Architecture, 11000 Belgrade, Serbia
7
Agricultural School, University of Extremadura, 06007 Badajoz, Spain
*
Author to whom correspondence should be addressed.
Infrastructures 2020, 5(7), 58; https://0-doi-org.brum.beds.ac.uk/10.3390/infrastructures5070058
Submission received: 26 May 2020
/
Revised: 18 June 2020
/
Accepted: 2 July 2020
/
Published: 6 July 2020
Abstract
:The scarcity of resources, the limited land, and the overstressing of tourism, as well as the estrangements of movement, make the insular territories relevant case studies in terms of their regional management and governance and, consequently, sustainable development. Thereby, Transportation and Infrastructures’ Sustainability in these territories is not an exception. In this regard, the present study, through exploratory tools, expects to analyze, using accessibility and connectivity indicators, the impacts over the social-economic sphere that the local Transportation and Infrastructures may deliver to the populations of the Canary Islands Archipelago. The study enables us to identify the islands of La Palma, El Hierro, Fuerteventura, and La Gomera as those with better accessibility patterns.

1. Introduction
The opportunity for access and fluidity of movement to and from an area are intrinsic to sustainable growth, and transport infrastructures have a significant effect on a territory’s competitiveness and prosperity. Accessibility is also a critical factor in socio-economic development policy [1]. Transport accessibility is one of the decisive disparities in insular territories [2]. Moreover, its insufficiency and unavailability may lead to the social exclusion of a part of the population. Insufficient transport and accessibility opportunities are claimed to have a depopulating effect in peripheral areas [3].
Thereby, the current research aims to Analyze Transportation and Infrastructures’ Sustainability in the Canary Islands Archipelago.
In this regard, the article starts with the present introductory section, followed by a brief literature review regarding the Insular Territories, Sustainability, and Transportation, a methodological approach explaining the used methods on the experimental part of the research, the results and their ensuing discussion and conclusions.
2. Insular Territories, Sustainability and the Transportation
Nowadays, the transportation infrastructure is more relevant in the context of sustainable development. Based on the analysis carried out by Oberg et al. [4], infrastructure accessibility as an enabler of sustainable development is well recognized in European Union (EU)’s logistic policy and legislation. In this section, we provide a brief survey of the transport infrastructure and accessibility obtained from the peer-reviewed literature and EU legal and policy documents. This review shows that the transport infrastructure accessibility can effectively contribute to sustainable development in insular territories.
While transport infrastructure can improve the socio-economic dimension of sustainable development through logistics capacity planning and multimodality, hinterland accessibility to transport interchange hubs contributes to other economic aspects and social interactions. Moreover, accessibility plays an undeniable role in insular territories and also enables infrastructure efficiency when coupled with the multimodality of public transport [5]. Stupalo et al. [6] presented the transport infrastructure and accessibility criteria limited to insular areas toward sustainability. The recent development of the Trans-European Transport Network (TEN-T), the EU set up the guidelines of sustainable transportation infrastructure by contributing to accessibility assessment, socio-economic impacts and regional cohesion in insular territories [7].
The notion of ‘insularity’ encompasses not only a geographic condition that pertains to a multitude of islands, but also reflects a series of other features. For example, the economic, social, and demographic dynamics that stem from this geographic particularity. These characteristics are associated with economic and social isolation, resource scarcity, land limitation, and high operational costs. At the same time, insularity characterizes the general ‘atmosphere’ that determines the experiential identity of the ‘islander’ and the distinct environment and trends created in these geographic regions [8].
In this regard, Licio and Pinna (2013) [9] carried out a study that showed the infrastructure accessibility and the distance are interconnected dimensions that contribute to defining the distinct groups of islands characterized by different degrees of insularity. This perspective derived from the typical transport engineering domain varies from simple link-based travel time and congestion indexes to more complicated network-based measures [10]. By analyzing each area’s relative performance in the transport network, it is possible to determine the absolute accessibility of a region. This index could be calculated using different measurement approaches [11,12].
Generally, empirical articles investigate the impacts of infrastructure accessibility analysis based on accessibility modules associated with land use distribution, transport infrastructure, temporal components, and individual characteristics and trends. A proper measurement should ideally take the relationship between these components and accessibility elements into account [13]. In a more general sense, some indicators have been used frequently to express quantifiable or non-quantifiable of infrastructure accessibility and state its positive and negative aspects depending on the stakeholder’s point of view. Table 1 contains these indicators, a brief statement, and the related references in the literature.
While isolation can inhibit local people’s movement, the analysis related to the accessibility measurement and logistical infrastructures of insular territories would be based on a set of indicators or measures derived from the islands’ social, economic, and transport infrastructure characteristics. According to these characteristics, transport accessibility in insular territories can be referred to as a function of a combination of declared indicators [11]. Within the geographical context of insularity, transport, and logistics, infrastructure plays a key role in accessibility, territorial cohesion, and socio-economic development. A destination’s remoteness only seeks to amplify its dependence on transport connections, and transport services are critical for the local population’s sustainability in the insular regions. The complications of these insular regions undermine accessibility to the mainland. The barrier formed by the sea prevents the use of private vehicles, and inter-island transport is limited. [29].
Thus, it is essential to consider the indicators that would be as similar as possible to allow a comparison of the resulting accessibility trends. In this way, they allow us to choose a measurement approach that implements the necessitated indicators to calculate and analyze the accessibility in a highly appropriate way based on the insular characteristics and relevant criteria. Although there is no best approach to measure regional accessibility due to different situations and studies purposes, demand different approaches. As a result, the accessibility measure should firstly be sensitive to challenges, needs, trends, and changes in the transport infrastructure and system [30].
While the mentioned guidelines and evaluations enclose transport infrastructure and accessibility, this study tries to identify and fill the gap regarding the practical analysis of transport and accessibility and significant geographical limitations of insularity in the Canary Islands. The Mediterranean region is considered a suitable study area to analyze the accessibility regarding insularity characteristics.
3. Materials and Methods
In the first stage, the data were obtained using public and official information. Here, the authors have dedicated a considerable amount of time to collect the inherent alphanumeric and graphic information resulting in three thematic layers.
The road network was mainly obtained from the National Geographic Information Center (Centro Nacional de Información Geográfica). Additionally, other sources were used, such as Official Road Maps from the Spanish Ministry of Transportation, Mobility and Urban Agenda, Canary Islands Cartography Company (Cartográfica de Canarias) and the spatial infrastructure data of Canary Island to complete the alphanumeric associated information—the speed and length for each stretch of road.
After, the urban settlements were also obtained from the National Geographic Information Center. However, here it was needed to use the Cadastre Electronic Office (Sede Electrónica del Catastro) and well as the Statistic National Institute. From this, it was possible to generate two layers: i) Roads and ii) Urban Settlements. The roads were represented by using lines, and these lines have linked the alphanumeric information. The urban settlements were represented using points.
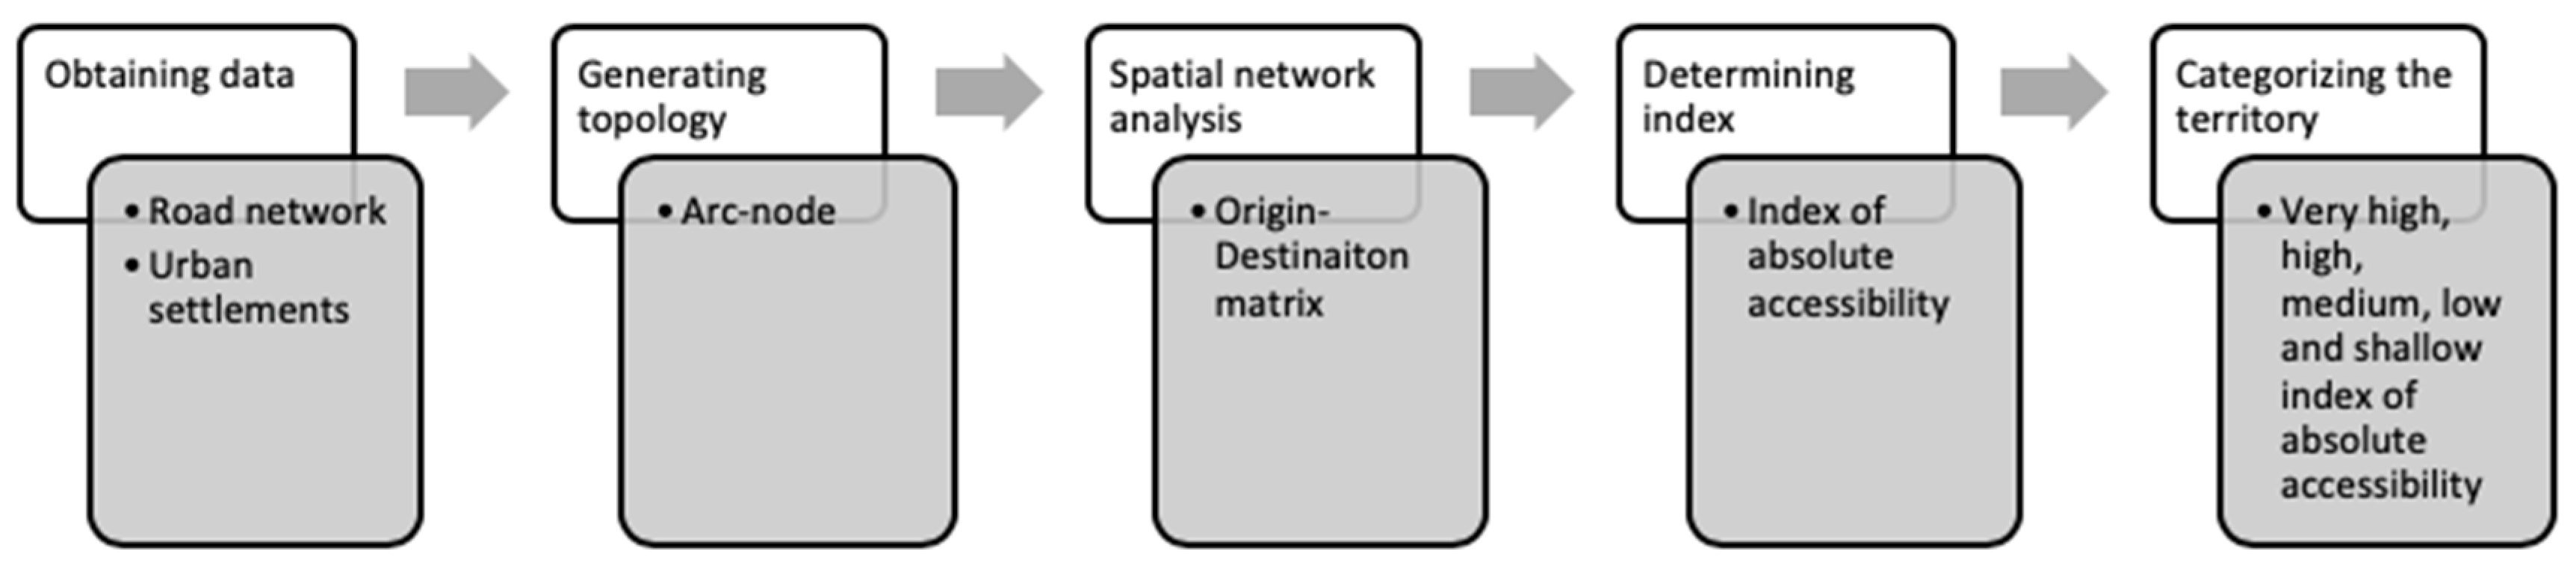
As for roads, it was necessary to generate arc-node topology to perform spatial network analysis. This operation was made using ArcGis 10.3. This topology allowed us to calculate an Origin-Destination Matrix, from each urban settlement to the rest. Thereby, it was possible to obtain a considerable amount of data to determine the index of absolute accessibility (IAAi), which measures the interconnection degree of an urban settlement with the rest of each island, depending on the potential population of each urban settlement [31]. Thus, the index calculates the weighted average of each urban settlement’s minimum access time over the network, taking into account a weighting factor of the recent demographic volume according to the following expression:
where IRij is the minimum time between nodes ij, across the network, and PCAEj is the population of major urban areas in each one of the Canary Islands.
In this regard, the absolute accessibility index is sensitive to the geographical location of population centers. It gives priority to central regions, which is essential from regional development, where the territorial basis cannot be ignored.
The population was used once it is an expected value of the importance of an urban settlement. As it is considered to be a determining factor in order to classify different urban settlements according to its importance on the territory, in this way, it is possible to determine which nodes occupy a central position over the entire network and acquire the best accessibility values. Consequently, it is possible to identify the areas with greater absolute accessibility and, therefore, with more significant opportunities for socio-economic development.
As a result, the weighted impedance by taking into account the population of each destination. If the population is considered an essential index of each urban settlement, the importance of the accessibility concerning the rest of urban settlements will get. Therefore, it is possible to determine the importance of each urban settlement regarding the rest of the urban settlements. Therefore, it is possible to know how reliable the networks are, the position of each settlement regarding the rest of the settlements, and also the amount of population in each settlement on each island.
Besides, once a specific value for each settlement is determined, exact values were attained but not for all territories of each island. However, IAAi is a constant value for all territories. For this reason, an interpolation using inverse distance weighting (IDW) is a type of deterministic method for multivariate interpolation with a known scattered set of points. The parameter power allows the value obtained to be controlled through the data known points. In this case, the power value was 2, since a value higher would emphasize closer known points. Therefore, it was possible to estimate the unknown values of the IAAi value in the whole territory of each island. It is noticeable that IDW is assuming closer values are more related than other values with its function. The outcome was a raster image for each island.
In this regard, the data classification method divides the attribute values into equal size ranges by taking into account the minimum and maximum values of the absolute accessibility index. This means that this classification method divides the range of attribute values into sub-ranges of equal size. In this case, the value obtained from the index of absolute accessibility. The reasons for using this classification were: (i) we have a quantitative variable with high variability in the values obtained; and, (ii) the distribution of the absolute accessibility values follows a normal distribution.
The number of intervals was five because it was possible to identify on a five-class scale, the areas with the greatest and least absolute accessibility. In this way, the differences in accessibility between the analysed areas could be analysed in more detail. Thus, it was possible to categorize the territory in five classes: very high, high, medium, low, and shallow index of absolute accessibility.
Furthermore, a thematic map was obtained for each island, enabling us to analyse the geographical information further. Besides, to analyse the alphanumeric information, Structured Query Language (SQL) was used, allowing us to select the settlements corresponding to each category. The number of settlements and total population for each was obtained. Consequently, it was possible to get the percentage of settlements and population for each category, even by using a representation with graphics.
To summarize the abovementioned, the following chart outlines the methodology used (Figure 1).
4. Results
The present section shows the results obtained from the analysis of the seven Islands of Canary Archipelago. The outcomes are presented as in Table 2, Table 3, Table 4, Table 5, Table 6, Table 7 and Table 8 (first subsection). Additionally, the thematic cartography of the two regional capitals of the archipelago are shown (Figure 1 and Figure 2).
Trough Table 2, it is possible to verify different levels of accessibility as well as the attractiveness of potential destinations (population) in town and settlements in the Island of Fuerteventura. Some cities (22) have the lowest accessibility levels, representing the consequence of the lower development of the road transport infrastructure endowments (north and middle of the island). A high level of accessibility presents a real situation in 68 towns, with 45.09% of the population. In 13 cities, a very high level of accessibility represented the network’s ideal performance, accessible to 11.90 % of the population.
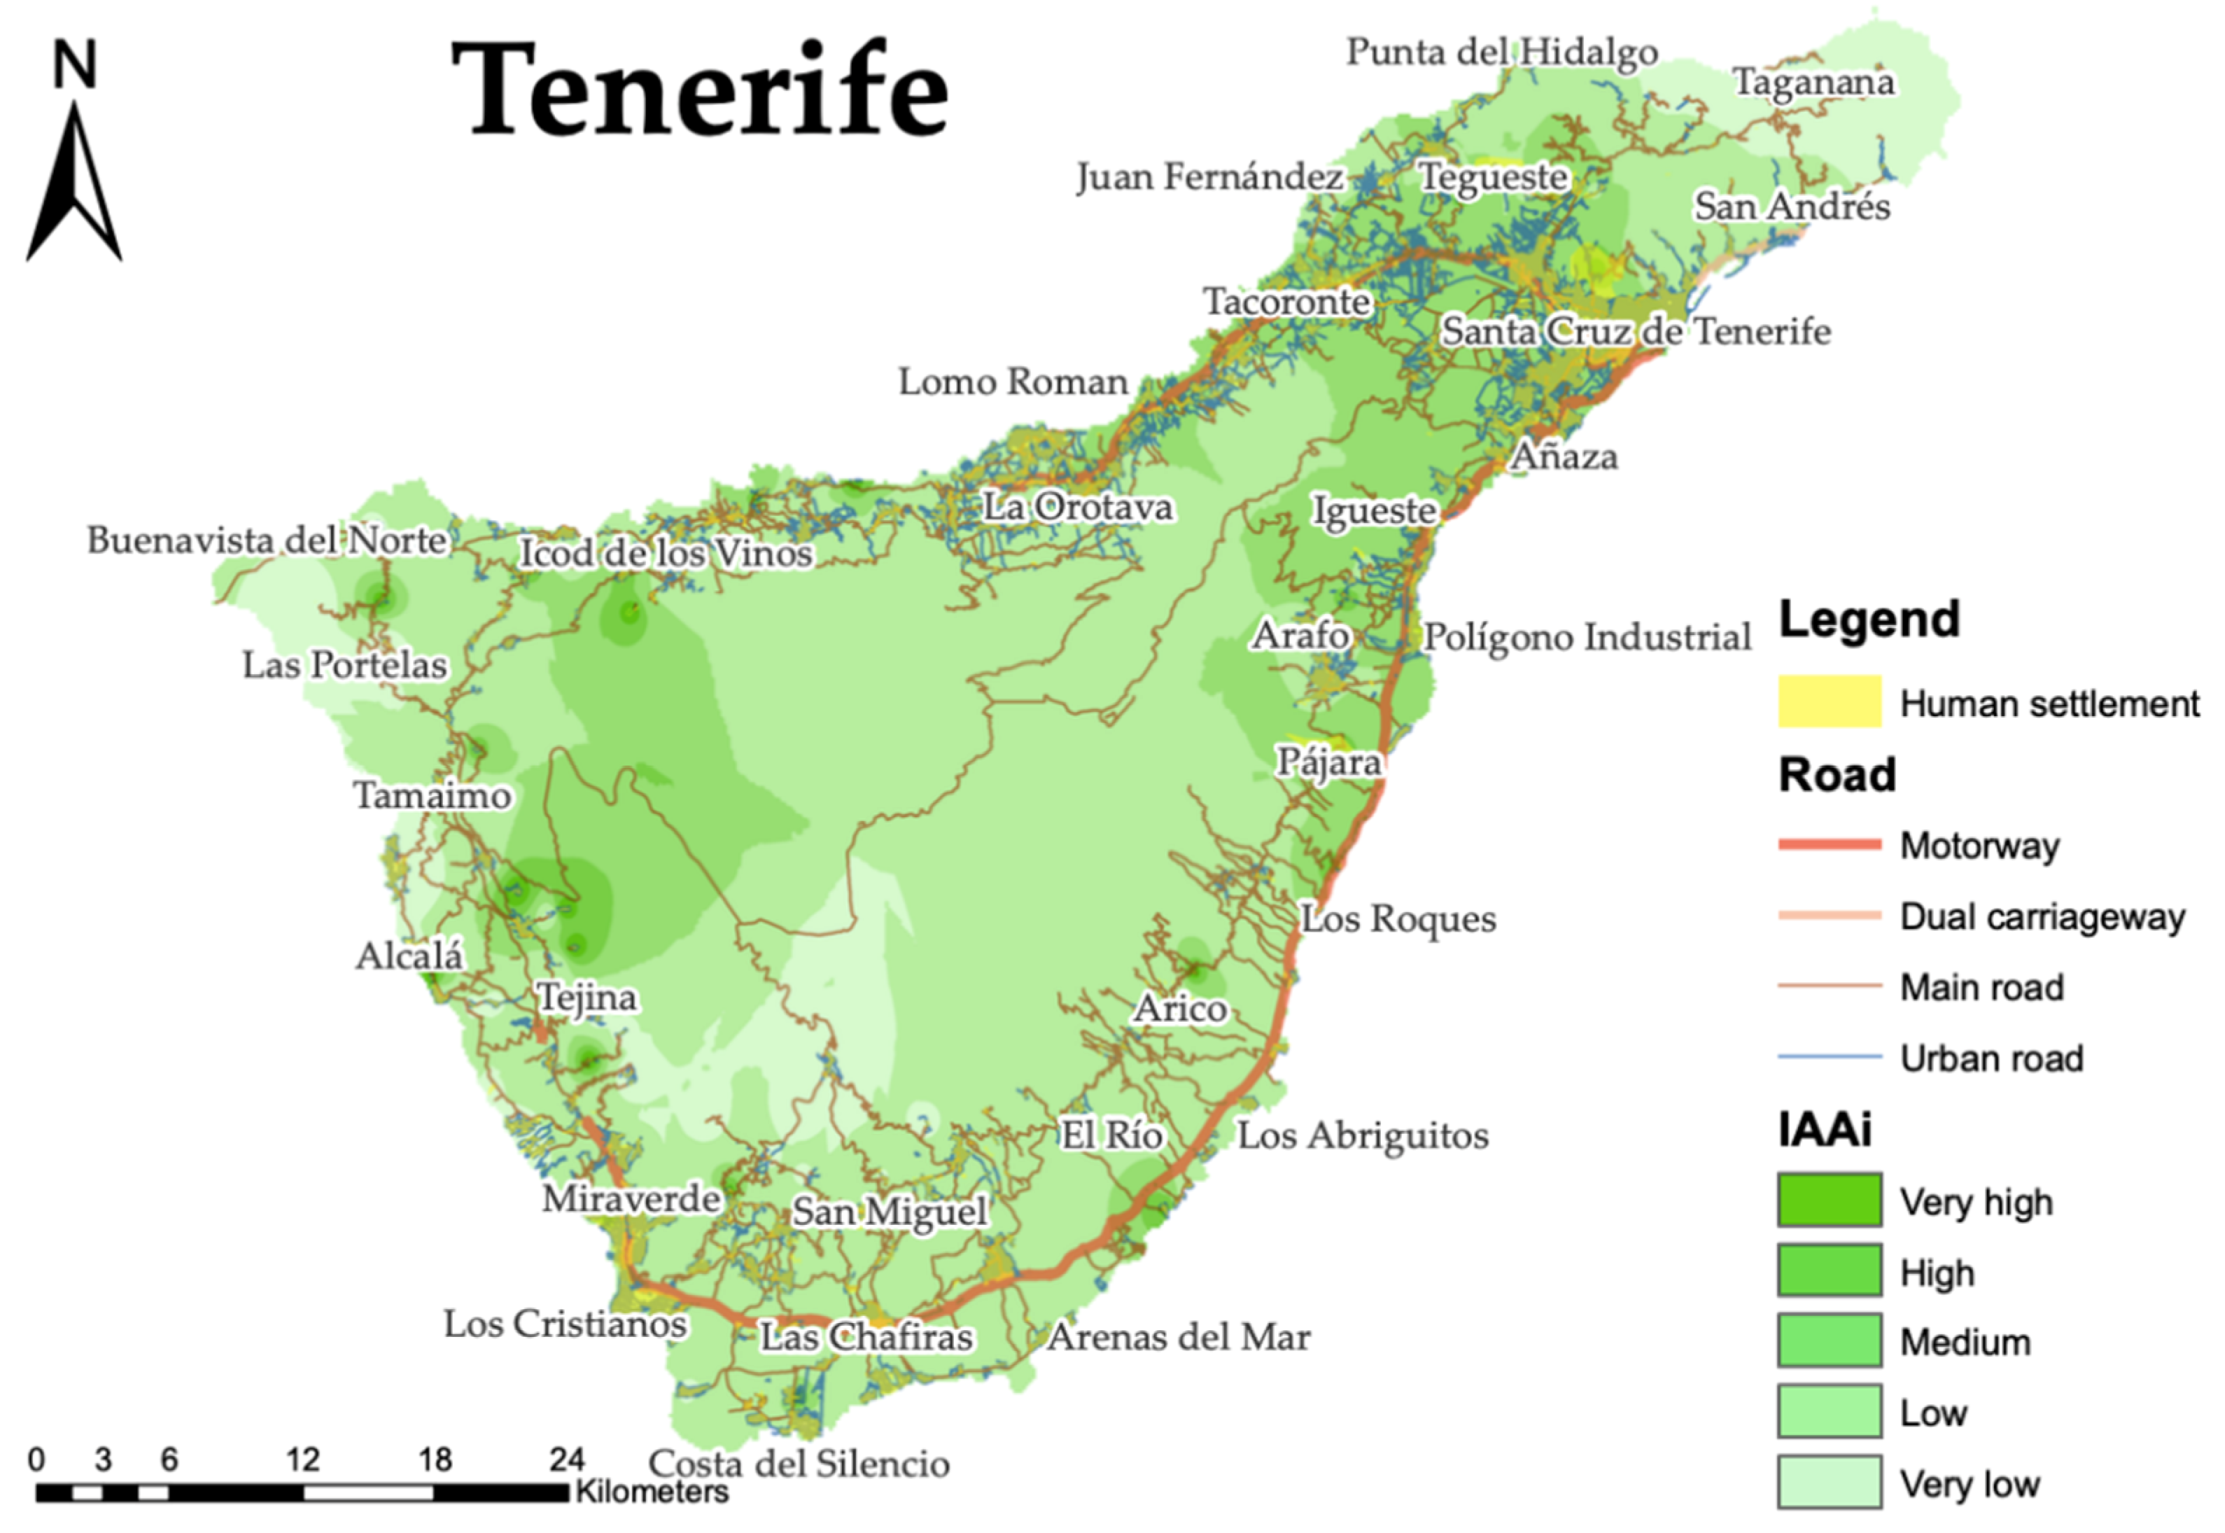
In Tenerife’s population, about 73.12% have low-level accessibilities in more than half of settlements (57.26%) in 347 analyzing towns. As we can see on the map, Tenerife (Figure 2) has an excellent road network along the coastal belt of the island with the main road arteria (motorway), where the settlements are mostly located. The middle of the island is sparsely populated with one main road in longitudinal directions. The population of few towns on the northeast and west sides of the island have a high and very low accessibility. Accessibility is unevenly distributed.
The high accessibility levels in the Island of El Hierro (Table 4) represent the consequence of the high-quality transport infrastructure systems mostly in longitudinal directions with secondary networks. In 19 towns with 86.36% settlements and a 90.80% population accessibility level is in the high category. One part on the west and south territory has a low index of absolute accessibility (IAAi).
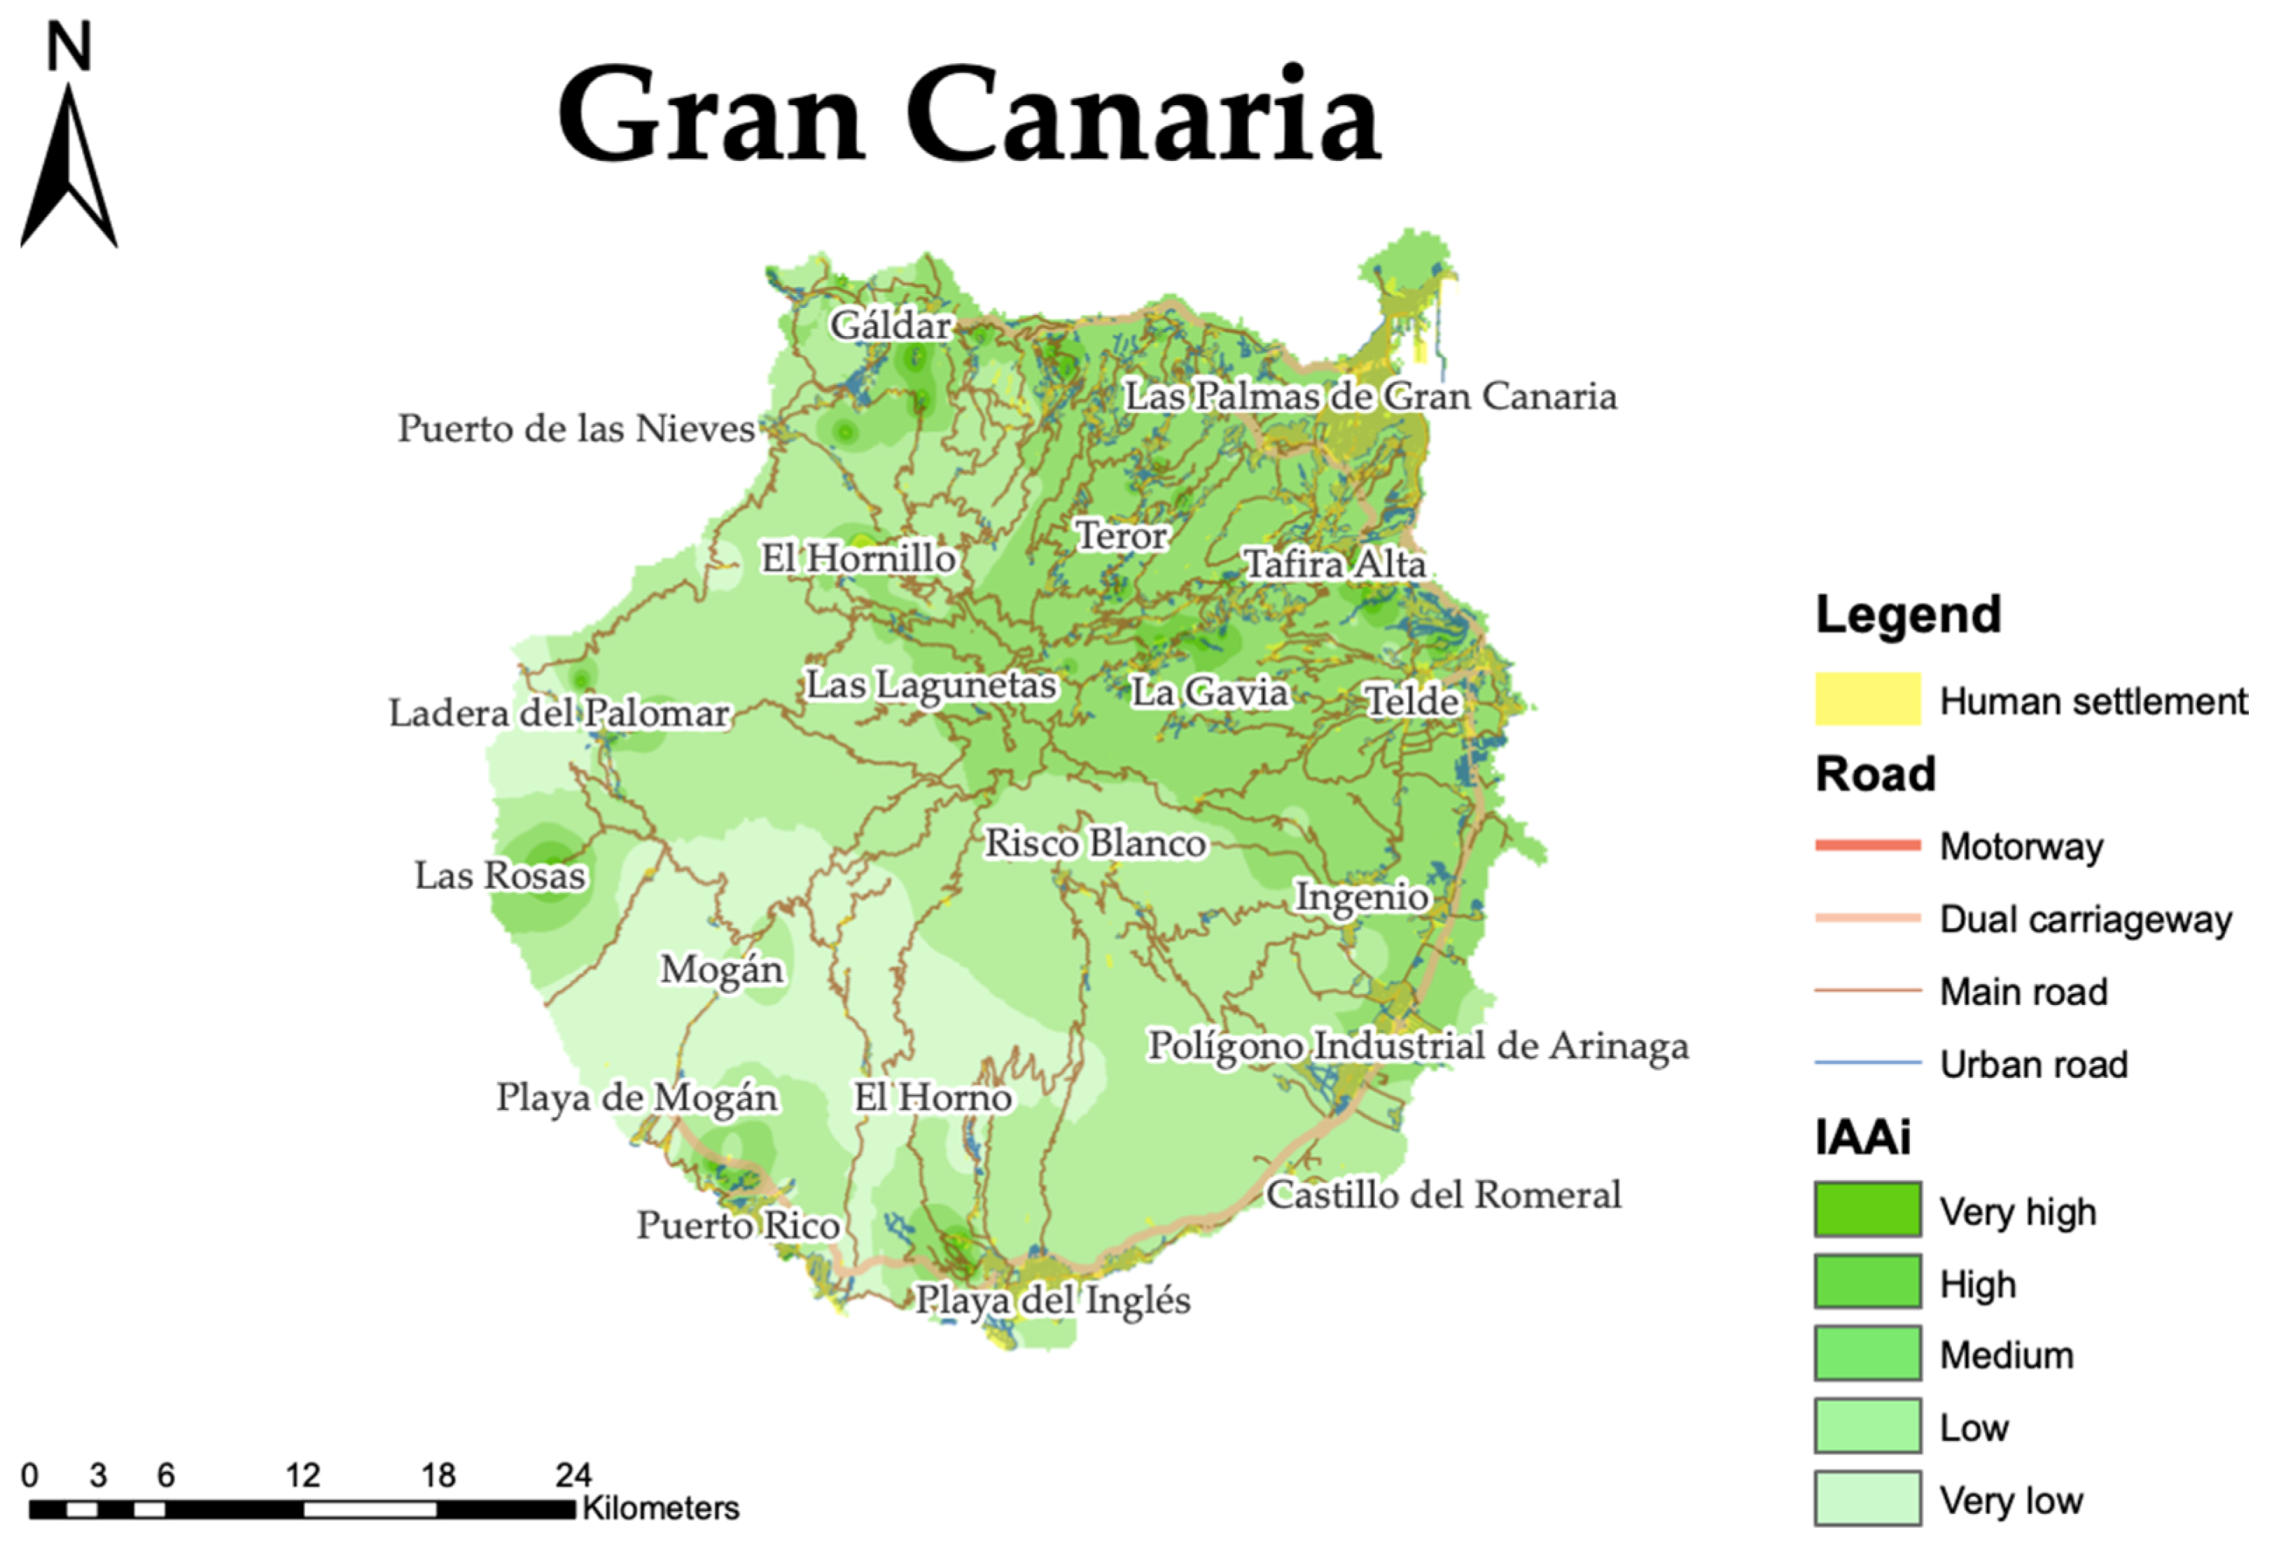
The most significant part of Gran Canaria Island (Table 5) has a medium level of accessibility. Several towns with 79% of the population with medium accessibility levels are 485. Accessibility is monotonically distributed along a corridor of a dual carriageway. However, it displays discontinuities with the other part of the island. Regarding that, a good density network of main roads with secondary networks covers the northern and northeast part of the island where accessibility values are in the range of medium to very high. The low accessibility level has 14.37% of the population, which dominates in the middle of the island and southwest parts (Figure 3).
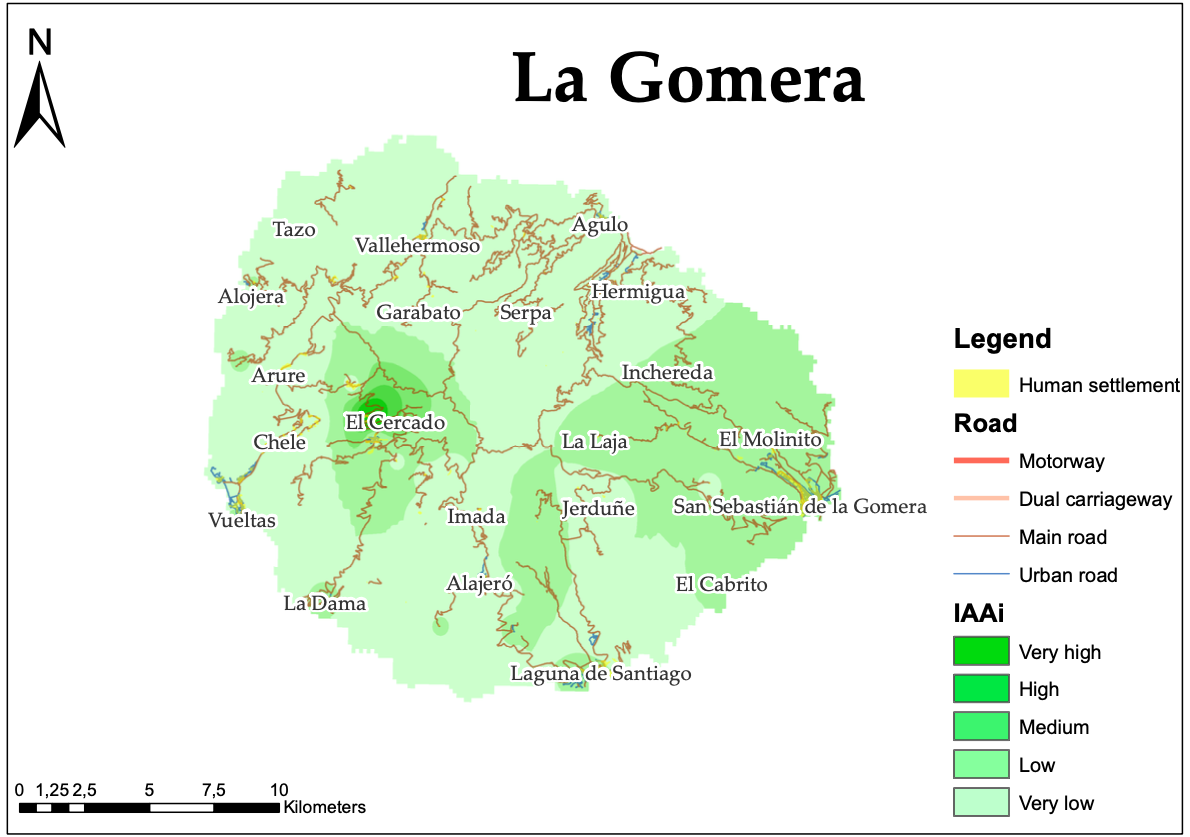
La Gomera (Table 6) has very high, high, and medium accessibility values in one center, El Cercado, and their surroundings, but the other parts of territory have low or very low accessibility levels. The road network is in a range of main roads and connects settlements, but 47% of the population live near the El Cercado area.
La Palma has very high accessibility values in 141 towns, with 79.64% (Table 7). There is no motorway running through this island territory. There exists a good density of road networks in peripheral areas of the island, especially in the east and west, with few transversal road directions.
Lanzarote has medium accessibility in 53 towns with a population of 83.23% in the 58.24% settlement (Table 8). As we can see, it is mostly in the middle part of the island with good road infrastructure endowment. Some towns have very high values in this area. Nevertheless, the north and South Island area have low accessibility.
5. Discussion and Conclusions
The issue related to peripheral territories is indeed very complex to analyze and sometimes to understand. In this regard, we have examples of economic vulnerability and resilience. Those are difficult to be defined in a “typical” economic structure or labor market profile that could be dubbed “the mountain economy,” or “the island economy,” as each category of geographic specificity is much too diverse. Nevertheless, many (but not all) of the case study areas feature an above-average share of employment in the public sector (often due to a generally low diversification of economic activity). However, this is much truer for mountainous, insular, sparsely populated, and outermost areas and only for coastal and border areas. Often, these areas of “classical” geographic specificity (mountains, islands, SPAs, ORs) are characterized as being “small economies” (i.e., with a small market and only limited availability of workforce [32,33]. Besides, they are also often removed from urban agglomerations where investment (from outside) is consequently less attractive.
If we analyze the ESPON GEOSPECS project, many of these “specializations” areas are directly or indirectly linked to their geographic specificity. As an example, the strong emphasis on tourism in many of these areas (such as mountainous or coastal landscapes primarily perceived as “beautiful” by visitors, offering opportunities for outdoor recreational activities).
In many cases, a rich history and culture complement the environmental assets, and this may be linked to the geographic specificity, particularly for coasts—where the historical importance of ports is an element of cultural heritage—island and mountain areas, and ORs, where isolation adds to the preservation of traditions. As mentioned, social capital is vital in the form of preserved traditions, tightly knit communities, and even values such as courteousness, but more so in the more isolated areas, i.e., islands, SPAs, and many mountain areas. This is valued highly by many residents, but can also be perceived as “suffocating.” We can use border areas as an analogy to peripheral and ultra-peripheral regions. These border regions can have particular social capital in that they are places where different cultures meet. Additionally, such territories are exposed to different influences, i.e., multicultural, “open” societies can, therefore, emerge in these areas [34,35,36,37,38,39,40,41]. This is not necessarily the case, as identity-based, exclusionary behavior can also develop in border areas. The combination of the various elements of attractiveness makes such areas desirable living spaces.
However, this can, in turn, cause conflicts, as when a significant inflow of pensioners and second-home owners drives up house prices, which can exclude younger population segments that can no longer afford housing. In combination with the outmigration of younger people (due to lack of employment opportunities and education institutions), this means that these areas have rapidly aging populations, putting pressure on welfare systems. Even though natural and social capital are essential factors in residence choices, they cannot compensate for the lack of job opportunities and access to services. This indicator measures access to urban centers, which means access to market potential and their locational advantages. Access to services such as schools, health care, hospitals, grocery services, and universities has become a specific challenge during the last decade in remote and sparsely populated areas and areas with other physical handicaps, such as being an island in this study’s case [42].
According to ESPON INTERCO: “Remote regions (islands) have by far higher disparities compared to urban regions or regions located close to a city”. The favored positions have a town with a combination of proper road infrastructure in the form of dense motorways and a high population concentration. Accessibility by road decreases towards towns located in the core of islands in general. Low accessibility by road is found on Tenerife island in about 57% of settlements. Additionally, most regions have some parts of territories with very low accessibility. In those islands, accessibility always improves when new infrastructure is built. However, exceptions can be regions where population declines when considering the cost of using infrastructure endowment [32,33,42].
Fair and affordable access to general interest services, information, knowledge, and mobility are essential for territorial cohesion [41,42]. Providing services and minimizing infrastructure barriers can improve competitiveness and the sustainable and harmonious territorial development of the EU [32,42]. That means accessibility, transport infrastructure, and logistics are considered essential for territorial cohesion and integration. This is the main objective, especially for out remotes territories as islands [42]. It plays a pivotal role in service provision and accessibility in a broader sense since they are essential for regional connectivity and integration. The objective is to ensure that every territory benefits from well-being standards and equal development potentials, especially for remote, isolated, or sparsely populated areas (INTERCO Indicator factsheet) [43].
Besides, the Outermost Regions Article 349 of the TFEU lists nine Outermost Regions (ORs) and presents the main determinants of this specific EU status [43]. As a political category, accessing the status of OR (or abandoning it) requires validation at the EU’s level. Following recent decisions, there are now only eight OR (Table 9): Four French Départements: Martinique and Guadeloupe, French Guiana and Reunion; One French “Collectivité”: Saint Martin; Two Portuguese Autonomous Regions: Madeira and the Azores; One Spanish Autonomous Community: the Canary Islands [43].
The topographic characteristics of our remote area have consequences on the values of transportation accessibility (between them and the other of the world and within each island). Many remote islands are not integrated into his regional environment because openness and connectivity are vital for this area. The Canarian archipelago (Gran Canaria and Tenerife), are well served by primary airline connections. However, this is not the case for smaller islands, such as El Hierro or La Gomera, which, although they have an airport, are served only by internal lines (Figure 4) [42].
The economy of these islands is strongly related to the role of services. It is different on different islands. For example, on the Canary Islands, the immense complex of the hotels and restaurants sector, tourism is characteristic of Lanzarote and Fuerteventura islands. In those islands, the main activities are associated with tourism. In contrast, activity is more diversified in the two capital islands of Tenerife and Gran Canaria. Here, the private sector, with tourism and also transportation, trade, construction, and real estate, are characteristic of Tenerife and Gran Canaria [42,44]. However, for all islands, challenges are related to the inadequate infrastructure, the high unemployment rate, the migration for employment, the large public sector, the high dependence of adequate accessibility, or the lack of an adequate governance structure.
Three principal urban agglomerations are dominating Tenerife (with the largest population and strong economy). Road traffic predominates on the Island. All work and other activities in intercity traffic are performed by car, 62%, and while alternative transport means (bus, coach, tram, and taxi) account for 18 % and car-pooling for 19 % [45]. The north part of the Island is about 40 km away from urban agglomerations and about 80 km to the south. In the 1990s, there were traffic solutions for the tram network that would improve public transport [46].
Traffic solutions for the new road network were also proposed regarding increasing accessibility. Later, new ideas emerged regarding rail transport in the north and south of the island, but these plans were not implemented either. According to Calero [47], “the railway as a means of transport has no advantage in this case due to the rigidity of this infrastructure and reduced accessibility due to tunnel solutions that pass through cities, which would require the use of cars again to major railway stations.” This increases both travel time and costs. Therefore, it seems that transport policies will go in the direction that car traffic remains dominant in Tenerife. However, this car-oriented policy will cause road congestion and other impacts on land and transport and increase environmental impacts. One of the solutions in increasing accessibility and mobility was bus and mass transit transport [46]. If we talk about sustainable transport and accessibility solutions, the development of walking and cycling is like mass public transport, and vehicles powered by alternative fuels are the potential to be exploited [48]. According to the EEA [49] (2016), “(…) electric vehicles are the only solution when neither non-motorized nor public transport is an efficient alternative”. Nevertheless, as pointed out in Colmenar et al. [50] “(…) the sustainability of electric vehicles should be in line with the sustainability of the energy system.”
Accessibility in Tenerife is unevenly distributed (as we can see in Table 3). It seems that this unevenness will be present for some time because of wasted public funds in unnecessary infrastructure expansion, without strategic transportation plans.
When exploring future sustainable scenarios regarding accessibility and transportation for islands in general, it is known that a mass tourism economy based on sun-and-sand resorts have associated negative impacts on the local environment, especially in coastal areas. It is also known that there are neither alternative fuels for aviation nor expected revolutionary technologies; therefore, sustainable transport in the tourism sector is still a utopia [51].
Some problems lay in politics and decision making, especially when the decision in transportation projects is involved. According to Aguilera [52], “Island councils are fundamentally authoritarian, and infrastructure projects in the Canary Islands are said to be an excuse to invest public funds to pay back previous favors to companies which have funded political parties, because that the islands are currently in a situation of accessibility, environmental, social and democratic degradation.”
These remote positions generate costs, especially for transport. Market characteristics (limited size and fragmentation again) are also a challenge in terms of human resources. Wages are much lower on average in the Canary Islands than in continental Spain. Nevertheless, qualified workers are rare. The employers can higher well-trained workers from continental Spain (but with higher wages), or themselves launch training programs (which is costly and reduces productivity). Besides, mobility issues between islands increase this problem of access to qualified workers [42,44].
In fact, there are costs induced by the region’s handicaps on its specific economy. Additionally, the remoteness from significant production and consumption centers and the reduced size and fragmentation of the market (seven islands with “double insularity”), are the main factors that generated costs for Canarian enterprises. These handicaps being permanent, associated costs also are. The heavier of these costs are transportation, human resources, business trips, and some business services (such as marketing). Stocking and financing costs are also significant issues. Despite the apparent influence of these various geography-linked factors, the Canary Islands are the only Outermost Region whose performances are comparable with several continental regions. It is thus especially interesting to examine how the Canarians managed to get over these handicaps and how well they did [42,44]. The small size of the market and its fragmentation hamper economies of scale: infrastructures and teams are necessarily limited in size, if not dispatched throughout the archipelago, and can barely reach the minimal scale needed for efficiency.
Consequently, productive equipment is generally oversized, which contributes to generating very high average production costs and limits strategic options in terms of diversification and specialization, which are just some examples. Furthermore, water and energy generation and distribution are a significant issue in the archipelago, requiring significant investments and inducing high consumer prices. Waste management is also more challenging and thus more expensive than on the continent. Finally, remoteness from economic and political centers like Madrid and Barcelona induce frequent trips to continental Spain for Canarians [42,43,44,45,46,47,48,49,50,51,52,53].
On the one hand, the geographic categories “island,” “mountains,” “coast,” “sparsely populated” and “border” area are embedded in the national territorial policy discourses of the concerned countries. Most of them have more or less long-standing traditions of addressing the specific challenges and opportunities of these areas through dedicated measures or have debated the need for such measures. On the other hand, the understanding of each European citizen regarding these notions contributes to shaping how he or she perceives European territories and their interactions. These “general understandings” of GEOSPECS categories are essential factors of development, not least when trying to understand how local growth coalitions are formed and how internal and external territorial branding processes may improve economic and social performance [32,33,54,55].
6. Final Remarks
It was possible to understand the transportation and infrastructures’ sustainability and accessibility patterns in the Canary Islands Archipelago through the present research. Additionally, throughout the study, it was possible to identify the demographic dynamics and urban agglomerations classified according to the accessibility levels in the seven islands of Canarias.
Thereby, it is possible to say that the islands with better accessibility patterns are La Palma, El Hierro, Fuerteventura, and La Gomera. With medium accessibility, patterns are the islands of Gran Canaria and Lanzarote. Moreover, with low accessibility, patterns are the island of Tenerife.
Considering that Tenerife is one of the regional capitals, it is very worrying that the accessibility patterns are low. Even if the accessibility patterns and transportation and infrastructures’ sustainability in other islands of the archipelago should be re-thought and revised by the main actors (Gran Canaria or Lanzarote), in the particular case of Tenerife, we believe that should be a priority.
Author Contributions
Conceptualization, R.A.C. and J.M.N.G.; methodology, J.M.N.G. and A.V.; software, A.B.; validation, R.A.C., A.V. and J.M.N.G.; formal analysis, A.B.; investigation, A.B.; resources, R.A.C.; data curation, A.B.; writing—original draft preparation, A.B.; writing—review and editing, A.B.; visualization, J.M.N.G. and A.V.; supervision, R.A.C.; project administration, R.A.C.; funding acquisition, R.A.C. and J.M.N.G. All authors have read and agreed to the published version of the manuscript.
Funding
This research received no external funding.
Conflicts of Interest
The authors declare no conflict of interest.
References
- Farrington, J.H.; Farrington, C.J.T. Rural accessibility, social inclusion and social justice: Towards conceptualisation. J.Transp. Geogr. 2005, 13, 1–12. [Google Scholar] [CrossRef]
- Velaga, N.R.; Nelson, J.D.; Wright, S.D.; Farrington, J.H. The Potential Role of Flexible Transport Services in Enhancing Rural Public Transport Provision. J. Public Transp. 2012, 15, 111–131. [Google Scholar] [CrossRef]
- Šťastná, M.; Vaishar, A. The relationship between public transport and the progressive development of rural areas. Land Use Policy 2017, 67, 107–114. [Google Scholar] [CrossRef]
- Öberg, M.; Nilsson, K.L.; Johansson, C. Major transport corridors: The concept of sustainability in EU documents. Transp. Res. Procedia 2017, 25, 3694–3702. [Google Scholar] [CrossRef]
- Pérez-Mellado, V.; Ortega, F.; Martín-García, S.; Perera, A.; Cortázar, G. Pollen load and transport by the insular lizard, Podarcis lilfordi (Squamata, Lacertidae) in coastal islets of Menorca (Balearic Islands, Spain). Isr. J. Zool. 2013, 46, 193–200. [Google Scholar] [CrossRef] [Green Version]
- Stupalo, V.; Jolic, N.; Bukljas, M. Overview of Intermodal Liner Passenger Connections within Croatian Seaports. In Maritime Transport and Shipping—Marine Navigation and Safety of Sea Transportation; Weintrit, A., Neumann, T., Eds.; CRC Press: Boca Raton, USA, 2013; pp. 217–222. ISBN 978-1-138-00105-3. [Google Scholar]
- Weintrit, A. Marine Navigation and Safety of Sea Transportation: Maritime Transport & Shipping; A Balkema Book; CRC Press: Boca Raton, FL, USA, 2013. [Google Scholar]
- Chlomoudis, C.; Kostagiolas, P.A.; Papadimitriou, S.; Tzannatos, E.S. A European perspective on public service obligations for island transport services. Marit. Econ. Logist. 2011, 13, 342–354. [Google Scholar] [CrossRef]
- Pinna, A.M.; Licio, V. Measuring Insularity As a State of Nature. Is there a Case of Bad Geography? Centre for North South Economic Research, University of Cagliari and Sassari: Sardinia, Mediterranean, 2013. [Google Scholar]
- Luis, J.A.H. The role of inter-island air transport in the Canary Islands. J. Transp. Geogr. 2004, 12, 235–244. [Google Scholar] [CrossRef]
- Cross, M.; Nutley, S. Insularity and Accessibility: The Small Island Communities of Western Ireland. J. Rural Stud. 1999, 15, 317–330. [Google Scholar] [CrossRef]
- Rosik, P.; Pomianowski, W.; Komornicki, T.; Goliszek, S.; Szejgiec-Kolenda, B.; Duma, P. Regional dispersion of potential accessibility quotient at the intra-European and intranational level. Core-periphery pattern, discontinuity belts and distance decay tornado effect. J. Transp. Geogr. 2020, 82, 5–26. [Google Scholar] [CrossRef]
- De Frias, A.D.S.; Cabral, J. Facility Localization: Strategic Decision on Insular Territory. Asian J. Bus. Manag. 2013, 1, 217–225. [Google Scholar]
- Dehoorne, O.; Cao, H. Mobility and tourist locations. The case of Martinique Island, a French territory in the Caribbean. Natl. Comm. Geogr. Belg. 2005, 4, 121–134. [Google Scholar] [CrossRef]
- Cimou, M. Insularity and Urban Hierarchies: The Case of La Reunion. In Proceedings of the 46th Congress of the European Regional Science Association: Enlargement, Southern Europe and the Mediterranean, Vlos, Greece, 30 August – 3 September 2006. [Google Scholar]
- Tsiotas, D.; Polyzos, S. Analyzing the Maritime Transportation System in Greece: A Complex Network Approach. Netw. Spat. Econ. 2014, 15, 981–1010. [Google Scholar] [CrossRef]
- Arnold, P.; Peeters, D.; Thomas, I. Modelling a rail/road intermodal transportation system. Transp. Res. 2004, 40, 255–270. [Google Scholar] [CrossRef]
- Rigas, K.; Sambracos, E.; Gatzoli, A. Air and Sea Transport:Competition Strategies Under Normal and Economic Crisis Environments. J. Econ. Bus. 2011, 61, 65–84. [Google Scholar]
- Baddour, J.; Percebois, J. Insularity and sustainable transport Challenges and perspectives—Reunion Island, a case in point. Int. J. Energy Sect. Manag. 2012, 6, 558–568. [Google Scholar] [CrossRef]
- Dimou, M. Commuting Trips and Traffic Congestion in Insular Regions: Case of Reunoin Island; Creesur, University of Reunion: Reunion islands, France, 2014. [Google Scholar]
- Coccossis, H.; Nijkamp, P. Overcoming Isolation, Information and Transportation Networks in Development Strategies for Peripheral Areas; Coccossis, H., Nijkamp, P., Eds.; Springer: Berlin/Heidelberg, Germany, 1995. [Google Scholar]
- Gutierrez, J. Location, economic potential and daily accessibility: An analysis of the accessibility impact of the high-speed line Madrid–Barcelona–French border. J. Transp. Geogr. 2001, 9, 229–242. [Google Scholar] [CrossRef]
- Cubero-Irizarry, C.A. Mobility and Insularity in the Caribbean: Island Identities of Culebra; University of Manchester: Manchester, UK, 2006. [Google Scholar]
- Sakib, N.; Appiotti, F.; Magni, F.; Maragno, D.; Innocenti, A.; Gissi, E.; Musco, F. Addressing the Passenger Transport and Accessibility Enablers for Sustainable Development. Sustainability 2018, 10, 903. [Google Scholar] [CrossRef] [Green Version]
- López-Marrero, T.; Yamane, K.; Scalley, T.H.; Colón, N.V. The Various Shapes of the Insular Caribbean: Population and Environment. Caribb. Stud. 2012, 40, 17–37. [Google Scholar] [CrossRef]
- Armstrong, H.W.; Read, R. Insularity, remoteness, mountains and archipelagos: A combination of challenges facing small states? In Proceedings of the Regional Studies Association Conference ‘Europe at the Margins: EU Regional Policy, Peripherality and Rurality, Angers, France, 15–16 April 2004. [Google Scholar]
- Niehof, A. Food, Diveristy, Vulnerability and Social Change—Research Findings from Insular Southeast Asia; Wageningen Academic Publishers: Wageningen, The Netherlands, 2010. [Google Scholar]
- Vezzani, V.; Gonzaga, S. Design for Social Sustainability. An educational approach for insular communities. Des. J. 2017, 20, 937–951. [Google Scholar] [CrossRef] [Green Version]
- Delgado Aguiar, G.; Hernández Luis J, Á. Maritime Transport, Atlantic and Mediterranean Port Networks The Example of the Canary Islands. Rev. Estud. Andal. 2019, 38. [Google Scholar]
- Biosca, O.; Spiekermann, K.; Stępniak, M. Transport Accessibility at Regional Scale; Institute of Geography and Spatial Organization—Polish Academy of Sciences: Warsaw, Poland, 2013. [Google Scholar]
- Gutiérrez, J.; Monzón, A.; Piñero, J.M. Accesibilidad a los centros de actividad econémica en España. Rev. Obras Públicas 1994, 141, 34–49. [Google Scholar]
- ESPON GEOSPECS Project. European Perspective on Specific Types of Territories Applied Research 2013/1/12 Final Report|Version 20/12/2012; ESPON GEOSPECS Project: Luxembourg, 2013; ISBN 978-2-919777-14-3. [Google Scholar]
- ESPON. Accessibility by the Sea Indicators D2—Final Report Spiekermann & Wegener Urban and Regional Research (S&W) January 2017; ESPON: Luxembourg, 2020. [Google Scholar]
- Castanho, R.A. Sustainable Urban Planning in Transboundary Areas: Analysis of Critical Factors for Territorial Success. Ph.D. Thesis, Department of Vegetal Biology, Ecology and Earth Sciences, University of Extremadura (UEx) Badajoz, Spain, 2017. [Google Scholar]
- Loures, L.; Castanho, R.A.; Naranjo Gómez, J.; Cabezas, J.; Fernández-Pozo, L. The Influence of Cross-Border Cooperation (CBC) in the Fostering of Entrepreneurship and Regional Development—A Step Closer to Achieve Major Structural Changes and Sustainable Cities Within European Territory. In Series: Entrepreneurship and Structural Change in Dynamic Territories; Chapter in the Book New Paths of Entrepreneurship Development; Springer: Berlin/Heidelberg, Germany, 2019; pp. 371–385. ISBN 978-953-51-5884-4. [Google Scholar] [CrossRef]
- Loures, L.; Castanho, R.A.; Vulevic, A.; Naranjo Gómez, J.; Cabezas, J.; Fernández-Pozo, L. The Multi-variated Effect of City Cooperation in Land Use Planning and Decision-making Processes—a European Analysis. In Chapter in the Book: Urban Agglomerations; InTech: Vienna, Austria, 2018; pp. 87–106. ISBN 978-953-51-5884-4. [Google Scholar]
- Nauwelaers, C.; Maguire, K.; Marsan, G.A. The Case of Helsinki-Tallinn (Finland-Estonia)—Regions and Innovation: Collaborating Across Borders. In OECD Regional Development Working Papers, 2013/19; OECD Publishing: Paris, France, 2013. [Google Scholar] [CrossRef]
- Nicolini, E.; Pinto, M.R. Strategic vision of a Euro-Mediterranean port city: A case study of palermo. Sustainability 2013, 5, 3941–3959. [Google Scholar] [CrossRef] [Green Version]
- Pérez-Nieto, E.G. Centralization as a barrier to cross-border cooperation? Some preliminary notes from an Iberian approach. J. Borderl. Stud. 2016, 31, 481–495. [Google Scholar] [CrossRef]
- Vulevic, A. Demographic response to accessibility improvement in depopulation cross border regions: The Case of Euro region Danube 21 in Serbia. In Proceeding Book, Faculty of Geography; University of Belgrade: Belgrade, Serbia, 2017; UDC 314.87:911.37(497.11). [Google Scholar]
- Vulevic, A.; Castanho, R.A.; Naranjo Gómez, J.M.; Loures, L.; Cabezas, J.; Fernández-Pozo, L.; Martín Gallardo, J. Accessibility Dynamics and Regional Cross-Border Cooperation (CBC) Perspectives in the Portuguese—Spanish Borderland. Sustainability 2020, 12, 1978. [Google Scholar] [CrossRef] [Green Version]
- ESPON. INTERCO Indicators of Territorial Cohesion, Scientific Platform and Tools Project 2013/3/2 Indicators Factsheets; ESPON: Luxembourg, 2013. [Google Scholar]
- European Union—European Parliament. Outermost Regions (ORS). Available online: www.europarl.europa.eu/ftu/pdf/en/FTU_3.1.7.pdf (accessed on 15 May 2020).
- European Commission (EC). Final Report on ‘Transport Accessibility for the EE Outermost Regions’ (ORS) Prof Laurie Pickup, Claudio Mantero. Available online: https:www.ec.europa.eu/regional_policy/sources/policy/themes/outermost-regions/pdf/transport_report_en.pdf (accessed on 15 May 2020).
- Council of Tenerife. The Council of Tenerife. Available online: www.tenerife.es (accessed on 15 May 2020).
- OECD. ITF Transport Outlook 2017. Available online: www.oecd.org/about/publishing/itf-transport-outlook-2017-9789282108000-en.htm (accessed on 15 May 2020).
- Pérez, R.A.C. Marco para una nueva política de movilidad en las islas Canarias. Rincones Del Atl. 2009, 6, 308–317. [Google Scholar]
- European Commission (EC). European Environment Agency. Available online: www.eea.europa.eu/highlights/walking-cycling-and-public-transport (accessed on 15 May 2020).
- EEA Report. Electric Vehicles in Europe; Publications Office of the European Union: Luxembourg, 2016. [Google Scholar] [CrossRef]
- Colmenar-Santos, A.; de Palacio-Rodriguez, C.; Rosales-Asensio, E.; Borge-Diez, D. Estimating the benefits of vehicle-to-home in islands: The case of the Canary Islands. Energy 2017, 134, 311–322. [Google Scholar] [CrossRef]
- Hernandez, Y.; Barbosa, P.; Corral, S. Scenarios for Resilience and Climate Adaptation Strategies in Tenerife (Canary Islands): Three Pathways towards 2040; European Commission: Luxembourg, 2017. [Google Scholar] [CrossRef]
- Klink, F.A. Discurso y praáctica de los grupos empresariales y poliáticos: Megaproyectos y megamentiras. In Economiáa, Poder y Megaproyectos; Naredo, J.M., Klink, F.A., Eds.; Fundacioán Ceásar Manrique: Lanzarote, Spain, 2009; pp. 53–77. [Google Scholar]
- Grydehøj, A.; Hayward, P. Social and economic effects of spatial distribution in island communities: Comparing the Isles of Scilly and Isle of Wight, UK. J. Mar. Isl. Cult. 2014, 3, 9–19. [Google Scholar] [CrossRef] [Green Version]
- Makkonen, T.; Salonen, M.; Kajander, S. Island accessibility challenges: Rural transport in the Finnish archipelago. Eur. J. Transp. Infrastruct. Res. 2013, 13, 274–290. [Google Scholar]
- Custodio, E.; Guerra, J.A.; Jimenez, J.; Medina, J.A.; Soler, C. The effects of agriculture on the volcanic aquifers of the canary islands. Environ. Geol. 1983, 5, 225–231. [Google Scholar] [CrossRef]
Figure 1.
Used methodology (Source: authors).

Figure 2.
Thematic cartography regarding the accessibility levels in the Island of Tenerife (Source: authors).
Figure 2.
Thematic cartography regarding the accessibility levels in the Island of Tenerife (Source: authors).

Figure 3.
Thematic cartography regarding the accessibility levels in the Island of Gran Canaria (Source: authors).
Figure 3.
Thematic cartography regarding the accessibility levels in the Island of Gran Canaria (Source: authors).

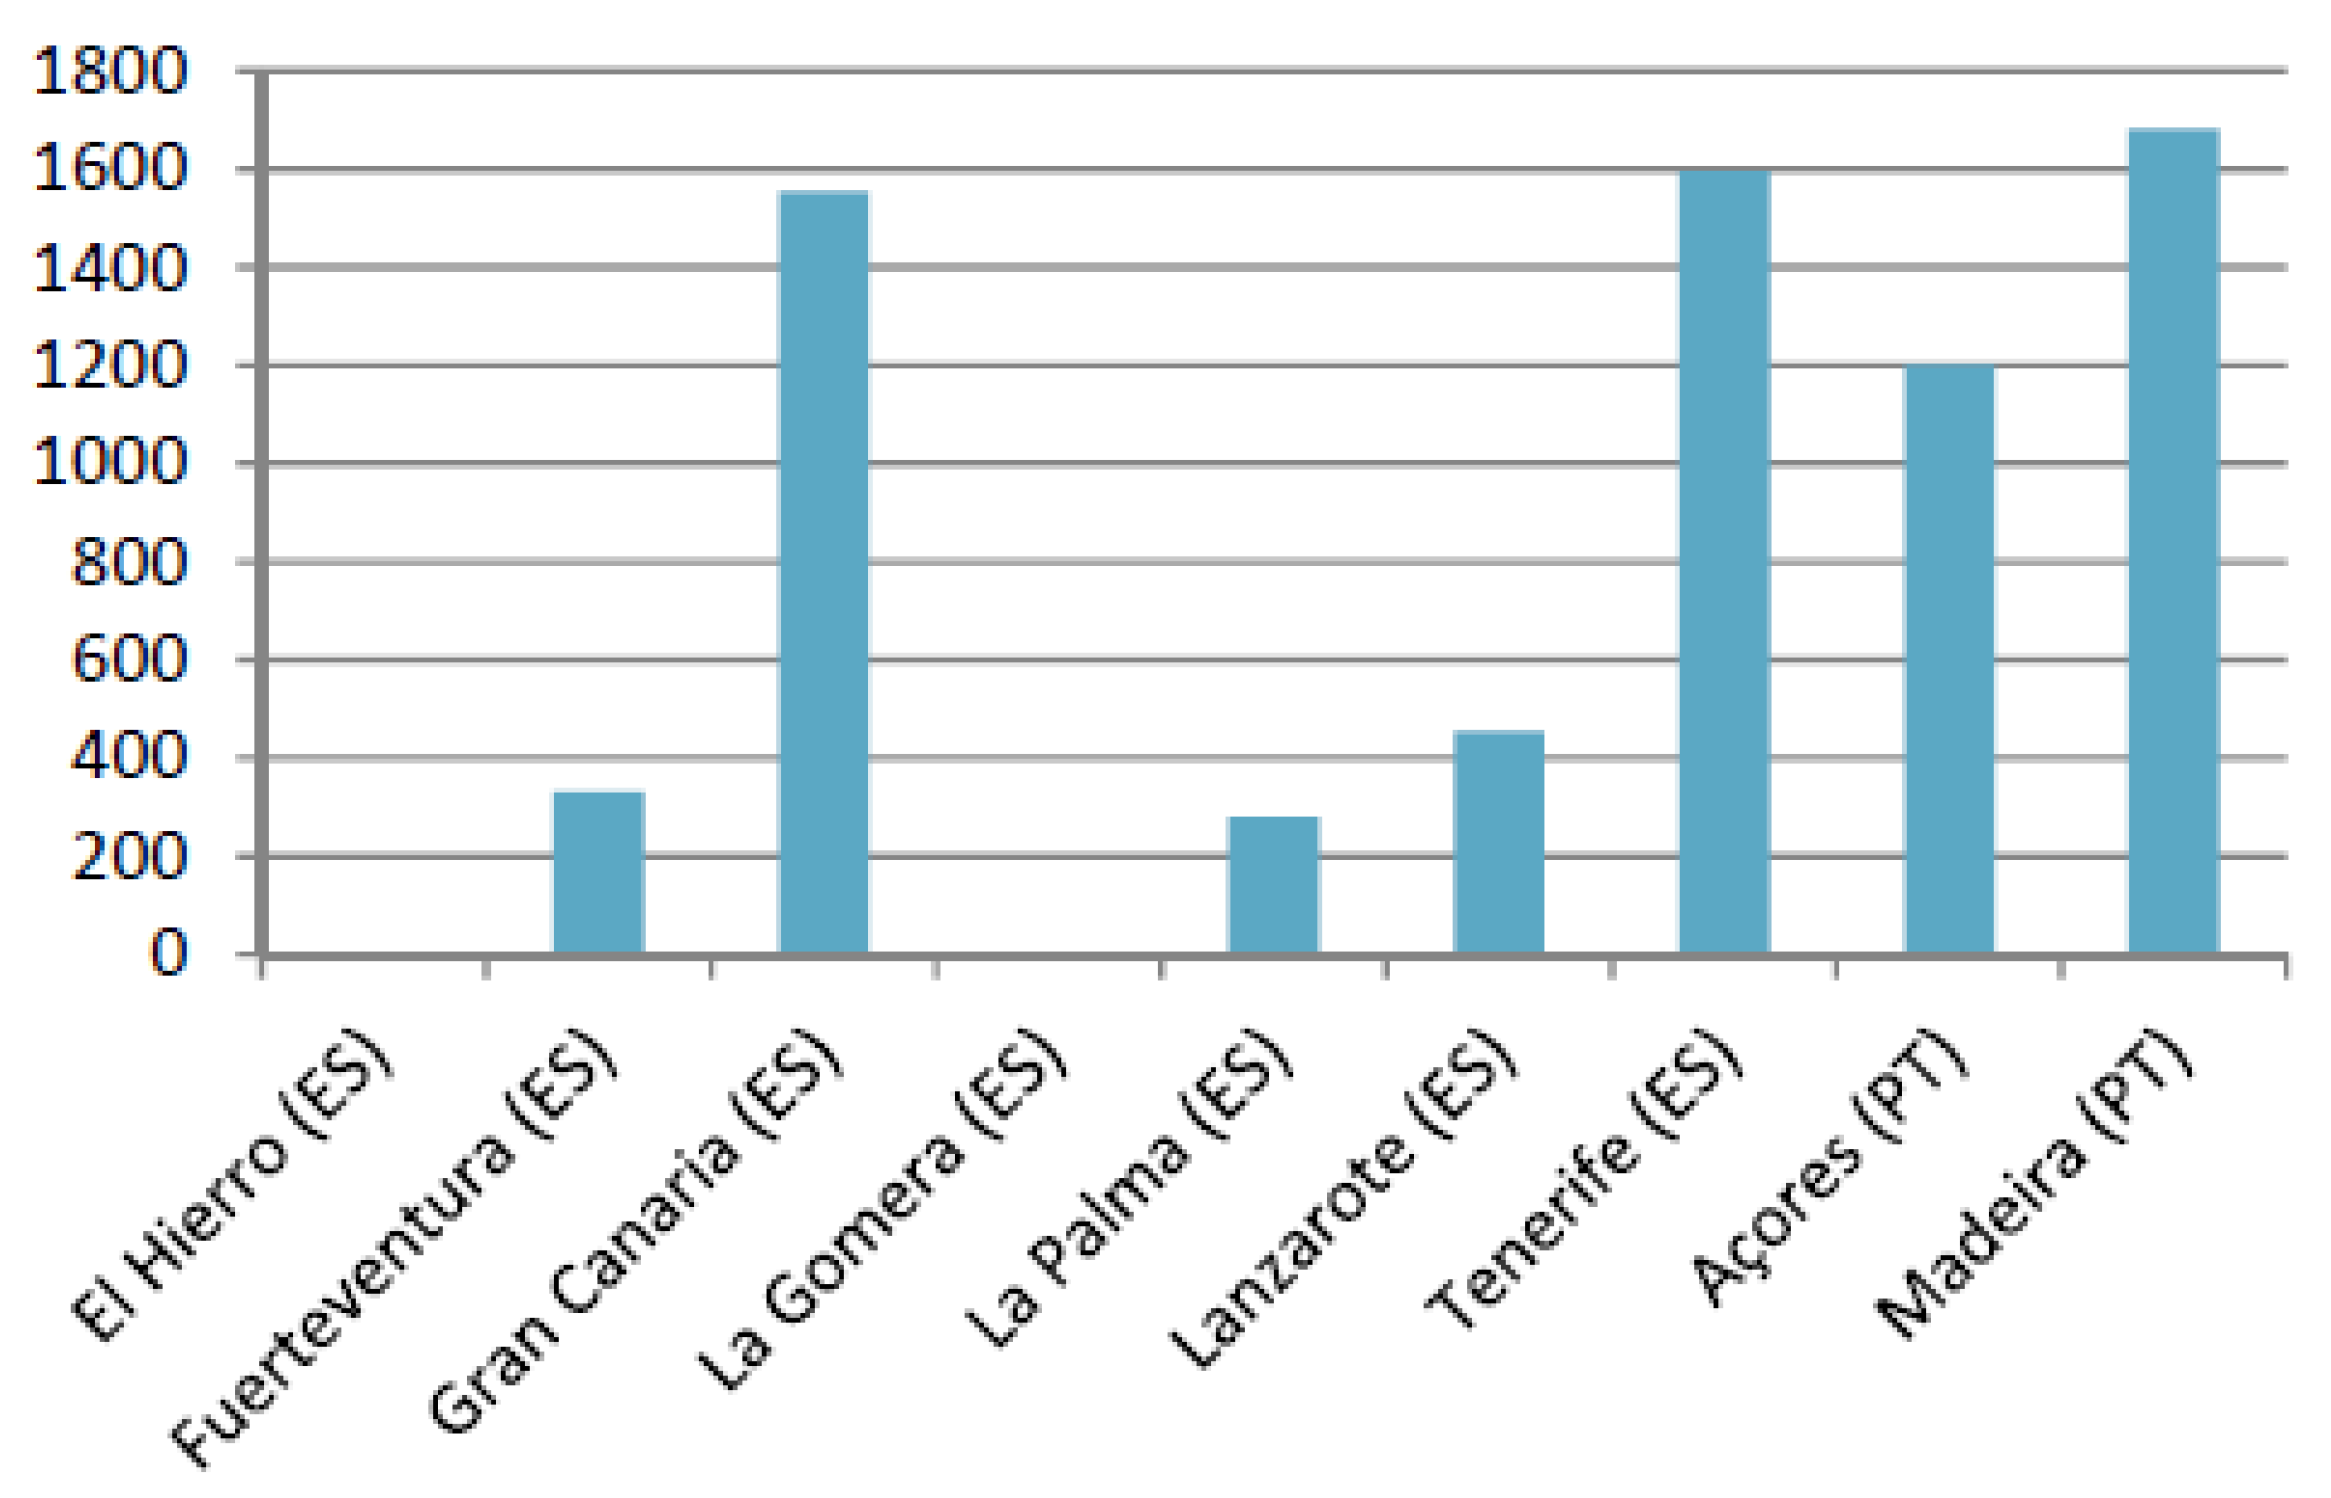
Figure 4.
Number of airlines connections from Spanish and Portuguese ORS—adapted from EU— European Parliament [44].
Figure 4.
Number of airlines connections from Spanish and Portuguese ORS—adapted from EU— European Parliament [44].


Table 1.
Indicators of accessibility and logistical infrastructure of insular territories and related references.
Table 1.
Indicators of accessibility and logistical infrastructure of insular territories and related references.
| Indicator | Reference |
|---|---|
| Mobility per capita | Mobility transformation in insular territories [14] |
| Transport mode choice | Hierarchies in transport infrastructures [15] Competitive transportation modes [16] Routing issues for freight transport [17] Strategic transport infrastructure comparison [18] |
| Congestion cost per capita | Traffic congestion and insularity [19] Congestion effects in insular regions [20] |
| Average travel time | Insularity, travel time and behavior analysis [11] Passenger mobility time and infrastructure [18] |
| Reliability in commuting | Insularity, transport policy and transparency [21] |
| Provision of transport and accessibility | Level of accessibility at regional scale [11] Stakeholder accessibility to island transport service [8] Transport infrastructure accessibility in peripheral regions [21] Daily accessibility impact of high-speed transport [22] |
| Speed of freight transport | Infrastructure accessibility and travel time [22] |
| Movement patterns | Mobility distribution and Insularity [23] Regional transport and infrastructure planning of daily trip [20] |
| Area of the island | Performance indicators for infrastructure analysis [24] |
| Population density | Density indicators and analysis in insular area [25] |
| Economic impact | Economic challenges of infrastructure and insularity [26] |
| Social impact | Social challenges of infrastructure and insularity [27] Social sustainability design for insular territories [28] |
Table 2.
Outcomes regarding the demographic dynamics and urban agglomerations classified according to the accessibility levels in the Island of Fuerteventura (Source: authors).
Table 2.
Outcomes regarding the demographic dynamics and urban agglomerations classified according to the accessibility levels in the Island of Fuerteventura (Source: authors).
| Fuerteventura | Very Low | Low | Medium | High | Very High |
|---|---|---|---|---|---|
| Number of towns | 9 | 22 | 31 | 68 | 13 |
| Number of settlements (%) | 6.29% | 15.38% | 21.68% | 47.55% | 9.09% |
| Population % | 10.29% | 11.22% | 21.51% | 45.09% | 11.90% |
The highest values found are in bold.
Table 3.
Outcomes regarding the accessibility levels in the Island of Tenerife (Source: authors).
| Tenerife | Very Low | Low | Medium | High | Very High |
|---|---|---|---|---|---|
| Number of towns | 88 | 347 | 121 | 3 | 47 |
| Number of settlements (%) | 14.52% | 57.26% | 19.97% | 0.50% | 7.76% |
| Population % | 18.32% | 73.12% | 0.47% | 0.47% | 7.62% |
The highest values found are in bold.
Table 4.
Outcomes regarding the demographic dynamics and urban agglomerations classified according to the accessibility levels in the Island of El Hierro (Source: authors).
Table 4.
Outcomes regarding the demographic dynamics and urban agglomerations classified according to the accessibility levels in the Island of El Hierro (Source: authors).
| El Hierro | Very Low | Low | Medium | High | Very High |
|---|---|---|---|---|---|
| Number of towns | 3 | 0 | 0 | 19 | 0 |
| Number of settlements (%) | 13.64% | 0.00% | 0.00% | 86.36% | 0.00% |
| Population % | 9.20% | 0.00% | 0.00% | 90.80% | 0.00% |
The highest values found are in bold.
Table 5.
Outcomes regarding the demographic dynamics and urban agglomerations classified according to the accessibility levels in the Island of Gran Canaria (Source: authors).
Table 5.
Outcomes regarding the demographic dynamics and urban agglomerations classified according to the accessibility levels in the Island of Gran Canaria (Source: authors).
| Gran Canaria | Very Low | Low | Medium | High | Very High |
|---|---|---|---|---|---|
| Number of towns | 82 | 180 | 485 | 2 | 68 |
| Number of settlements (%) | 10.04% | 22.03% | 59.36% | 0.24% | 8.32% |
| Population % | 3.80% | 14.37% | 79.48% | 0.04% | 2.33% |
The highest values found are in bold.
Table 6.
Outcomes regarding the demographic dynamics and urban agglomerations classified according to the accessibility levels in the Island of La Gomera (Source: authors).
Table 6.
Outcomes regarding the demographic dynamics and urban agglomerations classified according to the accessibility levels in the Island of La Gomera (Source: authors).
| LA Gomera | Very Low | Low | Medium | High | Very High |
|---|---|---|---|---|---|
| Number of towns | 2 | 0 | 0 | 22 | 93 |
| Number of settlements (%) | 1.71% | 0.00% | 0.00% | 18.80% | 79.49% |
| Population % | 1.26% | 0.00% | 0.00% | 51.43% | 47.31% |
The highest values found are in bold.
Table 7.
Outcomes regarding the demographic dynamics and urban agglomerations classified according to the accessibility levels in the Island of La Palma (Source: authors).
Table 7.
Outcomes regarding the demographic dynamics and urban agglomerations classified according to the accessibility levels in the Island of La Palma (Source: authors).
| LA Palma | Very Low | Low | Medium | High | Very High |
|---|---|---|---|---|---|
| Number of towns | 5 | 20 | 0 | 71 | 141 |
| Number of settlements (%) | 2.11% | 8.44% | 0.00% | 29.96% | 59.49% |
| Population % | 0.62% | 3.72% | 0.00% | 16.02% | 79.64% |
The highest values found are in bold.
Table 8.
Outcomes regarding the demographic dynamics and urban agglomerations classified according to the accessibility levels in the Island of Lanzarote (Source: authors).
Table 8.
Outcomes regarding the demographic dynamics and urban agglomerations classified according to the accessibility levels in the Island of Lanzarote (Source: authors).
| Lanzaraote | Very Low | Low | Medium | High | Very High |
|---|---|---|---|---|---|
| Number of towns | 15 | 17 | 53 | 0 | 6 |
| Number of settlements (%) | 16.48% | 18.68% | 58.24% | 0.00% | 6.59% |
| Population % | 10.18% | 5.49% | 83.23% | 0.00% | 1.10% |
The highest values found are in bold.
Table 9.
Major geographical limitations of insular regions—adapted from EU—European Parliament [43,44].
| Regions | Remoteness | Insularity | Double Insularity | Small Territory | Complex Territorial Morphology | Specific Climatic Conditions | Natural Risk |
|---|---|---|---|---|---|---|---|
| Azores | ● | ● | ● | ● | ● | ● | ● |
| Canary Islands | ● | ● | ● | ● | ● | ● | ● |
| French Guiana | ● | ● | ● | ● | ● | ||
| Guadeloupe | ● | ● | ● | ● | ● | ● | ● |
| La Réunion | ● | ● | ● | ● | ● | ● | |
| Madeira | ● | ● | ● | ● | ● | ● | ● |
| Martinique | ● | ● | ● | ● | ● | ● |
© 2020 by the authors. Licensee MDPI, Basel, Switzerland. This article is an open access article distributed under the terms and conditions of the Creative Commons Attribution (CC BY) license (http://creativecommons.org/licenses/by/4.0/).
Share and Cite
MDPI and ACS Style
Castanho, R.A.; Behradfar, A.; Vulevic, A.; Naranjo Gómez, J.M. Analyzing Transportation Sustainability in the Canary Islands Archipelago. Infrastructures 2020, 5, 58. https://0-doi-org.brum.beds.ac.uk/10.3390/infrastructures5070058
AMA Style
Castanho RA, Behradfar A, Vulevic A, Naranjo Gómez JM. Analyzing Transportation Sustainability in the Canary Islands Archipelago. Infrastructures. 2020; 5(7):58. https://0-doi-org.brum.beds.ac.uk/10.3390/infrastructures5070058
Chicago/Turabian StyleCastanho, Rui Alexandre, Arian Behradfar, Ana Vulevic, and José Manuel Naranjo Gómez. 2020. "Analyzing Transportation Sustainability in the Canary Islands Archipelago" Infrastructures 5, no. 7: 58. https://0-doi-org.brum.beds.ac.uk/10.3390/infrastructures5070058