Ground Loss and Static Soil–Structure Interaction during Urban Tunnel Excavation: Evidence from the Excavation of the Athens Metro


Abstract
:1. Introduction
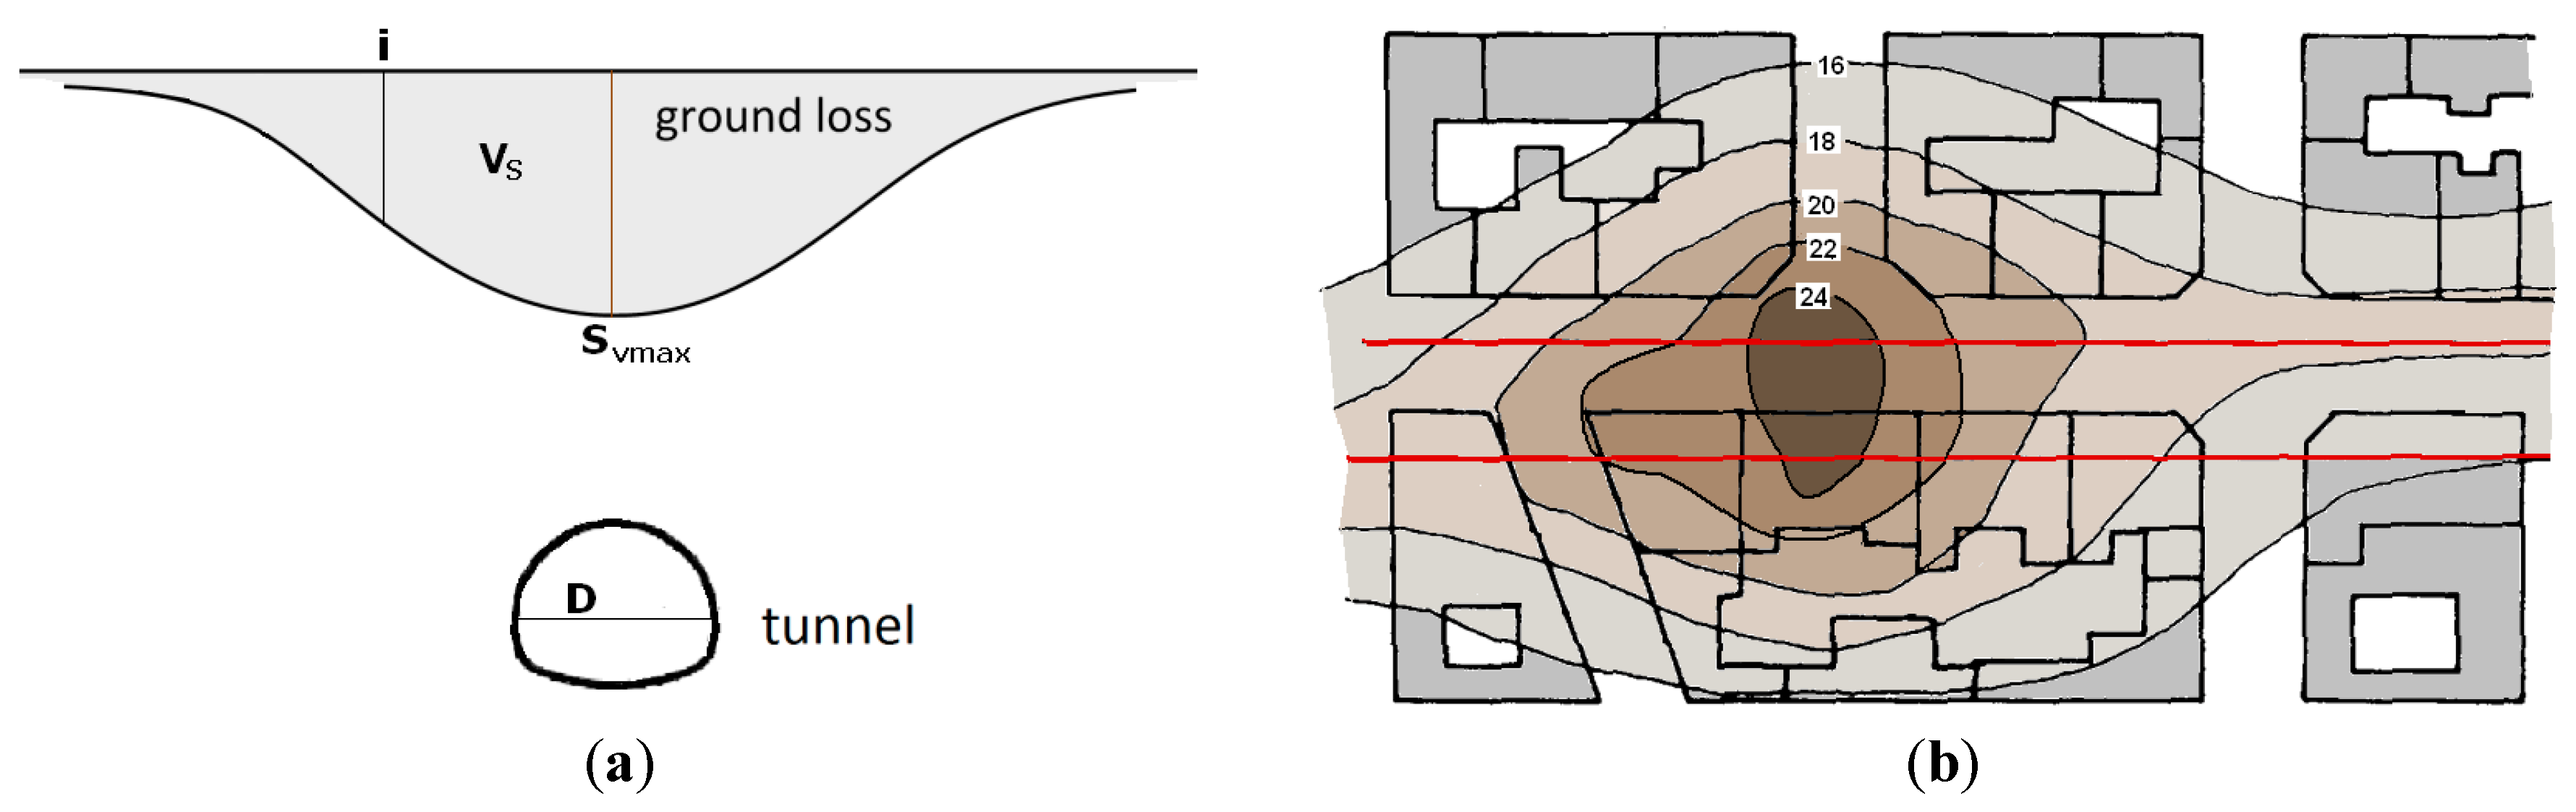
2. Theoretical Modeling of Ground Loss
3. Static Soil Structure Interaction (sSSI)
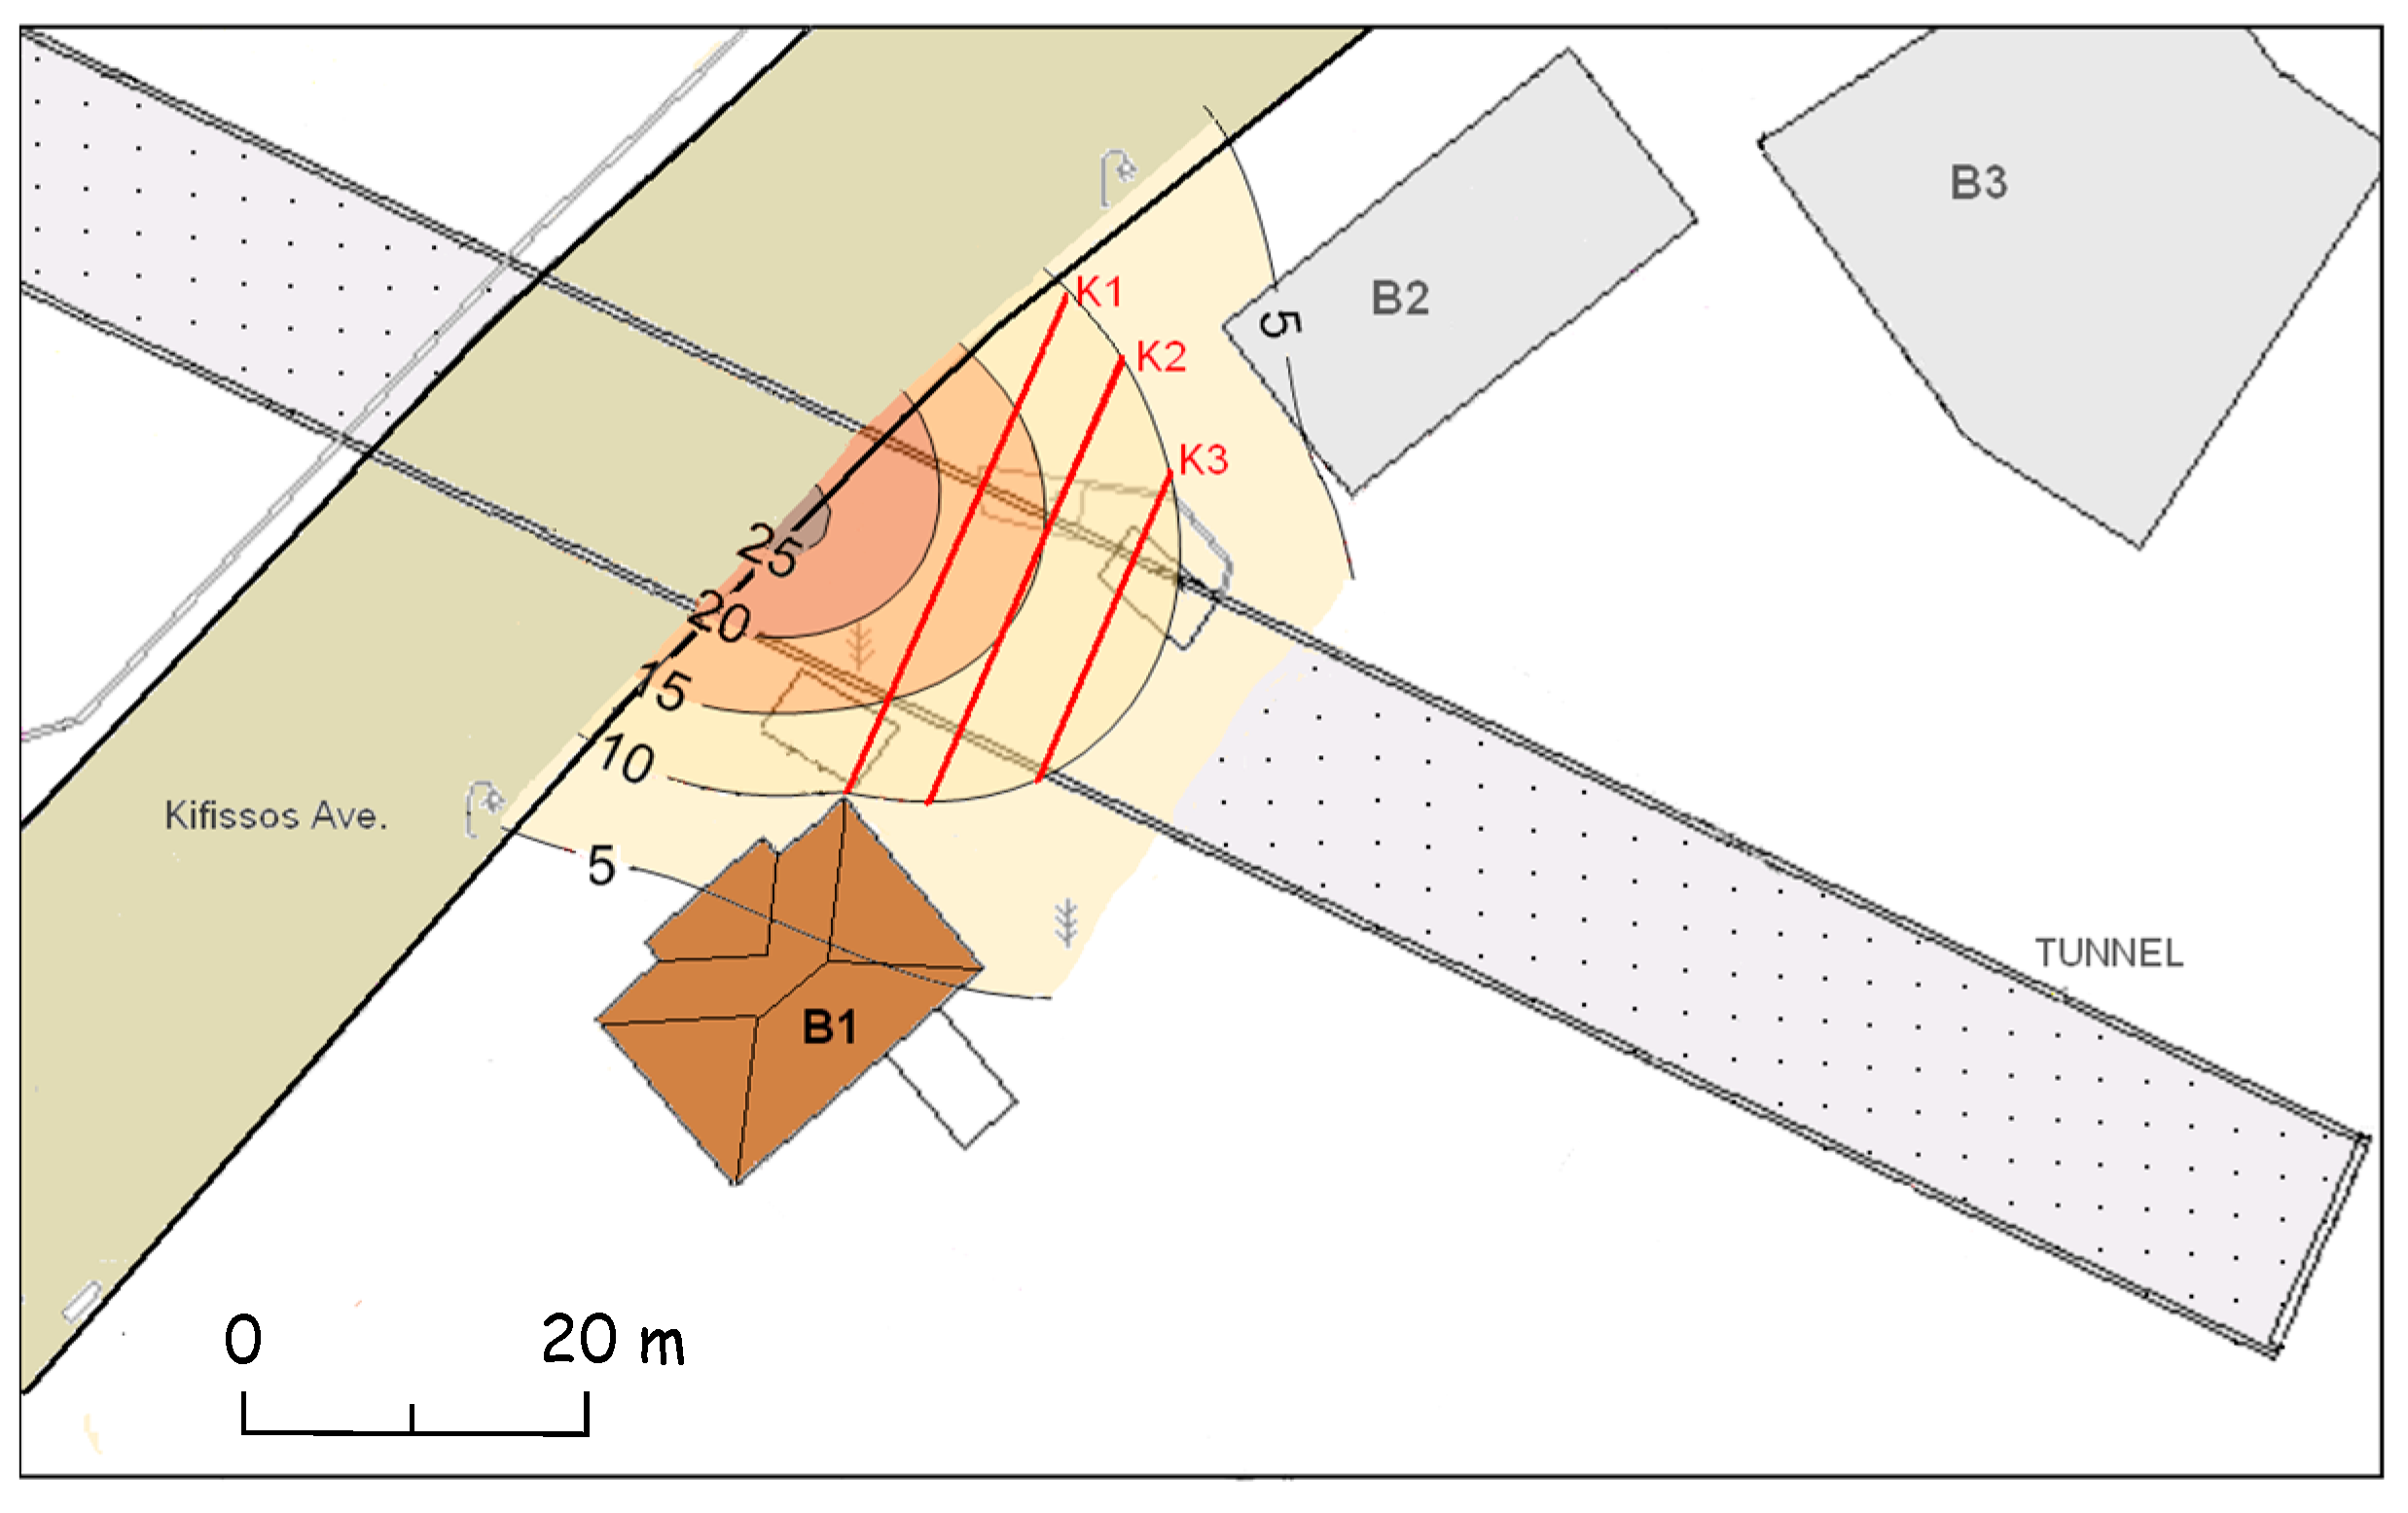
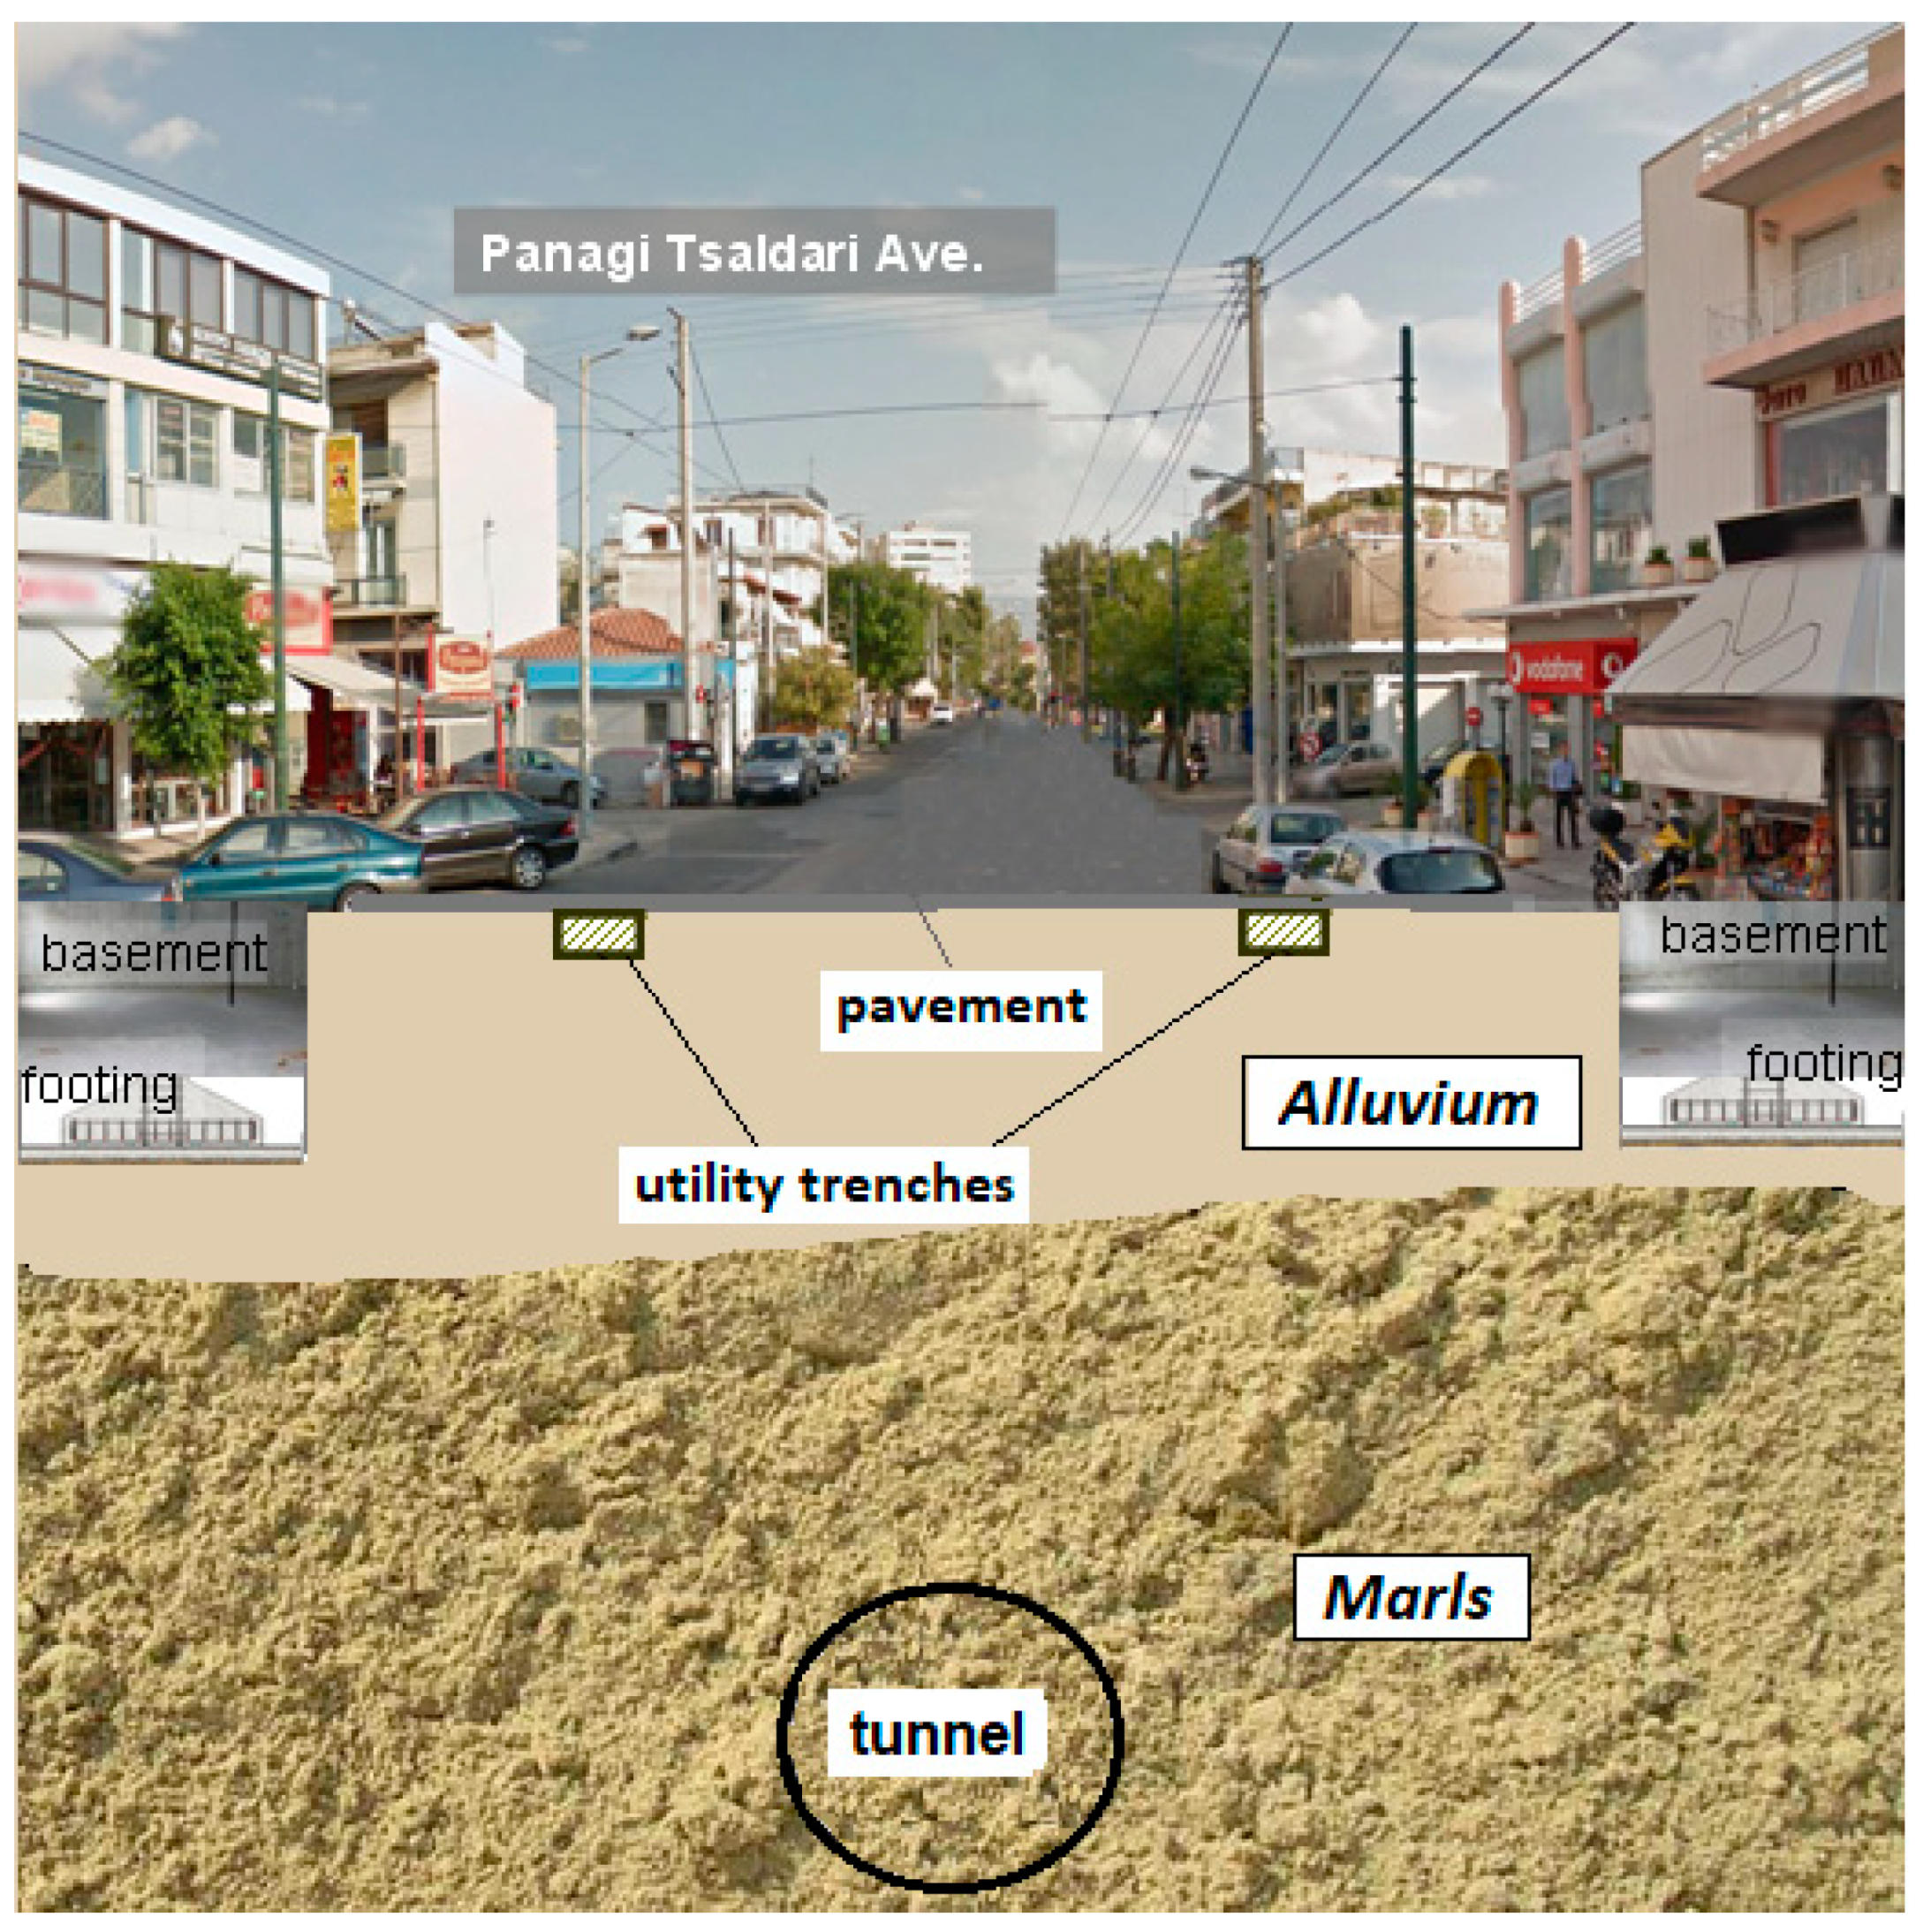
4. Evidence from the Athens Metro Line 2
5. Discussion
5.1. Amount and Timing of Recorded Ground Deformation
5.2. Uncertainties in Observations
5.3. Implications for Modeling of the Subsidence Curve and Unexpected Failures
5.4. Pattern of Ground Subsidence
6. Conclusions
Author Contributions
Funding
Acknowledgments
Conflicts of Interest
References
- Peck, R.B. Advantages and limitations of the observational method in applied soil mechanics. Geotechnique 1969, 19, 171–187. [Google Scholar] [CrossRef] [Green Version]
- Kontogianni, V.; Psimoulis, P.; Pytharouli, S.; Stiros, S. Geodetic monitoring of underground excavations: 70 years after Terzaghi’s innovative techniques at the Chicago subway tunnels. In Proceedings of the 5th International Symposium of the International Society for Soil Mechanics and Geotechnical Engineering, Amsterdam, The Netherlands, 15–17 June 2005; pp. 31–36. [Google Scholar]
- Burland, J.B.; Standing, J.R.; Jardine, F.M. Building Responses to Tunneling—Case studies from Construction of the Jubilee Line Extension; Thomas Telford: London, UK, 2001; Volume 1. [Google Scholar]
- Ritter, S.; Giardina, G.; DeJong, M.J.; Mair, J. Influence of building characteristics on tunnelling-induced ground movements. Géotechnique 2017, 67, 926–937. [Google Scholar] [CrossRef] [Green Version]
- Giardina, G.; DeJong, M.J.; Mair, R.J. Interaction between surface structures and tunnelling in sand: Centrifuge and computational modelling. Tunn. Undergr. Space Technol. 2015, 50, 465–478. [Google Scholar] [CrossRef] [Green Version]
- Harris, D.I. Building Response to Tunnelling—The Clock Tower and The Palace of Westminster; Thomas Telford: London, UK, 2002; Chapter 28. [Google Scholar]
- Kavvadas, M. Monitoring ground deformation in tunnelling: Current practice in transportation tunnels. Eng. Geol. 2005, 79, 93–113. [Google Scholar] [CrossRef]
- Finno, R.; Bryson, L. Response of building adjacent to stiff excavation support system in soft clay. J. Perform. Constr. Facil. 2002, 16, 10–20. [Google Scholar] [CrossRef]
- Kaalberg, F.J. Advanced Modeling to Support Innovative Developments in Tunneling for Amsterdam North/South Line. In Finite Elements in Civil Engineering Applications, Proceedings of the Third DIANA World Conference on Finite Elements in Civil Engineering Tokyo, 9–11 October 2002; A.A. Balkema Publisher: Tokyo, Japan, 2002. [Google Scholar]
- Finno, R.; Voss, F.; Rossow, E.; Blackburn, T.J. Evaluating Damage Potential in Buildings Affected by Excavations. J. Geotech. Geoenviron. Eng. 2005, 131, 1199–1210. [Google Scholar] [CrossRef]
- Finno, R.; Blackburn, J.T.; Roboski, J. Three-dimensional effects for supported excavations in clay. J. Geotech. Geoenviron. Eng. 2007, 133, 30–36. [Google Scholar] [CrossRef] [Green Version]
- Son, M.; Cording, E. Responses of buildings with different structural types to excavation-induced ground settlements. J. Geotech. Geoenviron. Eng. 2011, 137, 323–333. [Google Scholar] [CrossRef]
- Namazi, E.; Mohamad, H. Assessment of building damage induced by three-dimensional ground movements. J. Geotech. Geoenviron. Eng. 2013, 139, 608–618. [Google Scholar] [CrossRef]
- Farrell, R.; Mair, R.; Sciotti, A.; Pigorini, A. Building response to tunnelling. Soils Found. 2014, 54, 269–279. [Google Scholar] [CrossRef] [Green Version]
- Bjureland, W.; Spross, J.; Johansson, F.; Prästings, A.; Larsson, S. Reliability aspects of rock tunnel design with the observational method. Int. J. Rock Mech. Min. Sci. 2017, 98, 102–110. [Google Scholar] [CrossRef]
- Van Hasselt, D.R.S.; Hentschel, V.; Hutteman, M. Amsterdam’s north/south metroline. Tunn. Undergr. Space Technol. 1999, 14, 191–210. [Google Scholar] [CrossRef]
- Papastamos, G.; Stiros, S.; Saltogianni, V.; Kontogianni, V. 3-D strong tilting observed in tall, isolated brick chimneys during the excavation of the Athens metro. Appl. Geomat. 2015, 7, 115. [Google Scholar] [CrossRef]
- Science Alert. This Gigantic Sinkhole in Ottawa Just Took Out a 4-Lane Road. 2016. Available online: www.sciencealert.com/gigantic-sinkhole-in-canada-s-capital-ottawa-may-have-been-caused-by-quick-clay (accessed on 30 July 2020).
- Kathimerini Newspaper. 2003. Available online: www.kathimerini.gr/139341/article/epikairothta/ellada/h-trypa-sto-metro-ek8eteiergolavoys-kai-mhxanikoys (accessed on 30 July 2020). (In Greek).
- Kontogianni, V.; Pytharouli, S.; Stiros, S. Ground subsidence, quaternary faults and vulnerability of utilities and transportation networks in Thessaly, Greece. Environ. Geol. 2007, 52, 1085–1095. [Google Scholar] [CrossRef]
- Mair, R.J.; Taylor, R.N.; Burland, J.B. Prediction of Ground Movements and Assessment of Risk of Building Damage Due to Bored Tunneling. In Proceedings of the International Symposium on Geotechnical Aspects of Underground Construction in Soft Ground, London, UK, 15–17 April 1996; pp. 713–718. [Google Scholar]
- Maravas, A.; Mylonakis, G.; Karabalis, D. Dynamic Soil-Structure Interaction for SDOF Structures on Footings and Piles. In Proceedings of the Geotechnical Earthquake Engineering and Soil Dynamics IVGSP181, Sacramento, CA, USA, 18–22 May 2008. [Google Scholar] [CrossRef]
- Szechy, K. The Art of Tunneling; Hungarian Academy of Sciences: Budapest, Hungary, 1973. [Google Scholar]
- Franzius, J.N.; Potts, D.M.; Burland, J.B. The response of surface structures to tunnel construction. Proc. Inst. Civ. Eng. Geotech. Eng. 2006, 159, 3–17. [Google Scholar] [CrossRef]
- Pickhaver, J.A.; Burd, H.J.; Houlsby, G.T. An equivalent beam method to model masonry buildings in 3D finite element analysis. Comput. Struct. 2010, 88, 1049–1063. [Google Scholar] [CrossRef]
- Goh, K.H.; Mair, R.J. Response of framed buildings to excavation-induced movements. Soils Found. 2014, 54, 250–268. [Google Scholar] [CrossRef] [Green Version]
- Franza, A.; Marshall, A.; Haji, T.; Abdelatif, A.O.; Carbonari, S.; Morici, M. A simplified elastic analysis of tunnel-piled structure interaction. Tunn. Undergr. Space Technol. 2017, 61, 104–121. [Google Scholar] [CrossRef]
- Burd, H.J.; Houlsby, G.T.; Augarde, C.E.; Liu, G. Modelling tunnelling-induced settlements of masonry buildings. Proc. Inst. Civ. Eng. Geotech. Eng. 2000, 143, 17–29. [Google Scholar] [CrossRef] [Green Version]
- Bilotta, E.; Paolillo, A.; Russo, G.; Aversa, S. Displacements induced by tunnelling under a historical building. Tunn. Undergr. Space Technol. 2017, 61, 221–232. [Google Scholar] [CrossRef]
- Marinos, P.; Marinos, V.; Stoumpos, G.; Novak, M.; Korkaris, K.; Benissi, M. Behaviour of the “Athenian schist” in excavation by an open face shield boring machine extension line to peristeri of the metropolitan railway of Athens. Bull. Geol. Soc. Greece 2004, 36, 1790–1795. [Google Scholar] [CrossRef] [Green Version]
- Kynigalaki, M.; Nikolaou, N.; Karfakis, J.; Koutsouveli, A.; Poyiadji, E.; Pyrgiotis, L.; Konstantopoulou, G.; Bellas, M.; Apostolidis, E.; Loupasakis, K.; et al. Digital engineering geological map of the Athens Prefecture area and related Database Management System. Bull. Geol. Soc. Greece 2010, 43, 1619–1626. [Google Scholar] [CrossRef] [Green Version]
- Kontogianni, V.; Psimoulis, P.; Stiros, S. What is the contribution of time-dependent deformation in tunnel convergence. Eng. Geol. 2006, 82, 264–267. [Google Scholar] [CrossRef]
- Sulem, J.; Panet, M.; Guenot, A. Closure analysis in deep tunnels. Int. J. Rock Mech. Min. Sci. Geomech. Abstr. 1987, 24, 145–154. [Google Scholar] [CrossRef]


| Width of Half Part of Subsidence Trough | SNR (Signal to Noise Ratio) | |
|---|---|---|
| Free field zone | Precisely estimated. (but underestimated if subsidence amplitude is small). | Depending on subsidence amplitude. (SNR proportional to subsidence amplitude). |
| Isolated tower | Precisely estimated. | High. |
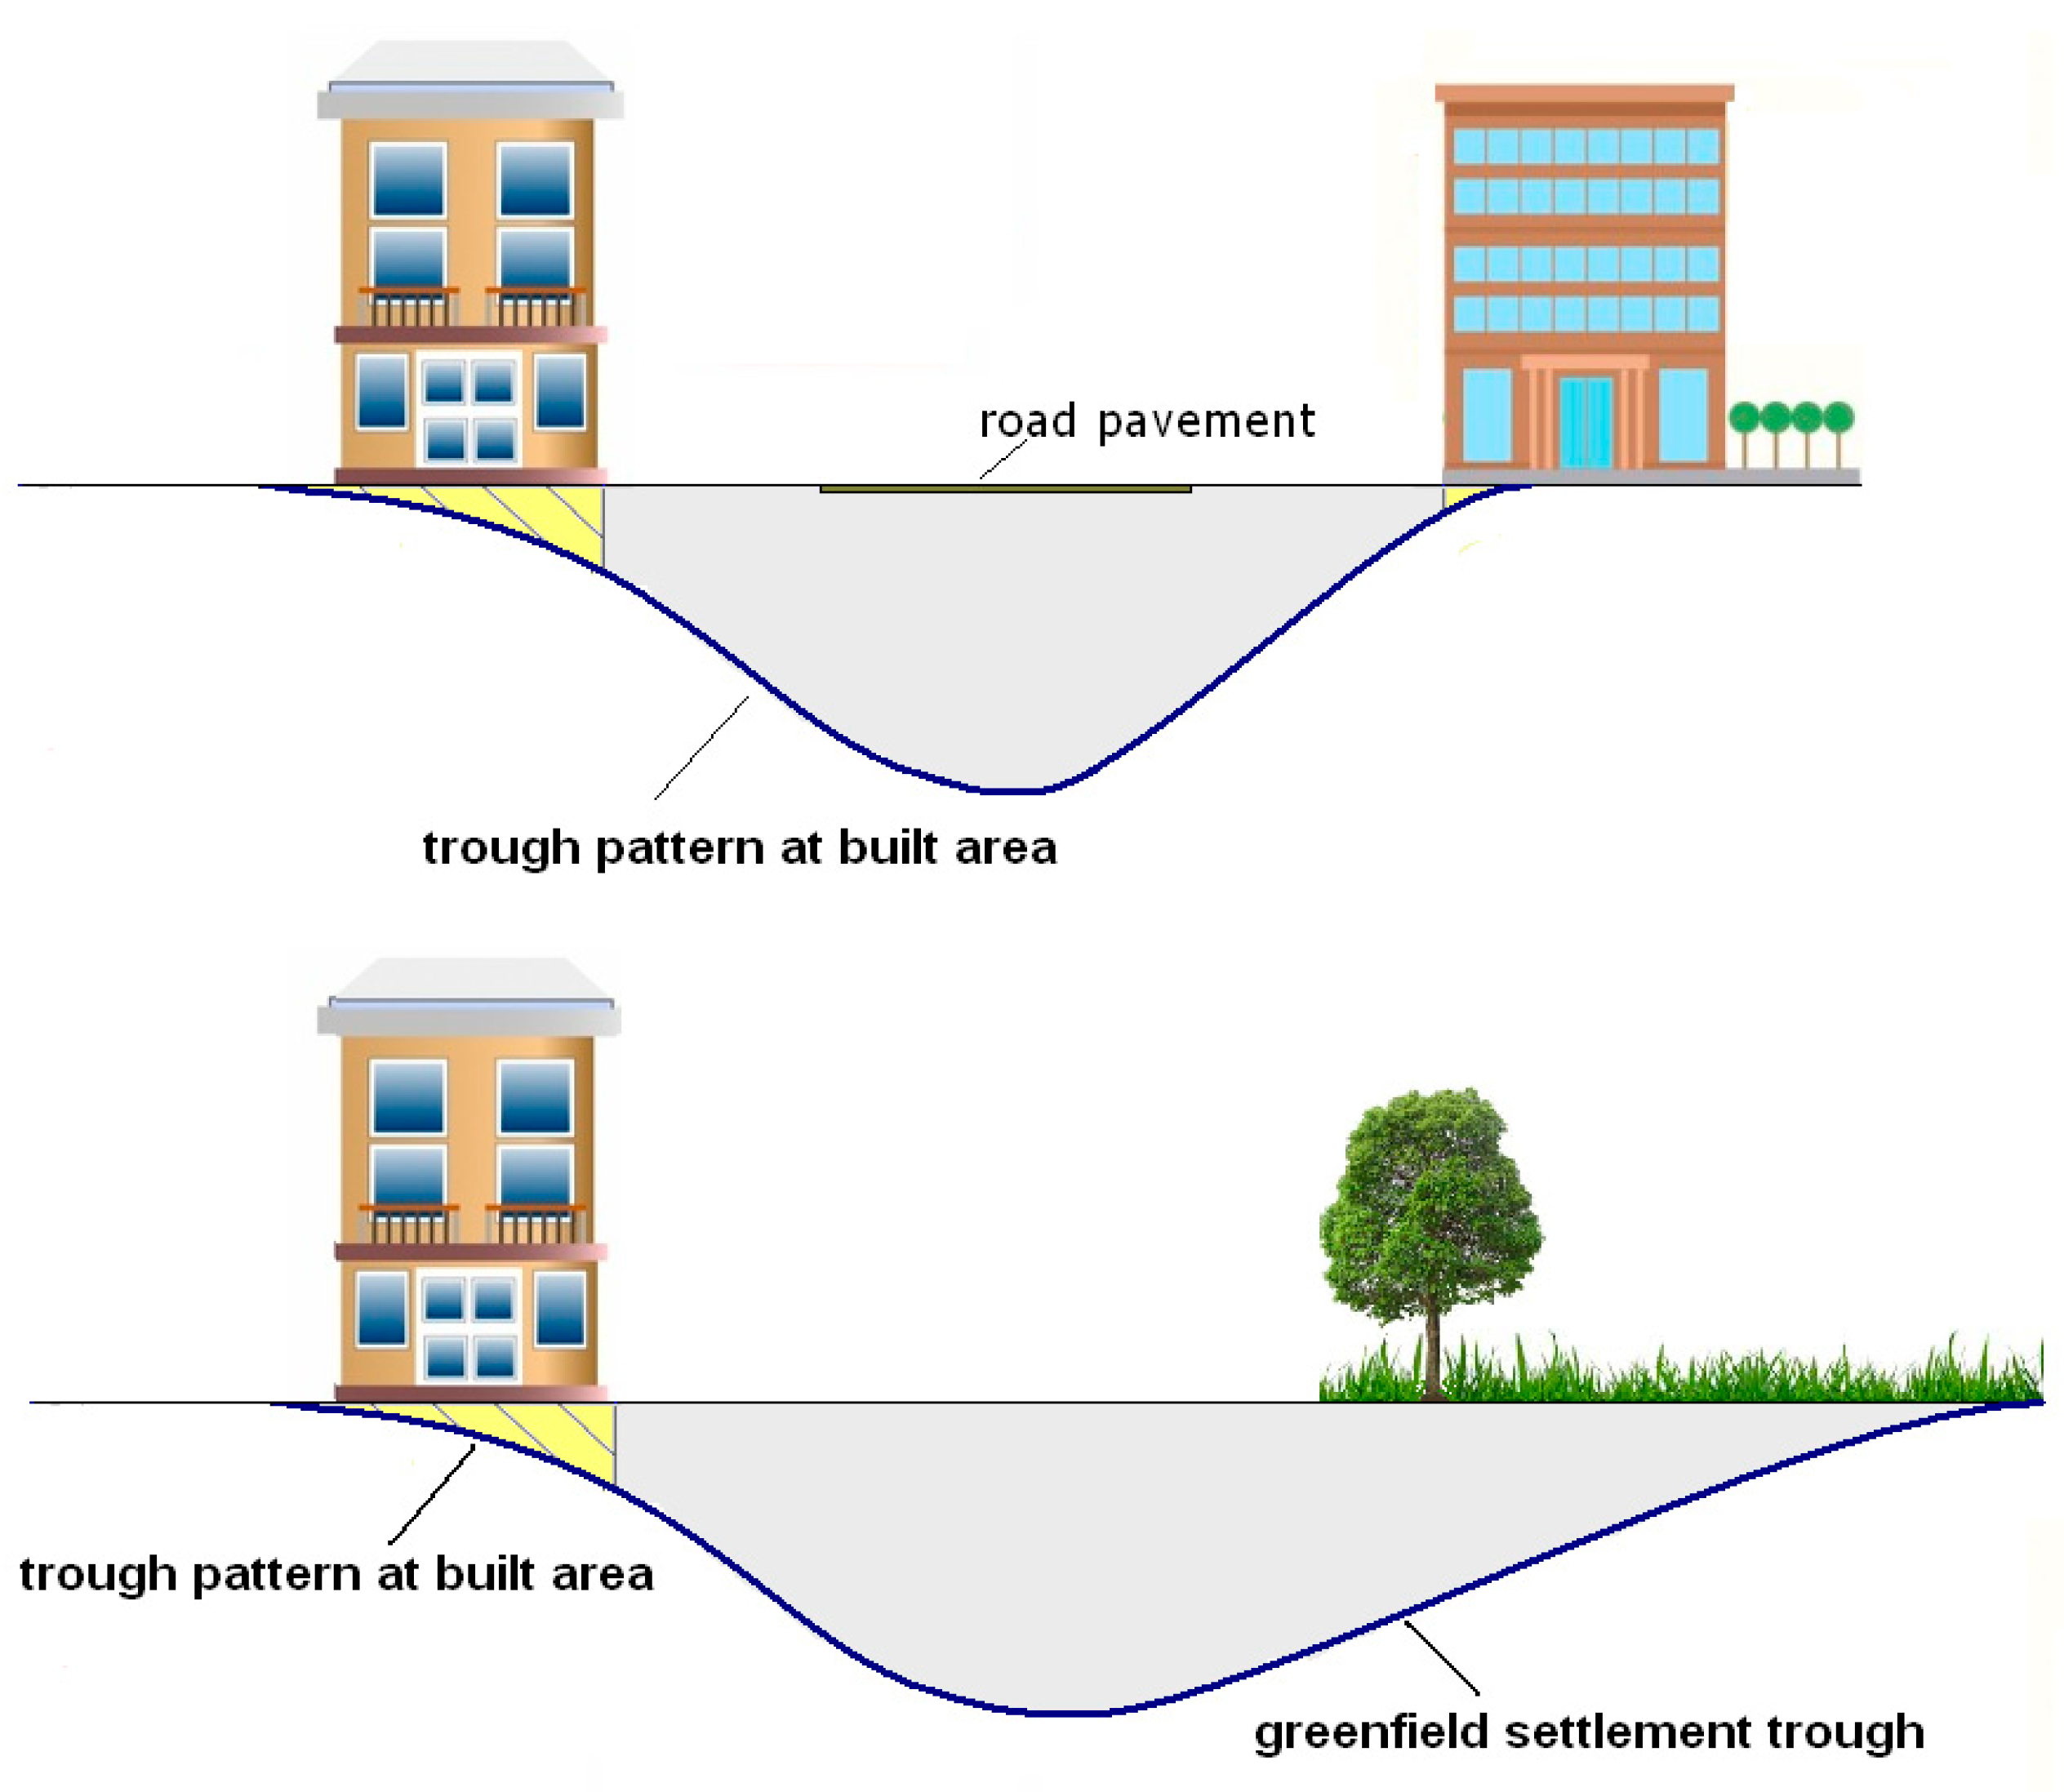
| Bulky building | Underestimated subsidence. Strains partly accommodated by building stiffness. | Small. |
| Section | Type of Section | Svmax (mm) | Distance to Building at Left Side (m) dl | Distance to Building at Right Side (m) dr | Trough Width at Left Side (m) ℓl | Trough Width at Right Side (m) ℓr | Environs Asymmetry Ratio E | Trough Skewness Ratio S |
|---|---|---|---|---|---|---|---|---|
| PT1 | B-B | 24 | 14 | 14 | 13 | 9 | 1 | 0.69 |
| PT2 | B-B | 11 | 14 | 14 | 6 | 7 | 1 | 0.86 |
| PT3 | B-B | 220 | 6 | 14 | 8 | 10 | 0.57 | 0.8 |
| PT4 | G-B | 58 | 14 | 25 | 7 | 14 | 1.78 | 2 |
| PT5 | G-G | 78 | 25 | 25 | 26 | 28 | 1 | 0.93 |
| PT6 | G-B | 20 | 25 | 14 | 23 | 15 | 1.78 | 1.53 |
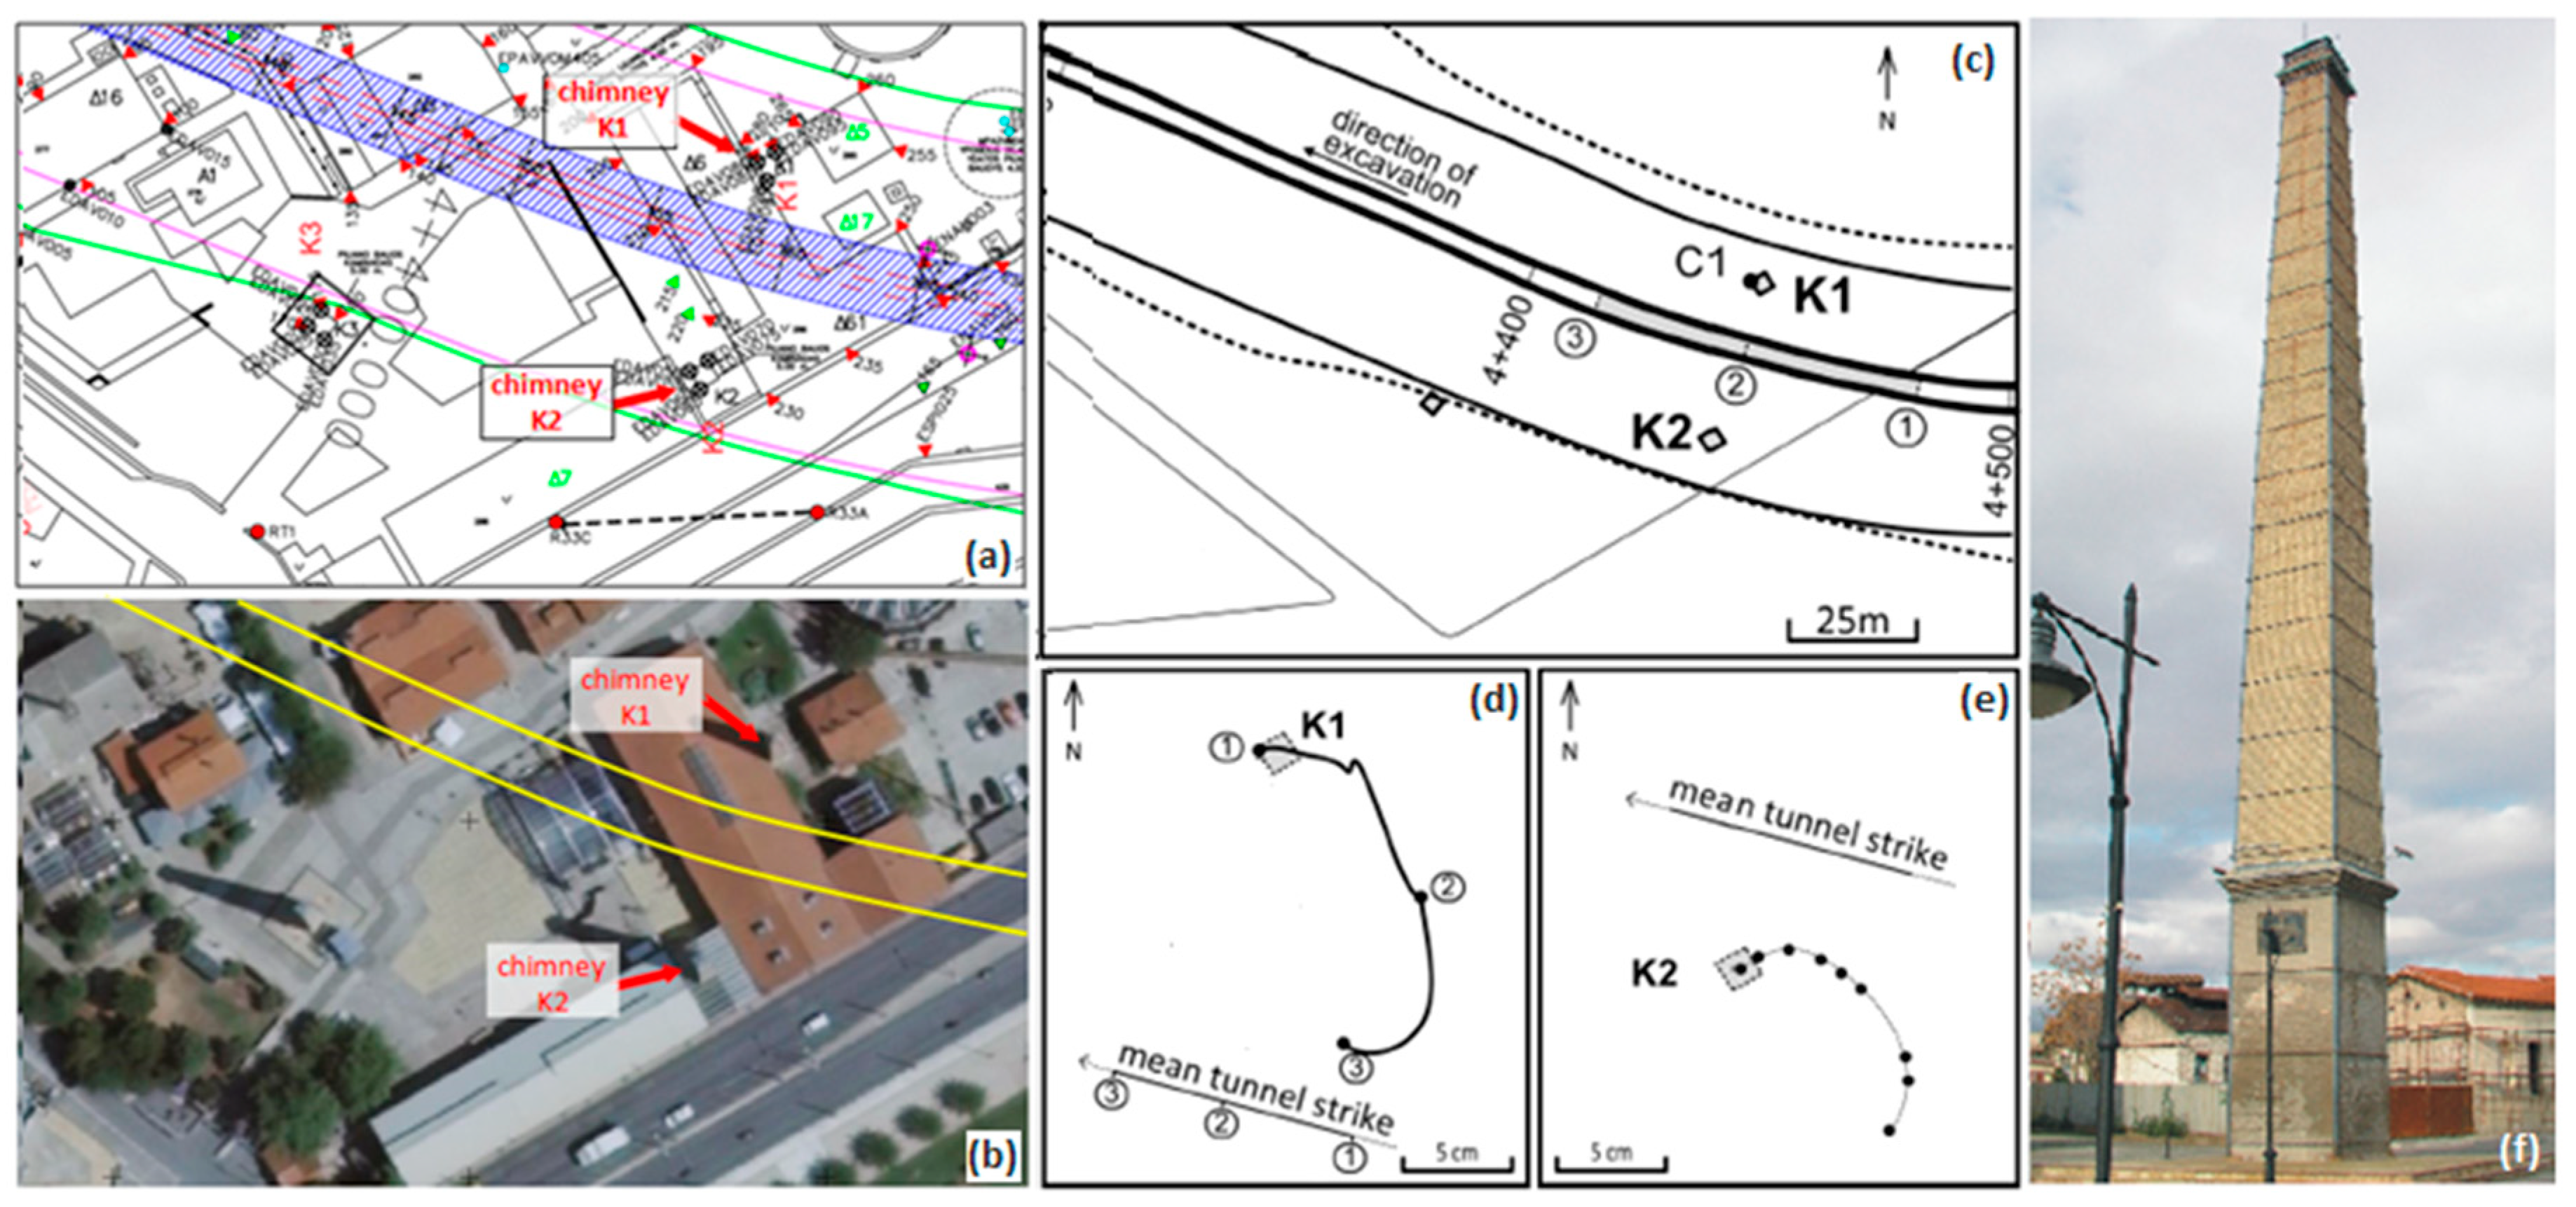
| K1 | G-B | 18 | 25 | 8 | 13 | 8 | 3.12 | 1.62 |
| K2 | G-B | 15 | 25 | 10 | 12 | 7 | 2.5 | 1.71 |
| K3 | B-B | 12 | 15 | 12 | 8 | 5 | 0.8 | 0.62 |
© 2020 by the authors. Licensee MDPI, Basel, Switzerland. This article is an open access article distributed under the terms and conditions of the Creative Commons Attribution (CC BY) license (http://creativecommons.org/licenses/by/4.0/).
Share and Cite
Kontogianni, V.; Stiros, S.C. Ground Loss and Static Soil–Structure Interaction during Urban Tunnel Excavation: Evidence from the Excavation of the Athens Metro. Infrastructures 2020, 5, 64. https://0-doi-org.brum.beds.ac.uk/10.3390/infrastructures5080064
Kontogianni V, Stiros SC. Ground Loss and Static Soil–Structure Interaction during Urban Tunnel Excavation: Evidence from the Excavation of the Athens Metro. Infrastructures. 2020; 5(8):64. https://0-doi-org.brum.beds.ac.uk/10.3390/infrastructures5080064
Chicago/Turabian StyleKontogianni, Villy, and Stathis C. Stiros. 2020. "Ground Loss and Static Soil–Structure Interaction during Urban Tunnel Excavation: Evidence from the Excavation of the Athens Metro" Infrastructures 5, no. 8: 64. https://0-doi-org.brum.beds.ac.uk/10.3390/infrastructures5080064