Technical Note

Developing Pavement Marking Management Systems: A Theoretical Model Framework Based on the Experiences of the US Transportation Agencies

1
Center for Transportation Research and Education, Institute for Transportation, Iowa State University (ISU), Ames, IA 50010, USA
2
Center for Transportation Research and Education, Department of Civil, Construction, and Environmental Engineering, Institute for Transportation, Iowa State University, Ames, IA 50010, USA
3
Institute for Transportation, Iowa State University, Ames, IA 50010, USA
*
Author to whom correspondence should be addressed.
Submission received: 10 December 2020 / Revised: 14 January 2021 / Accepted: 20 January 2021 / Published: 24 January 2021
(This article belongs to the Section Infrastructures Inspection and Maintenance)

Abstract

:
Pavement markings are essential elements of transportation infrastructure with critical impacts on safety and mobility. They provide road users with the necessary information to adjust driving behavior or make calculated decisions about commuting. The visibility of pavement markings for drivers can be the boundary between a safe trip and a disastrous accident. Consequently, transportation agencies at the local or national levels allocate sizeable budgets to upkeep the pavement markings under their jurisdiction. Infrastructure asset management systems (IAMS) are often biased toward high-capital-cost assets such as pavements and bridges, not providing structured asset management (AM) plans for low-cost assets such as pavement markings. However, recent advances in transportation asset management (TAM) have promoted an integrated approach involving the pavement marking management system (PMMS). A PMMS brings all data items and processes under a comprehensive AM plan and enables managing pavement markings more efficiently. Pavement marking operations depend on location, conditions, and AM policies, highly diversifying the pavement marking management practices among agencies and making it difficult to create a holistic image of the system. Most of the available resources for pavement marking management focus on practices instead of strategies. Therefore, there is a lack of comprehensive guidelines and model frameworks for developing PMMS. This study utilizes the existing body of knowledge to build a guideline for developing and implementing PMMS. First, by adapting the core AM concepts to pavement marking management, a model framework for PMMS is created, and the building blocks and elements of the framework are introduced. Then, the caveats and practical points in PMMS implementation are discussed based on the US transportation agencies’ experiences and the relevant literature. This guideline is aspired to facilitate PMMS development for the agencies and pave the way for future pavement marking management tools and databases.

Graphical Abstract

1. Introduction

Pavement markings are vital components of transportation infrastructure, providing valuable, life-saving information to road users. The various forms of markings on road surfaces are critical safety assets with essential safety functions [1,2]. The information conveyed to the road users by pavement markings are crucial to most short-range and long-range driving decisions [2]. Transportation agencies in the United States spend millions of dollars every year to apply pavement markings and maintain them in good condition of service [3]. However, there is limited information about best managing practices for non-bridge, non-pavement transportation assets such as pavement markings. For a long time, this class of assets has been managed mostly relatively through traditional approaches [1].
Transportation asset management has predominantly focused on high-capital-cost assets, paying disproportionately lower attention to low-cost but typically high-quantity assets [4,5]. US transportation agencies at state and national levels have also prepared their specifications, plans, guidelines, and programs to incorporate pavement markings within the broad framework of infrastructure asset management (IAM). In recent years, many state transportation agencies have adopted systematic approaches in managing pavement markings by developing and implementing a pavement marking management system (PMMS) or incorporating pavement markings in their existing asset management systems (AMSs). US States that currently use dedicated PMMS include Iowa, Kansas, Minnesota, Ohio, Florida, and Colorado. Many other states such as Maryland, New Mexico, North Carolina, Texas, and Utah manage pavement markings under the agency’s holistic AMS [6,7,8].
PMMS is a comprehensive embodiment encompassing the data and processes required for the efficient management of all the operations related to pavement markings. It enables the transportation agencies to apply systematic asset management (AM) strategies to pavement markings and, in doing that, improve their current practices or adopt new measures [1,9]. Researchers and transportation agencies widely acknowledge the benefits of incorporating pavement markings in IAM systems. Nevertheless, there are limited studies in the existing literature on how to structure this under a PMMS. Developing and implementing a consistent PMMS is challenging due to the overwhelming variation in management practices, material properties, site characteristics, and performance models among the agencies [1]. As a result, there are relatively fewer AM tools and resources developed or deployed for pavement markings than for other transportation assets such as pavements and bridges [1].
To meet nationally enforced requirements, a PMMS refers to national standards and specifications. The manual on uniform traffic control devices [10] provides US national policies and standards for pavement markings. In addition, numerous reports published by the US Department of Transportation (US DOT) provide guidelines for various pavement-marking practices in light of the national standards. Notably, the roadway delineation practices handbook [11]—from the Federal Highway Administration (FHWA)—and the guideline for using raised pavement markers [12] describe materials, equipment, and methods involved in pavement marking application, maintenance, removal, and evaluation. Among the documents provided by American transportation agencies at the national level, Synthesis 37-01 of the National Academies of Science, Engineering, and Medicine (NCHRP) [6] provides the most asset-specific AM guideline for pavement markings. This synthesis surveys the asset management strategies adopted by selected regional transportation agencies in the USA and Canada for six selected asset groups: signals, signing, lighting, culverts, sidewalks, and pavement markings.
To manage pavement markings or—ideally—to establish a PMMS, agencies may take advantage of the existing guidelines of pavement marking management, such as NCHRP Synthesis 37-01 [6] and the PMMSs previously developed by other agencies. However, there is no one-size-fits-all solution applicable to every organization and region. State transportation agencies in the USA have conducted extensive research on pavement-marking application and operation and have released numerous documents that address specific issues related to pavement marking. As a result, the required information for developing PMMS is vastly scattered among a myriad of documents, specifications, reports, databases, and guidelines. However, most of the published materials do not in particular discuss PMMS, merely containing fragments of—sometimes different or contradicting—information about pavement-marking operations and management.
The Texas Department of Transportation (DOT) has issued several guidelines and specifications to regulate and standardize the design, installation, and operation of pavement markings throughout the state. Notable among them, presented in chronological order, are Pedestrian Crossing Guidelines for Texas [13], Pavement-Marking Handbook [14], and the Sign Guidelines and Applications Manual [15]. The Minnesota DOT developed its PMMS as early as 1999 [16] and has continued updating its pavement marking management practices through developing different pavement marking management tools (PMMTs) [17,18]. The Iowa DOT has implemented the Iowa Pavement Marking Management System (IPMMS) developed by Hawkins and Smadi et al. [3,19,20]. IPMMS encompasses data collection guidelines, marking application matrices, performance curves, data mapping and visualization tools, planning of operations, and local-agency pavement marking management guidelines. In another research study, Hawkins and Smadi [19] studied various aspects of pavement marking management at the local agency level focusing on maintenance methods. The Illinois DOT provided a guideline [9] for all-weather pavement markings that specified methods and practices for material selection and performance evaluation. The Wyoming DOT’s pavement marking manual [21] provides general standards for pavement markings and addresses pavement marking management by defining responsibilities at different levels of agency and describing methods for priority scheduling. Another notable example of pavement marking guidelines developed by the state agencies in the US is the Vermont transportation agency’s guideline for the installation of crosswalk markings and pedestrian signing [22].
The existing literature contains numerous guidelines and publications on pavement markings’ application and operation and their impacts on traffic safety and mobility. However, there are limited studies to help transportation agencies in developing PMMS. This paper aims to identify the core concepts and practices of AM that are instrumental to the management of pavement markings and provide guidelines for the development of PMMS. To this end, the existing literature, Iowa DOT’s pavement marking management database, and the authors’ previous research on developing PMMS were used to identify essential data items, functions, and tasks in the PMMS framework. Issues of interest in pavement marking management have been discussed with recommendations for best practices and caveats in developing and implementing PMMS. This study targets a flexible PMMS structure adaptable to the needs, capabilities, or organizational structure of different agencies or organizations.

2. Fundamentals and Core Concepts

Infrastructure asset management (IAM) is a systematic approach to planning and executing all tasks and operations associated with providing and maintaining physical assets. The goal of IAM is to maintain an acceptable or specific level of service in the infrastructure system. IAM activities occur within an infrastructure asset management system (IAMS) framework that includes operational packages and asset management plans (AMPs) for budgeting, investments, design, construction, operation, maintenance, condition assessment, and performance evaluation of different assets [23]. The American association of state highway and transportation officials (AASHTO) developed the transportation asset management (TAM) guide based on the fundamental principles of AM and defined TAM as “a strategic approach to managing transportation infrastructure” [24]. Introducing the TAM guide steered the US transportation community toward widely accepting TAM as the standard management model [25]. For example, NCHRP built up an interstate highway system (HIS) AM framework [25] on AASHTO’s TAM guideline [24], accepting all of its basic principles. However, there is a remarkable difference between accepting AM (and its derivatives such as IAM and TAM) as a concept or philosophy and implementing it in the form of a practical asset management system (AMS) [26].
To successfully develop and implement an AMS for a specific asset such as pavement marking, agencies need to develop and deploy dedicated AMPs and asset management tools (AMTs) that make it possible to carry out asset management activities for the intended assets. AMPs determine the agency’s operational trajectory concerning specific assets by specifying or suggesting methods, procedures, data, software tools, policies, decisions, budget, and the like [23]. In a broader context, AMS conglomerates different AMPs and AMTs and makes them functional in fulfilling AM core concepts. According to the NCHRP’s asset management framework for the interstate highway system [25], a desirable AMS transportation infrastructure should achieve the following:
  • Have enough flexibility for being applied to both existing and future assets.
  • Allow the integration of decision-making across asset classes. For example, enable agencies to accommodate pavement marking needs in pavement construction plans.
  • Account for new construction, reconstruction, maintenance, and rehabilitation.
  • Be feasible and easy to implement for adopting agencies while economically attractive to transportation stakeholders.
  • Be policy-driven, which means a systematic and unambiguous body of policy goals and objectives is in place to support decision-making.
  • Be performance-based, which means involving measurable parameters that indicate the outcome of the AMS implementation, and the difference made by AMS implementation can be quantified (compared to non-systematic or existing pavement management methods).
  • Incorporate customer/user expectation and needs in policymaking and enable collecting feedback from users, staff, operators, and contractors.
  • Enable performance monitoring.
  • Have clear data quality assurance procedures.
Vanier [26] translated the core concepts of AM into six what questions to be addressed by the AMS. The PMMS framework consists of operational packages, each comprised of procedures, activities, and tools, that work together to address these questions. The following is a general description of how these questions—defined by Vanier—relate to different components of the PMMS framework:
(1) What is owned? and (2) What is the value of assets?
Asset inventory, and the data collection and data management activities associated with it, keep the record of the assets and their value.
(3) What is the deferred maintenance?
Condition assessment and performance measurement activities determine the amount of deferred maintenance based on performance measures and performance goals.
(4) What is the assets’ condition?
Pavement marking condition assessment and performance measurement activities determine the assets’ condition according to performance measures and performance goals. Subsequently, assets are paired with their condition assessment in pavement marking inventory.
(5) What is the remaining service life?
PMMS uses expert judgment and/or mathematical processes to predict pavement marking service life from historic performance data and condition data. Service life prediction may follow a subjective, model-based, or hybrid approach.
(6) What should be constructed, repaired, rehabilitated, or replaced first?
The project selection process prioritizes marking operations based on multiple factors.
The TAM system exploits a series of procedures assorted in some interconnected levels of hierarchy. The TAM framework’s principal blocks are policy goals and objectives, planning and programming, program delivery, and system performance monitoring; each of these blocks comprises a series of elements that themselves may be composite or simple processes or functions [4,24,25,27]. Figure 1 shows how TAM’s core concepts are applied to PMMS by focusing on areas that address different issues of importance for pavement marking management. These focus areas encompass agency activities from the highest levels of management to the forefront of work zones and are related to each other through connections between the blocks and the elements.
What is shown in Figure 1 is a generic minimum recommended structure for the PMMS framework. Nevertheless, as discussed in the preceding sections, pavement marking management practices largely depend on the implementing entity’s needs and capabilities. Most components of PMMS vary from agency to agency and from one location to another. Therefore, a practical approach to a widely applicable guideline for PMMS development and implementation could involve providing a general recommended framework complemented with information about most critical items, especially those most sensitive to change of circumstances. Such discussions should be able to caution agencies about possible sources of problems and provide information on avoiding or solving them. Following this approach, the next section discusses the critical items and operations under PMMS focus areas.

3. Discussions

3.1. Establishing Performance Measures and Targets Specific to Pavement Markings

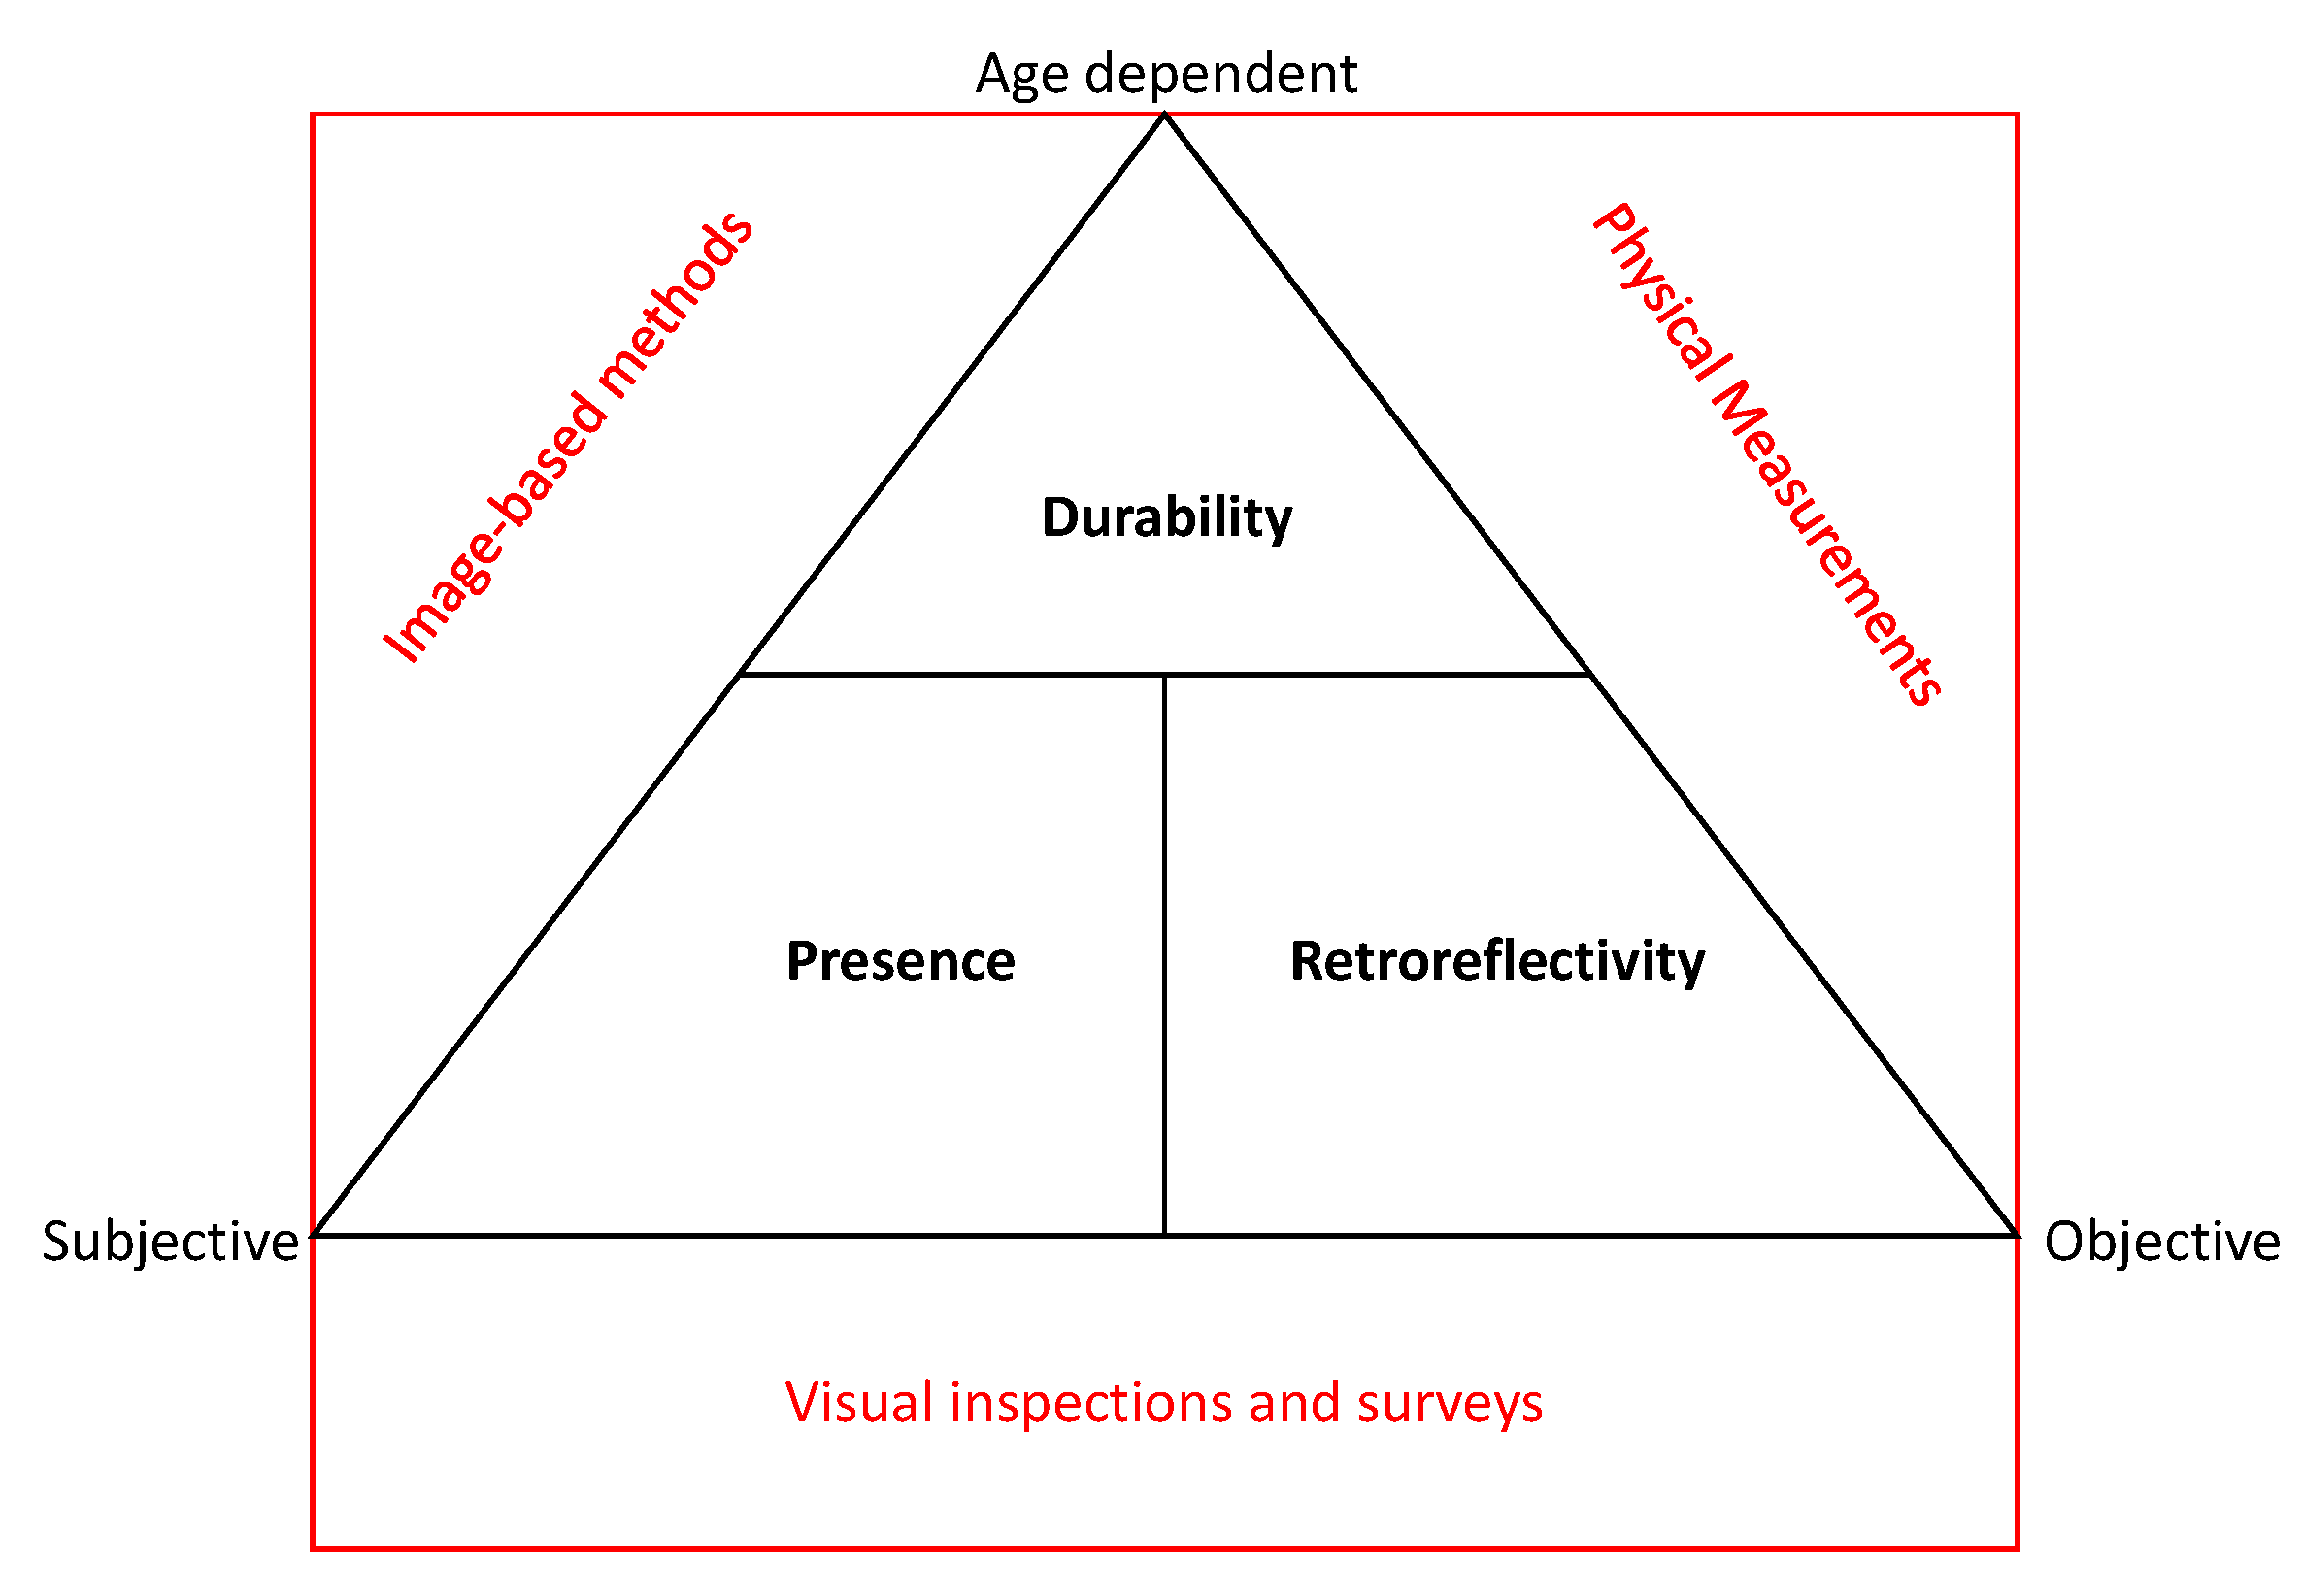
3.1.1. Identifying Principal Performance Measures

Performance measures that indicate performance level of assets are, together with performance targets, essential to implementing policy goals and objectives related to an asset. NCHRP Synthesis 551 [27] provides detailed information about performance measures and targets in TAM and how to identify them. Performance measures for a specific asset are selected from an inventory of available measures evaluated and rated based on a set of pre-defined criteria [25,27]. It is recommended to categorize the available performance measures by their context. In this way, selection criteria could be applied to them according to the context of interest. Some example categories include mobility and accessibility, safety, environmental impacts, project delivery, asset preservation, economic development, social impacts, security, and operations and maintenance. Some criteria that can be used in evaluating performance measures include but are not limited to [25,27]:
  • Connecting policies to objectives. In other words, representing the outcome rather than output.
  • Reflecting long-term characteristics of assets and thus can be incorporated in life-cycle analyses and performance models.
  • Being sensitive to the source of change, i.e., a variation in the measure can be traced back to its cause.
  • Involving a reasonable amount of effort to obtain. The number of parameters should be kept under control to avoid excessive variability in the data and make it too difficult to collect the required data.
  • Being easy-to-understand, objective, and quantifiable.
  • Applicability in condition/performance prediction models. For this, the parameter or measures should describe the asset condition or performance level, can be predicted by mathematical models, and can be age/time-dependent.
  • Being possible to be estimated or predicted by professional judgment.
  • Having wide acceptance among professionals.
  • Compatibility with existing resources.
  • Measurability with reasonable accuracy and precision.
  • Reflecting user experience.
  • Consistency of interpretation.
  • A benefit-to-cost ratio greater than 1.
  • Compatibility with standards and specifications.
  • Involving reliable data collection practices.
  • Representing controllable characteristics of assets.
  • Versatility. A measure that applies to more than one asset or serves different purposes would be more desirable than those limited to only one asset or provide only one type of information.
Organizations can decide what criteria represent their priorities the best and adopt a performance measure selection procedure accordingly. On the other hand, performance measures defined for different assets may require a different set of criteria. The performance of pavement marking, despite all various factors and attributes, is represented in two main performance characteristics: durability and visibility; i.e., pavement marking should last for as long a time as possible in a condition that allows drivers to see it with minimal effort at any time during the day [2]. Each of these two performance characteristics is influenced by factors related to pavement marking attributes or service conditions. Durability and visibility are commonly referred to as pavement marking performance measures. However, regarding the properties of a desirable performance measure discussed above, we refer to durability as a performance measure but consider visibility as a characteristic represented by two performance measures: presence and retroreflectivity. In addition, two other measures that are recommended for PMMS are cost and environmental impact.
We categorize the performance measures into two groups of (a) primary measures consisting of durability, presence, and retroreflectivity, and (b) secondary measures that are cost and environmental impact. This categorization is not adopted to elevate the primary or undermine the secondary measures, but it is because the primary measures manifest pavement markings’ contribution to safety and mobility, while secondary measures represent other aspects of pavement markings. These performance measures can be used as simple parameters or be integrated as composite parameters. Currently, the Iowa DOT [3] uses the retroreflectivity threshold for white and yellow lines as a simple performance measure. Kansas DOT uses the brightness benefit factor (BBF) to determine the most cost-effective marking. BBF is a composite parameter defined as a cost–benefit ratio based on material retroreflectivity, durability, and installed cost. The Montana DOT uses retroreflectivity, durability, and color as the main performance measures to evaluate contractor work [3]. Agencies may opt to utilize one or more simple measures or define composite measures. However, it is recommended to incorporate all these five principal measures or their derivatives in PMMS.
Major factors affecting pavement marking durability are shown in Figure 2, where the main categories of factors are (1) marking characteristics; (2) on-road construction operations, (3) and (4) traffic and road characteristics; (4) and (5) environmental conditions and winter maintenance operations; and (6) underlying surface characteristics [2,3,19,28,29,30]. Each of the main factor categories is related to other factors or attributes. As seen in the figure, there are close interconnections between these factors, the most obvious ones being the relations between road and traffic characteristics and between environmental conditions and winter maintenance operations. For example, the presence of stop signs or intersection in the road section directly influences traffic speed.
Winter maintenance operations can be incorporated in PMMS through climatic factors such as average monthly and annual snowfall and normal snowfall (30-year average) because the maintenance operations are governed by the amount of snow present on road surfaces [3]. Physical characteristics in the figure refer to pavement markings’ structural features such as elevation relative to the pavement (surface-applied, recessed, or raised), thickness, and surface texture. Pavement markings show significantly different characteristics and performances depending on whether they are paint or tape, surface-applied or raised/recessed, textured or smooth, thin or thick, and so forth [3]. A pavement marking’s function and alignment represent the design type of the marking, i.e., whether it is center line, edge line, crosswalk marking, symbol, or text, and they refer to its orientation relative to the direction of traffic, lateral position across the road, and the message it conveys to road users.
The visibility of pavement marking has two prongs: daytime and nighttime visibility. Assuming that drivers do not need artificial light (headlights) to see the markings during the day, daytime visibility is represented by a pavement marking’s presence defined by its color, intactness, and degree of wear. The presence is typically evaluated by subjective inspection methods such as visual inspection and inquiring into drivers’ experience. During the night, a pavement marking is seen through the partial reflection of the light from vehicles’ headlights or other artificial light sources such as streetlights. Therefore, the nighttime visibility of a pavement marking depends not only on a marking’s presence but also on its ability to reflect an ample fraction of the incident light [14]. The measurable performance measure that represents nighttime visibility is retroreflectivity. In practice, retroreflectivity is the principal visibility measure for pavement marking [31] and often serves as a surrogate measure of durability. Agencies decide on marking reapplication based on the availability of marking by imposing a minimum limit on retroreflectivity values. In this approach, pavement marking is considered available when its retroreflectivity is above a certain threshold [2].
The retroreflectivity of newly applied pavement marking is dictated by some factors related to its constituents and installation conditions. The most remarkable factors affecting newly installed retroreflectivity are as follows [14,19,32]:
  • Glass beads
    Material (e.g., glass, PMMA, VisiBeads™, or other)
    Amount and dispersion
    Embedment depth [percentage of bead diameter]
    Refractive index
    Size type. Size types I and II are described by AASHTO and larger types III, IV, and V are described by the FHWA, which has given gradations for them. Type I is the smallest and most common bead. Larger beads improve wet-night visibility by standing higher than water level.
    Clarity
    Roundness
  • Binder material
    Color. Yellow markings have retroreflectivity equivalent to 70–80% of white markings.
    Type/material, that includes waterborne, durable waterborne, thermoplastic, epoxy, polyurea, or tape.
    Thickness
  • Other factors
    Pavement surface roughness
    Dirt or other blinding materials
    Marking level (recessed, surface, elevated)
The pavement marking presence is often evaluated subjectively. However, novel quantitative methods, particularly image processing, are emerging as alternatives. For instance, Zhang et al. [33] developed a method to detect and inspect pavement marking and rumble strip conditions and elevation using a laser scanner and digital camera. There are two standard practices for measuring retroreflectivity: vehicle-mounted retroreflectivity measurement equipment (e.g., Lazerlux van) that is mostly used for measurement in highways or major multi-lane roadways; and handheld retroreflectometer (e.g., LTL-X) [3]. Retroreflectivity is also commonly evaluated through visual inspections or inquiring into drivers’ experience. It is advisable to utilize novel methods for retroreflectivity and pavement presence evaluation after they pass the required vetting. For example, laser scanner and image analysis methods are powerful tools with the potential to increase data collection speed and efficiency. Currently, there is no cost-effective, widely accepted image-based method for measuring retroreflectivity.
Figure 3 shows the three primary performance measures and describes how they relate to time/age and evaluation methods. All performance measures involve subjective, objective, and time-dependent aspects. Retroreflectivity is mostly objective because a measurable parameter represents it. On the other hand, presence is mostly subjective, while it could be quantified through image-based or other innovative methods. Finally, durability is the pavement marking’s ability to maintain its presence and retroreflectivity over time.
Cost and environmental impact can be effective performance measures if applied within a life-cycle analysis (LCA) framework. Life-cycle cost analysis (LCCA) estimation is a part of contemporary asset management essential for evaluating maintenance, repair, and renewal strategies [26]. Likewise, an LCCA of transportation assets is a common practice in TAM systems [34]. Some notable US agencies adopting life-cycle cost as a decision-making parameter in pavement marking management include state departments of transportation in Alaska, Tennessee, Montana, Pennsylvania, and Iowa [2,3]. Despite its numerous benefits and relatively easy calculation method, not many agencies perform pavement marking LCCA; the survey conducted under NCHRP 37-01 project [6] found that less than 10% of participating agencies used LCC analysis (benefit–cost LCC) in managing pavement markings. This can be attributed to the fact that pavement markings are usually managed by traditional methods instead of systematic PMMS.
LCCA for pavement markings typically involves installation costs and the estimated service life of markings [2]. However, there are more factors to be considered, especially with the recent increase in the application of durable pavement markings [35]. Durable pavement marking materials are more expensive than regular marking materials, but their benefits are manifested in the long term through longer restriping intervals and the reduction of all the costs associated with it. Building up from a previous study by Pike et al. [35] who developed a pavement marking LCC estimation tool for Texas DOT, cost items in the LCCA can be suggested as the following:
  • Materials costs.
  • Cost of pre-striping pavement preparations such as grooving, removing of existing markings, and cleaning.
  • Direct cost of installation operations.
  • Costs imposed by special requirements or conditions.
  • Administrative costs.
  • Organizational costs.
  • Costs related to societal effects of pavement markings and striping operations:
    Traffic delay costs
    Costs of accidents/crashes caused by striping operations
    Costs associated with reduced road safety due to degraded or poor marking performance.
Pike et al. accounted for traffic delay costs and the cost of accidents caused by striping operations but did not include the costs associated with pavement markings’ safety roles. By adding safety-related costs, and any additional items as needed, the methodology provided by Pike et al. [35] can be used as a basis for developing agency-specific pavement marking LCCA tools.
In most pavement marking management practices and management systems (for example, in [3,7,8,36]), environmental impacts are not considered as a performance measure. Agencies typically manage ecological aspects of pavement markings by implementing the existing specifications, particularly the United States Environmental Protection Agency (US EPA) specification [37], prescribing limits on the volatile organic compound (VOC) content of marking materials [38,39]. PMMS is oriented around establishing long-term strategies considering the assets’ entire service life, and environmental impacts are no exception. Therefore, the performance measures meant to reflect environmental impacts of pavement markings should involve life-cycle assessments, preferably accounting for the following factors:
  • Environmental life cycle assessment of materials that also reflects environmental impacts relative to a material’s effective service life.
  • Materials toxicity and any health hazards they may pose to workers and the public during transportation, handling, storage, installation, service, and removal. This includes toxic fume, hazardous chemicals, and particulate matter [2].
  • Environmental impacts of installation, maintenance, and removal (eradication) operations [2].

3.1.2. Performance Targets

Establishing performance targets is the foremost action to harmonize PMMS with policies. This essentially involves defining target values for performance measures in the form of minimum acceptable values, maximum acceptable values, or desirable ranges. Retroreflectivity is the most important measure of pavement markings’ performance. Therefore, the principal—though the most basic—way of establishing performance targets for pavement markings is to define retroreflectivity thresholds. The FHWA acknowledged the representativeness of retroreflectivity and, in its 2010 revision to The Manual on Uniform Traffic Control Devices (MUTCD), added mandating requirements for retroreflectivity levels. Section 3A.03 of MUTCD now recommends minimum retroreflectivity values as given in Table 1, and agencies are required to maintain the retroreflectivity of pavement markings in all roads under their jurisdiction at or above these levels. FHWA considers that this change will promote safety, and it is flexible enough to allow agencies to choose the path toward the targets.
Requirements for pavement marking visibility are not based on roadway characteristics or geometry but on the driver’s need for visual information to maneuver safely and effectively. Therefore, agencies need to incorporate methodologies of determining drivers’ retroreflectivity needs into PMMS [18]. Research methods to investigate human factors in driver’s retroreflectivity needs include [40]:
  • Subjective Evaluations, where drivers are asked to evaluate pavement markings while they drive on a given road.
  • Objective Evaluations, where drivers are asked to detect pavement markings of varying retroreflectivity levels while driving on a given road.
  • Visibility Models, which are methods of using computer software to predict necessary levels of retroreflectivity based on actual data.
Drivers’ retroreflectivity needs shall be incorporated in the PMMS’s performance target determination process because of its substantial role in driving safety and shaping driving experience. A study in the New Jersey DOT found that the ratings given to pavement marking visibility by drivers were influenced by retroreflectivity more than all other marking-specific and environmental factors. Different studies/agencies have obtained different values for driver needs with respect to retroreflectivity, particularly due to the involvement of multiple factors that include [14,41]:
  • Driver-related factors (each of which often declines with driver’s age):
    Visual capabilities
    Cognitive processing capabilities
    Motor skills
  • Roadway-related factors:
    Speed of the vehicle
    Presence of continuous roadway lighting
    Presence of retroreflective raised pavement markers
    Color of the marking.
Transportation agencies account for driver preference of retroreflectivity by specifying minimum values ranging between 100 and 150 mcd/m2/lux as the minimum [19]. The Minnesota DOT determined drivers’ retroreflectivity need as 120 mcd/m2/lux through conducting interviews with citizens driving through several facilities [42]. The MUTCD’s recommendations for retroreflectivity threshold, seen in Table 1, do not take a marking’s age into account. However, note that retroreflectivity changes with time, and this should be considered when evaluating pavement marking performance for restriping purposes. Therefore, the retroreflectivity of newly installed markings or even older markings should be sufficiently higher than the minimum limit, depending on the agency’s restriping schedule. For example, Indiana DOT enforces a minimum retroreflectivity limit of 130 mcd/m2/lux for all pavement markings at any age because their research shows that markings with this value of retroreflectivity likely make it out of winter with a retroreflectivity greater than 100 [41]. The recommended minimum retroreflectivity also varies with marking color; the North Carolina DOT (NCDOT) recommends 150 and 100 mcd/m2/lux for thermoplastic white and yellow markings, respectively [41]. Parker and Meja [32], as a result of their study under New Jersey DOT, postulated that driver need varies between 80 and 130 mcd/m2/lux for <55-year-old drivers and between 120 and 168 for drivers who were older than 55 years. Finally, it is worth mentioning that the performance target and performance measures with respect to retroreflectivity (i.e., retroreflectivity threshold) should be defined for both newly installed and in-service markings.
From what is discussed so far, different agencies use different performance measures and targets for pavement markings. Nevertheless, there is a systematic approach to the determination of performance targets that most agencies follow. According to NCHRP report 551 [27], several factors are accounted for by agencies in setting performance targets to involve financial, policy, technical, and economic considerations:
  • Budgeting plans and available funding.
  • Policy goals, statewide priorities, or priorities by route classification.
  • Inputs from other organizations/states, public, or relevant authorities at local, state, and national levels.
  • Current condition.
  • Existing (measured) or projected performance data.
  • Discussions with the construction industry.
  • Life-cycle cost analyses, tradeoff analyses, and estimates of the marginal value of the additional investment.
NCHRP Report 551 also provides guidelines for setting performance targets. The procedure recommended in the NCHRP guideline can be more efficiently adapted for the PMMS framework if it is modified to incorporate the requirements associated with pavement marking performance measures and PMMS components. Integrating the NCHRP procedure and PMMS framework, we recommend the following steps to be taken in setting performance targets for pavement markings:
  • Determine the time span that the target covers. Is it short-term, mid-term, or long-term? Is there an exact time window for it? It is of substantial importance in PMMS that material characteristics are used as the basis of estimation at this step. Performance targets, if tied to age, should be defined differently for durable and regular pavement markings.
  • Define the context of the target, i.e., the process or policy items that the target is tied to. For example, is it a part of the budgeting process or a part of a plan to fulfill the enforced financial reporting requirements?
  • Based on the target context, choose the performance measures that should be included in the target setting. At this step, only those quantitative measures (not qualitative ones) should be used for which enough baseline and trend data, and prediction tools/methods are available. NCHRP report 551 recommends labeling performance measures as “mature” for which baseline data and targets exist, “emerging” for which baseline data are available but no target has been set, and “developmental” for which neither data nor targets exist yet.
  • Investigate driver needs with respect to the selected measures. To this end, inquire input from experts and stakeholders.
  • Develop performance targets considering:
    • Driver needs—meeting driver needs over the entire service life is all that PMMS is about, and thus, it takes the highest level of priority.
    • Financials and policies—typically, funding/resource availability and agency policies govern how conservative the targets are. For example, agencies may opt to take less conservative measures upon facing financial limitations.
    • Projected performance—consider predicted scenarios when setting performance targets. In other words, utilize the prediction of what will happen under different scenarios to determine realistic targets.
  • Monitor the progress of the agency toward achieving the targets using the performance measures.

3.2. Planning and Scheduling Pavement Marking Operations

Most US transportation agencies plan the pavement marking operations on an annual basis immediately after the period when, depending on geographical location, the most damage to pavement markings occur. In North America, winter and early spring are the most critical time concerning pavement marking durability when markings are exposed to extreme temperatures and winter maintenance operations. Planning for marking operations typically begins with conducting a holistic assessment of installation and maintenance needs based on asset condition assessment. Then, projects are selected and prioritized, aiming to maximize the use of available funds and optimally cover critical pavement marking deterioration zones [3]. As such, project selection and prioritization play a focal role in the planning and budgeting process.
PMMS should provide clear, efficient, and consistent project selection procedures [18,19]. Agencies take different approaches to determine where and when pavement marking shall be applied or reapplied. Some agencies make their project selection via a fixed process that means defining certain intervals for applying or reapplying pavement markings. They may use annual, bi-annual, or other cycles for marking application, while some define cycles by line type. However, Hawkins and Smadi [18] examined the project selection process in different state transportation agencies and concluded that the existing ways of determining which roads need marking repair lack adequate effectiveness and efficiency. A more efficient approach, which is also recommended by the authors, is a flexible project selection process that involves the following:
(a)
Determining when the markings on a certain road or road segment need to be rehabilitated. This can be accomplished through:
(a-I)
visual inspection and inquiring input from the agency’s staff.
(a-II)
quantitative measurements of selected performance measures, particularly retroreflectivity, in certain cycles. In this stage, comparing results against performance targets is the basis of decision-making.
(a-III)
taking advantage of service life predicting models (if applicable). According to Abboud and Bowman [43] predictive pavement marking operation scheduling should account for application cost, service life as a variable of material characteristics and ADT, user cost imposed by crashes during service life traffic disturbance by installation and maintenance operations, and unexpected events affecting schedules.
(b)
Zoning the agency’s jurisdiction area based on pavement marking deterioration risk.
(c)
Prioritizing projects location-wise by their respective deterioration risk zone.

3.3. Developing Consistent Processes for Acquisition of Goods and Services

Acquisition is a complex mechanism that enables the agency to obtain the items and services required to apply and maintain pavement markings. As such, it encompasses budgeting, procurement, and contracting processes related to numerous products, equipment, and operations. Different agencies follow different acquisition protocols for pavement markings. Prescribing a uniform process applicable to all agencies and regions may not be a sustainable strategy, but incorporating consistent acquisition processes in an agency’s PMMS framework is plausible and advisable, if not necessary.
Agencies may use a uniform approach for all marking-related operations or allocate budgets in a hybrid approach combining two or more methods. The NCHRP synthesis 37-01 [1,6] survey showed that the most common budgeting policy adopted by agencies for pavement marking management is recommending a budget by applying adjustments such as inflation to the previous year’s budget (previous + adjustment). More than 50% of the agencies participating in the survey declared that they have, in some ways, used this method for budgeting pavement marking operations. The same survey identified other budgeting strategies adopted by agencies as follows:
  • Target drives the budget.
  • Budget drives the target.
  • Percent of inventory annually: budget is recommended as required to address a given percentage of inventory every year.
  • Judgment politics: budget is driven by agency officials’ judgment and political/societal priorities.
  • No specific approach: a tiny percentage of participating agencies (<5%) did not use any specific approach for this purpose.
  • Percent of the total budget: a certain percent of the total budget is allocated to pavement markings. This approach was found to be the second least popular method, being second only to the no-specific-approach.
Doing pavement marking operations in-house offers promising benefits such as schedule flexibility, easier quality control and quality assurance, and skipping the costly and time-consuming processes associated with bidding—contracting and vendor performance monitoring. For example, some contractor painting in Iowa occurs on new construction and in extraordinary circumstances, while most pavement markings statewide are installed and maintained by the DOT [2]. Nevertheless, outsourcing pavement marking installation, maintenance, or data collection operations is commonplace. Until recently, most of the outsourcing of pavement marking operations have been related to new construction. However, the increasing number of vendors equipped with cutting-edge data collection technologies has raised the advantages of outsourcing condition assessment and rehabilitation operations. Consequently, agencies are now more inclined to delegate these activities to the vendors. Thus, it is reasonable to assume that PMMS should cover procurement processes concerning both in-house and outsourced operations.
The most critical component of the acquisition process that should be addressed by PMMS is the mechanism that oversees the acceptability of acquired product or service. Key elements of PMMS that enable quality management in the acquisition of goods and services are shown in Figure 4. When operations are carried out in-house, the most common purchase items are paint materials, painting equipment, and testing equipment. As seen in Figure 4, the process of overseeing the quality of purchase items, such as materials and equipment, essentially involves evaluating products through tests and existing data. The process of material selection will be discussed later on in Section 3.4.
Contracts are technically the main enforcing component of the quality assurance process. In addition to services and operations, contracts might also be used in material/equipment purchases to guarantee quality; it is shown in Figure 4 with a dashed line because not all purchase transactions are closed with performance-controlling contracts. PMMS regulates pavement marking project contracts in different levels, from project selection to final contracting and project acceptance. Some important considerations related to the incorporation of contracts in the PMMS framework are as follows:
  • Preferably, merge as many projects as possible under one work plan performed under one contract. The cost-effectiveness of the project is improved with the amount of work involved [3]. In addition, multi-agency contracts are an excellent option to entitle smaller agencies with the benefits of large-quantity pricing, consistent material and installation specifications, and easier contracting or dispute resolution [19].
  • Most agencies use a different name for their line items, which are not necessarily the same as those used by contractors. As a result, contractors may provide items that deviate from what the agency has requested [2]. Therefore, it is recommended to include descriptions of essential items in the bid documents.
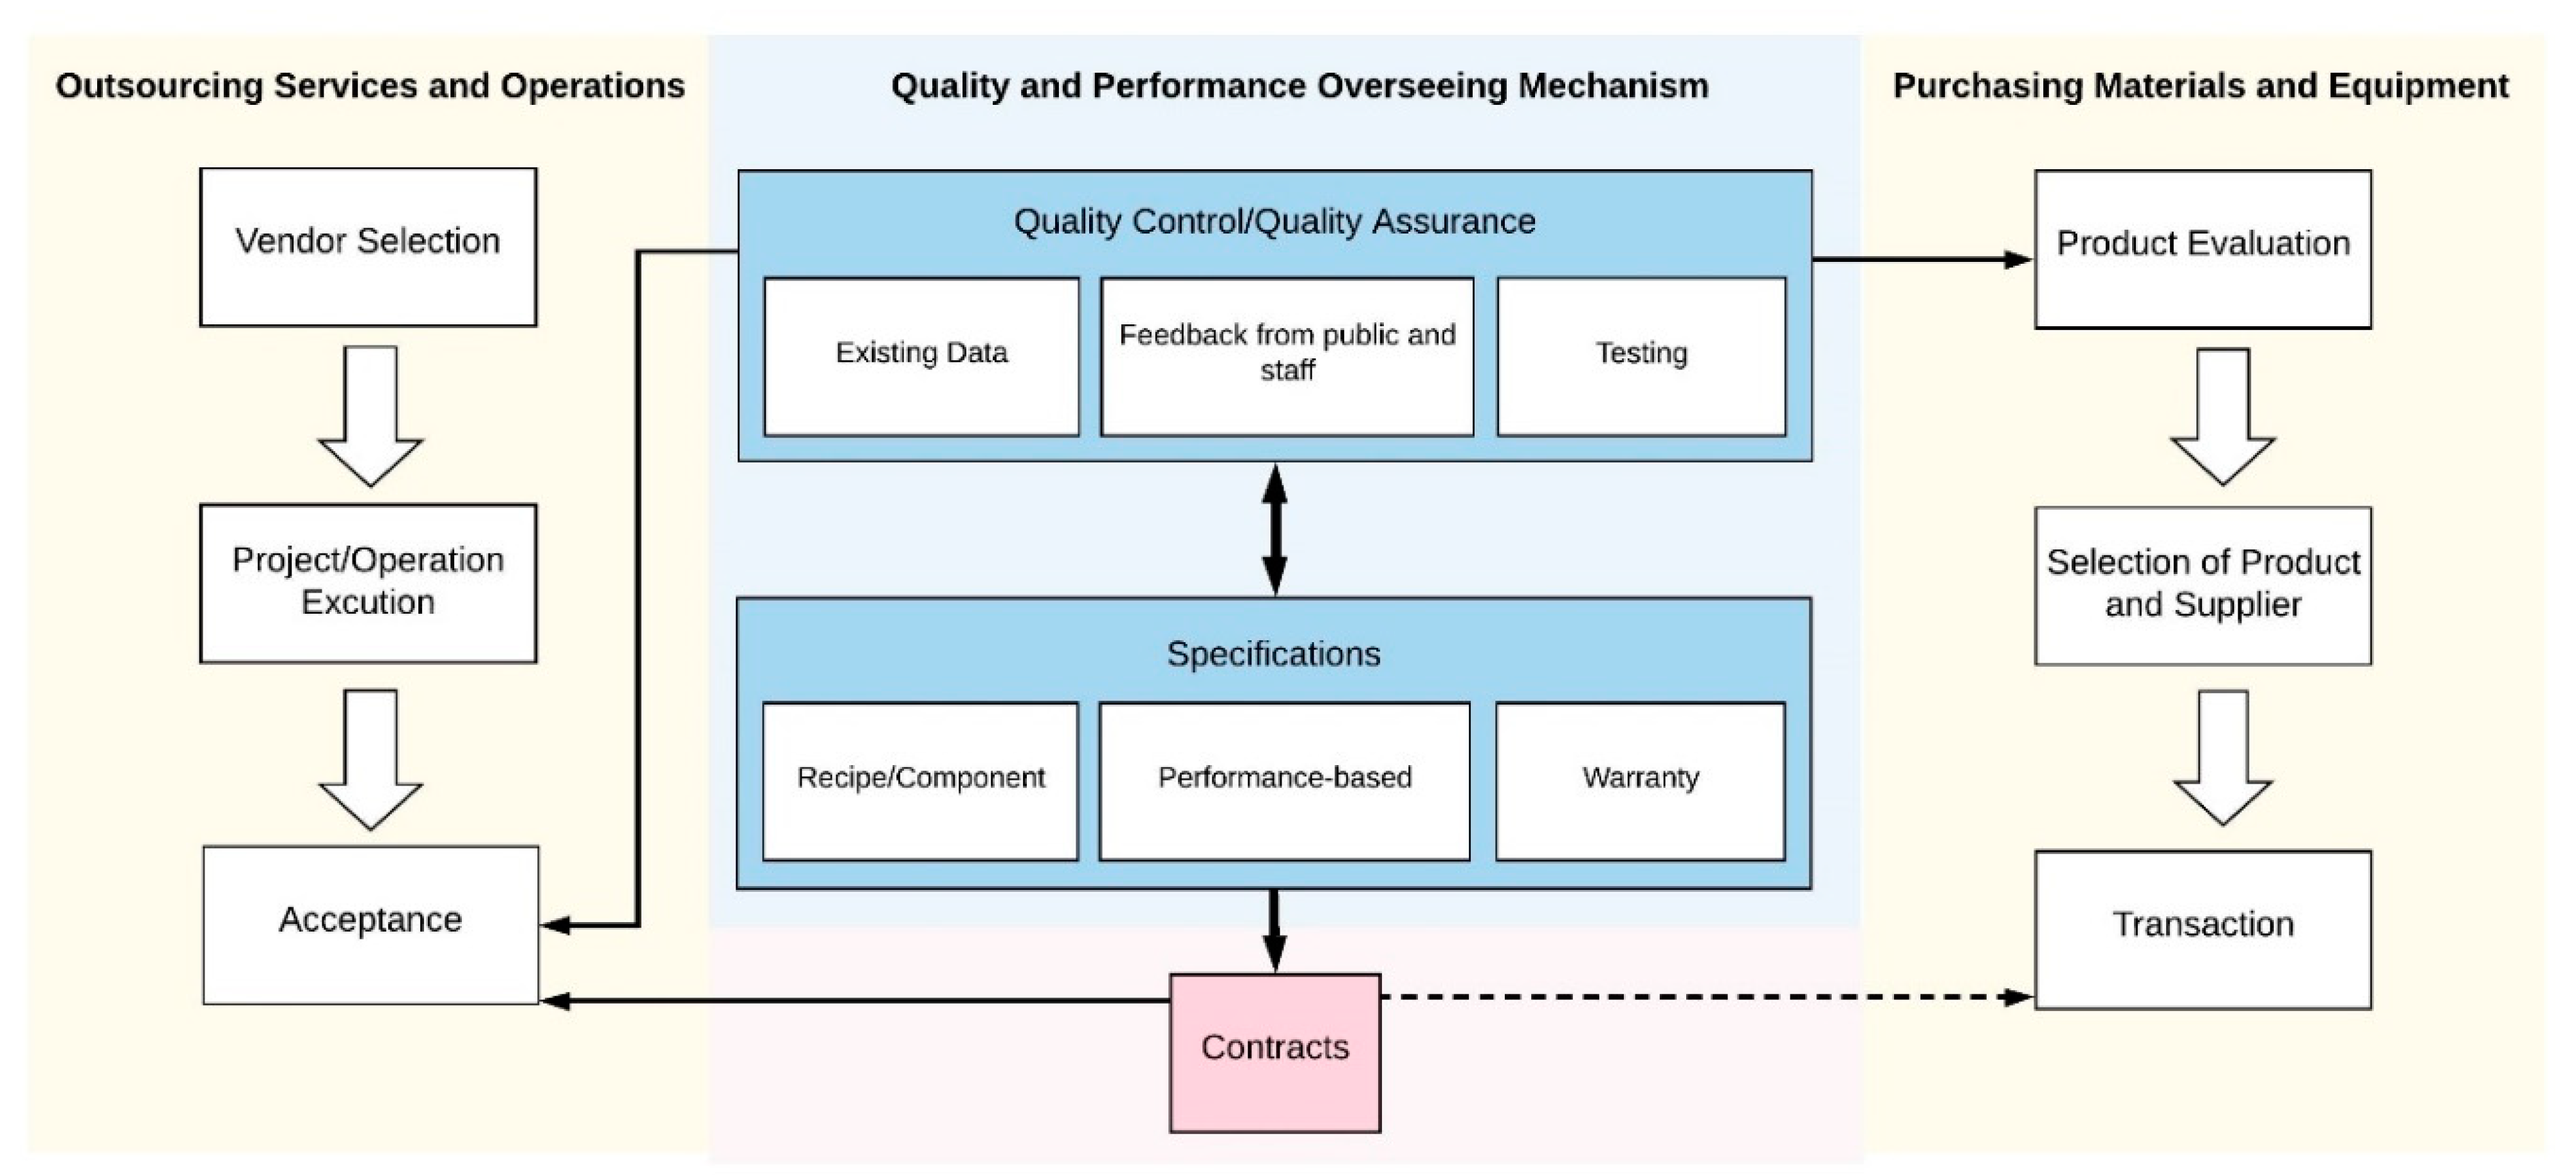
  • A procedure should be in place to monitor the value of contractors’ work, particularly in the absence of time stipulation in contracts. Texas DOT’s study on performance-based pavement marking maintenance contracts (PBPMMC) on two case study projects in San Antonio and Dallas [31,44] showed that under both contracts, the value of work done by the contractors was less than what they were compensated. Agencies may define a dynamic, contractor work monitoring task that keeps track of the number of projects done by contractors under each type of contract during the entire length of the contract. The results can serve two purposes: (1) determining which contract type (see Figure 4) provides the highest efficiency and value, and (2) determine if and when timing stipulations need to be involved in contracts (for example, specifying the number of projects that need to be done in different time periods).

3.4. Developing Consistent Procedures for Material Selection and Application

The material selection procedure should ensure that the pavement marking materials meet specifications, contribute to the agency’s plans to achieve performance targets and policy goals, and are suitable for the intended application. Therefore, materials selection happens in two stages: the initial, general approval, and selecting materials for specific projects. The former depends on fulfilling two categories of requirements: (1) when evaluated by PMMS performance measures, the material meets the agency’s performance targets and policy goals; and (2) the material’s physical and chemical properties meet state-specific and national standards. Table 2 shows the key components of the material selection process in PMMS. Elements of the table are discussed in the remainder of this section.
As seen in the table, all activities involved in material selection require gaining knowledge of materials’ properties, i.e., characteristics and performance. The National Transportation Product Evaluation Program (NTPEP) can be utilized in the material selection process. There are studies that have actually suggested using NTPEP instead of performing test decks [45]. However, given differences in operations and conditions, it is strongly recommended to perform state-specific performance evaluations and field verification [19]. As an example, IA DOT’s procedure [3] for material purchase consists of receiving bids, asking the three lowest bidders to send a 250 Gal sample, and testing the samples to determine the following: the time required to extract the paint out of the container, ease of spraying, drying time, initial reflectivity, and three-month-retained reflectivity.
No matter how the material characteristics data are obtained, they need to be evaluated and approved by the agency. As discussed above, this approval is performed by evaluating performance measures against performance targets and policy goals (as discussed in Section 3.1) and evaluating material characteristics against the standards and specifications. In Iowa, for example, the specifications for material approving are provided in Section 4183 and Section 2527.02.B of the materials specification. Cost-effectiveness can be best evaluated by considering both the installed price and expected service life. Service life is obtained from the performance curves giving the projected retroreflectivity (with age) for the tested marking types [2].
At this stage, challenge is caused by the astonishing diversity of products swarming the market during recent years. This abundance of products has led to a lack of standards and specifications that cover all, or the majority, of them and can be used as the basis of product or service preference in the procurement process. Research society has not caught up with the speed at which products and methods enter the market. There is currently no nationally applicable pavement marking specification in the USA. So, most state agencies have developed standards and specifications for their own use based on the type of environment, traffic, and materials prevailing in their region [2]. These documents can hardly be shared among states due to considerable differences between different regions’ conditions and needs. The main factors contributing to the difference between specifications include application methods, environment and climate, road conditions, pavement types (and local materials used in them), locally available products, capabilities of local vendors and contractors, population, traffic volume, and type of traffic/vehicles. Linking state PMMS to appropriate state-specific or national pavement marking material specifications has substantial importance.
The PMMS component that ensures the suitability of materials for the intended applications is the pavement marking application matrix that is based upon material properties, application method, and prevailing service conditions on one hand and performance targets on the other hand. The application matrix is used to propose pavement marking materials and application methods for achieving the established performance targets under prevailing service conditions. Principal service conditions to be considered by application matrices are (according to [2,3,14,17,18]) as follows:
(a)
Type of striping operation: new construction or restriping
(b)
Type of marking by function (centerline, edge, crosswalk, etc.) and alignment (longitudinal, transverse, text, or symbol)
(c)
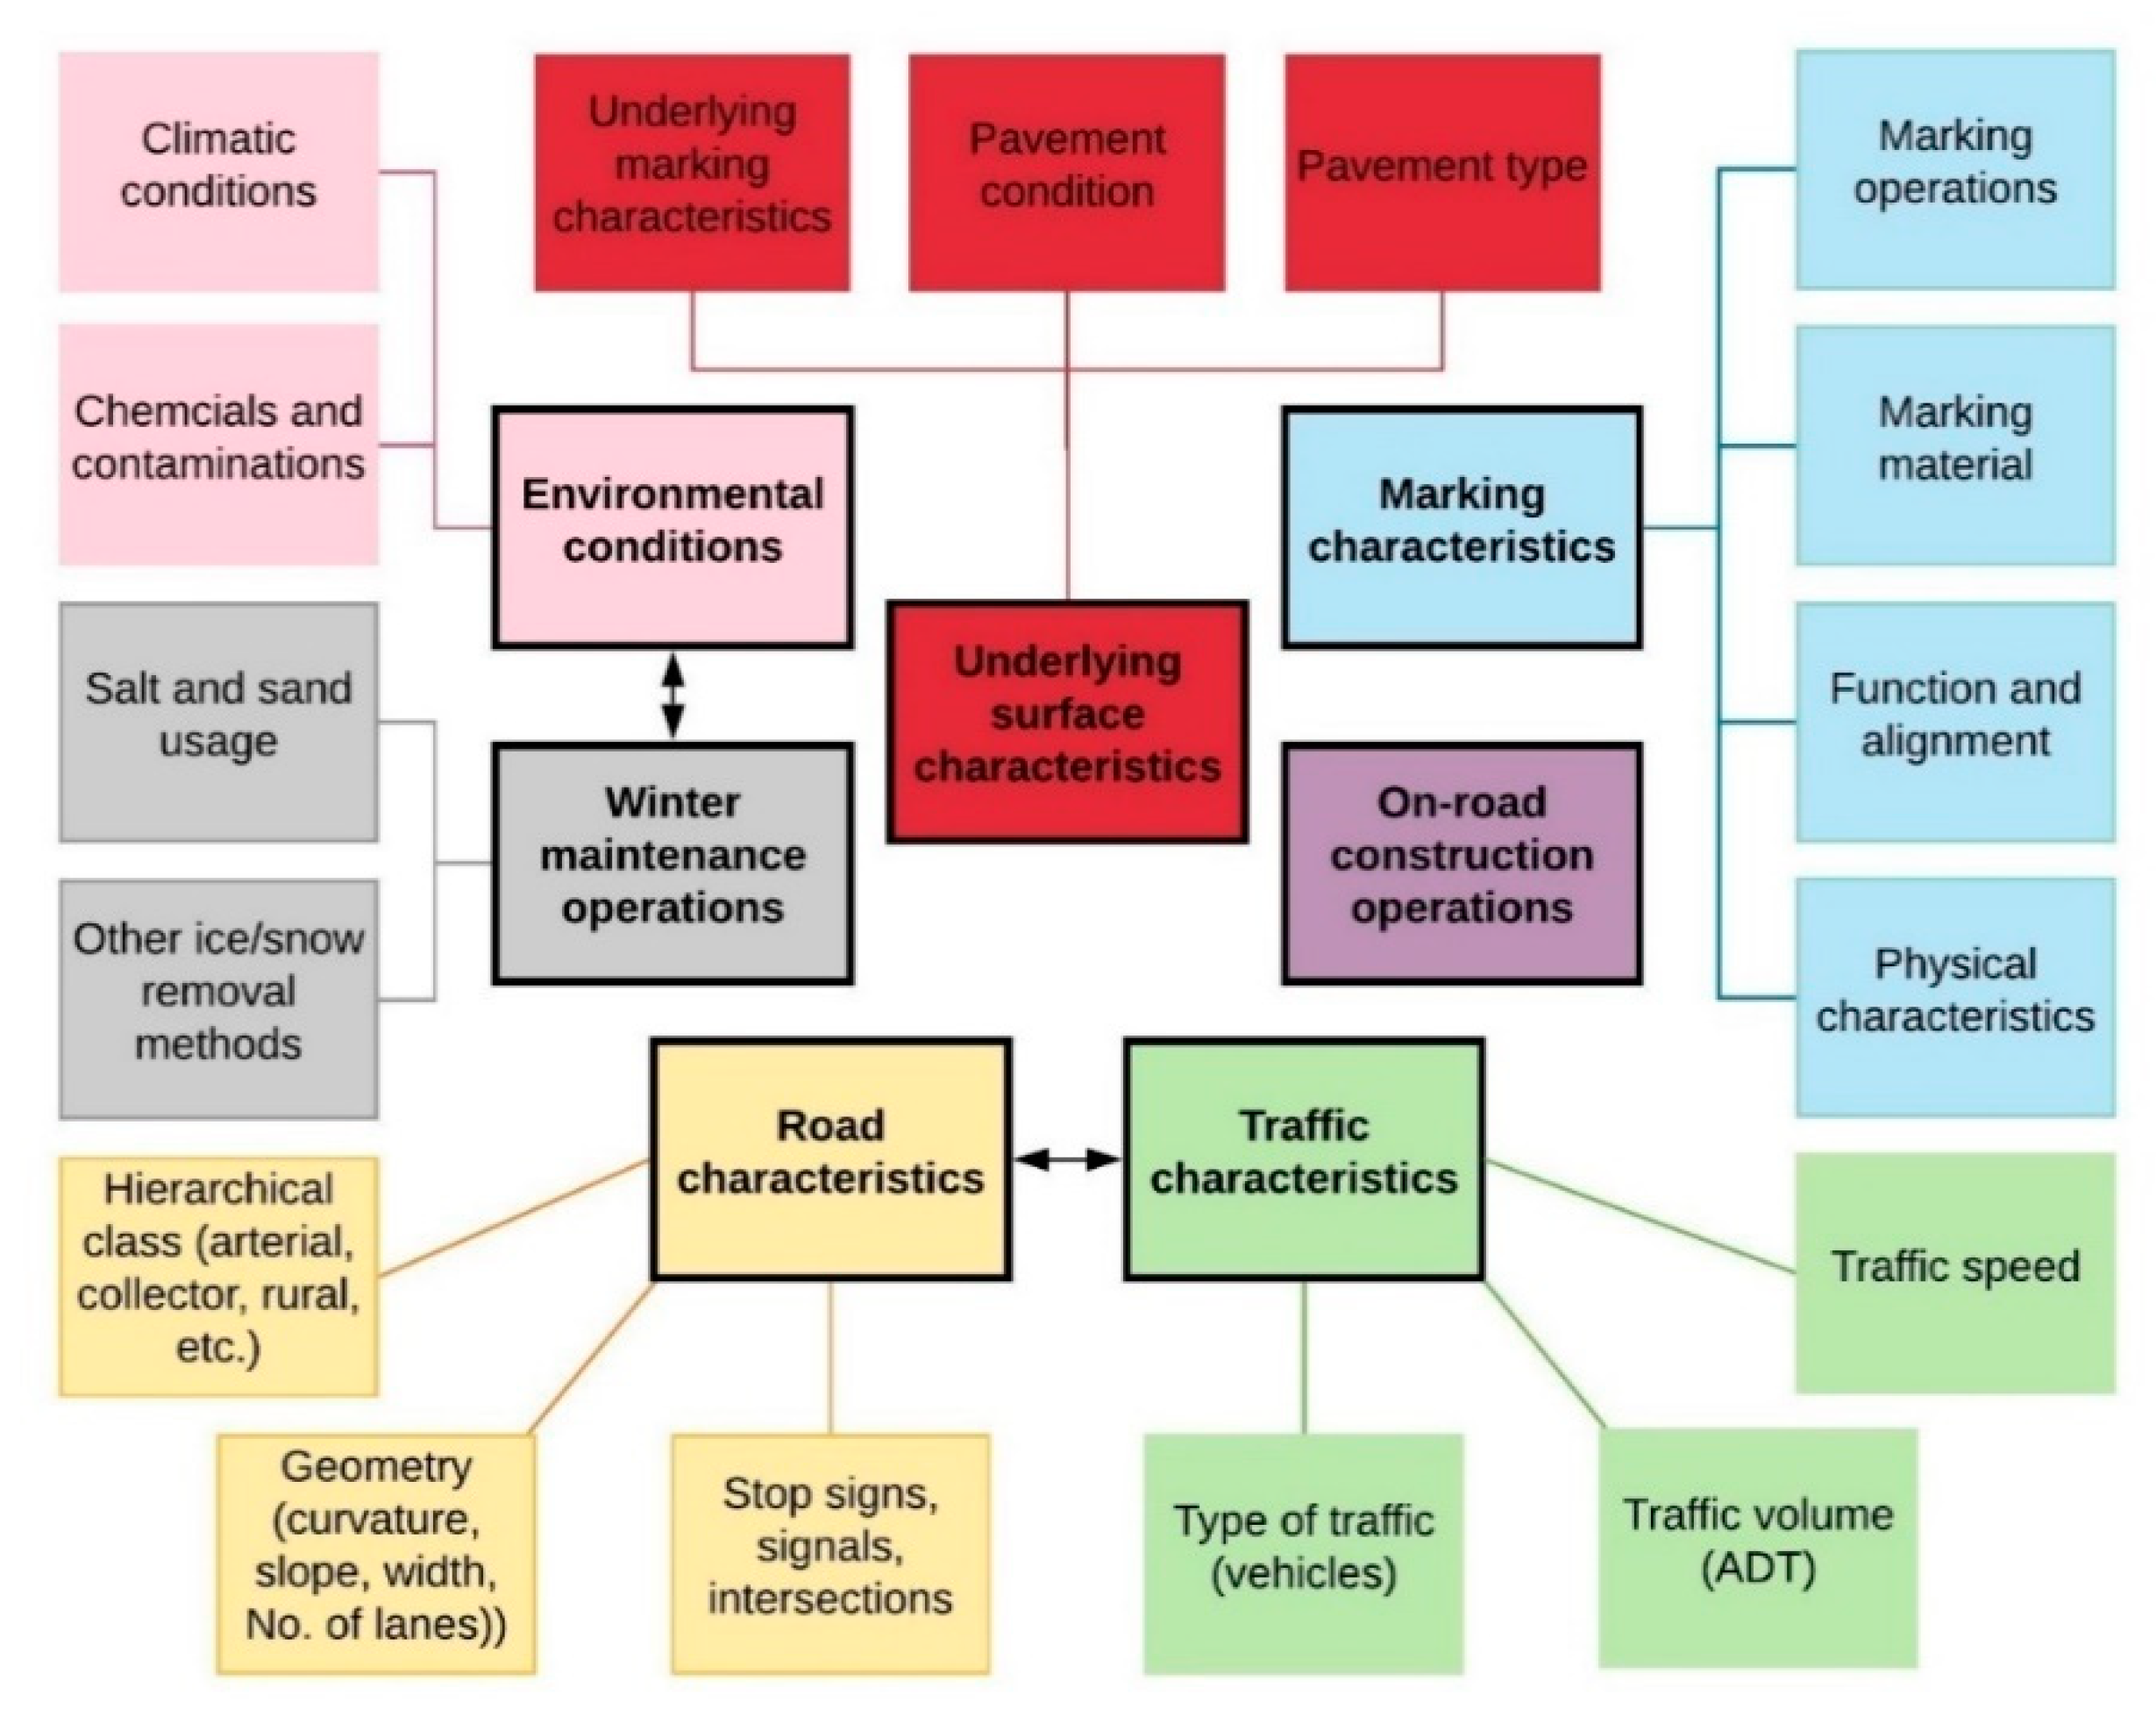
Type of pavement or underlying marking: Different pavement types with respect to influence on marking performance are [14]:
  • Different variations of Hot mix asphalt (HMA) pavement
  • Different variations of Hydraulic cement concrete (HCC)
  • Open-graded bituminous pavements (surface treatment, seal-coat, chip seal, Otta seal, and the like).
(d)
Condition of pavement: Condition at the time of marking installation affects the bond between the marking and the surface and influences the marking durability performance [28]. Surface characteristics of pavement that affecting marking performance include [14] roughness, heat sensitivity, porosity, distress (such as cracks, spalling, scaling, etc.), and cleanness.
(e)
Remaining pavement service life
(f)
Traffic characteristics: this primarily involves traffic volume -Average Daily Traffic (ADT)-. Nevertheless, the type of vehicles and average speed may also be considered if they are not included in the route characteristics.
(g)
Environmental conditions and/or geographic zone—see Section 3.1 for information about factors that must be considered regarding environmental conditions and geographic location.
(h)
Marking level: whether it is recessed or surface-applied and its intended thickness.
(i)
Route characteristics:
  • Road classification—this can be expressed as the road hierarchy or the number of lanes.
  • Traffic speed class.
  • Area class—whether it is rural, urban, or interstate.
In the case of restriping on top of existing markings, the compatibility of old and new materials should be taken into consideration. There should be a decision-making protocol to determine whether the existing marking should be removed or painted over. Striping over the existing marking is more cost-effective and convenient, but it depends on the compatibility between the old marking and new material. The decision-making process should determine whether adopting this approach is timely. Then, check the materials’ compatibility if it is decided to paint over the existing marking; otherwise, select a suitable marking-removal method. To facilitate material compatibility assessment, a material compatibility matrix should be developed and constantly updated. The marking-removal method is selected based on the type of marking, type of pavement, and site characteristics. This can be done by developing a marking removal method selection table.
Strategies should be put in place for managing excess materials (that are reused) and waste disposal. Such strategies are essential not only for environmental and health purposes but also to maintain the soundness of pavement marking application practices. Keeping track of material mixing has substantial importance for the quality of paint application. Some excess materials from striping can be used in the next immediate striping, depending on the material type. Some excess materials cannot be reused after one operation. In addition, different materials should not be mixed with each other in the sprayer, and some materials can contaminate the next batch. Keeping track of waste materials can be used to make sure inappropriate material reuse, mixing, or contamination do not occur [14].

3.5. Establishing Inspection Guidelines

The objective of PMMS is to make efficient use of available resources to keep all the pavement markings under its jurisdiction in good condition of service—in other words, ensuring that the in-service markings always satisfy performance targets. Good condition of service can be achieved if the markings possess acceptable quality when newly installed and are rehabilitated or replaced frequently enough. On the other hand, efficiency depends on the conditions and procedures under which the operations are performed. The PMMS framework encompasses pre-installation, in-installation, and post-installation inspections, as shown in Table 3, to create a well-balanced combination of cost, service life, and performance [14,28]. A PMMS shall provide required guidelines for inspections and establish links between inspections and performance measures, specifications, standards, and other related components.
Pre-installation and in-installation inspections serve both quality assurance and quality control. Pre-installation inspection is the task of ensuring that the conditions are right for pavement marking installation. To this end, roadway conditions and environmental conditions are evaluated before application. In-installation inspection involves monitoring the paint application process and assessing the freshly applied marking’s characteristics during paint application. This enables quality assurance of the marking application practices and ensures acceptable quality in the final product. It is recommended to control the quality of pavement marking during the operation for the sake of paint calibration. This allows detecting problems during the operation and making adjustments/corrections before proceeding with the rest of the striping.
Post-installation inspections are performed either immediately after installation/rehabilitation for quality control purposes or periodically during service life as part of condition assessment tasks. Post-installation quality control is meant to determine whether the job is properly done. Therefore, it focuses on physical characteristics according to initial marking design, appearance, and retroreflectivity [2]. In addition to retroreflectivity measurement, the quality of marking can also be tied to reflective bead content as an early-age quality indicator [46]. For example, in the PMMS developed by Rich et al. [46], two methods for evaluating bead content were used: one method involved spraying paint on an aluminum plate and weighing the bead content after binder removal by pyrolysis, and another method determined the number of spheres and percent area coverage by spheres in a unit area and their average size by image analysis. However, the approach of using the bead content of newly installed marking as a quality indicator may be misleading, because it tends to miss the influence of color, paint texture, thickness, and paint reflectivity on the overall visibility of the marking. The retroreflectivity measurement provides a more unified, standardized method of evaluating marking quality and is relatively more inclusive. So, it is better recommended that post-installation quality control inspections consist of visual inspection, measurement of retroreflectivity, and assessment of as-designed physical characteristics.
Condition assessment is a pivotal contributor to decision-making in the PMMS framework. The data needed to plan the maintenance operations and develop the performance models are generated through condition assessment activities [1]. Condition assessment revolves around data collection through visual inspections (subjective data collection methods) and measurements (objective data collection methods). Despite the higher merit of objective data collection methods, it is recommended that agencies maintain their visual inspection routines, especially because it produces useful data for validating performance predictions [47]. The data of interest and the data collection methods depend on the nature of performance measures.
Structuring the inspection and data collection activities under the PMMS framework maximizes process efficiency and minimizes data variability. Retroreflectivity measurement is the common denominator of all PMMSs as the most data-intensive part of condition assessment. The main sources of variability in retroreflectivity data are:
  • Variations caused by data collection practice and schedule:
    Timing of data collection (frequency and season)
    Inconsistent measurement practices
    Variations in speed while collecting data, both for the mobile retroreflectometer and the water truck (if used for washing)
    Different environmental conditions on data collection trips
    Lack of guidelines for equipment usage under various environmental conditions.
  • Equipment-related variations:
    Low accuracy and inherent variability of mobile retroreflectometer
    Device miscalibration
    Change in the geometry of the mobile retroreflectometer when going around horizontal curves.
  • Variations originated from marking characteristics:
    Changes in application methods by different striping crews that causes inherent variation in marking characteristics
    Dust and dirt buildup on the road combined with the cleaning effects of rain.
Addressing the above-mentioned sources of variability can lead to improving data uniformity and reducing crew confusion. Some measures that help achieve this goal include, but are not limited to, the following:
  • Developing standards for marking application equipment and practices
  • Developing standard protocols for marking condition assessment and performance evaluation equipment and practices. This includes specifying sampling frequency and sample size or—at least—the method for determining sample size. For example, the Iowa DOT’s protocol for a handheld retroreflectivity measurement device has specified the sampling frequency, measurement locations, number of readings at each site, and measurement instructions for different types of markings (in terms of function, e.g., dash lines, centerlines, crosswalks, edge lines, etc.) [3].
  • Providing guidelines for equipment and material usage according to environmental conditions.
The records and data items obtained from inspections should be adequately documented and stored to support decision making, facilitate access to information, and enable determining the source of possible variations and inaccuracies. Linking the condition assessment inspections to the pavement marking’s projected service life improves the efficiency of inspections. Figure 5 shows this approach where the intervals of condition assessment inspections are reduced toward the end of the projected service life. Note that the figure is not to the scale, and the intervals between inspections are abstract values to depict the relative frequency of inspections. More frequent inspections may be required during the season when winter maintenance operations are ongoing. The frequency of inspections and distribution of objective (measured) and subjective (visual) inspections also depend on the agency’s policy goals and available funds.
Integrating all pavement marking inspection data and making required links between different data fragments and operations will be discussed in the upcoming sections. The data log of a given segment of pavement marking at any given time during its service life should include at minimum the following information:
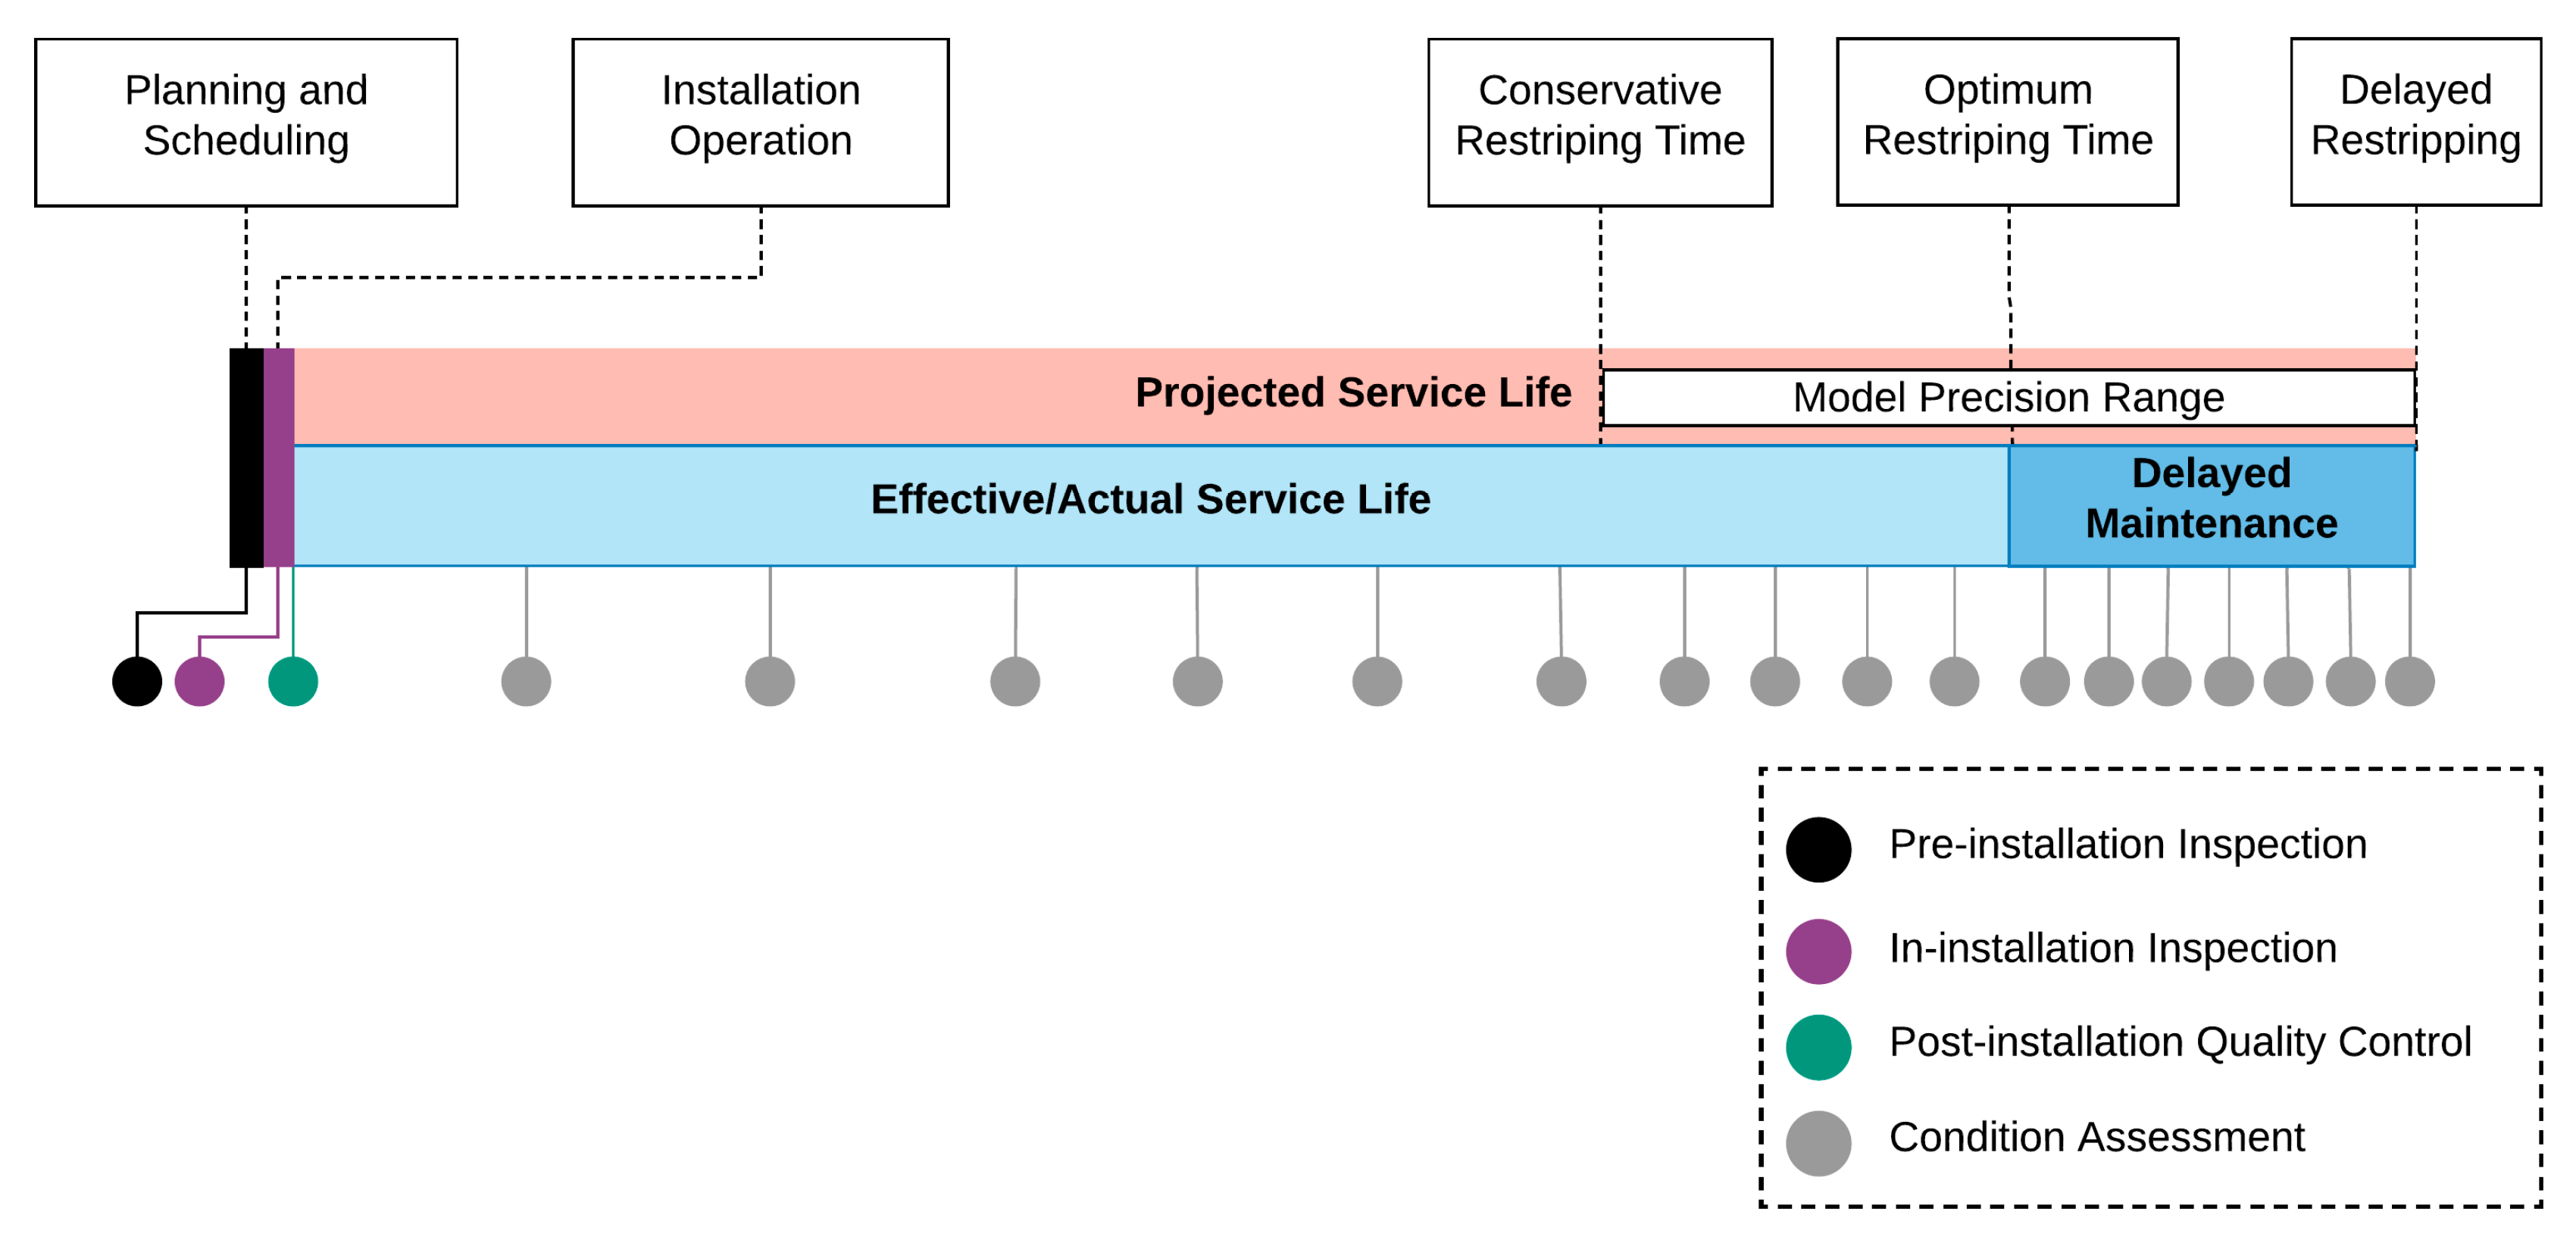
  • Installation log (see Section 3.7.3 for more information)
  • In-installation inspection record (more discussion can be found in [14])
  • Post-installation quality control inspection record
  • Complete record of post-installation condition assessments.

3.6. Managing Durable Pavement Markings

Durable pavement markings are used by many agencies and, due to their relatively higher price, they contribute largely to pavement marking application expenditures. The NCHRP’s survey showed that durable markings comprised 23% of the total mileage of markings but 35% of total expenditure, while waterborne paints comprise about 60% of total marking mileage but contributed 17% to expenditures [19]. Regarding their relatively high cost of application, durable pavement markings need to be exclusively managed to ensure that the benefits justify the costs. Measures should be taken in the management of durable markings to ensure the following:
  • Durable marking installation is adequately tracked and recorded into the database.
  • Unplanned/premature repainting over durable markings is avoided.
  • The performance of durable markings is monitored.
  • Durable marking maintenance operations are efficiently planned.
  • The application of durable pavement markings is promoted.
Iowa DOT’s experience [3] showed that keeping a track record of durable marking installation sites is crucial to the efficiency of operations and the quality of data. Maintenance crew may prematurely reapply paint on a durable marking, and reflectivity measurement crew may incorporate durable marking data in a regular marking database, causing bias in the average reflectivity. The data from durable pavement markings should be clearly distinguished, and the performance models need to be modified for them.

3.7. Data Management and Analysis

3.7.1. Developing a Comprehensive Data Management Platform

The goal of data management in PMMS is to present the current value and future predictions of all pavement marking attribute data necessary for decision making. Ideally, this is accomplished in an easy-to-interpret, integrated platform consisting of databases and IT tools, making data, maps, charts, tables, and other visualized data or data analytics available at any time or organizational level needed. The platform’s structure that includes various datatypes and databases, tools, links, and functions, depends on the agency’s needs. Nevertheless, it should, at a minimum, include all the data required for locating the existing assets and assessing their current condition. The data management system should enable quick access to predicted asset conditions over a sufficiently long period [47]. An effective and efficient data management platform in PMMS should make pavement marking data available at all levels of an agency’s hierarchy engaged in pavement marking planning and operations; i.e., in addition to the central office, district offices and pavement marking teams should easily have access to the data [18]. Minimum data management capabilities required in PMMS, which are the same as required in any AMS [25,27], include the following items:
  • Asset inventory containing type, number, condition, and location of assets.
  • Database of time-stamped condition and performance levels of inventory assets.
  • Condition and performance prediction models. Using performance models, the agency should be able to:
    • Predict performance levels based on different installation and operation scenarios, which, at minimum, encompass material types, installation methods, pavement type, winter maintenance operations, environmental conditions, and traffic characteristics.
    • Translate the modeling results into costs and investments in order to use them as decision-making tools.
    • Determine future asset deployment, procurement, or maintenance needs for operation and investment planning.
  • Performance targets and repair thresholds.
  • Cost estimation models capable of estimating the benefit-to-cost ratio of given repair/investment scenarios.
  • Consistent and effective data quality management procedures.

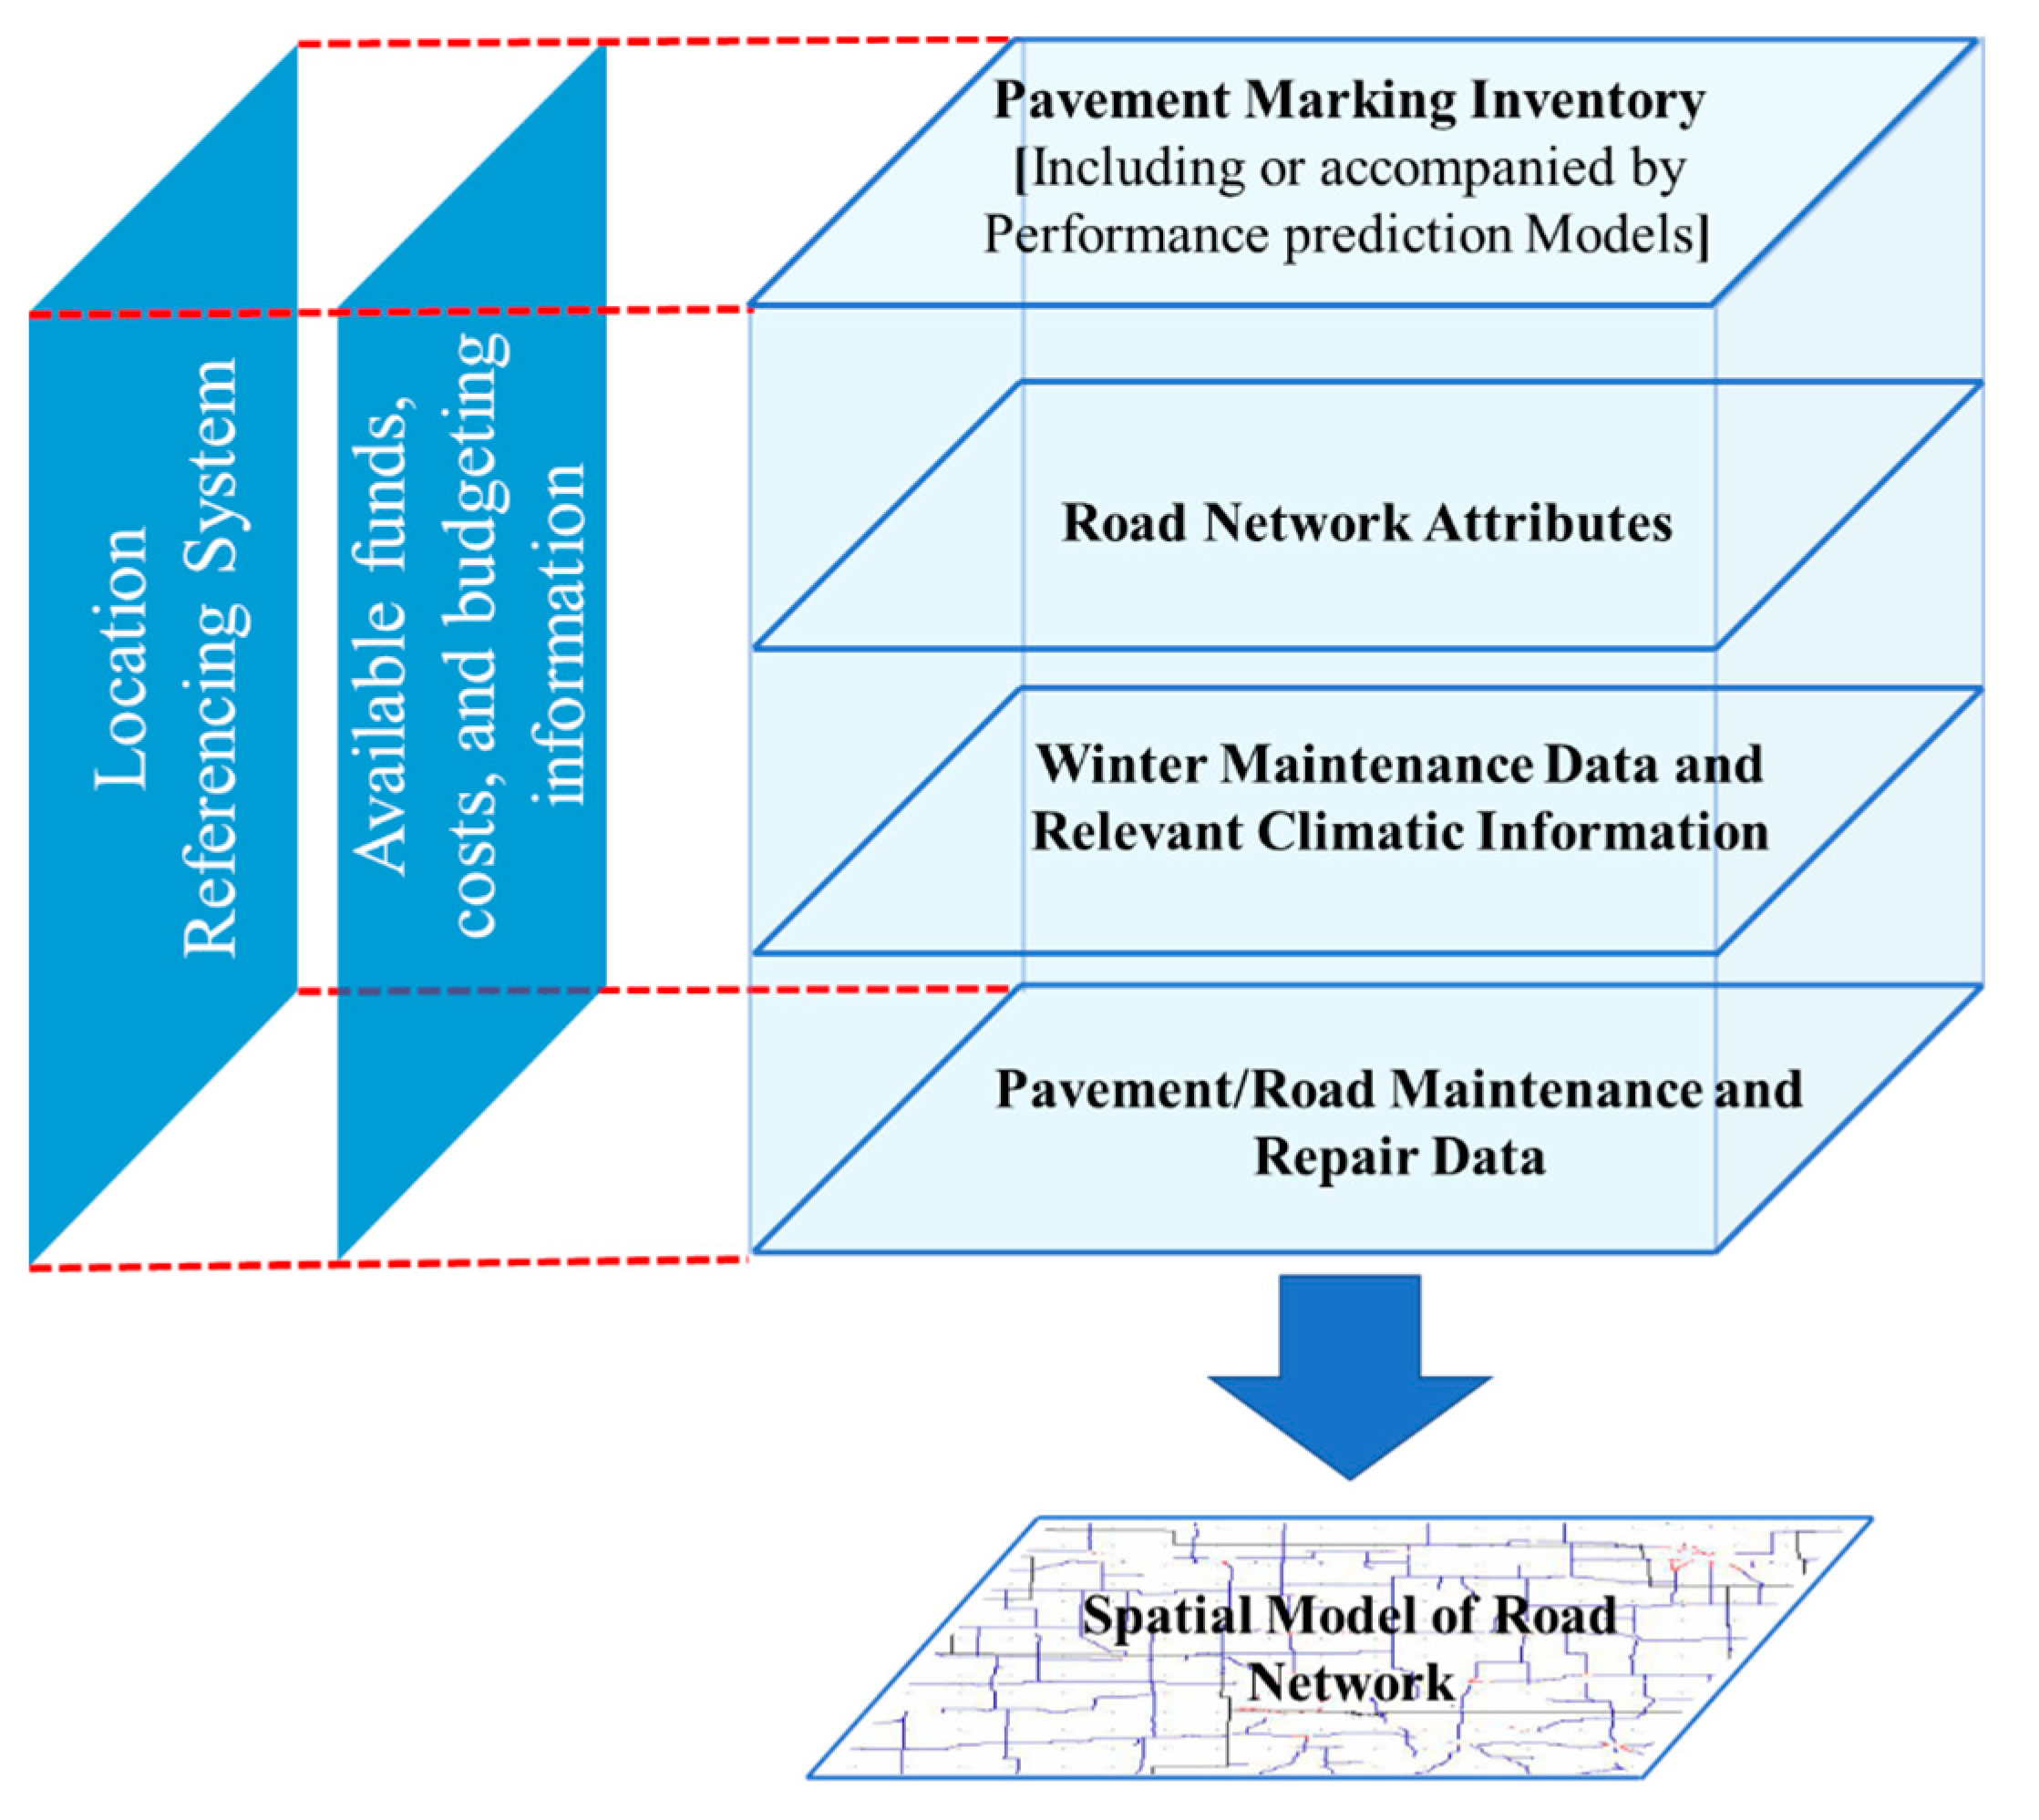
3.7.2. PMMS Database and Data Integration

TAM is a data-driven process using data that are collected from a variety of sources for decision-making. Hence, TAM’s successful implementation depends on the availability of an adequate amount of high-quality data [25]. The volume and quality of available data have gained even more importance over the past decade when data-driven IT tools have become an inseparable element of asset management systems. Data quality is the most important factor in the successful employment of IT tools in AM [47]. Similar to traditional TAM systems, the data used in PMMS should contain at least the basic information about the location, inventory, cost, and condition of the assets [25]. For asset condition assessment, the data should possess some principal characteristics, which are (1) positional accuracy, (2) attribute accuracy, (3) data lineage, (4) completeness, (5) consistency, and (6) appropriate data format for different AM tools and databases in PMMS [25,48].
PMMS should encompass quality assurance procedures to watch over data collection. This component of PMMS can be built on the same practices in TAM guidelines such as NCHRP 551 [27], which emphasizes using scientific methods in data collection and analysis to ensure acceptable data quality. Vendor-collected data are quite commonly involved in PMMS databases, and their quality is a source of concern. Therefore, in any data quality assurance procedure, vendor data should be analyzed, and feedback should be provided to eliminate possible errors [49]. Cunningham et al. [49] have provided an example of the forms used to examine how the vendor data match the correct data. Pavement marking asset inventory databases should enable historic data collection and visualization such that the historic data can be accessed and visualized at different scales of road and network. Analysis of the historic data, enabled by the easy-to-use database, is instrumental in identifying influence patterns and performing before–after analyses.
Developing a PMMS database follows the establishment of a robust data collection system and starts with selecting a suitable database model (or data model). Utilizing the right database management model is crucial because it defines the data structure and governs the analyses performed on the data [50]. Longley et al. [50] defined the data model as “a set of constructs for describing and representing selected aspects of the real world in a computer”. Translating real-world phenomena into computerized data is basically accomplished through an abstraction process, which translates what is real into what is its computer representation in four embodiments: (1) reality, (2) conceptual model, (3) logical model, and (4) physical model [50]. The physical model is at the forefront of the data management system and is the last component before PMMS implementation [47].
Different database models can be used to establish the physical model for the PMMS database. Agencies and vendors may develop a PMMS database based on any data model that fits their needs, as long as the model can contain and handle core elements of the database without unwanted interferences and overcomplicating. The relational model is one that has been previously used and recommended for PMMS applications [47]. Many components of PMMS need supporting materials such as tables, charts, graphs, and GIS maps, and the relational model provides a suitable structure to accommodate all these elements. Maintaining a layered data structure in which different layers of data are integrated under the PMMS database superstructure is recommended. Minimum recommended layers of data to be incorporated under the PMMS database are schematically presented in Figure 6, where the database’s core components are as follows [4,7,47,51]:
  • Pavement marking inventory—a database (e.g., a relational database) containing all pavement marking attributes required for implementing PMMS. If the inventory is developed according to suggestions of this guideline, it contains all required data items. Otherwise, it should be assured that the PMMS database includes—at least—the pavement marking performance prediction models.
  • Road network attributes—non-spatial road data such as traffic volume, location, speed limit, pavement type, number of lanes, and hierarchical level. This can be established by linking the database to the agency’s road characteristics inventory (RCI).
  • Spatial model of the road network—typically a GIS database containing all necessary topological and geometric features of the road, as seen in Figure 6. The location-referenced data in the PMMS database can be projected on road network’s spatial model.
  • Available funds, costs, and budgeting information.
  • Climatic information related to winter maintenance operations—typically consisting of precipitation data such as average monthly and annual snowfall and normal snowfall (30-year average). The dynamic, GPS-based record of winter maintenance operations is an additional dataset that can be used to monitor damage likelihood in different locations.
  • Road maintenance and repair data—customarily, the non-spatial data integrated under the maintenance management system (MMS).
Data integration is necessary for any data analysis and management plan and determines the existing data’s usability. There are often so many different data management systems and databases within an agency, resulting in data fragments that need to be integrated. However, if the data sources (i.e., data management systems or databases) are not compatible with each other, the integration would be so challenging that the expenses may outgrow the benefits. Data integration in the PMMS context involves three broad groups of (1) measured attributes, (2) projected/predicted attributes, and (3) spatial data including asset locations and operation/inspection records [47]. Data integration tools must be capable of incorporating collected/measured and predicted/imputed pavement marking attribute data that are associated with their respective locations and come from different sources. Although it is strongly recommended to unify the format of data management systems and databases, the data integration tool should be equipped with necessary measures to address the data source incompatibility problem [47]. Sitzabee et al. [47] have developed a functional data integration system for PMMS that we recommend for application alongside the developed asset management plan.

3.7.3. Pavement Marking Asset Inventory

A centralized asset inventory and condition database is the desirable way of inventorying pavement markings in PMMS [3,17,18]. The PMMS inventory can involve information beyond just asset identification and condition description to support decision-making. Table 4 presents a proposed design for PMMS asset inventory based on the discussions made in the foregoing sections, the authors’ previous experience developing PMMSs [3,9,18,19,20], and the existing literature [4,47,49]. The table collects some important PMMS inventory components and describes the most common data items and data types associated with them. Note that the designed inventory could contain a plurality of the components and data shown in the table and beyond that; however, it should, at a minimum, include items 1 through 5.
The items shown in the table may vary in terms of definition by different agencies, organizations, or from country to country. Concerning item #1 (asset identification), the type of marking refers to the design, function, and alignment of the markings, e.g., longitudinal, pedestrian crossing, various types of signs and symbols, texts, recessed or elevated signs, color, the purpose of the sign, and the like. The material type in item #3 (material description) refers to the material type of the binder, bead, and bead coatings. Examples of common binder material types are thermoplastic, waterborne paint, epoxy, polyurea, modified urethane, Methyl Methacrylate (MMA), tape, and buttons [14]. This is especially meant to distinguish durable marking materials from regular markings. The installation method in item #3 refers to the installation technique such as single spray, double spray, extruded, extruded with raised edges, agglomerate, rolled, heat-in-place, inverted profile, spray-on rumble strip, etc. [2]. Description of the surface type listed under item #4 (site description) can be performed using the categories mentioned in Section 3.4.
Asset quality in item #5 refers to the current condition and performance according to the agency’s categorization system, performance measures, and performance targets. These data are contributed by the inspection records, as discussed in the previous sections (see Section 3.5 and Figure 5). Inspection data can be presented as described in Table 3. Performance measures, particularly retroreflectivity, should be sorted based on the type of test (i.e., lab or field, handheld or mobile, etc.). The condition indicator typically includes an information coding system that shows the level of service (LOS). The projected performance given in item #9 comprises two main components: life cycle prediction and the projected rehabilitation or replacement schedule, the latter being derived from the former (See Figure 5).
Installation records (logs), as given in item #10 (Marking Application Records), are the information recorded by the installation crew during striping operations; at a minimum, the following items are recommended to be recorded about the pavement marking by the operators [14]:
  • Date
  • Road identification and location
  • Line types
  • Start and stop time of the operation
  • Unpredicted incidents (machinery malfunctions, abnormal performance, crew injury, accidents, etc.)
  • Conversations
  • Commercial information of the materials used (manufacturer, trade name, product code, etc.)
  • Quantity of materials used
  • Inspection record (As given in pre-installation/installation inspections” and the above table)
  • Bead loading [during paint installation] (lbs of bead per gallon of paint) and Glass bead application rate
  • Wet thickness [immediately after paint installation]
  • Application speed of the truck that sprays the paint
  • Lane closure or traffic control information (related to motorists delay and the associated costs of road closure)
The decision actions describe the context of the decision procedure and possible outcomes. The descriptions of items and the definitions of terms can eliminate misunderstanding of data at different organization levels and promote data sharing among agencies/organizations. These descriptions present enough descriptive details to identify an asset for decision-making purposes correctly. Finally, it is recommended to impart the inventory database with the ability to store and show documentation of pavement marking assets and operations in image or video format.

3.7.4. Location Referencing

A large portion of data in PMMS concern the location of markings and operations. Typically, agencies use either the linear referencing system (LRS), the Global Positioning System (GPS), or both. However, GPS-based location referencing is preferred because the recent trends of data collection technologies dictate the use of more consistent, widely standardized methods. Furthermore, GPS is less susceptible to data integration problems than LRS. Sometimes, a local, rather than standard, LRS is used, which causes compatibility issues in data integration and analysis [47]. Translating GPS and LRS data into Geographic Information System (GIS) format facilitates understanding, using, and sharing data, and it is practiced by many agencies [3]. In the PMMS framework, all location data shall be unified into one type/format by incorporating pavement marking information in GIS. A core aspect of integrating GIS and PMMS is the location referencing system used by the pavement marking inventory and in data collection.
Key activities to integrate GIS into the PMMS framework involve developing GIS maps of (1) climatic information (rain and snowfall data), (2) maintenance operations, (3) pavement marking asset inventory, and (4) inspection and condition assessment data. As in the Iowa DOT application, these maps can be used in initial assessments before the painting season to prioritize pavement marking operations (i.e., project selection—see Section 3.2). It is strongly recommended to establish a (at least) statewide unified/consistent format for maps to minimize confusion among the agency’s staff and crew. Long-term implementation of PMMS using GIS database calls for transferring routinely collected data into the GIS database.

3.7.5. Pavement Marking Service Life Prediction

As shown by the FHWA-NCHRP survey [6], predicting the service life of markings is usually done subjectively, and most agencies do not develop models and performance curves. Most agencies in this survey used agency experience (about 60%) and professional judgment (about 50%), while less than 15% developed models. However, the structured, efficient approach to managing pavement markings manifested in PMMS suggests predicting marking performance by mathematical models [1]. Deterioration models in the existing literature almost always refer to predictive models that project the degradation of pavement marking retroreflectivity by time under given traffic and environmental conditions [52]. The performance models used in the PMMS framework should provide performance/life cycle curves for a sufficiently broad range of pavement marking products.
Most studies addressing pavement marking service life prediction have quantified the marking’s serviceability in terms of retroreflectivity, assuming that markings are serviceable as long as their retroreflectivity is above a minimum level [19]. A pavement marking’s retroreflectivity performance over time is modeled considering multiple variables that include initial retroreflectivity, age/time, traffic volume (AADT), traffic type, geographic location, climatic and environmental conditions, color, type of marking material, surface type, and marking function (edge, middle, longitudinal, transverse, etc.) [47,53,54,55]. It is advisable to give a higher weight to winter maintenance operations in the performance prediction models. Previous research [28] bears evidence that winter maintenance operations are the leading cause of pavement marking deterioration. Such that, in states with harsh winter weather conditions and a high volume of frozen precipitations, such as Illinois, abrasion from snow removal operations is the number one cause of pavement marking deterioration [28]. The recommended approach is documenting winter maintenance operations (salt, sand, brine, and plowing) by route and milepost over the winter season, and evaluate marking performance vis-à-vis these operations [3]. An essential factor to be considered by the performance prediction models is the durability class. With the increased popularity of durable markings in recent years, many agencies’ prediction models need to be updated and modified for durable marking applications. An erroneous prediction of the durable markings’ service lives leads to premature or delayed repair or replacement, defying the very purpose of durable markings.
Various mathematical modeling approaches can be used for developing performance models, depending mainly on data availability and the agency’s needs. It has been suggested [56] that regression models are the most suitable for predicting pavement marking service life based on retroreflectivity requirements. On the other hand, the study by Washington State Transportation Center (TRAC) [57] argued that pavement marking service life predictions suffer from unacceptable levels of variability even if data collection variability is minimized. Hence, it is recommended to support model development activities by large volumes of data and applying machine learning algorithms to improve model reliability. Test deck data are a useful source for developing retroreflectivity degradation curves [2]; the transverse test deck data pool collected and made available by National Transportation Product Evaluation Program (NTPEP) provides useful datasets for developing or calibrating pavement marking performance models.

3.7.6. Developing IT Tools to Facilitate Different PMMS Activities

Data management tools include software, hardware, databases, and data collection systems used to establish an effective transportation asset management [47,58]. Pavement marking management tools (PMMTs) are basically information technology (IT) tools to simplify data collection, storage, and querying and enable the automation of mapping and analysis [17]. The effectiveness of a PMMT depends on the availability of high-quality, adequate, and timely data [17]. The data management and analysis capabilities contributed by PMMTs should support the basic data collection and analysis activities required for project selection. As such, PMMTs shall allow the agency to perform (1) asset inventory data storage, (2) condition data storage and treatment, (3) condition and performance predictions, and (4) effectively visualizing the data. However, the minimum-feature scenario is not the ideal case in an effective and efficient PMMS. Depending on the agency’s available resources, PMMTs may be equipped with additional analytical capabilities such as risk assessment, life-cycle cost analysis, and environmental LCA. NCHRP report 545 [59] recommends that AM tools support network-level analysis of the effect of investment scenarios on performance measures and program-level analysis of the impact of program/project on performance measures. Whether the agency chooses minimum-feature PMMT or equips its IT toolset with additional features depends on its general AM policies.
The PMMT executes tasks at the data collection, integration, storage, and analysis levels. The most elementary utilization of PMMT in data collection is digitalizing the installation operation logs and inspection sheets, as described in Section 3.5 and Section 3.7.3. In this regard, data collection PMMTs are the tools that facilitate the dynamic monitoring of retroreflectivity [4,19]. Considering the advancement of technology toward automated data collection, PMMTs need to be compatible with automated data collection methods such as automatic image-based pavement marking presence analyzers [2]. Data collection tools can incorporate a communication platform to share important marking information, e.g., in-installation inspection results, in real time. If the data formats are inconsistent or incompatible with other tools or databases, data integration tools are needed to retrieve data from data collection tools and convert them to formats usable by databases or other tools.
Data integration tools retrieve different forms of data—such as collected/measured, predicted, or imputed pavement marking attributes—from different sources, agglomerate them into datasets with proper format, and transfer them to the destination where they are stored or processed. Although it is strongly recommended to unify the format of data management systems and databases, the data integration tools should be equipped with necessary measures to address the problem of data source incompatibility [47]. Agencies use various commercial database tools such as Oracle database, SQL, ArcGIS, and MS Access to store, organize, visualize, and share data. Stand-alone data integration tools may also be used to integrate data from different tools or databases. A prominent tool is Enterprise Architect that can import and export data schema in different formats compatible with database tools. A substantial portion of data integration activity is related to location referencing. Most agencies currently use Rte-milespot to locate pavement markings [6], while collecting location information in GPS format has considerable benefits such as ease of data collection and analysis, especially if converted into GIS data (see Section 3.7.4). PMMTs should allow logging pavement marking operations and collecting pavement marking data with GPS location referencing and transferring the data into the GIS database.
Data analysis and interpretation tools in asset management take the core data, models, business rules, and analysis parameters and perform analytical tasks such as LCA, LCCA, performance modeling, optimization, and risk analysis to support decision making [25]. According to NCHRP report 545 [59], the business rules applied to AM data analytic tools, especially investment analysis tools, demand current and future condition data to be available separately for each asset. Therefore, the PMMS data management platform must be able to provide the data required to evaluate the agency’s comprehensive investment scenarios. Typical data required for investment analysis include available asset inventory, projected service lives under different implementation scenarios, current marking application and maintenance operations, and predicted network expansion. A pavement marking inventory (i.e., the PMMS database) developed as described in Section 3.7.3 encompasses all these data, while it takes projected service life from the performance prediction tool.
It can be claimed that the most critical application of data analytic tools in PMMS is projecting pavement marking performance and visualizing the results in an easy-to-interpret body of charts, tables, and graphs. Recommended data visualization capabilities of performance prediction tools are (1) pavement marking degradation curves, (2) predicted-versus-target and actual-versus-target charts for individual performance measures, and (3) performance prediction data embedded in a GIS database. Other analytic and decision-making tools can utilize the results obtained from the pavement marking performance prediction tool (PPPT). Notable software tools potentially importing data from PPPT include a pavement marking material selection tool (PMST), investment analysis tools, and project selection tools. PMST assists in the selection of pavement marking materials to achieve intended performance levels [2,51]. PMST can be considered an interactive application matrix that uses demonstrated and predicted performances of different pavement marking materials under different conditions (as discussed in Section 3.4) and provides the user with pavement marking material options for a given performance requirement.

3.7.7. Integrating PMMS Database with Other AM Systems

One of the steps toward the effective implementation of PMMS and efficiently incorporating it within an agency’s system architecture is integrating or linking PMMS database with other AM systems and the databases associated with them. The preeminent asset management systems currently in use by transportation agencies are (according to NCHRP report 545 [59]): (1) Pavement management system (PMS), (2) Bridge management system (BMS), (3) Congestion, Safety, Public Transit, and Intermodal Management Systems, and (4) Maintenance management system (MMS). Integrating PMMS with other AM systems requires, and is essentially equivalent to, spatial integration of the databases associated with them [53]. Therefore, unifying the location referencing system, as discussed in Section 3.7.2, Section 3.7.4, and Section 3.7.6, is fundamental to database integration. In addition, some small but instrumental measures can be taken at negligible cost during data collection to facilitate data integration. Examples are as follows:
  • Optimizing the format of striping logs—which are typically automatically collected from DOT trucks [17]—for incorporation into the databases or the tools that perform data integration.
  • Using a GPS-based location referencing system integrated with the GIS database as discussed in Section 3.7.4.
Integrating PMMS and PMS is especially beneficial with respect to data analysis and construction planning. Generally, the agencies benefit from integrating PMMS with PMS, and it can be accomplished by establishing relations between pavement marking performance and PMS data items such as pavement type, pavement condition, traffic, and road and environmental conditions. Analysis of pavement marking data against pavement management data enables comparing the striping and retroreflectivity information against crash/accident information, pavement type, pavement condition, winter maintenance operations, and daily traffic [2]. This allows investigating the safety effects of pavement markings and different factors influencing it. In addition to data analytics, integrating PMMS and PMS allows incorporating pavement marking databases within the pavement construction decision-making process. For example, if recessed marking is found the best practice for a specific location, pavement grooving is planned and implemented during construction.

4. Summary of Results

The foregoing sections discussed various aspects of pavement marking management at a network level. The following provides a synopsis of the central points of discussion:
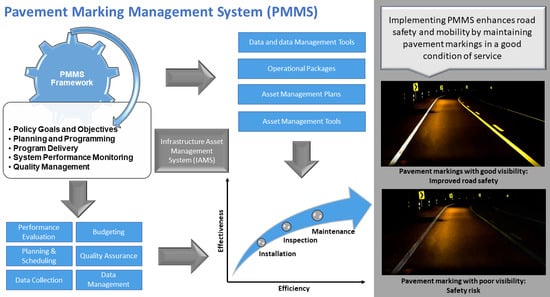
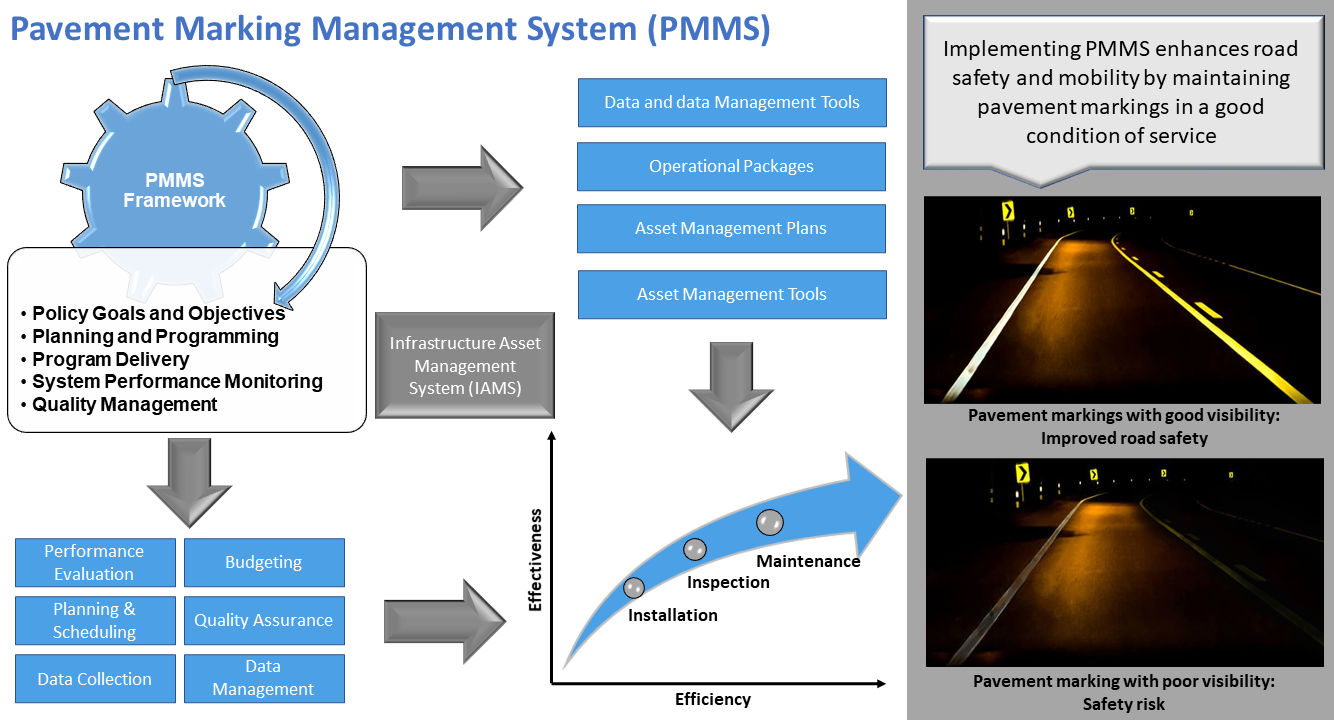
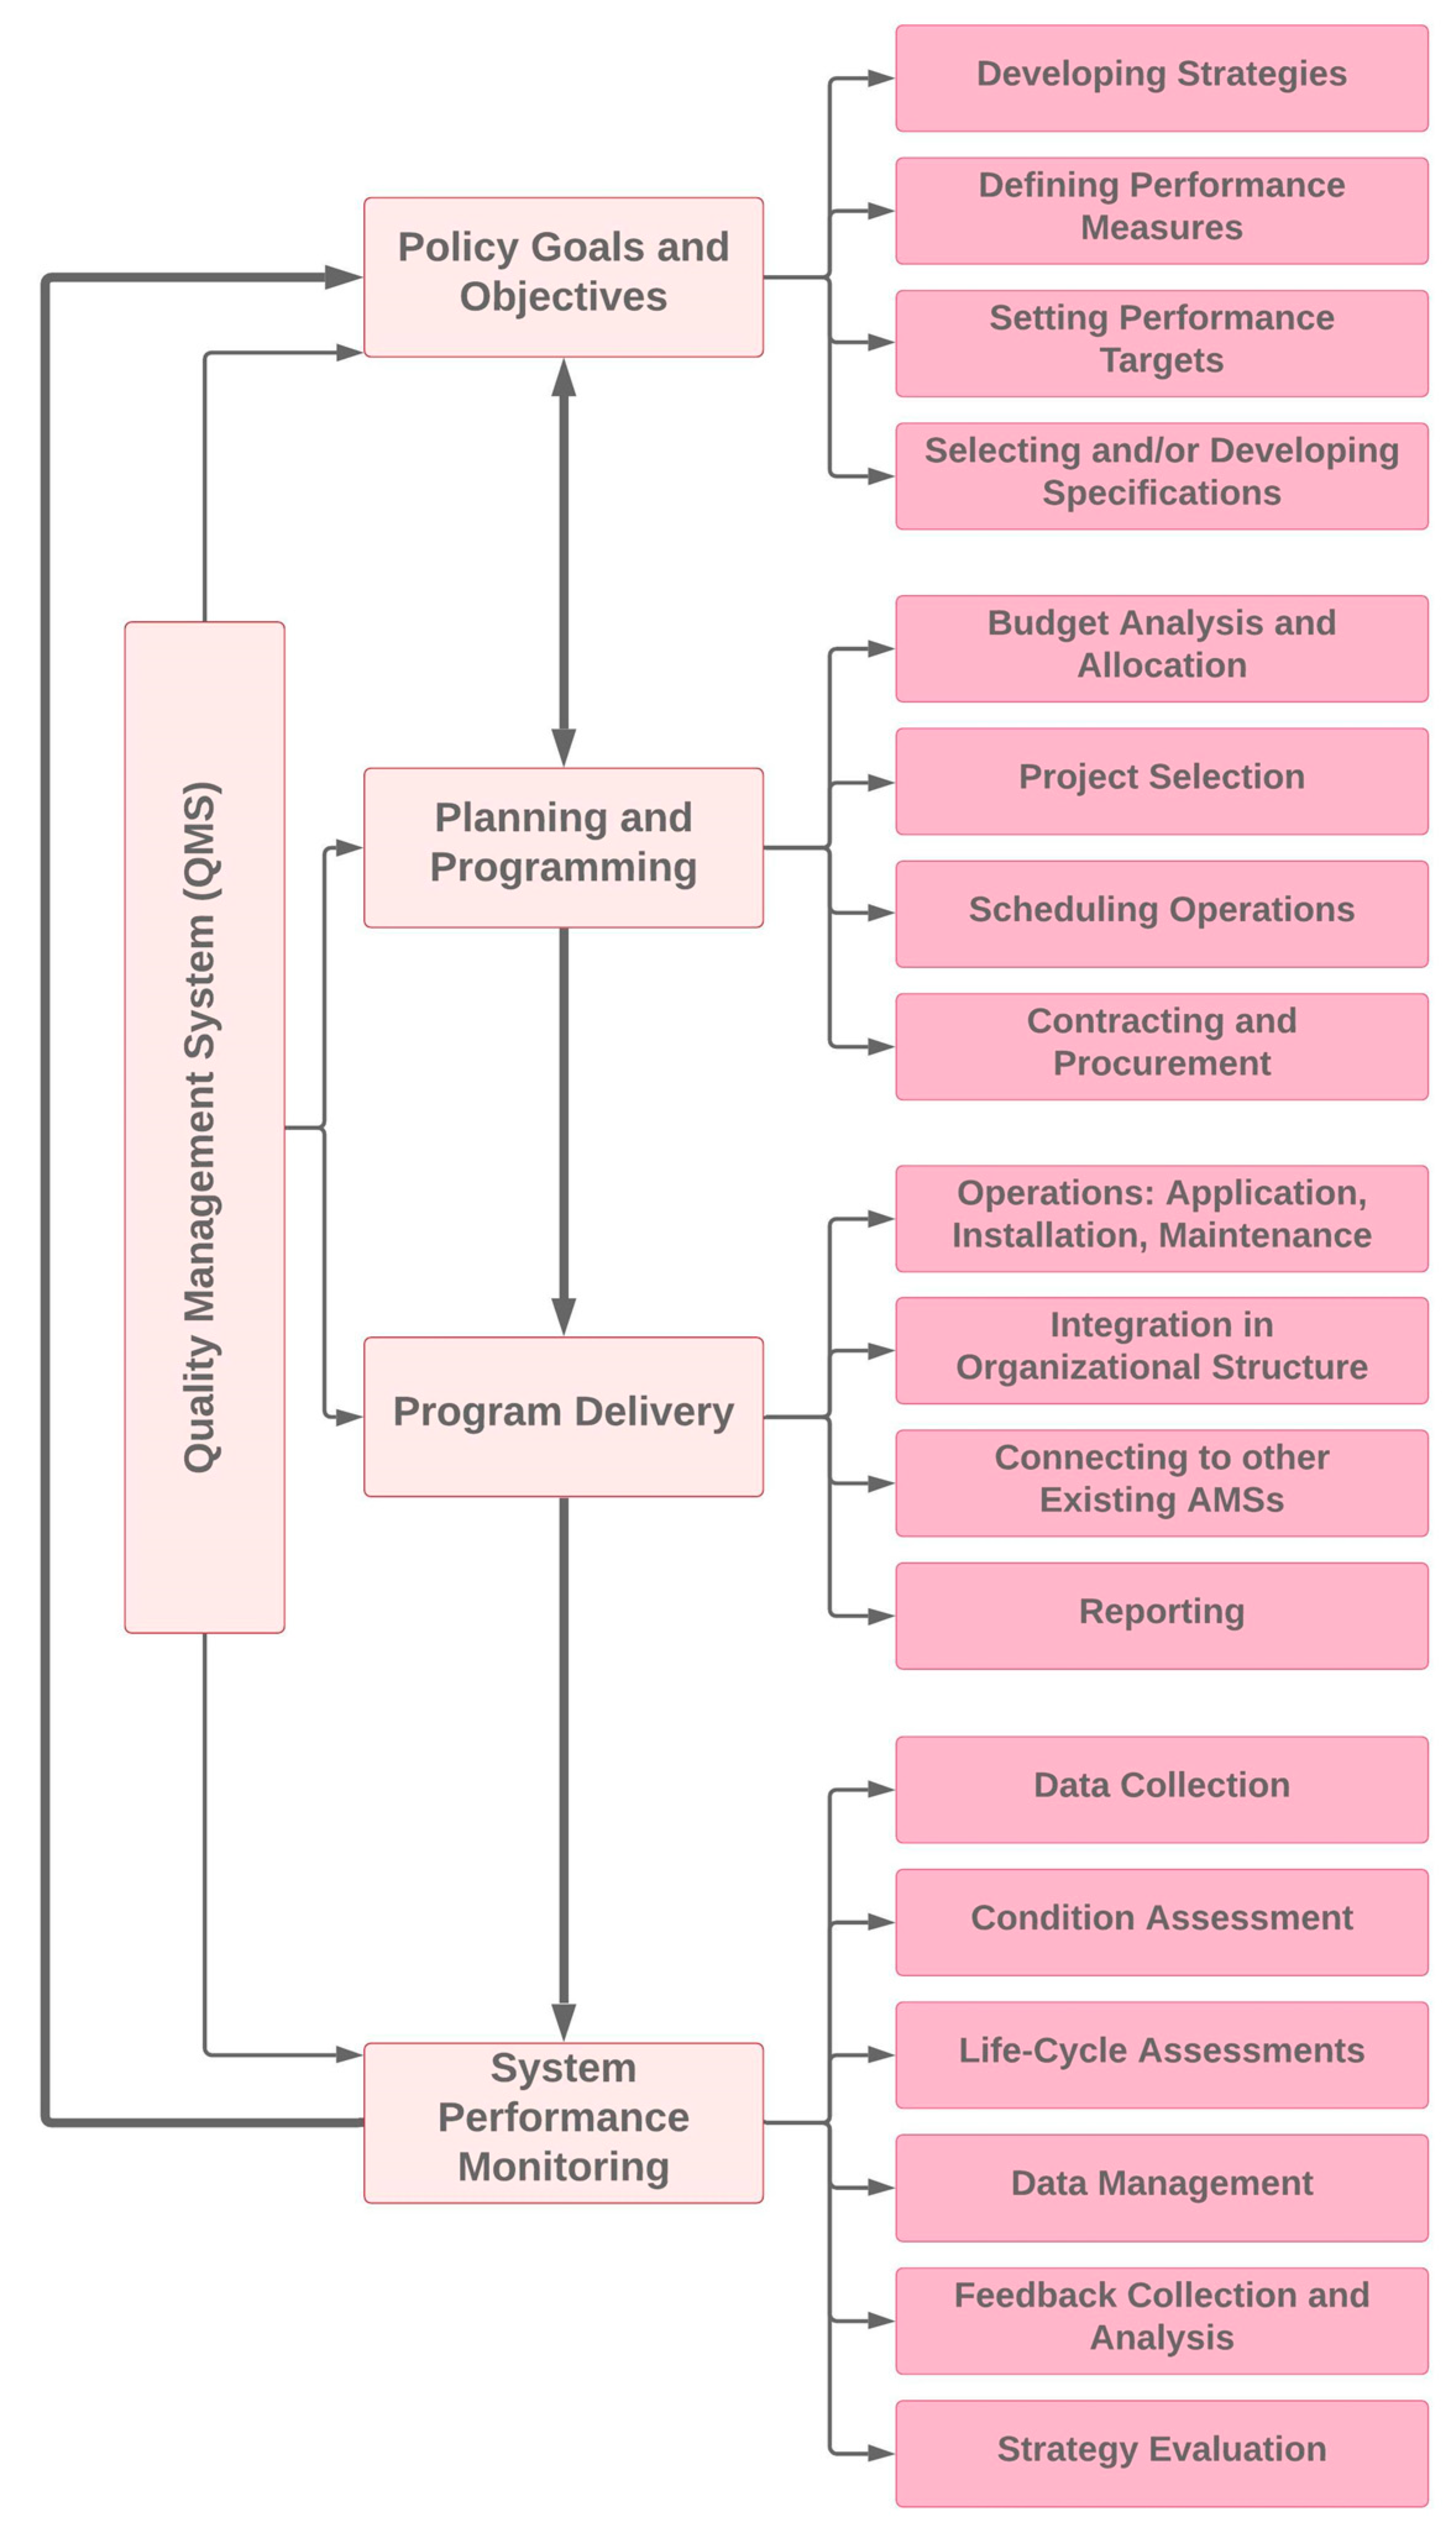
  • A general PMMS framework consists of five main building blocks to address (1) policy goals and objectives, (2) planning and programming, (3) program delivery, (4) system performance monitoring, and (5) quality management system, which oversees all the other four blocks. Each block consists of multiple elements that consist of asset management plans, processes, operations, data items, policies, standards, contracts, tools, and databases.
  • In addition to the existing cross-asset performance measures, such as the percentage of assets in good condition of service, this paper recommends five asset-specific performance measures for PMMS application: presence, retroreflectivity, durability, cost, and environmental impact. Retroreflectivity is an essential performance measure all PMMSs should consider. Any composite performance measures are better to be derivatives or combinations of these measures.
  • This paper acknowledges that the most immediate way of establishing performance targets for pavement markings is defining retroreflectivity thresholds. In the USA, retroreflectivity limits set by FHWA in Section 3A.03 of the MUTCD are the specifications to follow. However, it is recommended to continue research on the driver’s need for visual information, including retroreflectivity.
  • The PMMS framework encompasses data-driven strategies for project selection, budgeting, acquisition of goods and services, and contracting.
  • A critical function of PMMS to regulate contracts is defining the mechanism to oversee the acceptability of acquired products or services; this involves quality control and quality assurance processes and the specifications associated with them.
  • Developing a pavement marking application matrix is the recommended approach to selecting materials.
  • Inspection activities begin before the pavement marking installation and continue through the marking’s service life. The intervals of condition assessment inspections shall be shortened toward the end of the service life.
  • A PMMS should contain appropriate measures to ensure that durable marking installations are adequately tracked, performance models are modified to address durable markings, and rehabilitation/restriping of durable markings are carefully scheduled.
  • The data management component of PMMS must ensure that the data possess (1) positional accuracy, (2) attribute accuracy, (3) data lineage, (4) completeness, (5) consistency, and (6) appropriate data format. Once desirable data quality is achieved, the key activity is to select a suitable data structure or model for storing, processing, visualizing, and sharing the data.
  • The inventorying approach that best suits PMMS applications involves using a centralized asset inventory merged with the condition database. Minimum items covered by asset inventory are asset identification, location referencing, material description, site description, and asset quality.
  • A useful strategy to enable data integration and facilitate asset positioning is establishing a GPS-based location referencing system integrated with the GIS database.
  • Performance prediction in PMMS is equivalent to predicting retroreflectivity over time. To this end, marking deterioration curves are developed considering appropriate variables. This paper recommends giving a higher weight to winter maintenance operations in the performance prediction models.

5. Conclusions

This study identified asset management (AM) practices that best serve the purpose of pavement marking management and described a model framework for the pavement marking management system (PMMS). The paper discussed the critical moves and steps in developing and implementing PMMS based on the existing literature and the previous applications. The PMMS structure described herein contains the minimum recommended data items and processes to achieve an effective, efficient, and comprehensive AM plan for pavement markings. The items that were deemed most critical or most sensitive to the change of circumstances were discussed in detail to facilitate tailoring PMMS to agency needs. The primary research entailing this study will focus on modifying the performance models used in the Iowa Pavement Marking Management System (IPMMS) to achieve a higher accuracy level in predicting durable markings’ performance. Considering the recent trends in automated data collection and analysis, it is incredibly timely to develop guidelines and standard practices for incorporating novel pavement marking condition assessment methods—especially the image-based techniques—in PMMS. Future research shall contribute the required data for the safe and efficient application of automated pavement marking condition assessment techniques. Developing IT tools for the dynamic transfer of pavement marking data into the GIS database could provide agencies and organizations with considerable practical benefits. Embedding PMMS in a transportation agency’s operational structure likely warrants integration with the agency’s other asset management plans, especially a pavement management system (PMS). Hence, it would be timely for future studies to evaluate such interconnections’ potential impacts on the investment scenarios. Overall, considering the limited body of knowledge about PMMS implementation, it is an open topic offering vast research opportunities.

Author Contributions

Conceptualization, A.S., O.S. and N.H.; methodology, A.S., O.S. and N.H.; investigation, A.S.; resources, A.S., O.S. and N.H.; data curation, A.S.; writing—original draft preparation, A.S.; writing—review and editing, A.S., O.S. and N.H.; visualization, A.S.; supervision, O.S. All authors have read and agreed to the published version of the manuscript.

Funding

This research received no external funding.

Institutional Review Board Statement

Not Applicable.

Informed Consent Statement

Not Applicable.

Conflicts of Interest

The authors declare no conflict of interest.

References

  1. Markow, M.J. Current asset management practices applied to pavement markings. Transp. Res. Rec. 2008, 78–86. [Google Scholar] [CrossRef]
  2. Carlson, P.; Park, E.-S.; Pike, A.; Porter, R.J.; Miles, J.; Boulanger, B.; Smadi, O.; Hawkins, N.; Chalmers, S.; Darmiento, F.; et al. Pavement Marking Demonstration Projects: State of Alaska and State of Tennessee; No. FHWA-HRT-12-048; United States Federal Highway Administration, Office of Safety Research and Development: McLean, VA, USA, 2013.
  3. Hawkins, N.R.; Smadi, O.G.; Hans, Z.N. Planning, Developing, and Implementing the Iowa Pavement Marking Management System (IPMMS): Phases I and II; Center for Transportation Research and Education, Iowa State University: Ames, IA, USA, 2006. [Google Scholar]
  4. Rasdorf, W.; Hummer, J.E.; Harris, E.A.; Sitzabee, W.E. IT Issues for the Management of High-Quantity, Low-Cost Assets. J. Comput. Civ. Eng. 2009, 23, 91–99. [Google Scholar] [CrossRef]
  5. Akofio-Sowah, M.A.; Boadi, R.; Amekudz, A.; Meyer, M. Managing ancillary transportation assets: The state of the practice. J. Infrastruct. Syst. 2014, 20, 1–8. [Google Scholar] [CrossRef]
  6. Markow, M.J. NCHRP Synthesis 371-Managing Selected Transportation Assets: Signals, Lighting, Signs, Pavement Markings, Culverts, and Sidewalks; National Academies of Sciences, Engineering, and Medicine: Washington, DC, USA, 2007. [Google Scholar] [CrossRef]
  7. Choubane, B.; Sevearance, J.; Holzschuher, C.; Fletcher, J.; Wang, C.(R.). Development and Implementation of a Pavement Marking Management System in Florida. Transp. Res. Rec. 2018, 2672, 209–219. [Google Scholar] [CrossRef]
  8. Choubane, B. Leveraging Technology to Develop and Implement a Pavement Marking Management System in Florida; Number 317; Transportation Research Board of the National Academies of Science Engineering and Medicine: Washington, DC, USA, 2018; pp. 48–50. [Google Scholar]
  9. Hawkins, N.; Smadi, O.; Knickerbocker, S.; Pike, A.; Carlson, P. Evaluating All-Weather Pavement Markings in Illinois: Volume 1; Research Report No. FHWA-ICT-15-018; United States Federal Highway Administration: Ames, IA, USA, 2015.
  10. Federal Highway Administration. National Standards for Traffic Control Devices; the Manual on Uniform Traffic Control Devices for Streets and Highways; United States Federal Highway Administration: Washington, DC, USA, 2009.
  11. Migletz, J.; Fish, J.K.; Graham, J.L. Roadway Delineation Practices Handbook; No. FHWA-SA-93-001; United States Federal Highway Administration: Washington, DC, USA, 1994.
  12. Grant, A.R.; Bloomfield, J.R. Guidelines for the Use of Raised Pavement Markers; United States Federal Highway Administration, Office of Safety Research and Development: McLean, VA, USA, 1998.
  13. Turner, S.M.; Carlson, P.J. Pedestrian Crossing Guidelines for Texas; No. FHWA/TX-01/2136-2; Texas Department of Transportation: Austin, TX, USA, 2000.
  14. Lopez, C.A. Pavement Marking Handbook; Texas Department of Transportation: Austin, TX, USA, 2004.
  15. Chacon, M.A. Sign Guidelines and Applications Manual; Texas Department of Transportation: Austin, TX, USA, 2020.
  16. Zhang, Y. Pavement Marking Management System Database; 0-5548-P1; Texas Transportation Institute, The Texas A&M University System: College Station, TX, USA, 1999. [Google Scholar]
  17. Smadi, O. Putting Research into Practice: Pavement Marking Management Tool; Minnesota Department of Transportation: St. Paul, MN, USA, 2013.
  18. Hawkins, N.; Smadi, O. Developing and Implementing Enhanced Pavement Marking Management Tools: Phase I—Mapping Tool; Minnesota Department of Transportation: St. Paul, MN, USA, 2008.
  19. Hawkins, N.; Smadi, O. Local Agency Pavement Marking Plan; No. IHRB Project TR-55; Iowa Highway Research Board: Ames, IA, USA, 2010.
  20. Hawkins, N.; Smadi, O.; Hans, Z.; Maze, T.H. Integrated approach to pavement marking management. Transp. Res. Rec. 2006, 99–107. [Google Scholar] [CrossRef]
  21. Pavement Marking Manual; Wyoming Department of Transportation: Cheyenne, WY, USA, 2012. Available online: http://www.dot.state.wy.us/files/live/sites/wydot/files/shared/Traffic%20data/Pavement%20Marking%20Manual.pdf (accessed on 10 November 2020).
  22. Guideline for the Installation of Crosswalk Markings and Pedestrian Signing at Marked and Unmarked Crossings; Vermont Agency of Transportation: Montpelier, VT, USA, 2004. Available online: https://casetext.com/regulation/vermont-administrative-code/agency-14-agency-of-transportation/subagency-010-transportation-board/chapter-018-guideline-for-the-installation-of-crosswalk-markings-and-pedestrian-signs-at-marked-and-unmarked-crossings (accessed on 10 November 2020).
  23. Uddin, W.; Hudson, W.R.; Haas, R.C. Public Infrastructure Asset Management, 2nd ed.; McGraw-Hill Education: New York, NY, USA, 2013. [Google Scholar]
  24. Gordon, M.; Smith, G.J.; Thompson, P.D.; Park, H.A.; Harrison, F.; Elston, B. AASHTO Transportation Asset Management Guide—A Focus on Implementation; American Association of State Highway and Transportation Officials (AASHTO): Washington, DC, USA, 2013. [Google Scholar]
  25. NCHRP Report 632: An Asset-Management Framework for the Interstate Highway System; The National Academies Press: Washington, DC, USA, 2009; Available online: https://www.nap.edu/catalog/14233/an-asset-management-framework-for-the-interstate-highway-system (accessed on 10 November 2020). [CrossRef]
  26. Vanier, D.J. Advanced Asset Management: Tools and Techniques; Innovations in Urban Infrastructure Seminar; American Public Works Association (APWA): Kansas City, MO, USA, 2000; pp. 39–56. [Google Scholar]
  27. NCHRP 551: Performance Measures and Targets for Transportation Asset Management; The National Academies Press: Washington, DC, USA, 2006. Available online: https://www.trb.org/publications/nchrp/nchrp_rpt_551.pdf (accessed on 10 November 2020).
  28. Morse, K.; Armstrong, K. Pavement Marking Selection, Installation and Inspection Manual; Illinois Department of Transportation Bureau of Materials and Physical Research Bureau of Operations: Springfield, IL, USA, 2015. Available online: https://idot.illinois.gov/Assets/uploads/files/Doing-Business/Manuals-Guides-&-Handbooks/Highways/Operations/Pavement%20Marking%20Selection,%20Installation%20and%20Inspection%20Manual.pdf (accessed on 10 November 2020).
  29. Transportation Research Circular E-C098: Maintenance Management; Transportation Research Board of the National Academies of Science Engineering and Medicine: Washington, DC, USA, 2006. Available online: http://onlinepubs.trb.org/onlinepubs/circulars/ec098.pdf (accessed on 10 November 2020).
  30. Martin, P.; Perrin, J.; Jitprasithsiri, S.; Hansen, B. A Comparative Analysis of the Alternative Pavement Marking Materials for the State of Utah; Salt Lake City, UT, USA, 1990. Available online: http://www.trafficlab.utah.edu/research/projects/current/acrobat/UDOTfin.pdf (accessed on 10 November 2020).
  31. Pike, A.; Songchitruksa, P.; Geedipally, S.; Kang, D.; Damnjanovic, I. Evaluating the Effectiveness of Performance Based Pavement Marking Maintenance Contracts; Texas, Report No. FHWA/TX-14/0-6705-1; Texas Department of Transportation: Austin, TX, USA, 2014.
  32. Parker, N.A.; Meja, M.S.J. Evaluation of Performance of Permanent Pavement Markings. Transp. Res. Rec. 2003, 123–132. [Google Scholar] [CrossRef]
  33. Zhang, D.; Xu, X.; Lin, H.; Gui, R.; Cao, M.; He, L. Automatic road-marking detection and measurement from laser-scanning 3D profile data. Autom. Constr. 2019, 108. [Google Scholar] [CrossRef]
  34. Alyami, Z.; Tighe, S.L. A methodology for integrating asset valuation in transportation asset management. In Proceedings of the 11th International Transportation Specialty Conference at the Canadian Society of Civil Engineers CSCE, London, ON, Canada, 1–4 June 2016. [Google Scholar]
  35. Pike, A.M.; Bommanayakanahalli, B. Development of a Pavement Marking Life Cycle Cost Tool. Transp. Res. Rec. 2018, 2672, 148–157. [Google Scholar] [CrossRef] [Green Version]
  36. Lundkvist, S.-O.; Johansen, T.C. Road Marking Management System; The Swedish National Road and Transport Research Institute (VTI): Linköping, Sweden, 2009.
  37. National Volatile Organic Compound Emission Standards for Architectural Coatings–Background for Promulgated Standards; United States Environmental Protection Agency (US EPA): Chicago, IL, USA, 1998. Available online: https://www.federalregister.gov/documents/2008/03/24/E8-5589/national-volatile-organic-compound-emission-standards-for-aerosol-coatings (accessed on 10 November 2020).
  38. Rasdorf, W.J.; Hummer, J.E.; Zhang, G.; Sitzabee, W.E. Pavement Marking Performance Analysis; North Carolina Department of Transportation: Raleigh, NC, USA, 2009.
  39. Andrady, A.L. Pavement Marking Materials: Assessing Environment-Friendly Performance; NCHRP Report 392; National Academy Press: Washington, DC, USA, 1997. [Google Scholar]
  40. Schnell, T.; Zwahlen, H.T. Computer-Based Modeling to Determine the Visibility and Minimum Retroreflectivity of Pavement Markings. Transp. Res. Rec. 2000, 47–60. [Google Scholar] [CrossRef]
  41. Saetern, L.T. Commercial Pavement Marking Management Systems; California Department of Transportation (Caltrans): Sacramento, CA, USA, 2016.
  42. Loetterle, F.E.; Beck, R.A.; Carlson, J. Public perception of pavement-marking brightness. Transp. Res. Rec. J. Transp. Res. Board. 2000, 1715, 51–59. [Google Scholar] [CrossRef]
  43. Abboud, N.; Bowman, B.L. Cost-and longevity-based scheduling of paint and thermoplastic striping. Transp. Res. Rec. 2002, 55–64. [Google Scholar] [CrossRef]
  44. Damnjanovic, I.; Pike, A.; Martinez, E. Analysis of Performance-Based Pavement Markings and Markers Contracts: Case Study from San Antonio. J. Manag. Eng. 2018, 34, 1–10. [Google Scholar] [CrossRef]
  45. Thomas, G.B.; Schloz, C. Durable, Cost-Effective Pavement Markings. Phase I: Synthesis of Current Research; Ames, IA, USA, 2001. Available online: http://publications.iowa.gov/13585/1/pavemark.pdf (accessed on 10 November 2020).
  46. Rich, M.J.; Maki, R.E.; Morena, J. Development of a pavement marking management system: Measurement of glass sphere loading in retroreflective pavement paints. Transp. Res. Rec. 2002, 49–54. [Google Scholar] [CrossRef]
  47. Sitzabee, W.E.; Rasdorf, W.; Hummer, J.E.; Devine, H.A. Data Integration of Pavement Markings: A Case in Transportation Asset Management. J. Comput. Civ. Eng. 2009, 23, 288–298. [Google Scholar] [CrossRef]
  48. Rasdorf, W.; Cai, H.; Tilley, C.; Brun, S.; Karimi, H.; Robson, F. Transportation distance measurement data quality. J. Comput. Civ. Eng. 2003, 17, 75–87. [Google Scholar] [CrossRef]
  49. Cunningham, C.M.; Findley, D.J.; Hovey, K.; Foley, P.B.; Smith, J.; Fowler, T.; Chang, J.; Arnold, J.; Hummer, J.E. Improved asset management and inventory development through sample analysis and vendor-client communication. J. Infrastruct. Syst. 2016, 22, 1–16. [Google Scholar] [CrossRef]
  50. Longley, P.A.; Goodchild, M.F.; Maguire, D.J.; Rhind, D.W. Geographic Information Science and Systems, 4th ed.; Wiley: London, UK, 2015. [Google Scholar]
  51. Zhang, Y. User’s Guide: Pavement Marking Management System Database; Texas Transportation Institute, The Texas A&M University System: College Station, TX, USA, 2011. [Google Scholar]
  52. Sasidharan, L.; Karwa, V.; Donnell, E.T. Use of pavement marking degradation models to develop a pavement marking management system. Public Work. Manag. Policy 2009, 14, 148–173. [Google Scholar] [CrossRef]
  53. Bektas, B.A.; Gkritza, K.; Smadi, O. Pavement Marking Retroreflectivity and Crash Frequency: Segmentation, line type, and imputation effects. J. Transp. Eng. 2016, 142, 04016030. [Google Scholar] [CrossRef]
  54. Ozelim, L.; Turochy, R.E. Modeling retroreflectivity performance of thermoplastic pavement markings in Alabama. J. Transp. Eng. 2014, 140, 1–6. [Google Scholar] [CrossRef]
  55. Karwa, V.; Donnell, E.T. Predicting pavement marking retroreflectivity using artificial neural networks: Exploratory analysis. J. Transp. Eng. 2010, 137, 91–103. [Google Scholar] [CrossRef]
  56. Migletz, J.; Graham, J.L.; Harwood, D.W.; Bauer, K.M. Service life of durable pavement markings. Transp. Res. Rec. J. Transp. Res. Board. 2002, 1749, 13–21. [Google Scholar] [CrossRef]
  57. Kopf, J. Reflectivity of Pavement Markings: Analysis of Retroreflectivity Degradation Curves; No. WA-RD 592.1; Washington State Department of Transportation: Olympia, WA, USA, 2004.
  58. Barri, K.; Jahangiri, B.; Davami, O.; Buttlar, W.G.; Alavi, A.H. Smartphone-based molecular sensing for advanced characterization of asphalt concrete materials. Measurement 2020, 151, 107212. [Google Scholar] [CrossRef]
  59. NCHRP Report 545: Analytical Tools for Asset Management; The National Academies Press: Washington, DC, USA, 2005; Available online: https://www.nap.edu/catalog/13851/analytical-tools-for-asset-management (accessed on 10 November 2020). [CrossRef]
Figure 1. Key components of the pavement marking management system (PMMS) framework.
Infrastructures 06 00018 g001
Figure 2. Major factors affecting pavement marking durability.
Infrastructures 06 00018 g002
Figure 3. The primary pavement-marking performance measures.
Infrastructures 06 00018 g003
Figure 4. PMMS elements for quality management in the acquisition of goods and services.
Infrastructures 06 00018 g004
Figure 5. Timeline of pavement marking inspections [the figure is not to the scale].
Infrastructures 06 00018 g005
Figure 6. Minimum recommended layers of data in a PMMS data management platform.
Infrastructures 06 00018 g006
Table 1. Retroreflectivity limits set by the federal highway administration (FHWA) in The Manual on Uniform Traffic Control Devices (MUTCD).
Road CategorySpeed Limit (mph)
≤3035–50≥50
Minimum Retroreflectivity Measured acc. to Standard (mcd/m2/lux)
Two-lane roads with centerline markings onlyN/A100250
All other roadsN/A50100
Table 2. Key components of the material selection process in a PMMS.
ScopeTaskControlling Ellement (in the PMMS) Data Items or Factors
GeneralApproving the materialsStandards and specsPhysical and chemical properties
Performance targetsPerformance measures
Policy goalsPerformance measures
ProjectSelecting the materials and application methods
  • Application matrix
  • Material Compatibility matrix
  • Marking-removal method selection table
Remaining service life of pavement
Environmental conditions
Type of operation
  • New installation
  • Restriping
Type of marking
  • Intended function
  • Alignment
  • Marking elevation and thickness
Traffic characteristics
  • Volume (ADT)
  • Type of vehicles
Route characteristics
  • Hierarchical class
  • Speed characteristics
  • Location/region
Underlying surfacePavement or pre-existing marking:
  • Type or material
  • Condition
  • Surface texture
Table 3. Inspection items for pavement marking installation and maintenance.
Pre-InstallationEnvironment and Road ConditionsLogistics and Operations
  • Surface moisture
  • Humidity
  • Dirt and debris presence on pavement surface
  • Surface condition/roughness
  • Ambient and pavement temperature
  • Wind velocity
  • Lateral placement guides for new pavement surfaces
  • Traffic control requirements
  • Inspection of striping equipment
  • Inspection of safety equipment
  • Inspection items specific to material or pavement type
  • Inspection items specific to location
In-InstallationQuality Assurance (Procedure Monitoring)Quality Control of Markings
  • Material application rate
  • Reflective media (beads) application rate
  • Reflective media (beads) loading
  • Material temperature
  • Wet thickness
  • Width
  • Appearance and color
  • Alignment
  • Visual assessment
  • Reflective media (bead) content
Post-InstallationInspection Immediately After Installation: Quality ControlPeriodic Inspection During Service Life: Condition Assessment
  • Thickness
  • Width
  • Appearance and color
  • Alignment
  • Reflective media (bead) content
  • Retroreflectivity
  • Other performance applicable measures
  • Evaluating retroreflectivity and, if applicable, other performance measures
  • Performing visual inspection and assessing pavement marking presence
Table 4. Components of the recommended pavement marking inventory.
#Inventory ComponentData ItemsTypical Data Type
1Asset IDType of Marking 1, Project Name, Operator/Contractor Name Text 2
Installation Date and TimeNumber (Date/Time)
2Location Referencing Road ID, Coordinates in the Location Referencing System (GPS/LRS)Number
District, County, Route, MileSpotText/Number
3Material DescriptionProduct Commercial Name, Manufacturer Name, Material Type 1, Installation Method 1Text
Product ID, Manufacturer IDNumber/Text
Technical Datasheets and SDSsText/Link or File Attachment
4Site DescriptionInstallation Length, Location Reference of Installation Start–End Points, Traffic Volume (ADT), Speed Limit, Pavement Age, Truck PercentageNumber
Road ID, Surface Type 1, Surface ConditionText
5Quality Current condition and performance level categorized as per performance measures and targets, Qualitative MeasuresText and/or Link to Inspections Database 3
Quantitative MeasuresNumber/Link to Database
Condition IndicatorText/Number
6Performance MeasuresDefined or Selected Performance MeasuresText
7Performance TargetsDefined or Adopted Performance Targets corresponding to Each Performance MeasureText and Number
8Minimum StandardsControlling StandardsText/File Attachments/Links
Minimum Acceptable Condition as per Qualitative MeasuresText
Minimum Standard Values for Quantitative Performance MeasuresNumber
9Projected PerformanceLife Cycle Prediction Number/Image/Link to IT Tool or Database
Projected rehabilitation or replacement schedule Number (Date/Time)
10Marking Application RecordsInstallation and/or Rehabilitation Operation Logs 1Text/Link or File Attachment
11Winter Maintenance ExposureAnnual Record of Winter Maintenance Operations the Asset Has Been Exposed to Since InstallationText/Number/Link to Database
Winter Maintenance Exposure Severity CategoryText
12Decision ActionsN/A 1Text
13DescriptionsN/A 1Text
14MultimediaN/A 1Image/Video
1 See explanations in this Section 3.7.3; 2 Coded variables are considered as text data; 3 Links are categorized as text data which, in its IT definition, would be string data. Here, they have been distinguished from text to emphasize that they link the inventory database to other components of PMMS databases such as databases and IT tools.
Publisher’s Note: MDPI stays neutral with regard to jurisdictional claims in published maps and institutional affiliations.

