
Impact of Rainfall-Induced Landslide Susceptibility Risk on Mountain Roadside in Northern Thailand


 , , ,
, , ,  and
and 
Abstract
:1. Introduction
2. Factors That Impact Landslide Risk
2.1. Type of Land Cover
2.2. Physiographic Classifications
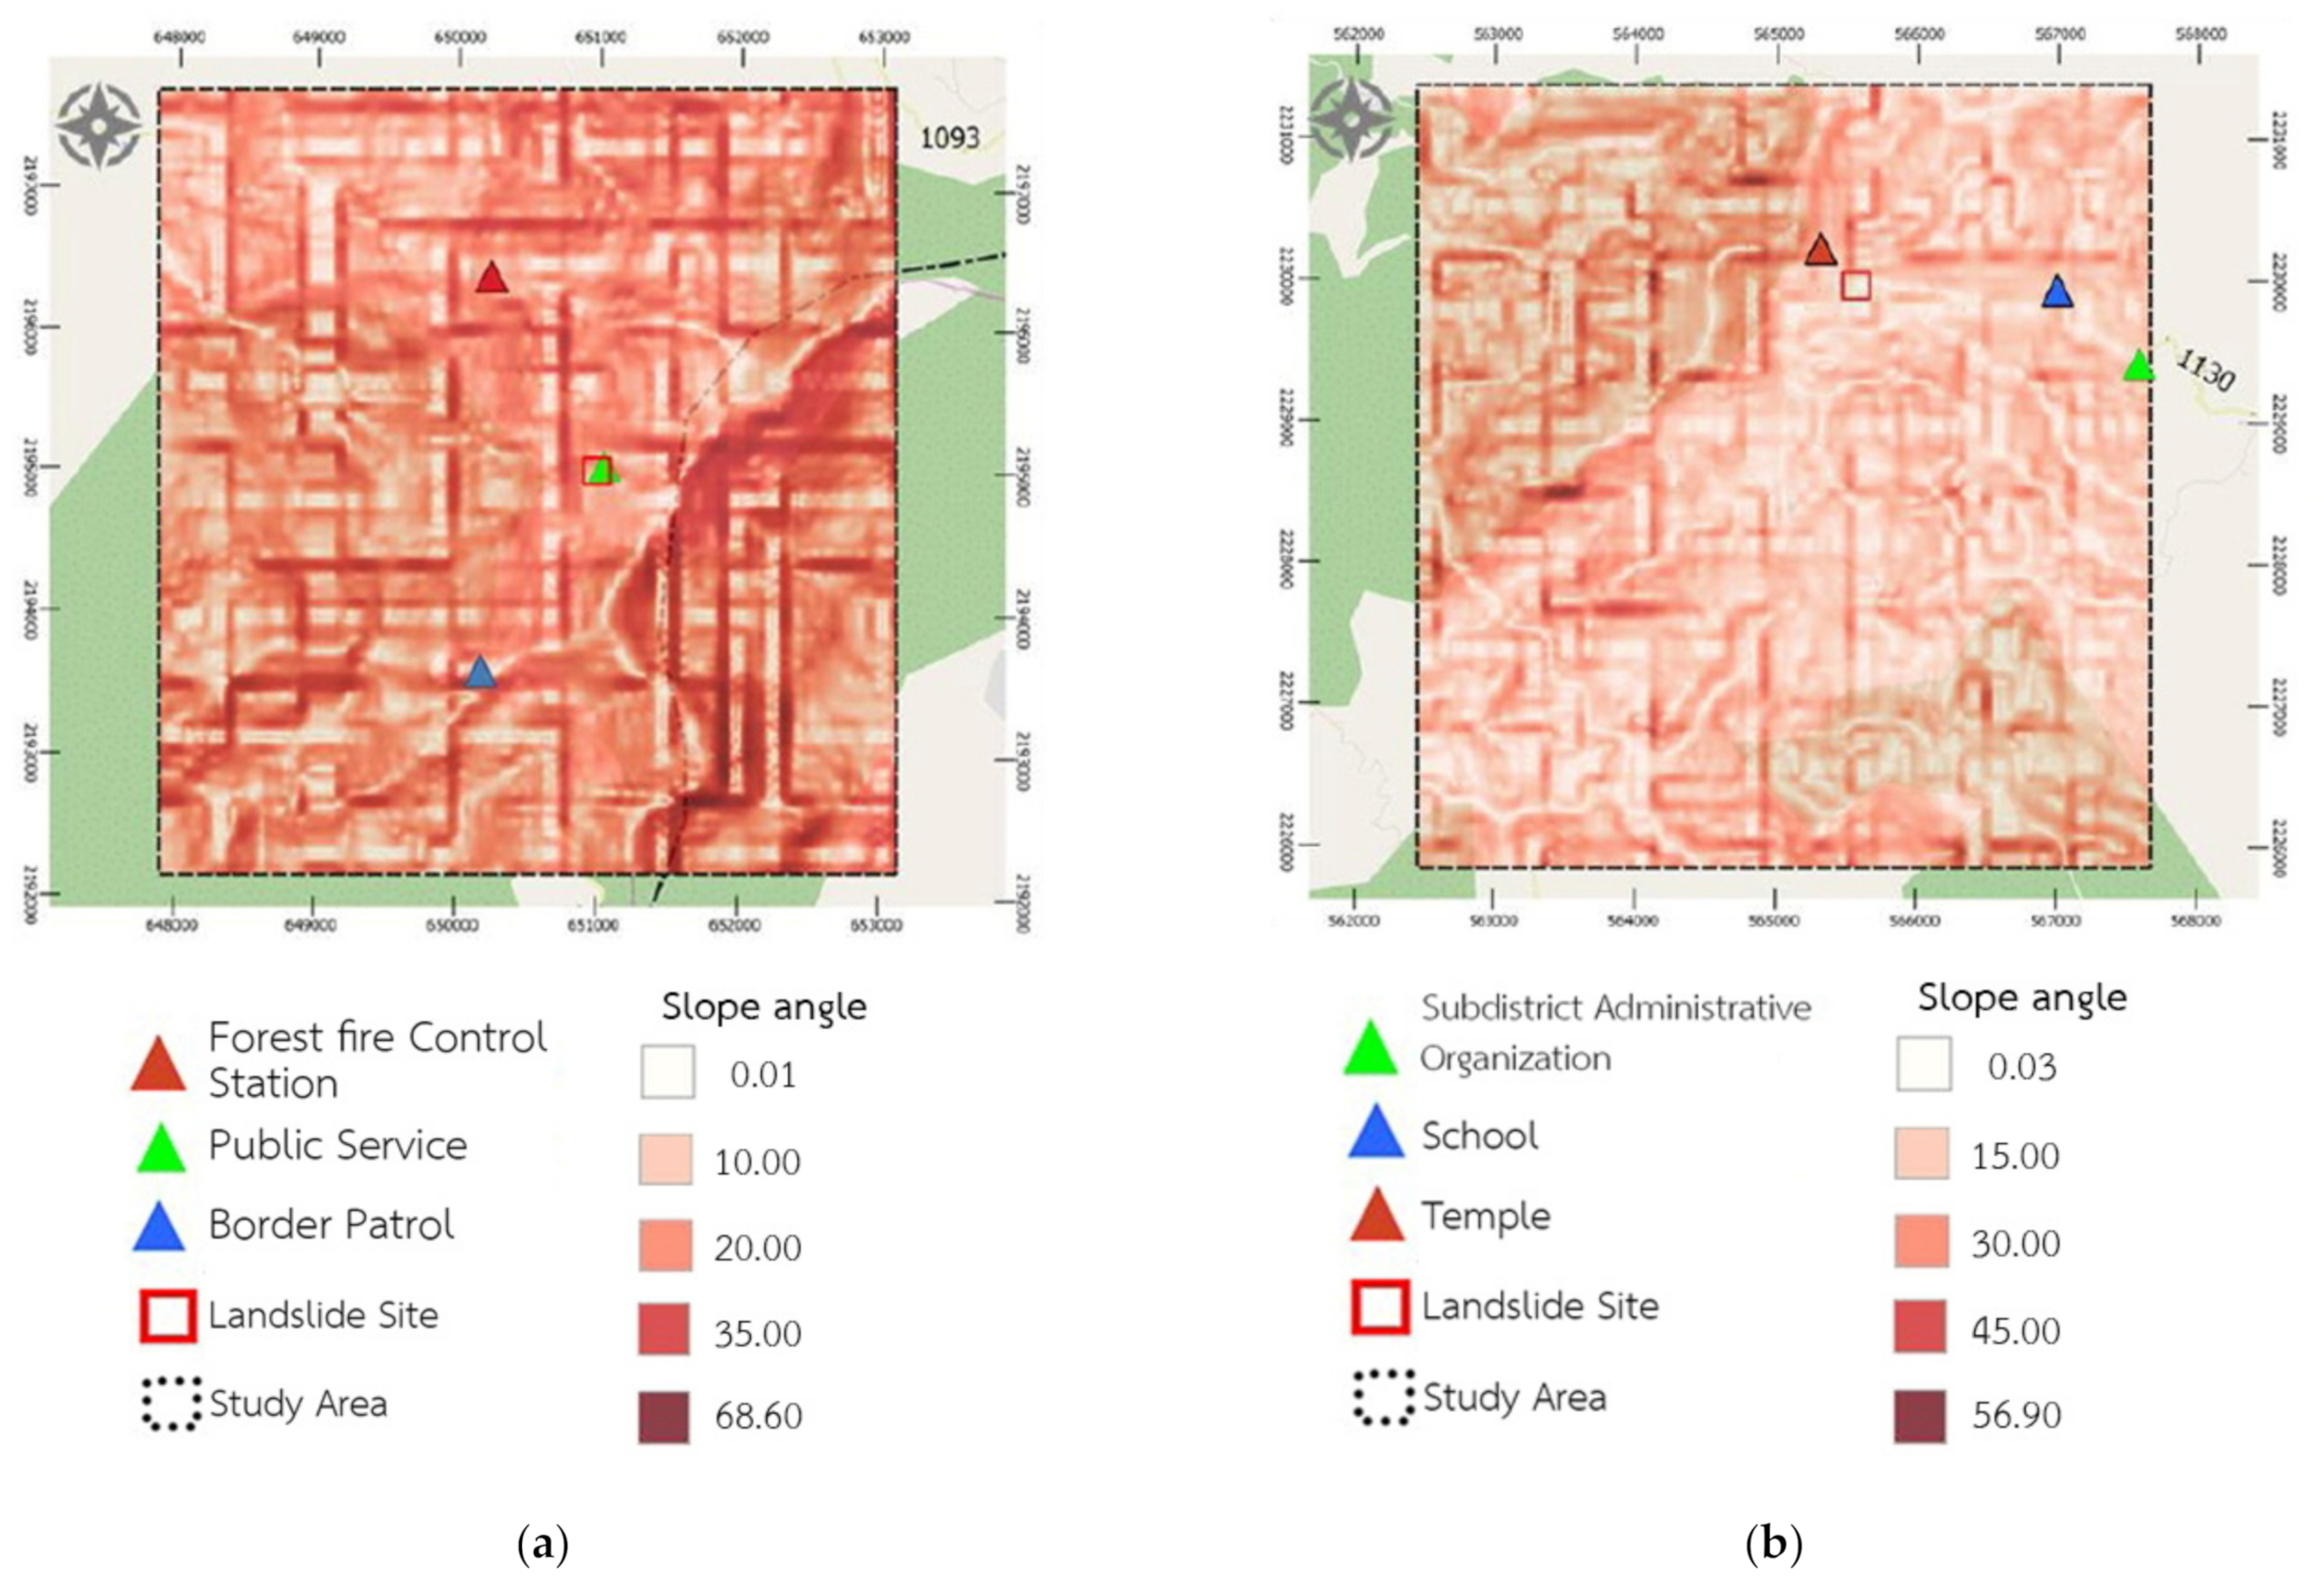
2.3. Slope Angle
2.4. Amount of Rainfall
3. Modeling Techniques
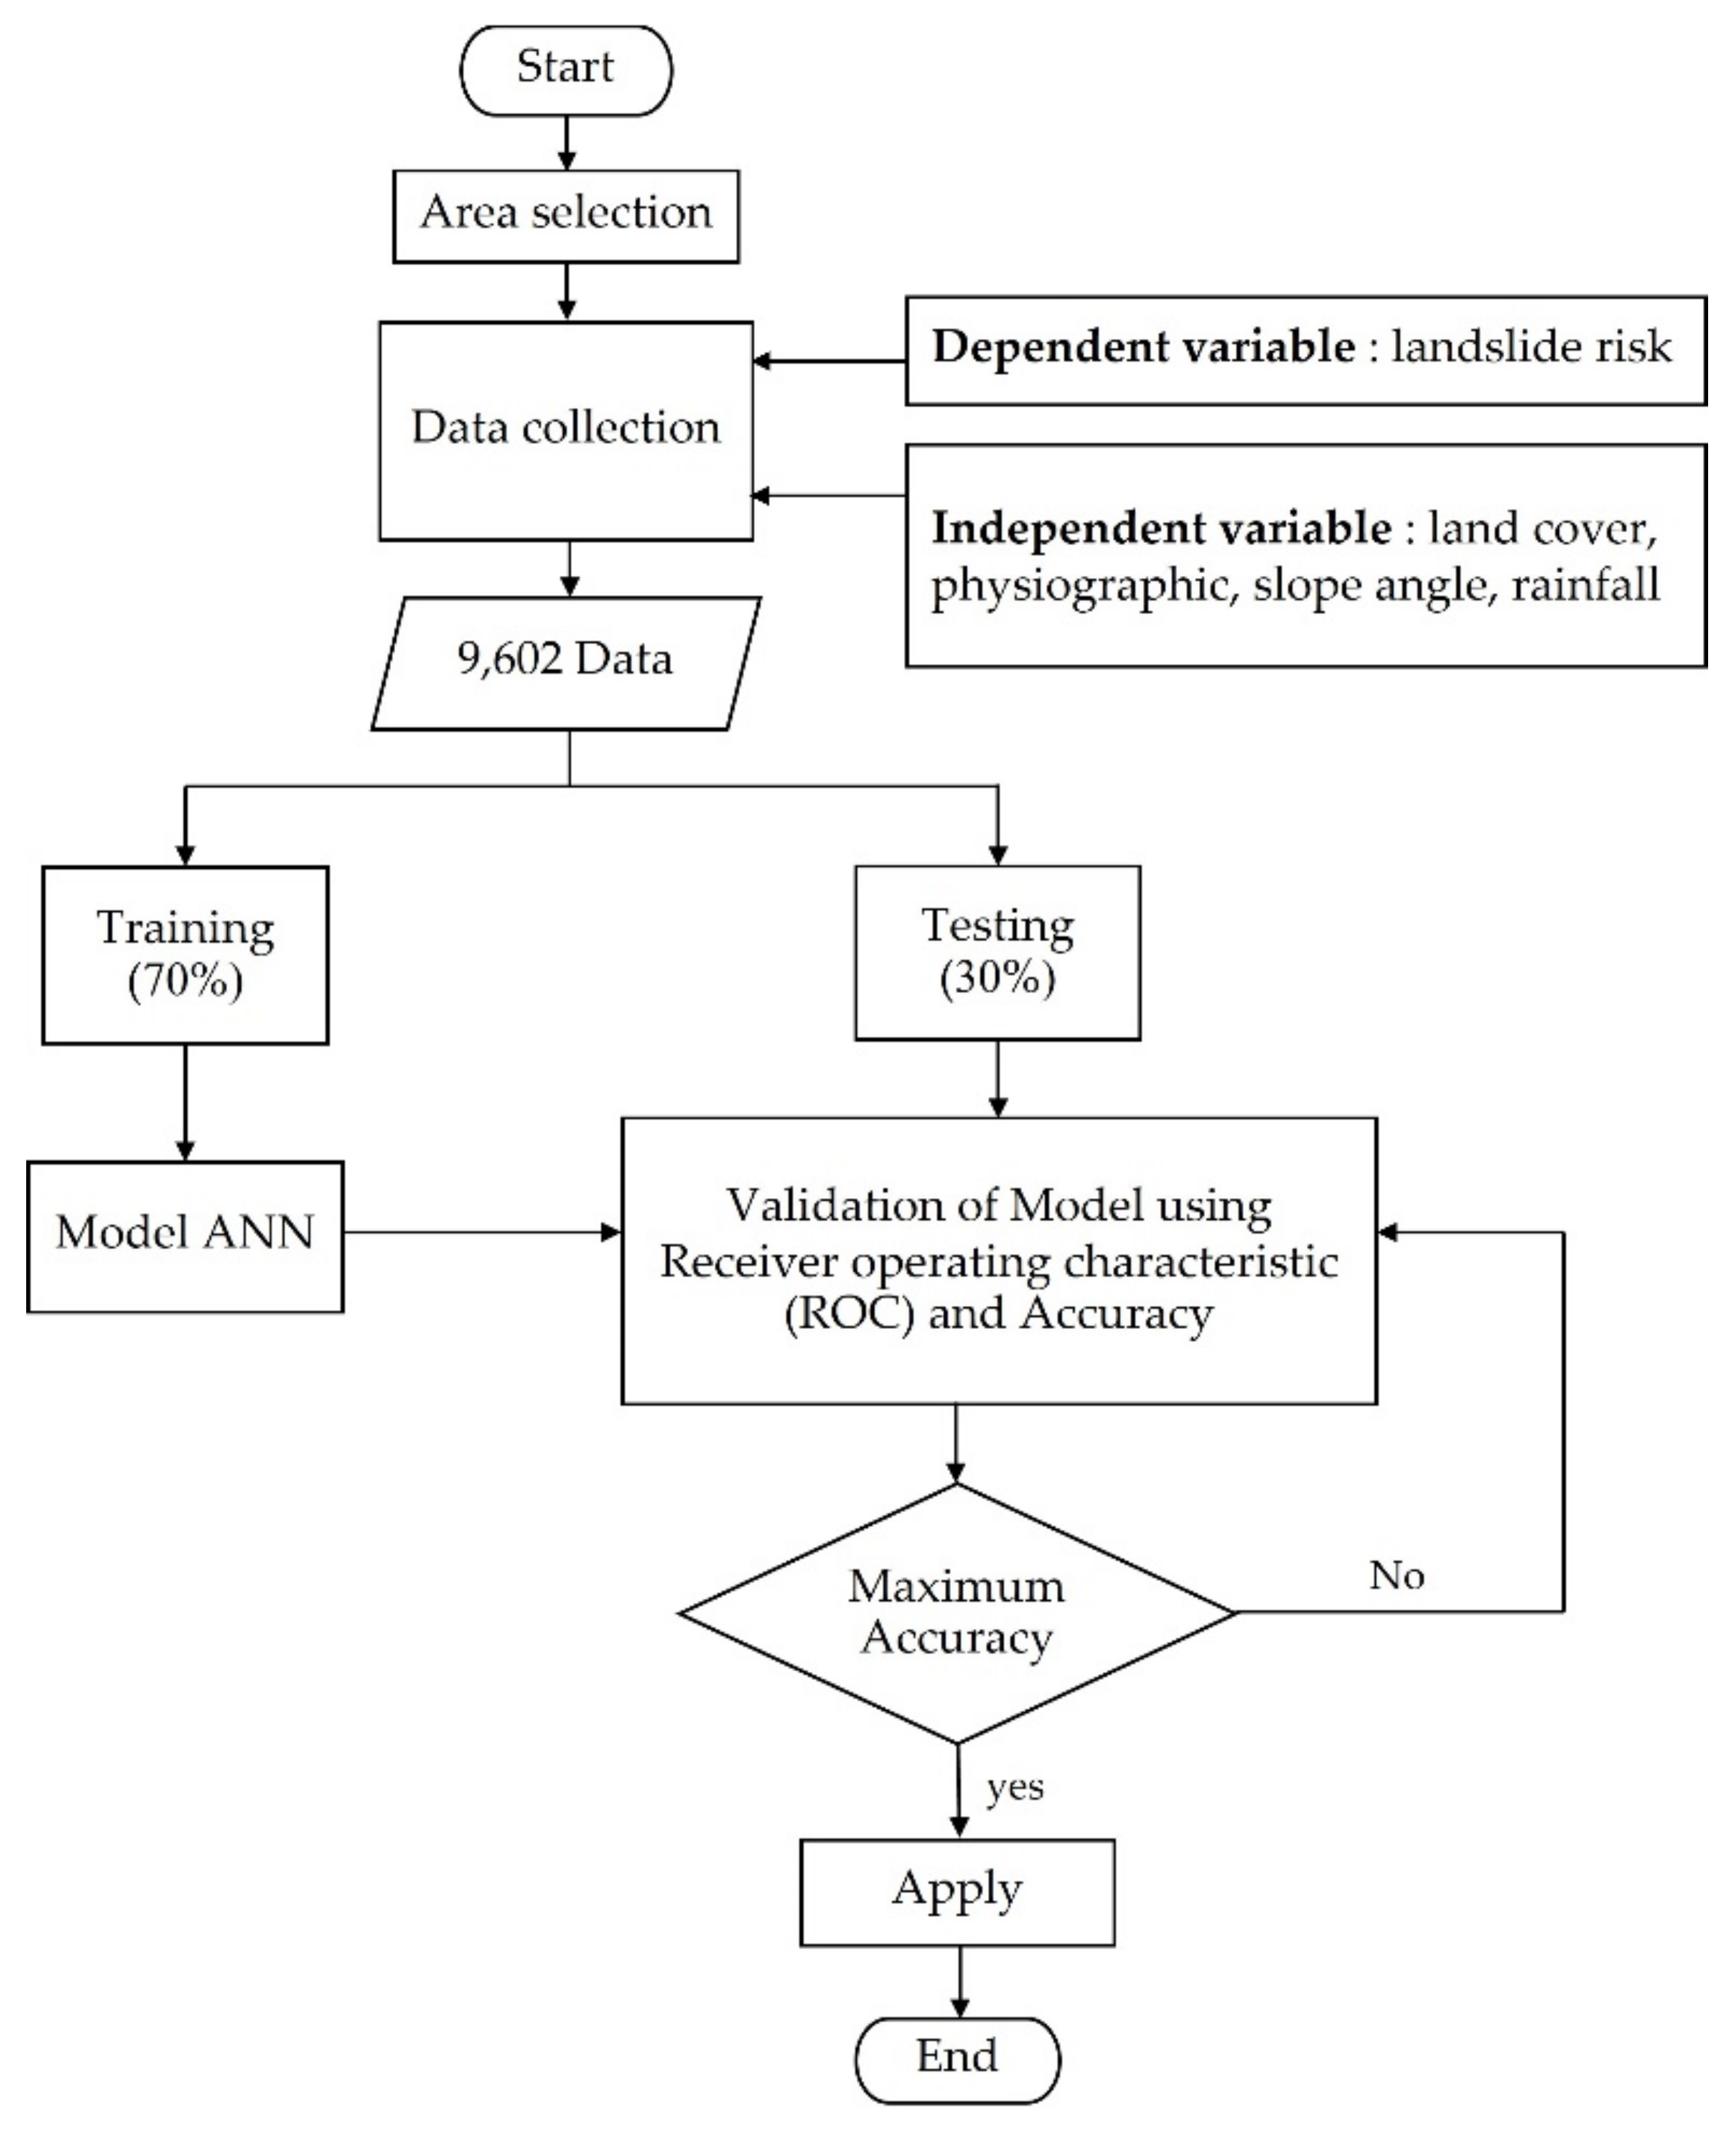
4. Methodology
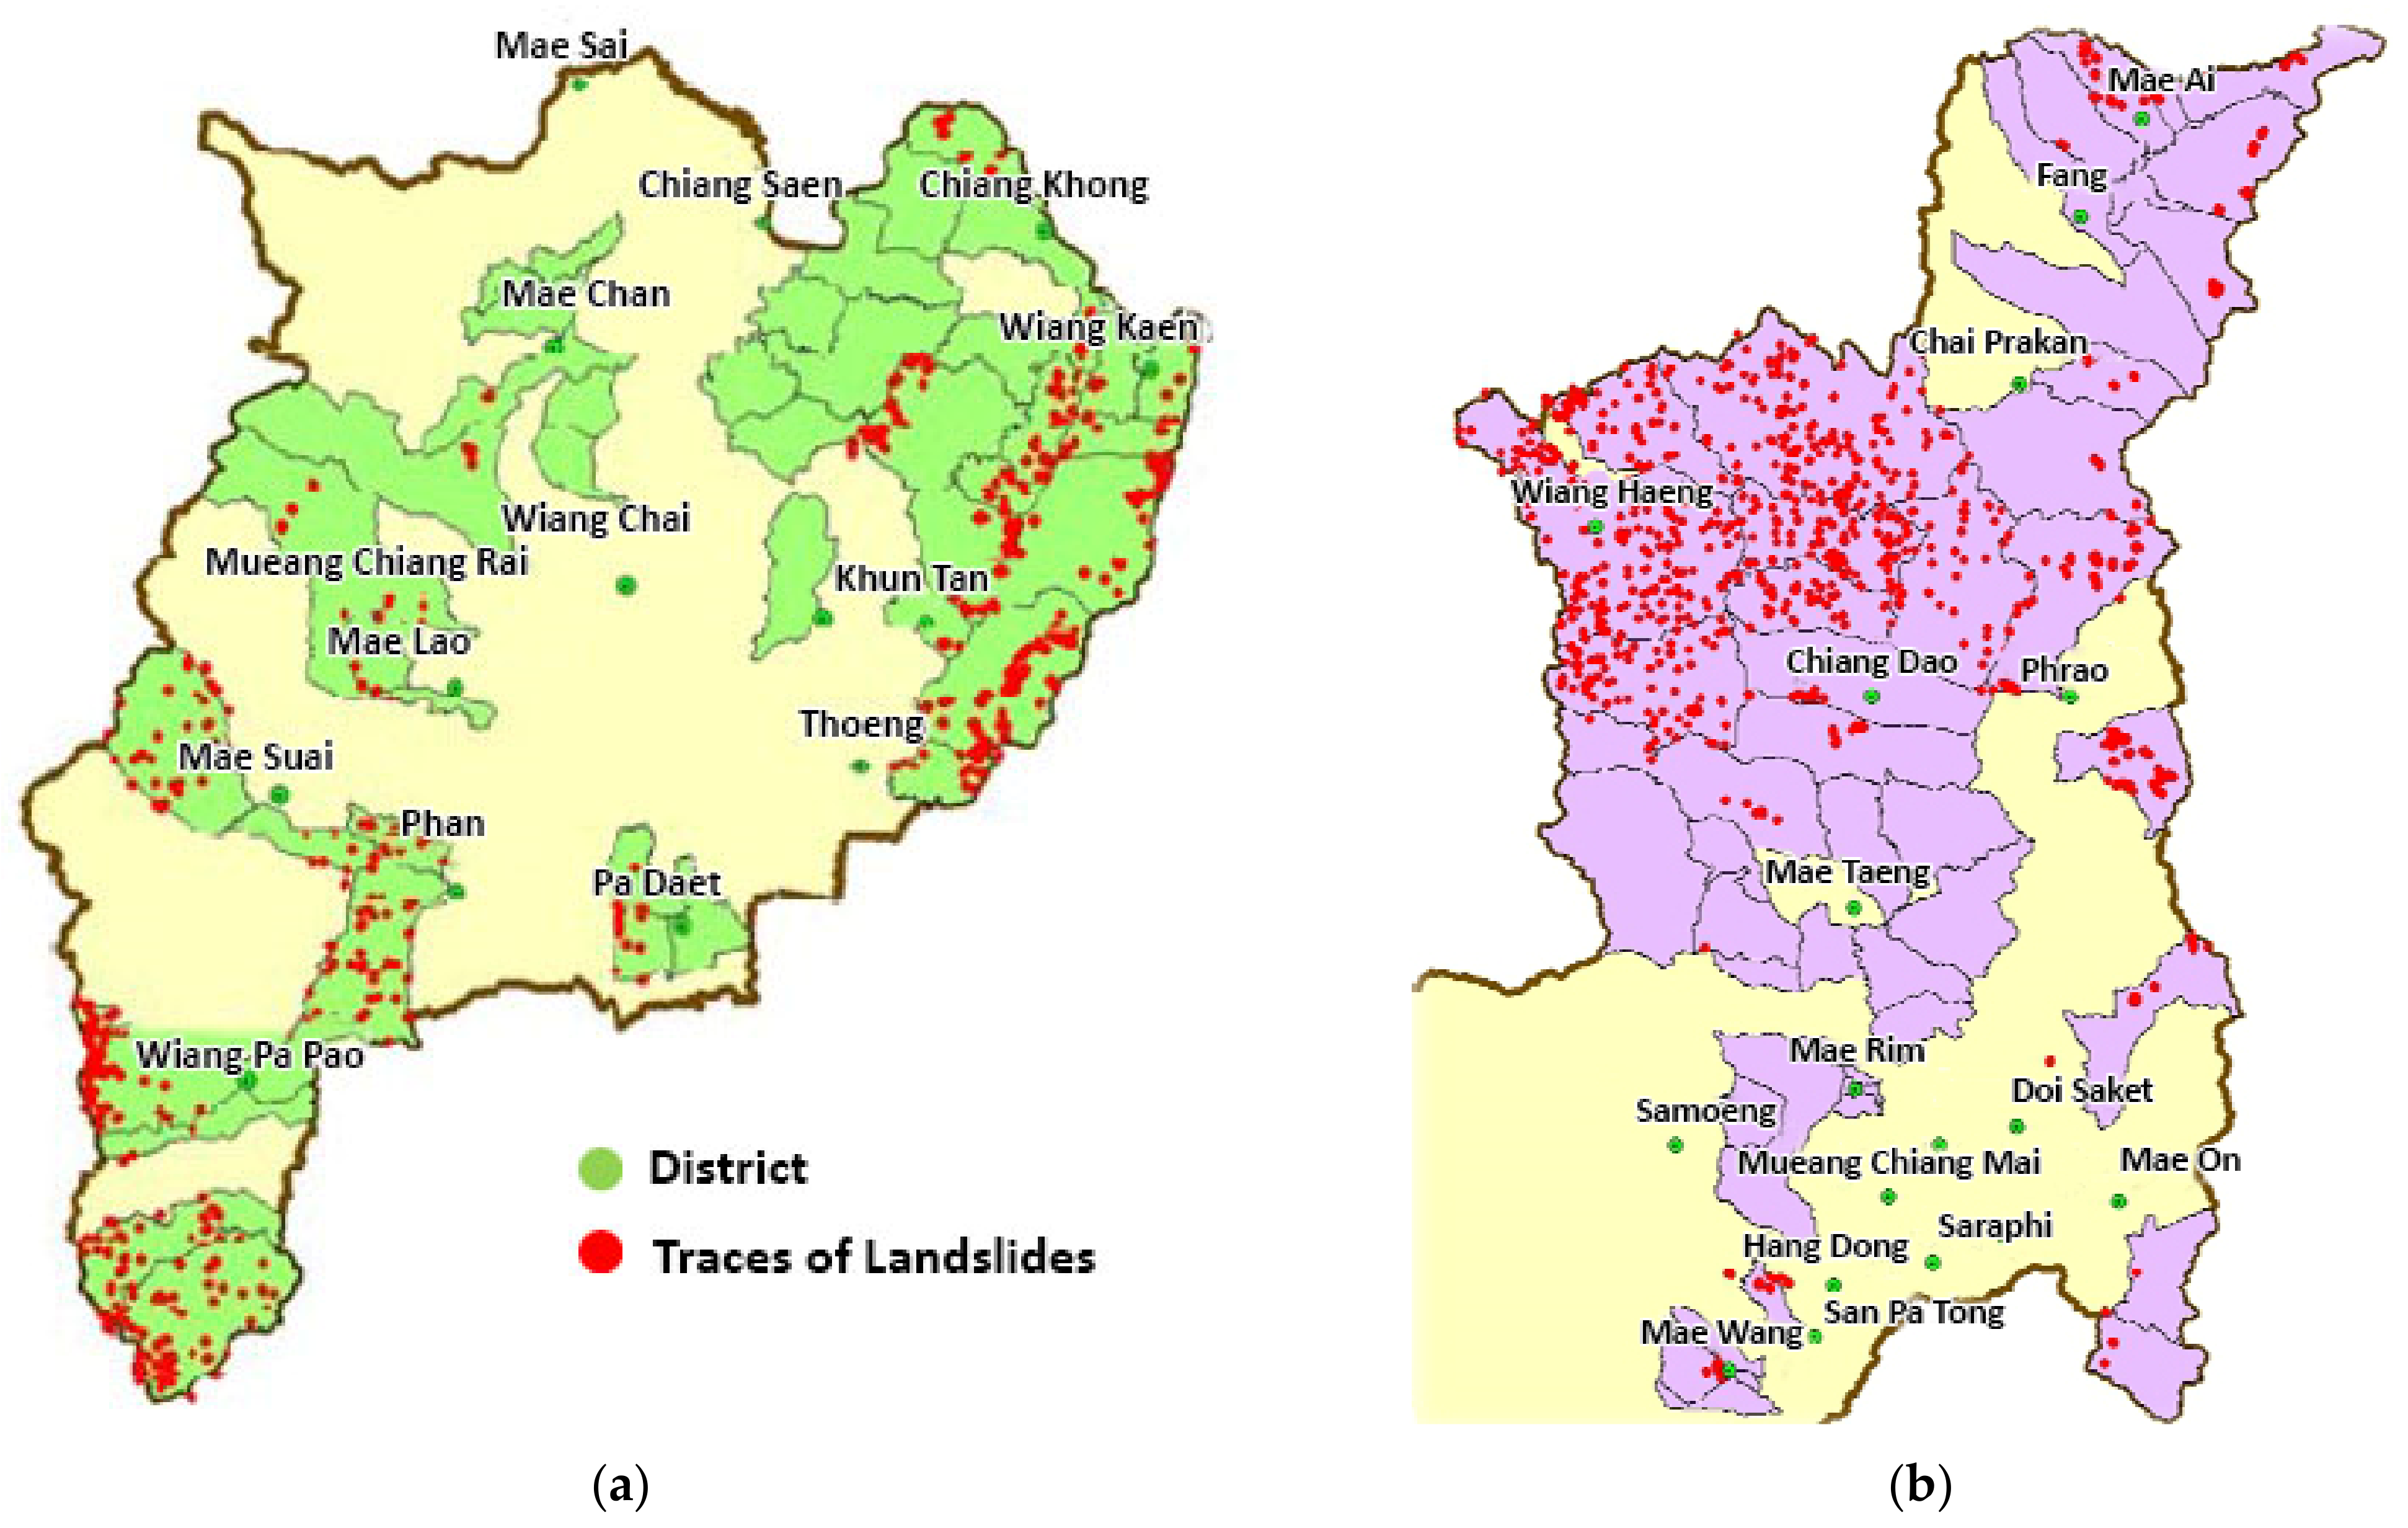
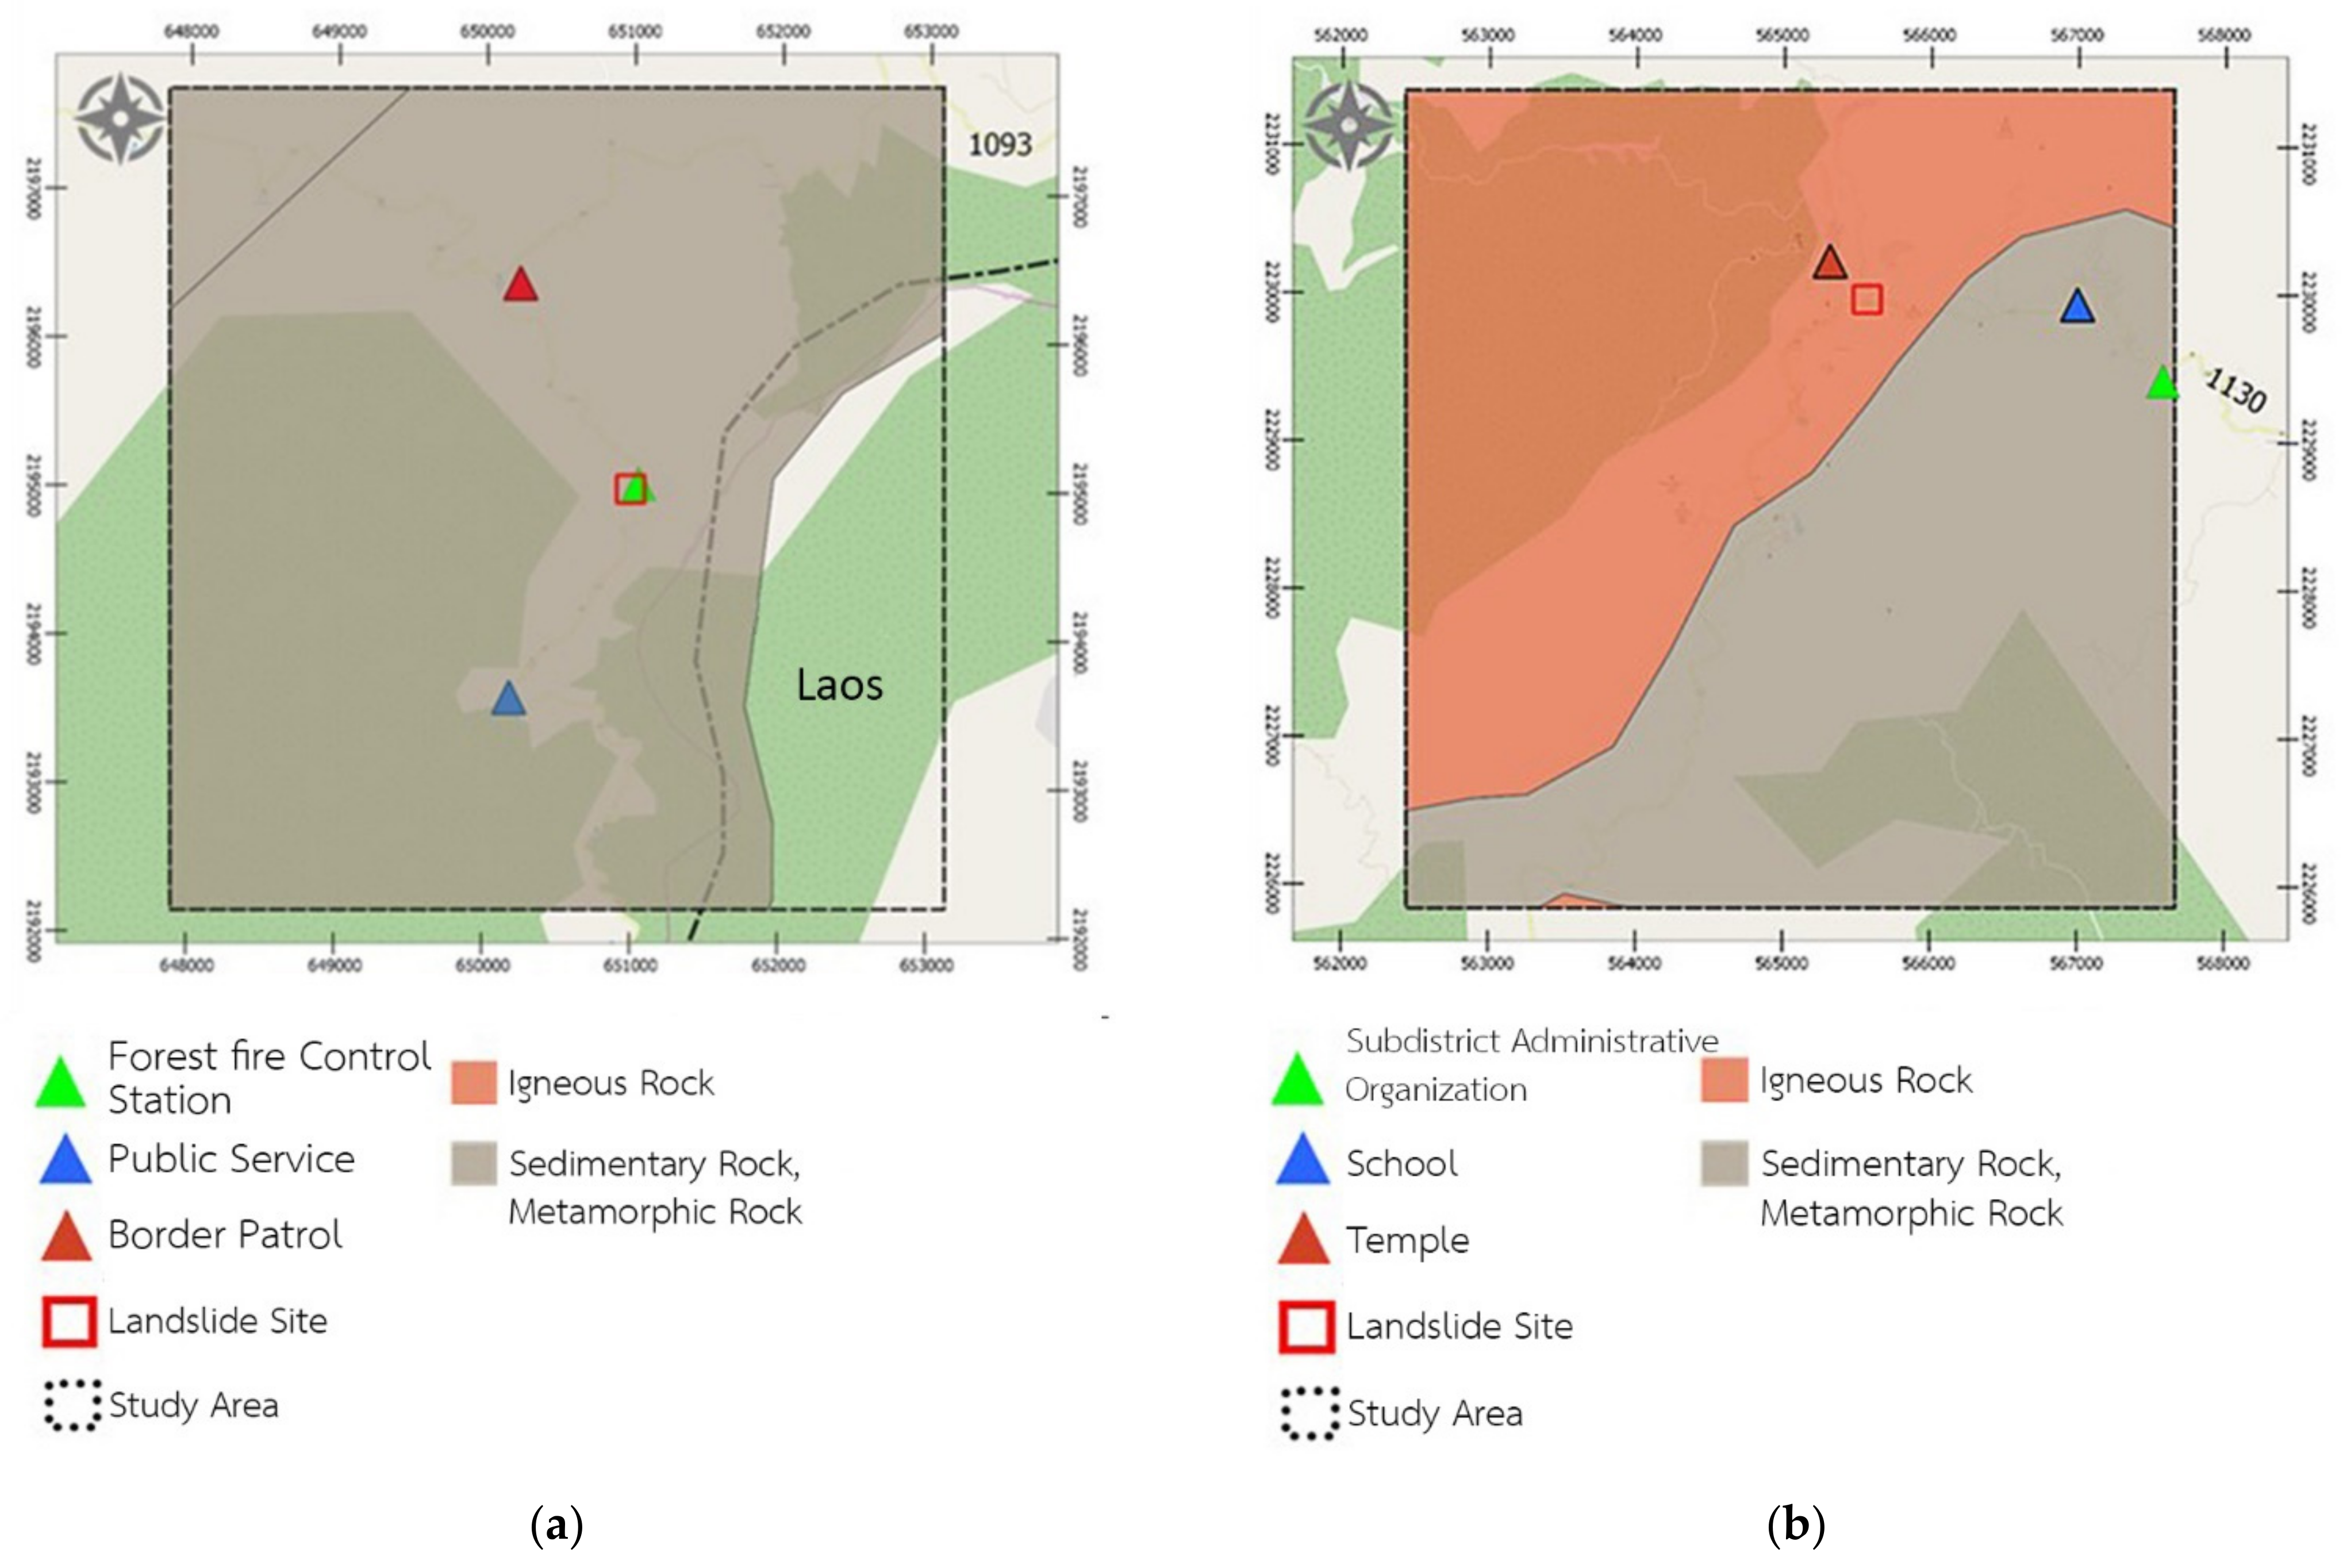
4.1. Area Selection
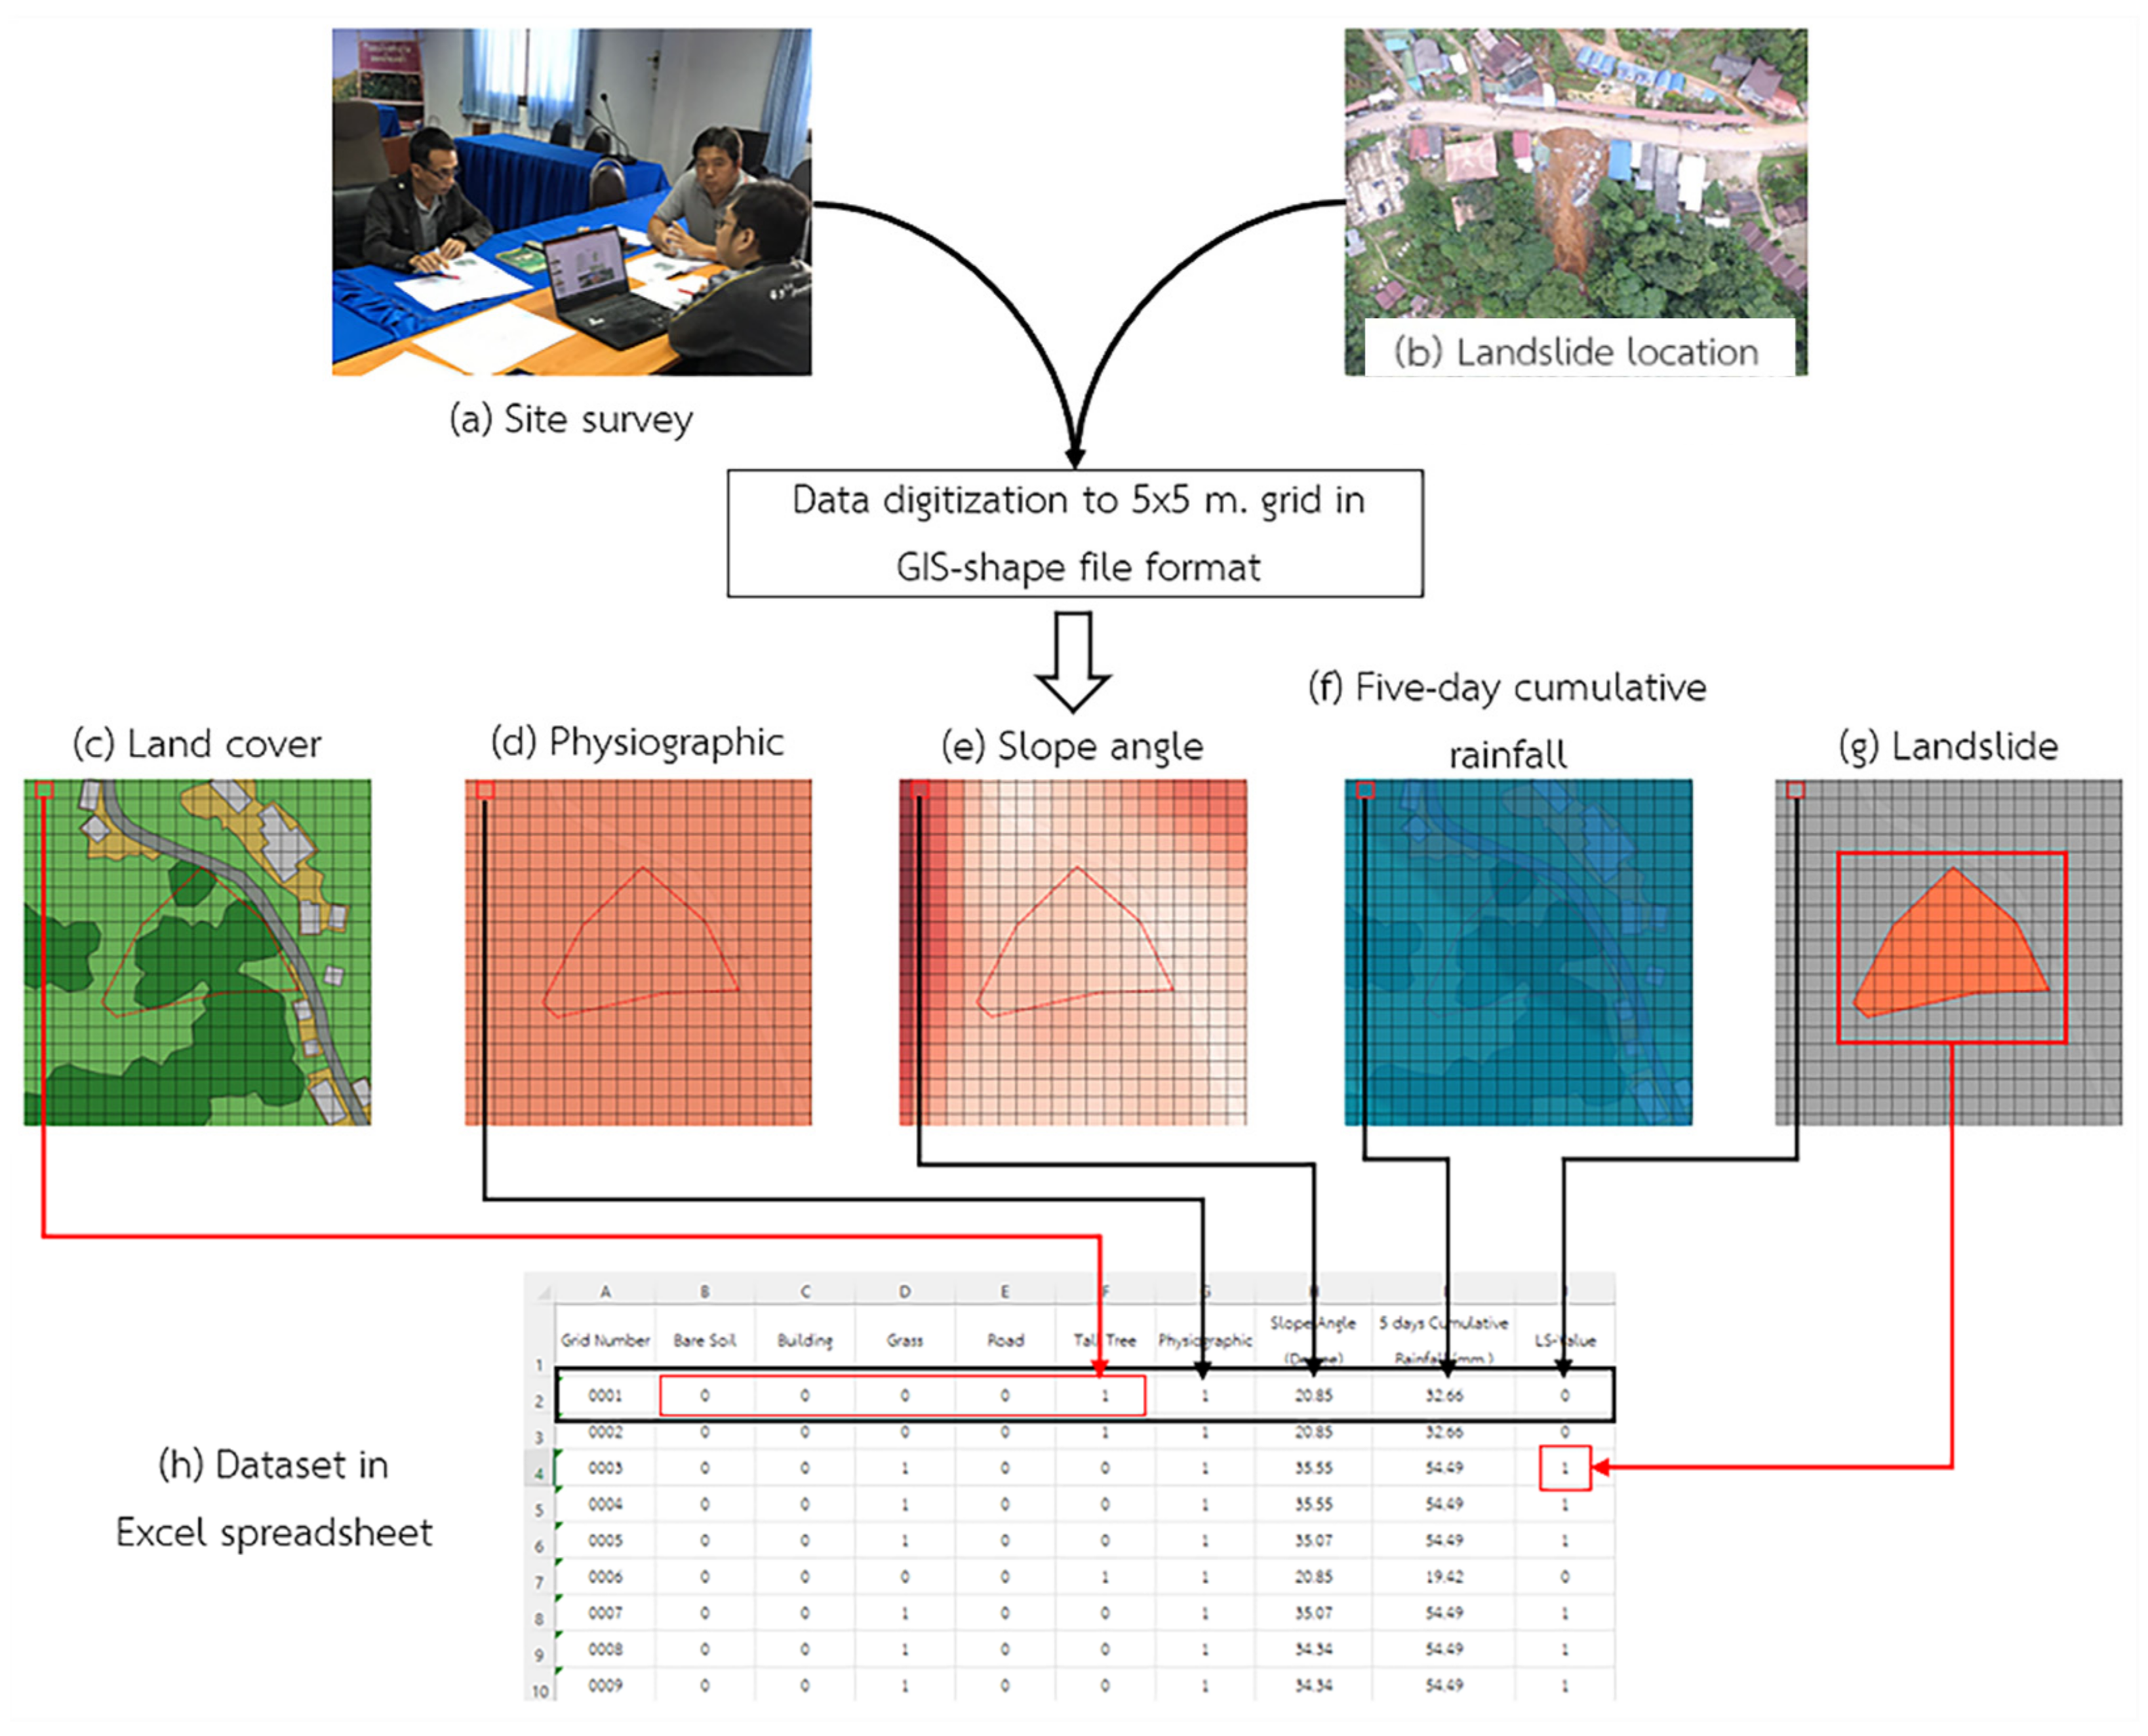
4.2. Data Collection
4.2.1. Landslide Risk
4.2.2. Land Cover
4.2.3. Physiographic Classifications
4.2.4. Slope Angle
4.2.5. Rainfall
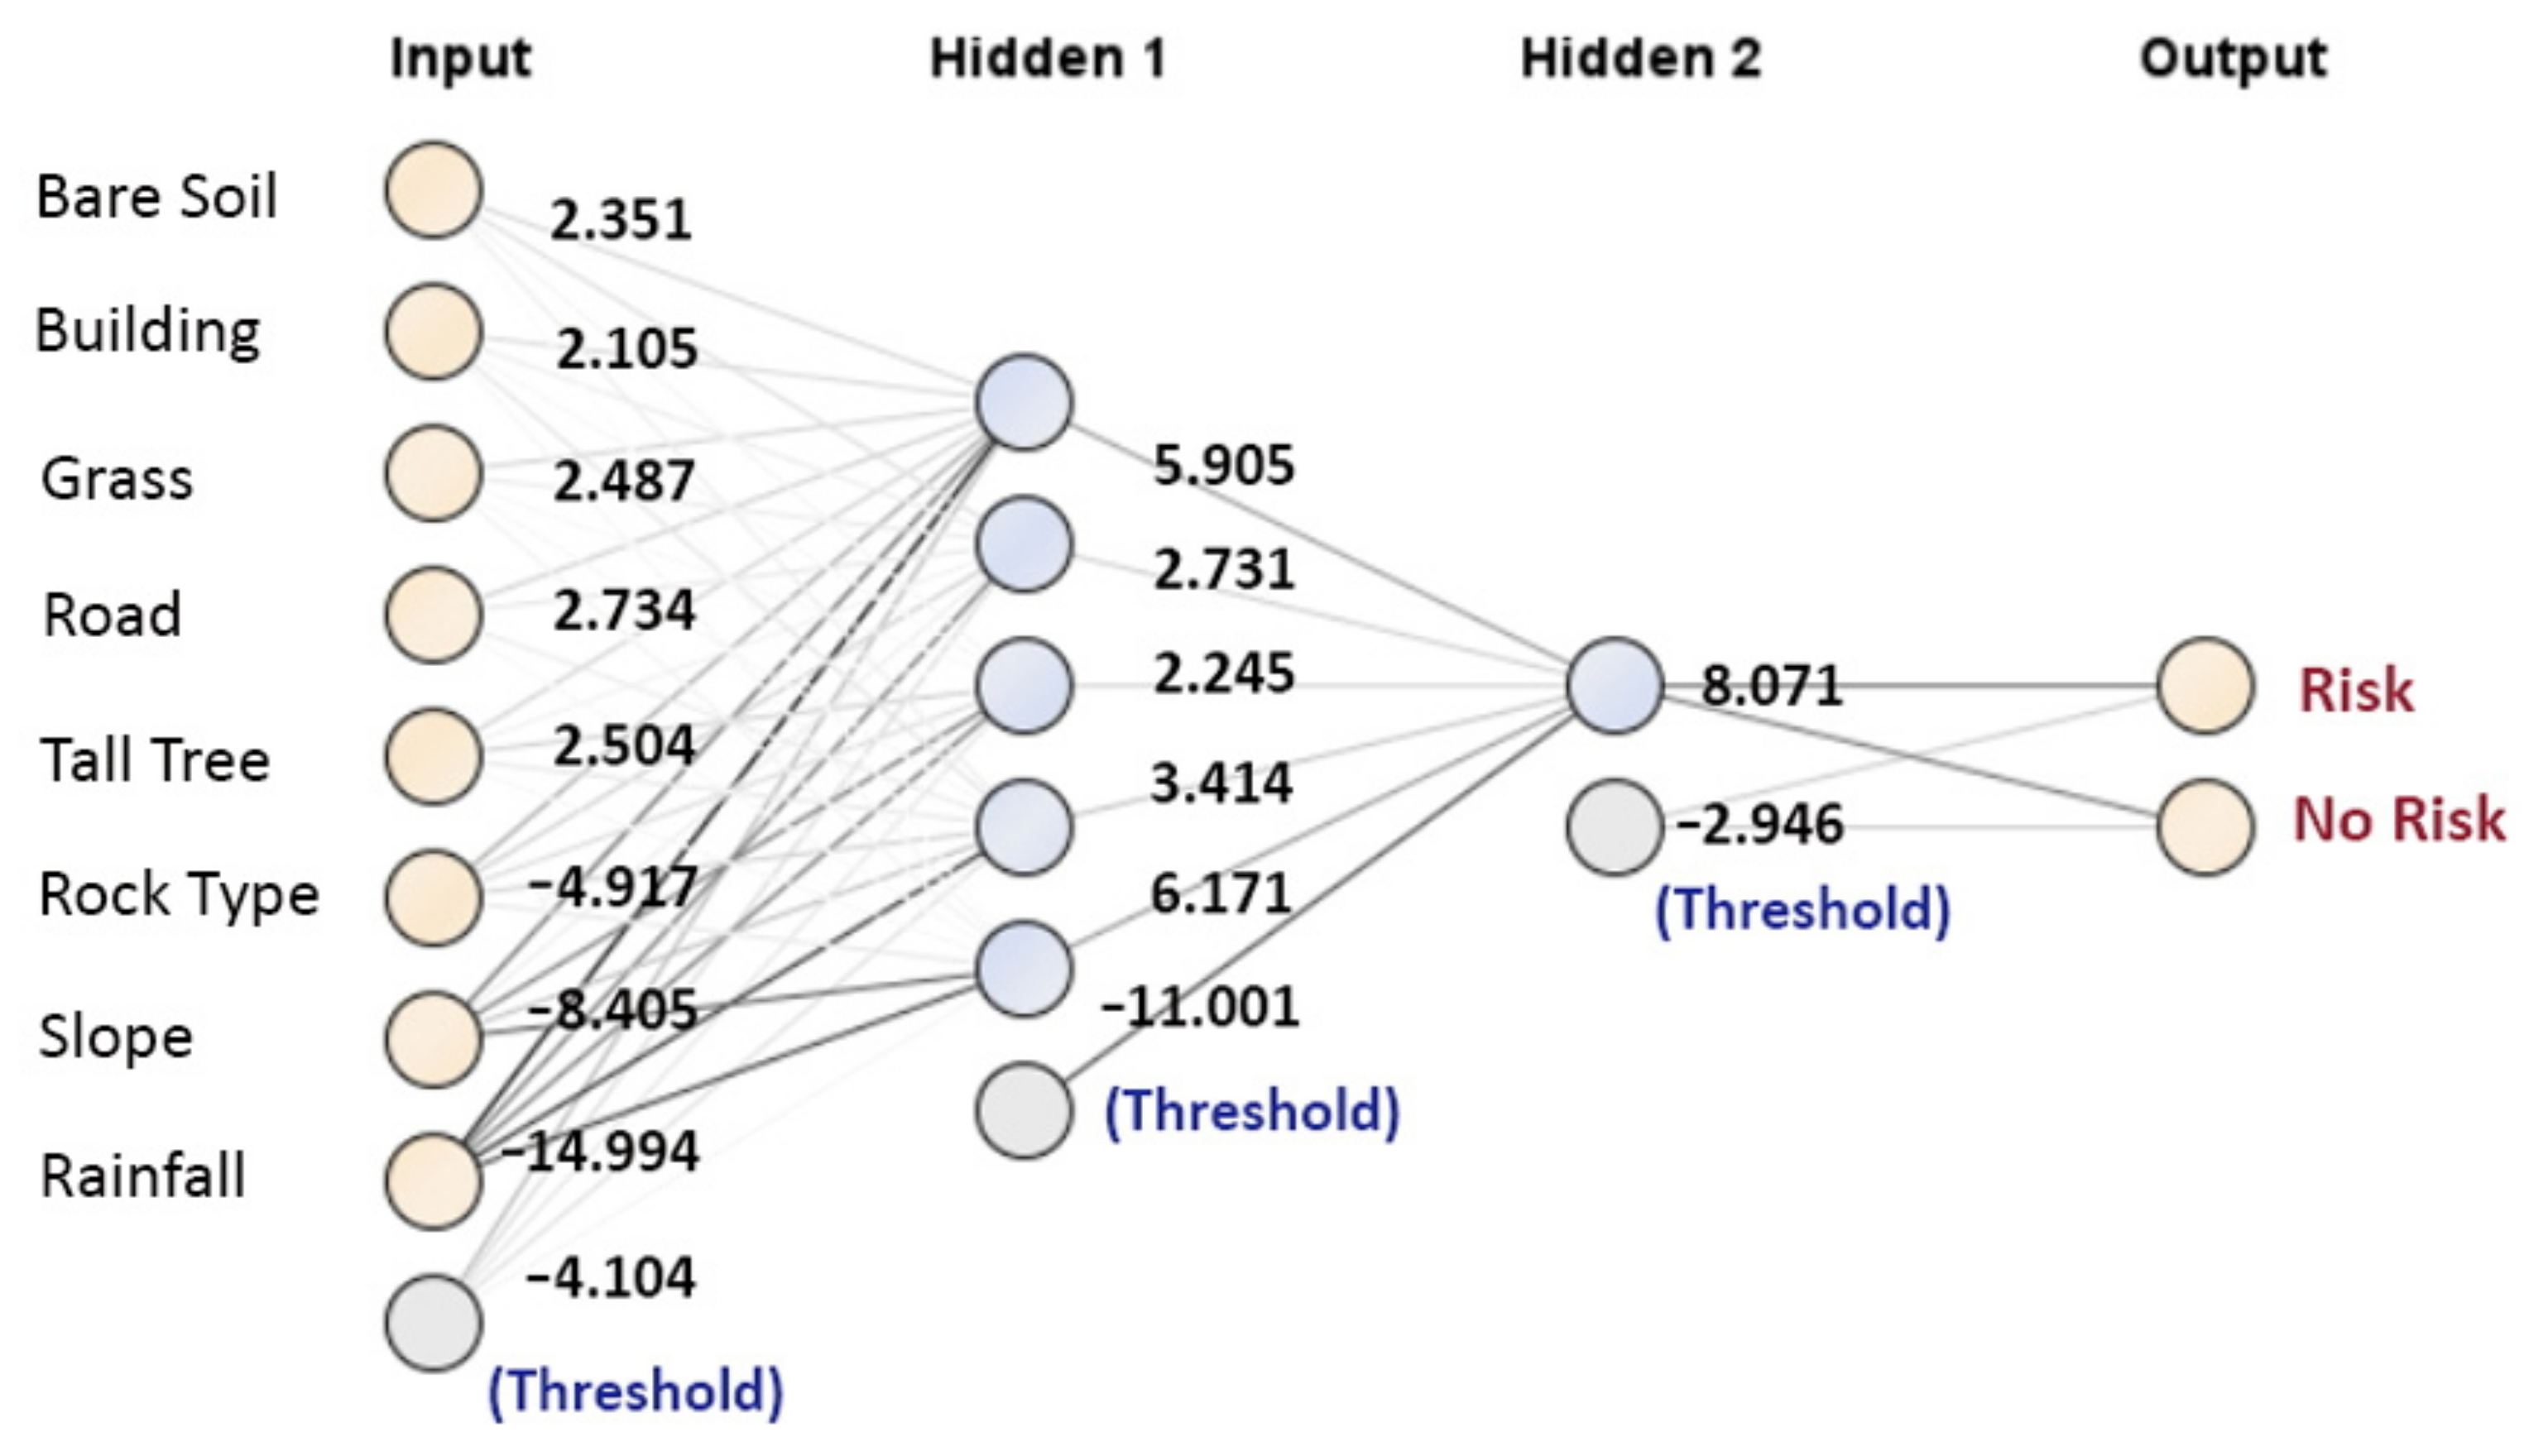
4.3. Forecasting Modeling via RapidMiner
5. Results
5.1. Modeling
5.2. Application
6. Discussion and Conclusions
Author Contributions
Funding
Institutional Review Board Statement
Informed Consent Statement
Data Availability Statement
Acknowledgments
Conflicts of Interest
References
- Herath, S.; Wang, Y. Case studies and national experiences. In Landslides–Disaster Risk Reduction; Springer: Berlin/Heidelberg, Germany, 2009; pp. 475–497. [Google Scholar]
- Kjekstad, O.; Highland, L. Economic and Social Impacts of Landslides. In Landslides–Disaster Risk Reduction; Sassa, K., Canuti, P., Eds.; Springer: Berlin/Heidelberg, Germany, 2009; pp. 573–587. [Google Scholar]
- Abraham, M.T.; Satyam, N.; Rosi, A.; Pradhan, B.; Segoni, S. The selection of rain gauges and rainfall parameters in estimating intensity-duration thresholds for landslide occurrence: Case study from Wayanad (India). Water 2020, 12, 1000. [Google Scholar] [CrossRef] [Green Version]
- Petpongpan, C.; Ekkawatpanit, C.; Kositgittiwong, D. Landslide risk assessment using hydrological model in the Upper Yom River Basin, Thailand. CATENA 2021, 204, 105402. [Google Scholar] [CrossRef]
- Department of Mineral Resources. North and Upper West. 2016. Available online: http://www.dmr.go.th/more_news.php?cid=191&filename=index (accessed on 31 October 2021). (In Thai)
- Tengtrairat, N.; Woo, W.L.; Parathai, P.; Aryupong, C.; Jitsangiam, P.; Rinchumphu, D. Automated Landslide-Risk Prediction Using Web GIS and Machine Learning Models. Sensors 2021, 21, 4620. [Google Scholar] [CrossRef] [PubMed]
- Chiang Mai News. Chiang Rai Floods Landslide Hits School Building after Continuous Heavy Rain. Chiang Mai News. 2019. Available online: https://www.chiangmainews.co.th/page/archives/1098987/ (accessed on 31 October 2021). (In Thai).
- 7HD Channel. Chiang Rai Flooding and Landslides in Many Areas Relevant Agencies Mobilize to Help the Villagers. 7HD Hot Online. 2021. Available online: https://news.ch7.com/detail/507922 (accessed on 31 October 2021). (In Thai).
- MGR Online. Put up a Sign for a Landslide Disaster Area. The Way up to Phu Chee Fah. MGR Online. 2018. Available online: https://mgronline.com/local/detail/9610000075917 (accessed on 31 October 2021). (In Thai).
- Thairath Online. Rain Collapses, Doi Mae Salong Road Collapses 1.5 Meters and Soil Slides over 3 Houses at the Foot of the Hill Collapse. Thai Rath. 2017. Available online: https://www.thairath.co.th/news/local/north/1062644 (accessed on 31 October 2021). (In Thai).
- Shu, H.; Hürlimann, M.; Molowny-Horas, R.; González, M.; Pinyol, J.; Abancó, C.; Ma, J. Relation between land cover and landslide susceptibility in Val d’Aran, Pyrenees (Spain): Historical aspects, present situation and forward prediction. Sci. Total Environ. 2019, 693, 133557. [Google Scholar] [CrossRef]
- Zhao, J.; Zhao, X.; Liang, S.; Zhou, T.; Du, X.; Xu, P.; Wu, D. Assessing the thermal contributions of urban land cover types. Landsc. Urban Plan. 2020, 204, 103927. [Google Scholar] [CrossRef]
- Department of Mineral Resources. Knowledge of Landslides (in Thai); Resources, M., Ed.; 2010. Available online: http://www.dmr.go.th/download/Landslide/what_landslide1.htm (accessed on 31 October 2021).
- Liao, K.-W.; Hoang, N.-D.; Chang, S.-C. Estimating landslide occurrence via small watershed method with relevance vector machine. Earth Sci. Inform. 2020, 13, 249–260. [Google Scholar] [CrossRef]
- Marc, O.; Gosset, M.; Saito, H.; Uchida, T.; Malet, J.P. Spatial patterns of storm-induced landslides and their relation to rainfall anomaly maps. Geophys. Res. Lett. 2019, 46, 11167–11177. [Google Scholar] [CrossRef]
- Chen, X.; Liu, C.; Wang, M. A method for quick assessment of earthquake-triggered landslide hazards: A case study of the Mw6.1 2014 Ludian, China earthquake. Bull. Eng. Geol. Environ. 2019, 78, 2449–2458. [Google Scholar] [CrossRef]
- Pal, S.C.; Das, B.; Malik, S. Potential Landslide Vulnerability Zonation Using Integrated Analytic Hierarchy Process and GIS Technique of Upper Rangit Catchment Area, West Sikkim, India. J. Indian Soc. Remote Sens. 2019, 47, 1643–1655. [Google Scholar] [CrossRef]
- Chen, Z.; Liang, S.; Ke, Y.; Yang, Z.; Zhao, H. Landslide susceptibility assessment using different slope units based on the evidential belief function model. Geocarto Int. 2020, 35, 1641–1664. [Google Scholar] [CrossRef]
- Guo, C.-W.; Huang, Y.-D.; Yao, L.-K.; Alradi, H. Size and spatial distribution of landslides induced by the 2015 Gorkha earthquake in the Bhote Koshi river watershed. J. Mt. Sci. 2017, 14, 1938–1950. [Google Scholar] [CrossRef]
- Yang, Z.; Li, X.; Zhao, Q.; Zhang, Y.; Liu, X. Key Influencing factors based distribution regularity and deformation and failure response of colluvial landslides in three gorges reservoir area. J. Eng. Geol. 2021, 29, 617. [Google Scholar]
- Chatra, A.S.; Dodagoudar, G.R.; Maji, V.B. Numerical modelling of rainfall effects on the stability of soil slopes. Int. J. Geotech. Eng. 2019, 13, 425–437. [Google Scholar] [CrossRef]
- Rakkapao, N.; Plodpai, P.; Boonma, K.; Wimonsong, P. Landslide Risk Assessment using Geographic Information System: A case study of Phanom District, Surat Thani Province, Thailand. J. Spat. Innov. Dev. 2020, 1, 74–82. [Google Scholar]
- Dang, K.; Loi, D.H.; Hirota, K.; Taniguchi, Y.; Sassa, K. Landslide triggered by heavy rainfall on 06 September 2020 in Shiiba village, Miyazaki Prefecture, Japan. Landslides 2021, 18, 3485–3488. [Google Scholar] [CrossRef]
- Kim, J.; Kim, Y.; Jeong, S.; Hong, M. Rainfall-induced landslides by deficit field matric suction in unsaturated soil slopes. Environ. Earth Sci. 2017, 76, 1–17. [Google Scholar] [CrossRef]
- Mandal, S.; Mondal, S. Artificial Neural Network (ANN) Model and Landslide Susceptibility. In Statistical Approaches for Landslide Susceptibility Assessment and Prediction; Mandal, S., Mondal, S., Eds.; Springer International Publishing: Cham, Switzerland, 2019; pp. 123–133. [Google Scholar]
- Jacinth Jennifer, J.; Saravanan, S. Artificial neural network and sensitivity analysis in the landslide susceptibility mapping of Idukki district, India. Geocarto Int. 2021, 1–23. [Google Scholar] [CrossRef]
- Sadighi, M.; Motamedvaziri, B.; Ahmadi, H.; Moeini, A. Assessing landslide susceptibility using machine learning models: A comparison between ANN, ANFIS, and ANFIS-ICA. Environ. Earth Sci. 2020, 79, 536. [Google Scholar] [CrossRef]
- Kalantar, B.; Pradhan, B.; Naghibi, S.A.; Motevalli, A.; Mansor, S. Assessment of the effects of training data selection on the landslide susceptibility mapping: A comparison between support vector machine (SVM), logistic regression (LR) and artificial neural networks (ANN). Geomat. Nat. Hazards Risk 2018, 9, 49–69. [Google Scholar] [CrossRef]
- Aditian, A.; Kubota, T.; Shinohara, Y. Comparison of GIS-based landslide susceptibility models using frequency ratio, logistic regression, and artificial neural network in a tertiary region of Ambon, Indonesia. Geomorphology 2018, 318, 101–111. [Google Scholar] [CrossRef]
- Yu, C.; Chen, J. Landslide Susceptibility Mapping Using the Slope Unit for Southeastern Helong City, Jilin Province, China: A Comparison of ANN and SVM. Symmetry 2020, 12, 1047. [Google Scholar] [CrossRef]
- Bragagnolo, L.; da Silva, R.V.; Grzybowski, J.M.V. Landslide susceptibility mapping with r.landslide: A free open-source GIS-integrated tool based on Artificial Neural Networks. Environ. Model. Softw. 2020, 123, 104565. [Google Scholar] [CrossRef]
- Valencia Ortiz, J.A.; Martínez-Graña, A.M. A neural network model applied to landslide susceptibility analysis (Capitanejo, Colombia). Geomat. Nat. Hazards Risk 2018, 9, 1106–1128. [Google Scholar] [CrossRef] [Green Version]
- Sevgen, E.; Kocaman, S.; Nefeslioglu, H.A.; Gokceoglu, C. A Novel Performance Assessment Approach Using Photogrammetric Techniques for Landslide Susceptibility Mapping with Logistic Regression, ANN and Random Forest. Sensors 2019, 19, 3940. [Google Scholar] [CrossRef] [PubMed] [Green Version]
- Soma, A.S.; Kubota, T.; Mizuno, H. Optimization of causative factors using logistic regression and artificial neural network models for landslide susceptibility assessment in Ujung Loe Watershed, South Sulawesi Indonesia. J. Mt. Sci. 2019, 16, 383–401. [Google Scholar] [CrossRef]
- Nhu, V.-H.; Shirzadi, A.; Shahabi, H.; Singh, S.K.; Al-Ansari, N.; Clague, J.J.; Jaafari, A.; Chen, W.; Miraki, S.; Dou, J.; et al. Shallow Landslide Susceptibility Mapping: A Comparison between Logistic Model Tree, Logistic Regression, Naïve Bayes Tree, Artificial Neural Network, and Support Vector Machine Algorithms. Int. J. Environ. Res. Public Health 2020, 17, 2749. [Google Scholar] [CrossRef]
- Kuradusenge, M.; Kumaran, S.; Zennaro, M. Rainfall-Induced Landslide Prediction Using Machine Learning Models: The Case of Ngororero District, Rwanda. Int. J. Environ. Res. Public Health 2020, 17, 4147. [Google Scholar] [CrossRef]
- Chen, W.; Yan, X.; Zhao, Z.; Hong, H.; Bui, D.T.; Pradhan, B. Spatial prediction of landslide susceptibility using data mining-based kernel logistic regression, naive Bayes and RBFNetwork models for the Long County area (China). Bull. Eng. Geol. Environ. 2019, 78, 247–266. [Google Scholar] [CrossRef]
- Yadav, A.K.; Malik, H.; Chandel, S.S. Application of rapid miner in ANN based prediction of solar radiation for assessment of solar energy resource potential of 76 sites in Northwestern India. Renew. Sustain. Energy Rev. 2015, 52, 1093–1106. [Google Scholar] [CrossRef]
- László, K.; Ghous, H. Efficiency comparison of Python and RapidMiner. Multidiszcip. Tudományok 2020, 10, 212–220. [Google Scholar]
- Sitthikankun, S.; Rinchumphu, D.; Buachart, C.; Pacharawongsakda, E. Construction cost estimation for government building using Artificial Neural Network. Int. Trans. J. Eng. Manag. Appl. Sci. Technol. 2021, 12, 1–12. [Google Scholar]
- Celik, U.; Basarir, C. The Prediction of Precious Metal Prices via Artificial Neural Network by Using RapidMiner. Alphanumeric J. 2017, 5, 45. [Google Scholar] [CrossRef]
- Department of Mineral Resources. Project to Provide Information on Landslide Risk Areas at Community Level, Chokchai Subdistrict, Doi Luang District, Chiang Rai Province. 2013. Available online: http://www.dmr.go.th/download/Landslide/community (accessed on 31 October 2021). (In Thai)
- Department of Mineral Resources. Project to Provide Information on Landslide Risk Areas at Community Level, Ban Pong Subdistrict, Phrao District, Chiang Mai Province. 2013. Available online: http://27.254.88.57/download/Landslide/community (accessed on 31 October 2021). (In Thai)
- Ranjan, C. Rules-of-Thumb for Building a Neural Network. Available online: https://towardsdatascience.com/17-rules-of-thumb-for-building-a-neural-network-93356f9930af (accessed on 13 April 2021).


| Province | Area | Date |
|---|---|---|
| Chiang Rai | 1. Phu Chifa, Tambon Tap Tao, Thoeng District | 31 July 2018 |
| 2. Santikhiri Village, Tambon Mae Salong Nok, Mae Fa Luang District | 21 August 2018 | |
| 3. Sop Ruak Village, Tambon Wiang, Chiang Saen District | 12 July 2013 | |
| Chiang Mai | 4. Tambon Mon Pin, Fang District | 21 September 2020 |
| 5. Tambon Huai Kaeo, Mae On District | 21 August 2020 | |
| 6. Tambon Suthep, Muang Chiang Mai | 23 August 2020 | |
| 7. Tambon Ban Luang, Chom Thong District | 18 September 2015 |
Publisher’s Note: MDPI stays neutral with regard to jurisdictional claims in published maps and institutional affiliations. |
© 2022 by the authors. Licensee MDPI, Basel, Switzerland. This article is an open access article distributed under the terms and conditions of the Creative Commons Attribution (CC BY) license (https://creativecommons.org/licenses/by/4.0/).
Share and Cite
Dechkamfoo, C.; Sitthikankun, S.; Kridakorn Na Ayutthaya, T.; Manokeaw, S.; Timprae, W.; Tepweerakun, S.; Tengtrairat, N.; Aryupong, C.; Jitsangiam, P.; Rinchumphu, D. Impact of Rainfall-Induced Landslide Susceptibility Risk on Mountain Roadside in Northern Thailand. Infrastructures 2022, 7, 17. https://0-doi-org.brum.beds.ac.uk/10.3390/infrastructures7020017
Dechkamfoo C, Sitthikankun S, Kridakorn Na Ayutthaya T, Manokeaw S, Timprae W, Tepweerakun S, Tengtrairat N, Aryupong C, Jitsangiam P, Rinchumphu D. Impact of Rainfall-Induced Landslide Susceptibility Risk on Mountain Roadside in Northern Thailand. Infrastructures. 2022; 7(2):17. https://0-doi-org.brum.beds.ac.uk/10.3390/infrastructures7020017
Chicago/Turabian StyleDechkamfoo, Chotirot, Sitthikorn Sitthikankun, Thidarat Kridakorn Na Ayutthaya, Sattaya Manokeaw, Warut Timprae, Sarote Tepweerakun, Naruephorn Tengtrairat, Chuchoke Aryupong, Peerapong Jitsangiam, and Damrongsak Rinchumphu. 2022. "Impact of Rainfall-Induced Landslide Susceptibility Risk on Mountain Roadside in Northern Thailand" Infrastructures 7, no. 2: 17. https://0-doi-org.brum.beds.ac.uk/10.3390/infrastructures7020017