1. Introduction
The demonstration approach has been around for a long time, but recent developments in computing have allowed huge amounts of data to be processed to anticipate, understand, and predict behaviours through data patterns [
1].
Collecting data from sensors embedded in structures such as roads allows us to demonstrate their behaviour when they undergo deformation caused by constant strain. This usage of Big Data falls under the domain of the Internet of Things (IoT). The use of computer technology makes it possible to collect a huge volume of data generated by sensors, transform it, and store it in such a way that it can be analysed, visualised, and fed into intelligent algorithms that can predict road behaviour over time. IoT is seen as a network of sensors embedded in roads, which is a significant source of Big Data.
Monitoring of transport infrastructure is very important in predicting ageing and loss of performance [
2]. It is imperative that this prevention be as effective as possible to ensure the safety and comfort of those who use them every day.
Based on the ontology proposed by [
3], it is assumed that there are currently two types of monitoring systems: dynamic and static, regardless of the type of road and pavement used. It is difficult to place static embedded systems on unpaved roads, although dynamic systems can be used. On paved roads, regardless of the type of pavement, both monitoring systems are viable. It is important to note that the most traditionally used monitoring system is visual inspection, which is a dynamic system performed by humans. Dynamic road monitoring systems are mobile systems capable of monitoring multiple locations and roads, whereas static monitoring systems are limited to a single monitoring location, often embedded within the road.
A literature review revealed several data collection technologies that are applicable to road monitoring systems:
Digital cameras (dynamic): To capture images of roads and analyse the surface road conditions, the cameras should be mounted on a vehicle [
4,
5,
6].
Smartphones (dynamic): Use of smartphones with an accelerometer and Global Position System (GPS) attached to a vehicle, such as a car or bicycle, and comparing the vibration with the vehicle’s speed to detect irregular road surfaces [
7,
8,
9,
10,
11,
12,
13,
14,
15,
16,
17].
Wireless and high-precision sensors (dynamic): To capture the roughness of the road surface, for example, use noise sensors and vibration sensors [
18,
19].
Radio Frequency (RF) sensors (static): Based on wireless sensors embedded on the road, this could include an RF transmitter and an RF reader installed in vehicles to capture the data [
20].
Fibre optic sensors (static): To accurately measure road stresses, capture the vibrations felt on the road, allowing the identification of the vehicle’s weight and the damping effect [
21,
22].
Temperature sensors (static): Capturing temperature variations provides insights about road surface stress [
23].
Strain gauge sensors (static): To measure the deformations and stress on the road [
24,
25].
Temperature, strain, and inclinometer sensors (static): To measure the thermal curling on the concrete pavement slab [
26].
Temperature, Strain, and Pressure Cells (Static): To measure the conditions of airport pavements [
27].
Geophones (static). To measure road deflection [
27].
Ground-penetrating radar (static): The radars were installed at different depths, with their antennas suspended above the road surface to monitor road conditions [
28,
29,
30,
31].
Mechanical systems sensors (static). Integrates mechanical, sensor, and electronic elements on a small chip: It allows you to collect and analyse temperature, humidity, and deformation [
32].
Smart Rocks (static): It is a device that integrates different sensors, including piezoresistive stress and strain sensors, as well as a triaxial accelerometer for direct measurement of 3D stress, strain, and acceleration on the SmartRock surface [
33].
Distributed Acoustic Sensing (static): It is used to measure seismic signals propagating over long distances using fibre-optic cables. The technology was capable of measuring small deformations when a sensor fibre is coupled to the system and road noise over long distances [
34].
Our study uses static Fibre Optic Sensors not to analyse the road surface but rather its internal structural layers and the deformation within them. To achieve this, it is necessary to design an architecture for collecting, preparing, storing, analysing, and utilising (big) data to support road monitoring while also taking into account issues such as data security and privacy.
In general, the aforementioned case studies either lack descriptions of the architecture used to deploy the proposed solutions or provide very limited detail. Data collection, processing, and subsequent analysis are considered essential for pavement monitoring systems, but most studies do not describe this component [
35]. However, one study stands out by introducing a cloud-based architecture for monitoring cyber-physical systems. Its primary aim is to automate the transmission of data generated by IoT devices to the cloud. Within the cloud environment, the data are analysed and stored using blockchain technology to ensure authenticity and integrity [
36]. The authors argue that this architecture constitutes a suitable cloud-based solution for modern monitoring systems and can serve as a reference model for future research.
Therefore, this paper presents a more versatile architecture capable of accommodating the requirements of road monitoring systems, whether they are cloud-based or not. A comprehensive Big Data Systems Architecture (BDSA) is proposed, integrating several layers and components for data collection, storage, processing, analysis, and distribution. This integrated environment facilitates informed decision-making and predictions regarding structural behaviour.
The aim of this paper is to describe the use of the BDSA in a case where it was installed on a real road section to validate a specific set of components within the BDSA. This study covers the use and testing of different layers of the BDSA and some of its specific components, covering the entire data lifecycle from data collection to analysis and visualisation. It also introduces and models the necessary data structures to support storage and processing within a (Big) Data Warehouse.
Methodologically, this work was carried out following the research methodology of Design Science Research [
37]. The validation of the proposed system was achieved by developing a prototype of a Big Data System designed for monitoring a road section.
The remainder of this paper is structured as follows:
Section 2 explores the evolution of Business Intelligence and Big Data Analytics, considering the concept of Big Data.
Section 3 introduces the BDSA and outlines its architecture for road monitoring. It details the various layers and emphasises the selected layers and components for implementing the proof-of-concept.
Section 4 presents a comprehensive account of the implementation process, encompassing (Big) Data Warehouse modelling, along with associated tasks such as data integration, cleansing, transformation, loading, and data analysis and visualisation.
The results, which show the importance of using a BDSA, are presented in
Section 5.
Finally, in
Section 6, we offer concluding remarks and provide insights into future directions.
2. Business Intelligence and Big Data Analytics Evolution
In recent years, successive advances in digital technologies have triggered important changes in organisations, their strategies, and business models. In this way, digital has become an integral part of companies’ daily lives, becoming an unavoidable reality that increasingly contributes to their success [
38].
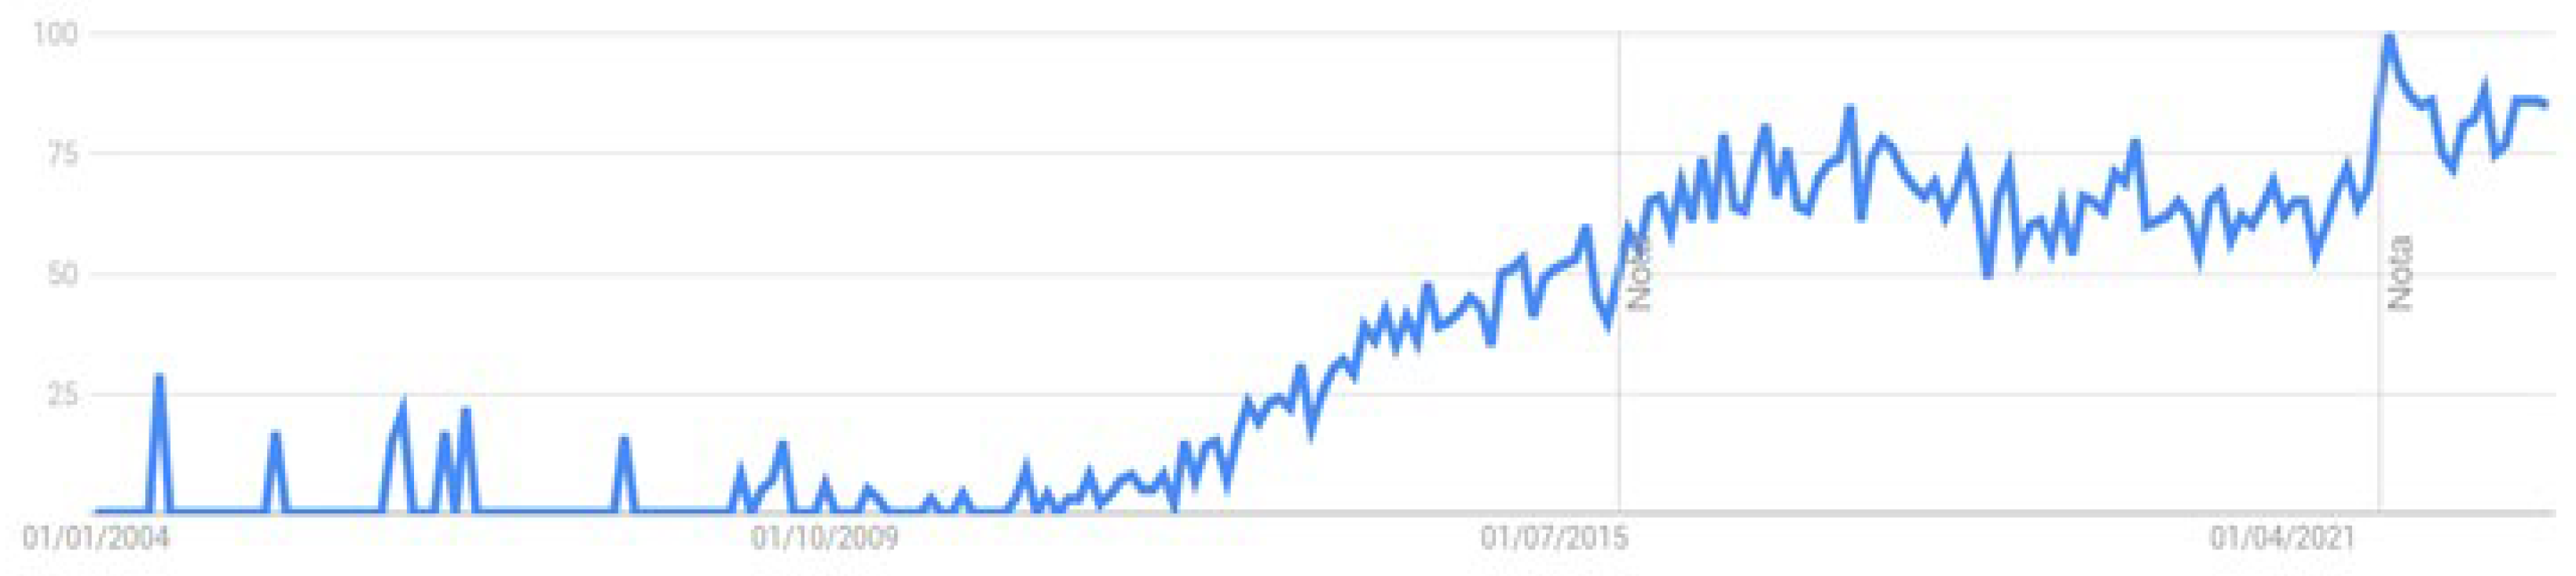
Therefore, over the last years, the interest in Analytics and Big Data has increased considerably [
39], particularly after 2012, as can be seen in
Figure 1. This may be due to the consequent skyrocketing growth in the volume of data generated by companies, requiring new tools and technologies able to process and analyse large datasets. Now it becomes relevant to carry out a retrospective analysis of the evolution of Business Intelligence (BI) and (big) Data Analytics to reach the current reality, the Big Data era.
According to IBM, BI is software that considers business data and presents it in user-friendly visualisations such as reports, dashboards, charts, and graphs, allowing business users to access different types of data and enabling analysis of this information to gain a better insight into company performance. Organisations can use the knowledge gained through BI and data analysis to improve business decisions, identify problems or issues, spot market trends, and find new revenues or business opportunities [
40]. Although this is a broader definition, the emphasis is maintained on data processing capabilities to provide useful information and knowledge to improve the business, i.e., BI is a set of strategies and technologies that companies may use to analyse business information and transform it into practical knowledge that serves as a basis for commercial, strategic, and tactical decisions.
(Big) Data Analytics can be explained as the use of advanced analytical techniques on diverse (big) data sets that include structured, semi-structured, and unstructured data from different sources and of different sizes and whose size or type exceeds the ability of traditional relational databases to capture, manage, and process the (big) data with low latency [
40]. A more detailed definition of Big Data can be achieved, such as high-volume, high-velocity, and/or high-variety information assets.
Given that sources of Big Data are becoming more complex than traditional data because they are being driven by Artificial Intelligence (AI), mobile devices, social media, and the IoT, and much of that Big Data are generated in real-time at a very large scale (for example, data originates from sensors), it is extremely necessary to adopt Big Data Analytic tools capable of providing insights to perform better and faster decisions, to model and predict future outcomes, and to improve business intelligence. The key asset is still information and data processing for supporting the decision-making process and enhancing the business.
In this context, an evolution from BI and Analytics (BI&A) to Big Data Analytics can be observed in terms of support technologies and development frameworks. This evolution is addressed in the work of [
41], which makes a retrospective characterisation of the BI&A itself and shows what changes for Big Data. According to these authors, Business Analytics (BA) is understood as the main analytical component of BI; some authors refer to BA as a system that offers advanced techniques for the reporting of data, an evolution of BI [
42], while Big Data are used to describe data sets so large and complex that they require advanced technologies for data storage, management, analysis, and visualisation. Therefore, Big Data Analytics offers new research directions for BI&A.
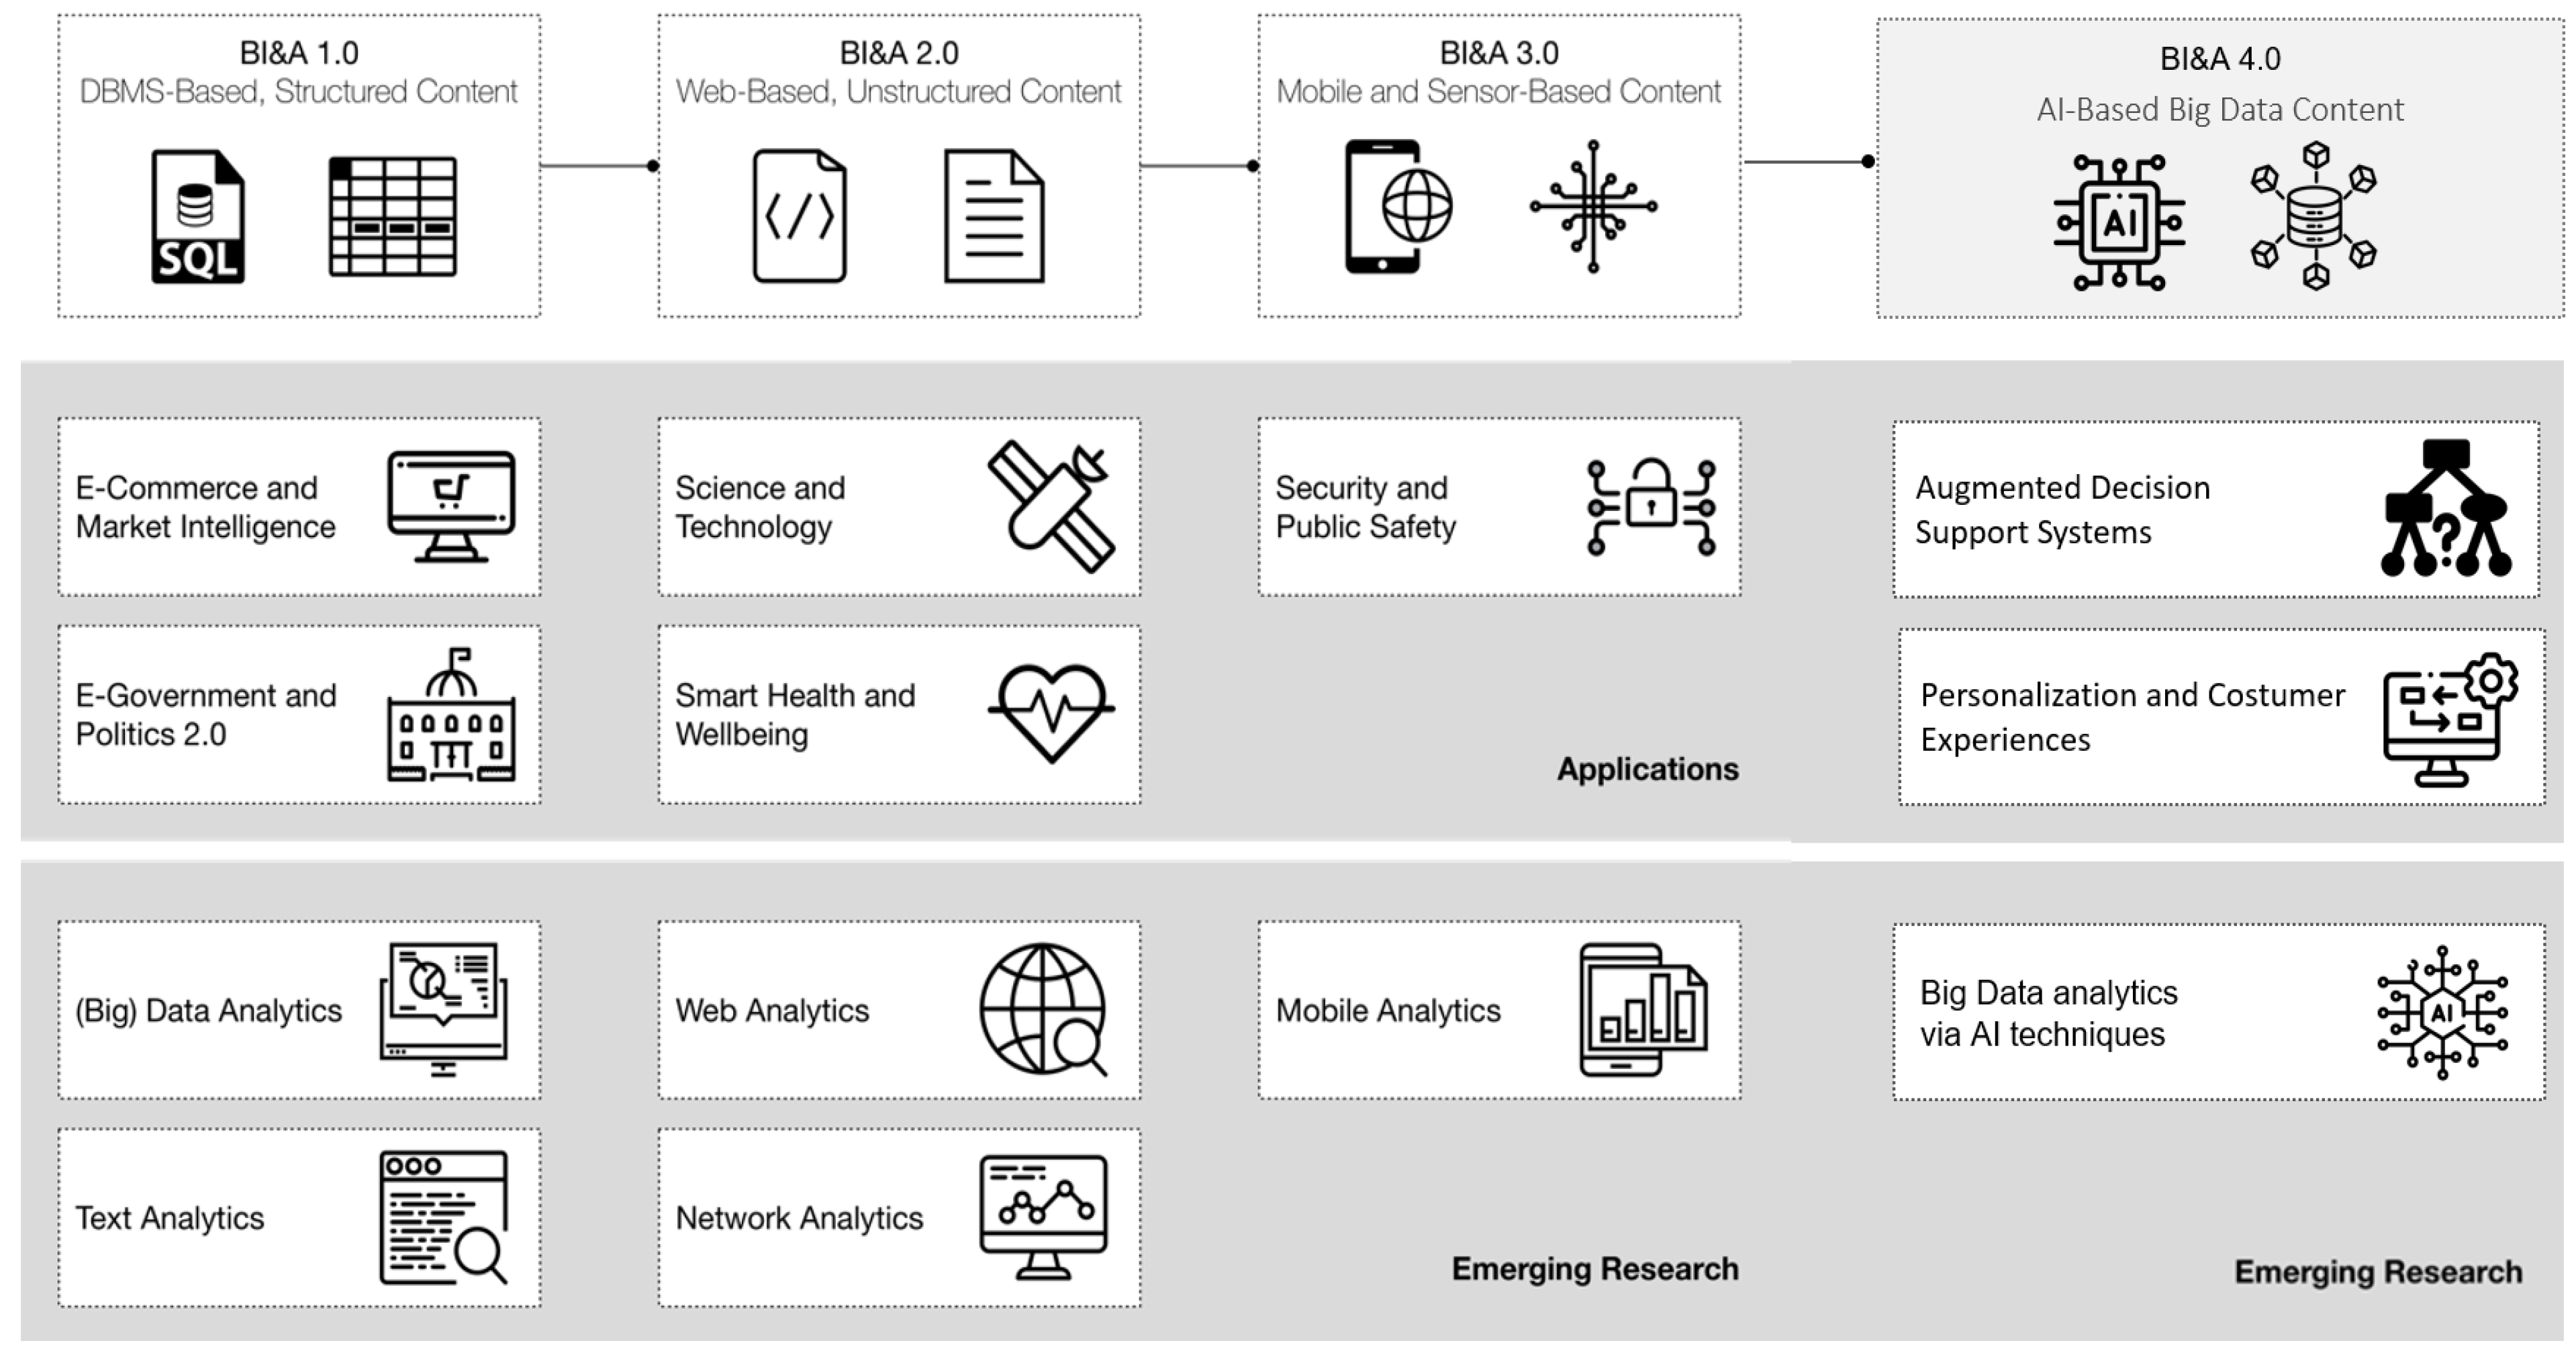
The BI&A evolution over time is divided into four eras: BI&A 1.0, BI&A 2.0, BI&A 3.0, and BI&A 4.0, with applications and emerging research areas with different data sources, as can be seen in
Figure 2 [
41,
42,
43]:
BI&A 1.0 refers to the first era of Business Intelligence and Analytics, in which data were essentially structured and came from multiple data sources. Data warehouses (DW) are a creation that dates back to this era and play a crucial role in it, as they serve as the basis for integrating and consolidating company data. DW schemas also prove essential to organising and structuring data effectively by developing Extract, Transform, and Load (ETL) mechanisms to extract data from various sources, transform it into a suitable format, and load it into the DW.
Online Analytical Processing (OLAP) and reporting tools are used in BI&A 1.0 to explore and analyse data, providing interactive environments with intuitive graphs and enabling ad-hoc querying processing, complemented by statistical methods and data mining algorithms for advanced data analytics.
BI&A 2.0 represents the next phase, where data collection expands beyond structured sources. In this era, data are collected from websites using cookies and server logs, allowing companies to gain insight into user needs and preferences. The focus shifts to text and web analytics, involving techniques such as web intelligence, web analytics, text mining, web mining, social network analysis, and spatio-temporal data analysis. These methods help extract meaningful information from unstructured data, enabling businesses to identify new opportunities and make data-driven decisions [
41].
In BI&A 3.0, the emergence of mobile devices takes centre stage. Due to the proliferation of mobile phones, tablets, sensor-based devices, Internet-enabled devices, barcodes, and radio tags, the IoT has become a significant source of data. And consequently, this era generates a vast amount of detailed data from various devices and sensors, which can be leveraged to gain new insights. The mobile device and IoT ecosystem create opportunities for businesses to understand user behavior, preferences, and real-time interactions, enabling personalised experiences and targeted marketing efforts.
BI&A 4.0 is the AI era, in which the focus will shift from descriptive analysis to prescriptive and predictive analysis. Given the exponential development of AI and the improved predictive analytics—smarter; faster; and more actionable—enabled by AI techniques and their consequent capabilities to handle large amounts of data in real-time; delivering results with high accuracy [
44]; due to the high potential of AI to transform business; the impact of Analytics 4.0 is likely to be significantly larger and more disruptive than previous technology transitions [
43].
3. Big Data System Architecture
The emergence of IoT devices, namely sensors, and their availability to connect with each other to generate an intelligent network for the constant exchange of information has generated a new concept for dealing with data called Big Data. This required the adoption of proper technologies to fulfil the data collection, storage, processing, and analysis needs.
Thus, in order to monitor road pavements,
Figure 3 shows the proposed BDSA as well as its main layers and components. The components tested in the case study presented in this paper are highlighted in the figure.
The BDSA is divided into seven layers, each of which includes components. Each layer is represented by a grey rectangle, while white rectangles are used to specify the components. Data flows between layers are also represented in this figure and go from data collection to data visualisation.
The first layer of the BDSA is the Data Sources, which can include road sensors, monitoring cameras, and traffic control system data, among others. These data sources are responsible for collecting relevant information about traffic and roads. The variety of data sources implies that the data can be collected in various formats, namely structured, unstructured, or semi-structured data.
The second layer is Data Processing, where raw data are analysed and transformed into more useful and meaningful information. In this stage, techniques such as data cleansing, standardisation, and enrichment can be applied, as well as Machine Learning algorithms for more advanced data processing and transformation.
After processing, the data are directed to the storage layer, where it is stored in a structured manner and made accessible for future queries. This layer may involve the use of databases or distributed storage systems like Hadoop’s Distributed File System (HDFS), Google’s Big Table, or Amazon’s S3 in a Big Data context. The main challenge at this layer is to efficiently store massive volumes of data in a way that allows for fast retrieval and analysis.
Once the data are stored, the Big Data Analytics layer involves the analysis of this data. This usually involves Data Visualisation, AI to model predictions about health roads, Reporting, Ad-Hoc Querying (ideal for exploratory interactive data analysis), and a Structured Query Language (SQL) Query Engine (used for routine reporting and transaction processing). The goal here is to derive insights, trends, and patterns from the stored data presented through graphs, tables, or other forms of visual representation. This allows external apps or users, such as road engineers or traffic authorities, to easily access and interpret the information obtained from road monitoring.
The fifth layer is the Data Publisher, which is responsible for publishing the data and the analysis results to external systems, i.e., applications. These could be databases, other Big Data systems, or Application Program Interfaces (APIs). This layer ensures that the results of the Big Data processing system are widely available to be used by other components of the broader technology ecosystem.
The layer entities represent the consumers of the insights derived from the analytics layer and can be humans or machines. Humans, like road engineers or traffic authorities, are looking for important insights in dashboards or reports. Machines can consume this data to drive decision-making or automation.
Finally, the Security, Administration, and Monitoring layer cuts across all the previous layers. It involves ensuring the security of the data and the Big Data System itself, administering the system (e.g., managing user access, allocating resources), and monitoring the system (e.g., tracking performance, identifying, and handling failures). These aspects are critical for the Big Data System’s overall integrity, reliability, and performance.
The BDSA is a layered architecture that provides a logical separation of concerns, where each layer has a specific role and interacts with the layers above and below it. This helps build a scalable, robust, and capable architecture capable of handling Big Data processing and storage demands.
In the next section, we will use some layers and components to instantiate a case study to monitor a real road section.
4. A Case Study
4.1. Case Study Contextualisation
Having proposed a Big Data System and its BDSA for road monitoring, it is now important to implement it, a task that will validate some layers and components of the architecture.
The case study was carried out on a section of road in northern Portugal called IC5, where the sensors used to collect data are optical sensors that allow strain and temperature data to be collected, as it is a static installation. This location was chosen for its proximity to a power source and internet infrastructure.
These sensors generate data with a measurement frequency of 500 records per second, which is equivalent to 15 Gigabytes per day. This huge volume of data has to be collected, prepared, and analysed and it is impossible to use conventional technologies. Therefore, the Big Data System for Road Monitoring was adopted. In this installation, not all the layers and components proposed in
Figure 3 were used, but the layers and components used are justified, serving to evaluate the proposed architecture.
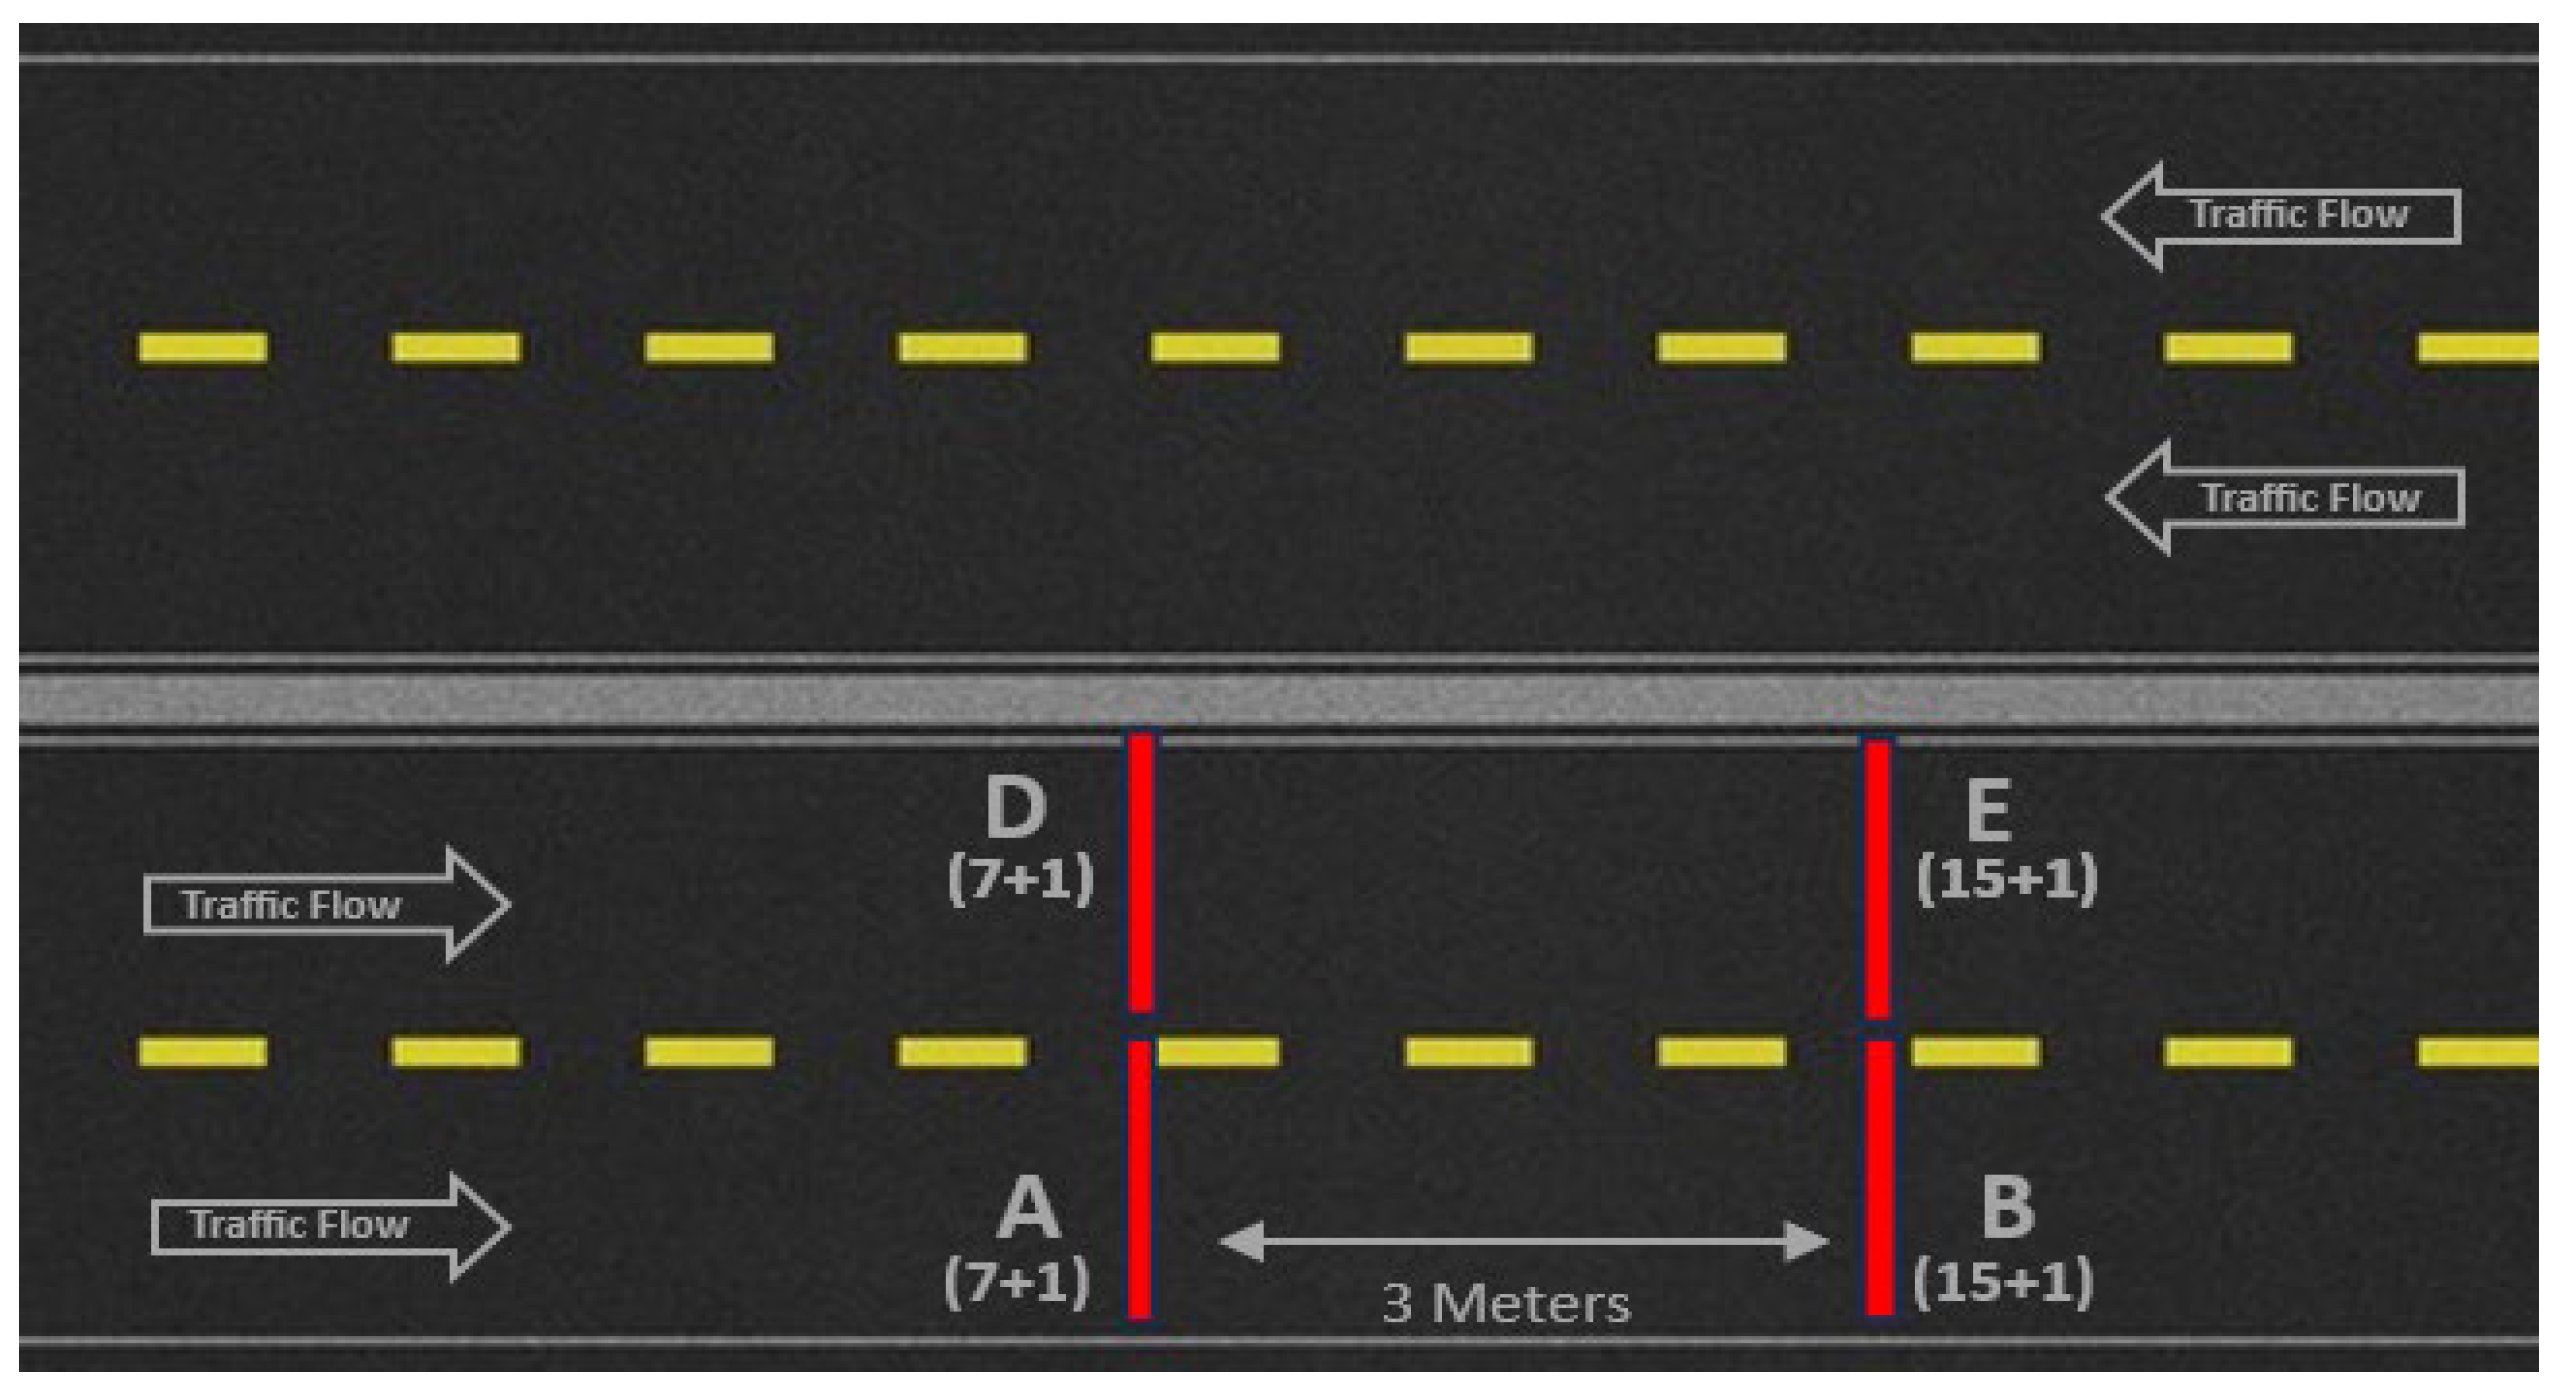
The first step was to install the sensors embedded in the pavement in the IC5 road section. The installation took place on two one-way lanes, the right lane for slow, heavy traffic and the left lane for fast, light traffic. Two channels were installed in each lane: the right lane has Channel A with seven strain sensors and one for temperature measurement, and Channel B with fifteen strain sensors and one for temperature measurement. The left lane is a replica of the right lane, and the channels are designated D and E. Each channel was embedded perpendicularly into the two-lane road with a distance of three metres between channels A and B, the same distance for channels D and E (see
Figure 4).
One of the system’s requirements is to be able to monitor traffic in real-time, called real-time processing. It is responsible for collecting and processing data at high speeds while also making it available in a visualisation tool, i.e., a dashboard. In addition to the dashboard, it is also able to show a table containing logs of alarming events for registry vehicles with very low speed, excessive speed, or excessive weight, as well as low or high temperatures. The other system requirement is to support batch processing; it is responsible for collecting and transforming data, but the storage phases are more complex and apply to a larger volume of historic data (see
Figure 5).
Therefore, some layers and components of the BDSA proposed in
Figure 3 were used, as shown in
Table 1.
4.2. Real-Time Processing
The first step in real-time processing is to collect the data directly, seamlessly, and with minimal delay from the sensors. The data acquisition software needs to identify and categorise the different channels and sensors so the collected data are correctly organised for further analysis and interpretation.
Following the data collection step, it enters the data processing phase. Data filtering tasks are important in order to exclude outliers, anomalies, and other values that fall outside user-defined checks. Ensuring the time synchronisation of readings from different sensors is also essential to maintaining a logical stream of values. Furthermore, some form of event detection and subsequent application of mathematical functions are needed in order to convert the signal data into valuable information (e.g., to calculate vehicle speed and weight, to obtain the time of occurrences, etc.).
This data are stored in a real-time way to keep the transformation conducted and calculations made in the data, as well as to register the events.
Finally, the data reaches the data visualisation phase, where it is presented in a variety of visual representations, including graphs, tables, and digital indicators, in a way that a regular user can easily and quickly interpret the information. Moreover, in case an event has exceptional parameters that break user-defined limits, it has to be registered along with its information, and a system response may be triggered (e.g., sending a push notification or communicating the incident via email).
Catman® Easy software ensures all these requirements are covered. It identifies the channels and sensors as well as their information while also allowing the user to configure some settings (e.g., sensor name, sampling rate, sensor type/role, etc.) and associates the streams of collected data to each sensor while quickly processing them and saving them in real-time storage. The data processing capabilities include filters, functions, and scripts executed in near real-time in order to derive insights. For instance, it is able to count the daily number of vehicles that have passed and calculate the approximate speed and weight they were going while encountering low to no performance issues. It also offers a vast variety of data visualisation tools and a panel that allows free use of them to create real-time dashboards, enabling dynamic data visualisation and analysis.
In order to analyse this data in real-time, a dashboard for each lane was developed. In
Figure 6, the left lane’s dashboard is presented, displaying the maximum values measured in channels D (indicated by the yellow line) and E (indicated by the blue line) over a two-minute interval in the top graph. The bottom section features two graphs: on the left, the D channel (depicted by yellow bars) with seven sensors, and on the right, the E channel (represented by blue bars) with fifteen sensors. Additionally, on the right side of the dashboard, you can find information about road and air temperatures, a list of vehicles that have passed, and the speed of the last vehicle.
In the main graph of the dashboard, the peaks of the lines show the strains measured when the vehicle wheel axles pass over the sensors. In this example, we can see the passage of a heavy vehicle with five axles and the passage of a light vehicle with two axles.
Several calculations are executed in the monitoring process. For example, when a vehicle axle traverses the D channel, the time
t1 of this occurrence is recorded. Subsequently, when the same axle traverses the E channel, located three metres ahead of the D channel, the time
t2 is recorded. In this way, it is possible to calculate the speed of a vehicle and to determine the number of vehicles that have passed through by detecting the axles that pass through the two channels at the same speed and with a certain cadence, regardless of the number of axles in the vehicle. Since we know the distance
d between channels is three meters, we can successfully calculate the speed and multiply it by 3.6 to convert the value from m/s to km/h; see Formula (1).
The real-time monitor includes alerts to facilitate the detection of specific events, e.g., a vehicle exceeding the speed limit, which then trigger appropriate actions. These actions serve as effective measures to respond to these specific events in a timely manner, ranging from drawing attention to the dashboard with sound effects, pushing notifications, or sending emails to remote users (see
Figure 7).
It is worth noting that the sensor values are reset to zero on a weekly basis to enhance data visualisation’s user-friendliness and simplicity. This reset is particularly beneficial as the stabilised values of the sensors, even within the same channel, can initially exhibit significant dispersion. However, it is important to emphasise that the original sensor values are stored in real-time, and they are indispensable for conducting further studies on the road structure’s health.
4.3. Batch Processing
We started by defining the technological infrastructure needed to support the BDSA. To perform this, we created a technological cluster consisting of four computers, one master, and three workers. These machines run on the Ubuntu operating system, Hadoop to manage the distribution of computing in the cluster, and HDFS to manage the data files and ensure that no information are lost during the storage process.
Hadoop was selected because it facilitates the creation of this type of machine cluster using less expensive and sophisticated hardware, as well as the existence of a wide range of programmes and technologies compatible with the Hadoop platform and, consequently, with HDFS.
One example is Spark, a distributed computing framework that we use to process the data because it is faster than Hadoop’s data processing component, MapReduce, for certain types of processing when performing in-memory operations and reusing data in multiple processing steps. It provides a fast and general-purpose cluster computing system, and it is well-suited for processing large volumes of data, including sensor data, in parallel across a cluster of machines.
Spark can distribute data processing tasks across a cluster of machines, enabling efficient processing of large datasets like what can be found in this project, and cache data in memory, leading to faster iterative processing and reduced data access latency. What more is, it offers a wide range of data transformation operations (e.g., filtering, mapping, and aggregating) through its RDD (Resilient Distributed Dataset) and DataFrame APIs and supports machine learning, graph processing, and SQL queries, enabling complex analytical tasks on sensor data.
We used a data lake to ingest and store the data, specifically the Delta Lake solution with its three layers, Bronze, Silver, and Gold [
46]. Delta Lake is an open-source storage layer that brings ACID (atomicity, consistency, isolation, and durability) transactions to Apache Spark and big data workloads. It is built on top of existing storage systems like HDFS and provides data reliability, consistency, and performance improvements for data lakes. Other features include allowing for schema evolution over time, making it easier to adapt to changes in sensor data formats without disrupting downstream processes; tracking historical versions of data, enabling audit trails and the ability to revert to previous data states; employing optimisations like compaction and indexing to improve query performance on large datasets; and the time travel feature permitting the query of previous data versions, aiding historical analysis and debugging.
When used with HDFS to process and store sensor data, Spark and Delta Lake together provide a robust and scalable solution for managing sensor data at scale. Spark’s distributed processing capabilities enable efficient data analysis and transformation, while Delta Lake’s ACID transactions and versioning features ensure data reliability and consistency, making it well-suited for managing sensor data in dynamic and evolving environments.
In the Gold layer of Delta Lake, we use the Hive database to implement a (Big) Data Warehouse to store data ready for analysis and visualisation. Apache Hive is a data warehousing and SQL-like query language tool built on top of Hadoop that allows the management and querying of structured data stored in HDFS using familiar SQL syntax and defining schemas for the data using the Data Definition Language (DDL), making it possible to impose structure on sensor data. Other capabilities include support for various data processing operations like filtering, aggregation, and transformation using SQL-like syntax, query optimisation mechanisms to improve query performance, making it suitable for querying large volumes of data, and the possibility of integrating with Tableau, a popular data visualisation tool that enables users to create interactive dashboards.
The data flow used is shown in
Figure 5. This is explained in more detail below, and it is an ETLT (combination of ETL and ELT), i.e., extraction, transformation, loading, and transformation phases. The data are generated by sensors at a frequency of 500 readings per second, although it should be noted that this frequency can be set to a higher (max. 1000) or lower value. The value of 500 has been set in order to be able to measure the passage of the wheels over the sensors, but it is a value that can still be adjusted. The main transformation at this stage is to eliminate data that does not register vehicle passages, as over time there are periods when there are no vehicles on the road and the sensors are constantly generating data.
To detect vehicle passages, in this case called peaks, the
z-score peak detection algorithm is used, with the definition of a threshold that defines the value from which the
z-score must correspond to a peak. This algorithm is based on the principle of dispersion, according to which if a new data point is above the threshold, i.e., within a certain number of standard deviations from an average value, the algorithm classifies this point as a peak [
47]. The
z-score is given by the Formula (2).
where
x is the value measured by one sensor, i.e., A1, channel A sensor 1, the
mean and
standard deviation are calculated over all the values obtained by one sensor, e.g., sensor A1. The calculated
z-score, together with the threshold, makes it possible to identify peaks and then the passage of a vehicle wheel over the sensor. This is calculated for all 44 sensors. The data are reduced in the time interval of 2 s before the peak and 2 s after the peak, which corresponds to 2000 lines of data per axle pass; the data that does not represent peaks is discarded.
These data are ingested in the Bronze Layer of Delta Lake as raw data.
The data in the Bronze layer is transformed and stored in the Silver layer by transforming:
Column names—the column names of the generated data are very complex; making them difficult to handle in processing scripts. The solution is to rename the column names to a simple name.
Numerical values—numerical values had a comma as a decimal separator; and this caused problems in handling these values in the processing scripts. The solution is to replace the commas with dots.
Dates—the dates (timestamps) of the generated data were in Unix TimeStamp format and have been converted to DateTime format.
The next step is to transform the data from the Silver layer to the Gold layer. The Gold layer contains highly structured data that has undergone additional processing and aggregation from the Silver layer to answer specific business questions. From the Silver layer to the Gold layer, the data goes through a process of identifying vehicle classes, using machine learning algorithms to classify vehicles by axle pass and registered weight, as well as calculating vehicle speed and aggregating external data on weather in relation to road conditions (dry, wet, with a probability of ice or snow). The Gold layer implements a (Big) Data Warehouse with a dimensional data model, i.e., a constellation of three stars. This model makes it possible to answer questions relevant to the perception of road monitoring and to use algorithms to model the state of the road. The dimensional model developed for this project, see
Figure 8, has three star schemas with different levels of aggregation:
Passages Management—records vehicle passes; their class; speed; measured load; temperature and atmospheric conditions; date; and location.
Temperature Management—records the temperatures measured at a location; date and time.
Cargo Management—records the loads measured by the sensors at a given location; date; and time.
The dimensional model allows you to answer analytical questions to better understand the evolution of the road condition. Here are some examples of such questions:
What are the loads recorded over a period of time at a given location?
Does the condition of the road—dry; wet; ice; or snow—affect the average speed recorded?
What is the frequency of passages recorded over the hours of a day in a month?
How has traffic developed in recent years, by type of vehicle and location?
Does the recorded temperature affect the value recorded on loads?
What is the average speed of heavy vehicles on working days in the current month at a particular location?
What type of vehicles travel at weekends to a particular location?
What is the maximum vehicle speed recorded? On what date? Where?
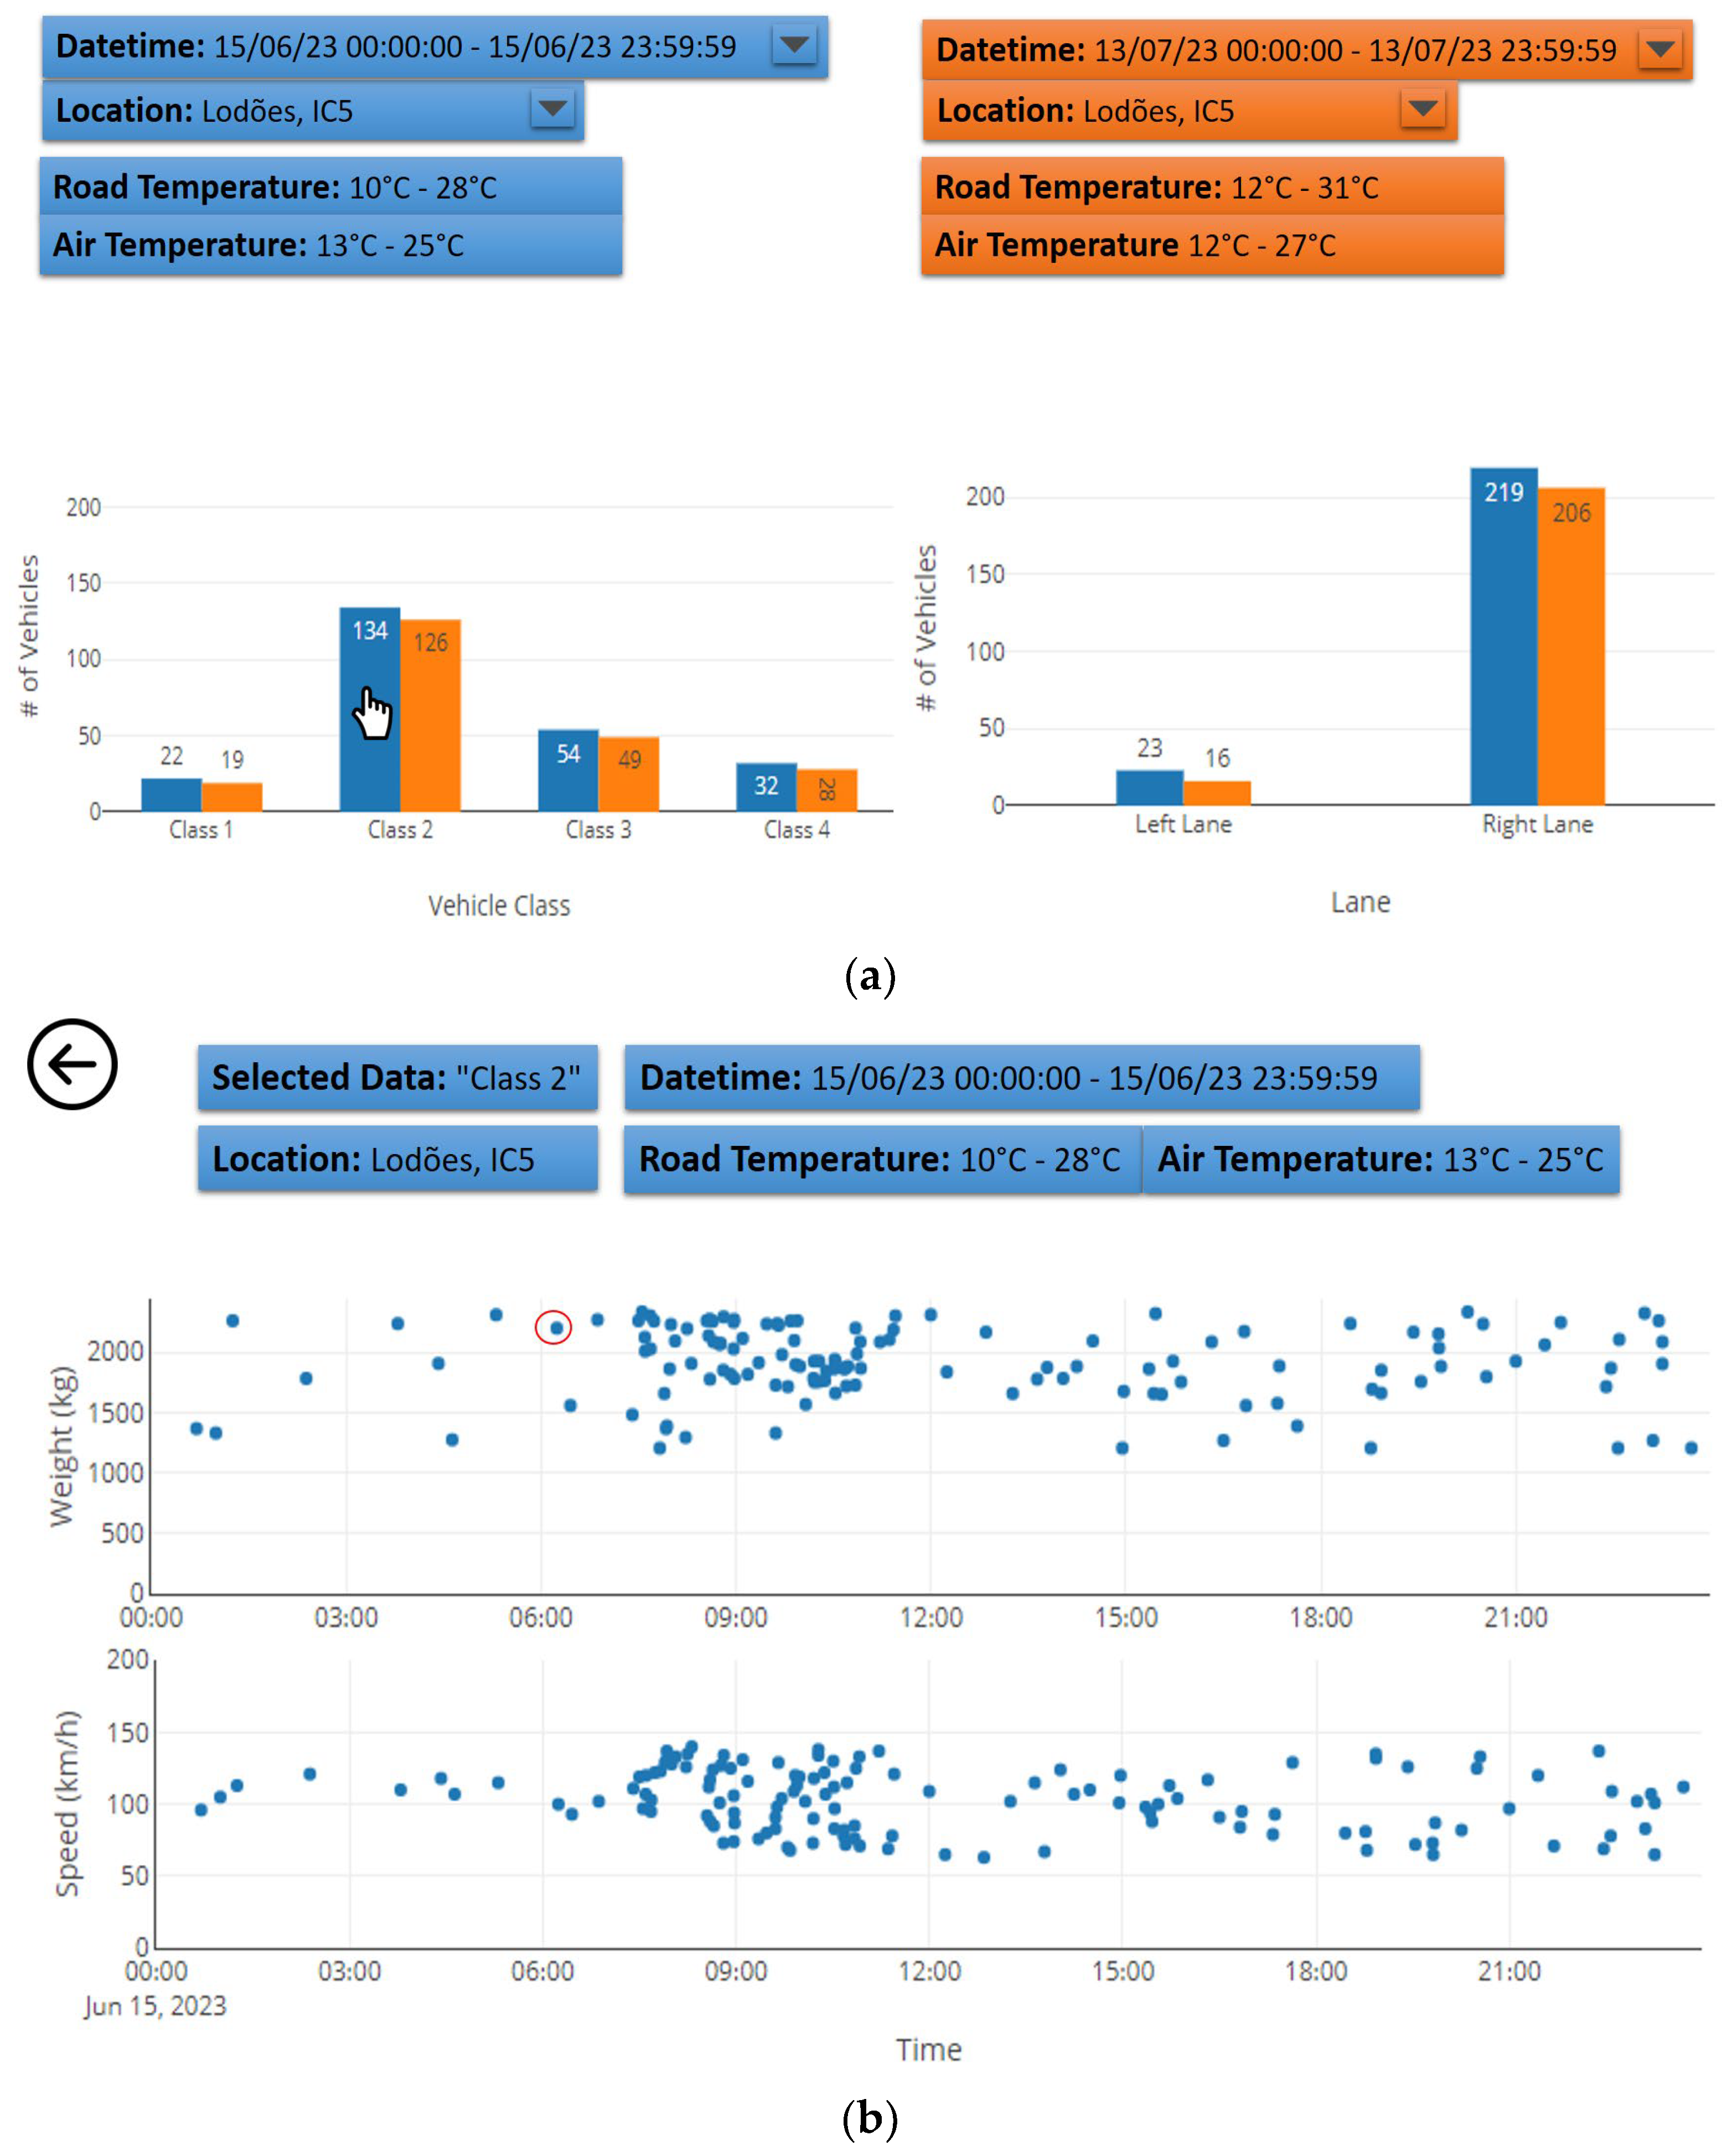
An example of a dashboard created using Tableau that can be used to view the passage of vehicles is shown in
Figure 9a. It is possible to select the date and location to be displayed. This can range from a few hours of a day to several days, weeks, even months or years. This visualisation allows comparison with other values, for example, passages of vehicles from 15 June 2023 (blue color) can be compared with those from 13 June 2023 (orange color). In the visualisation, there is a graph of the number of vehicles per class on the left and a graph of the number of vehicles per road lane on the right. If you select one of the bars in the graph, for example, Class2 in the graph on the left (where is the hand symbol), a new view appears; see
Figure 9b. In this case, it is a display of the loads and speeds registered by vehicles of that class over the time selected above.
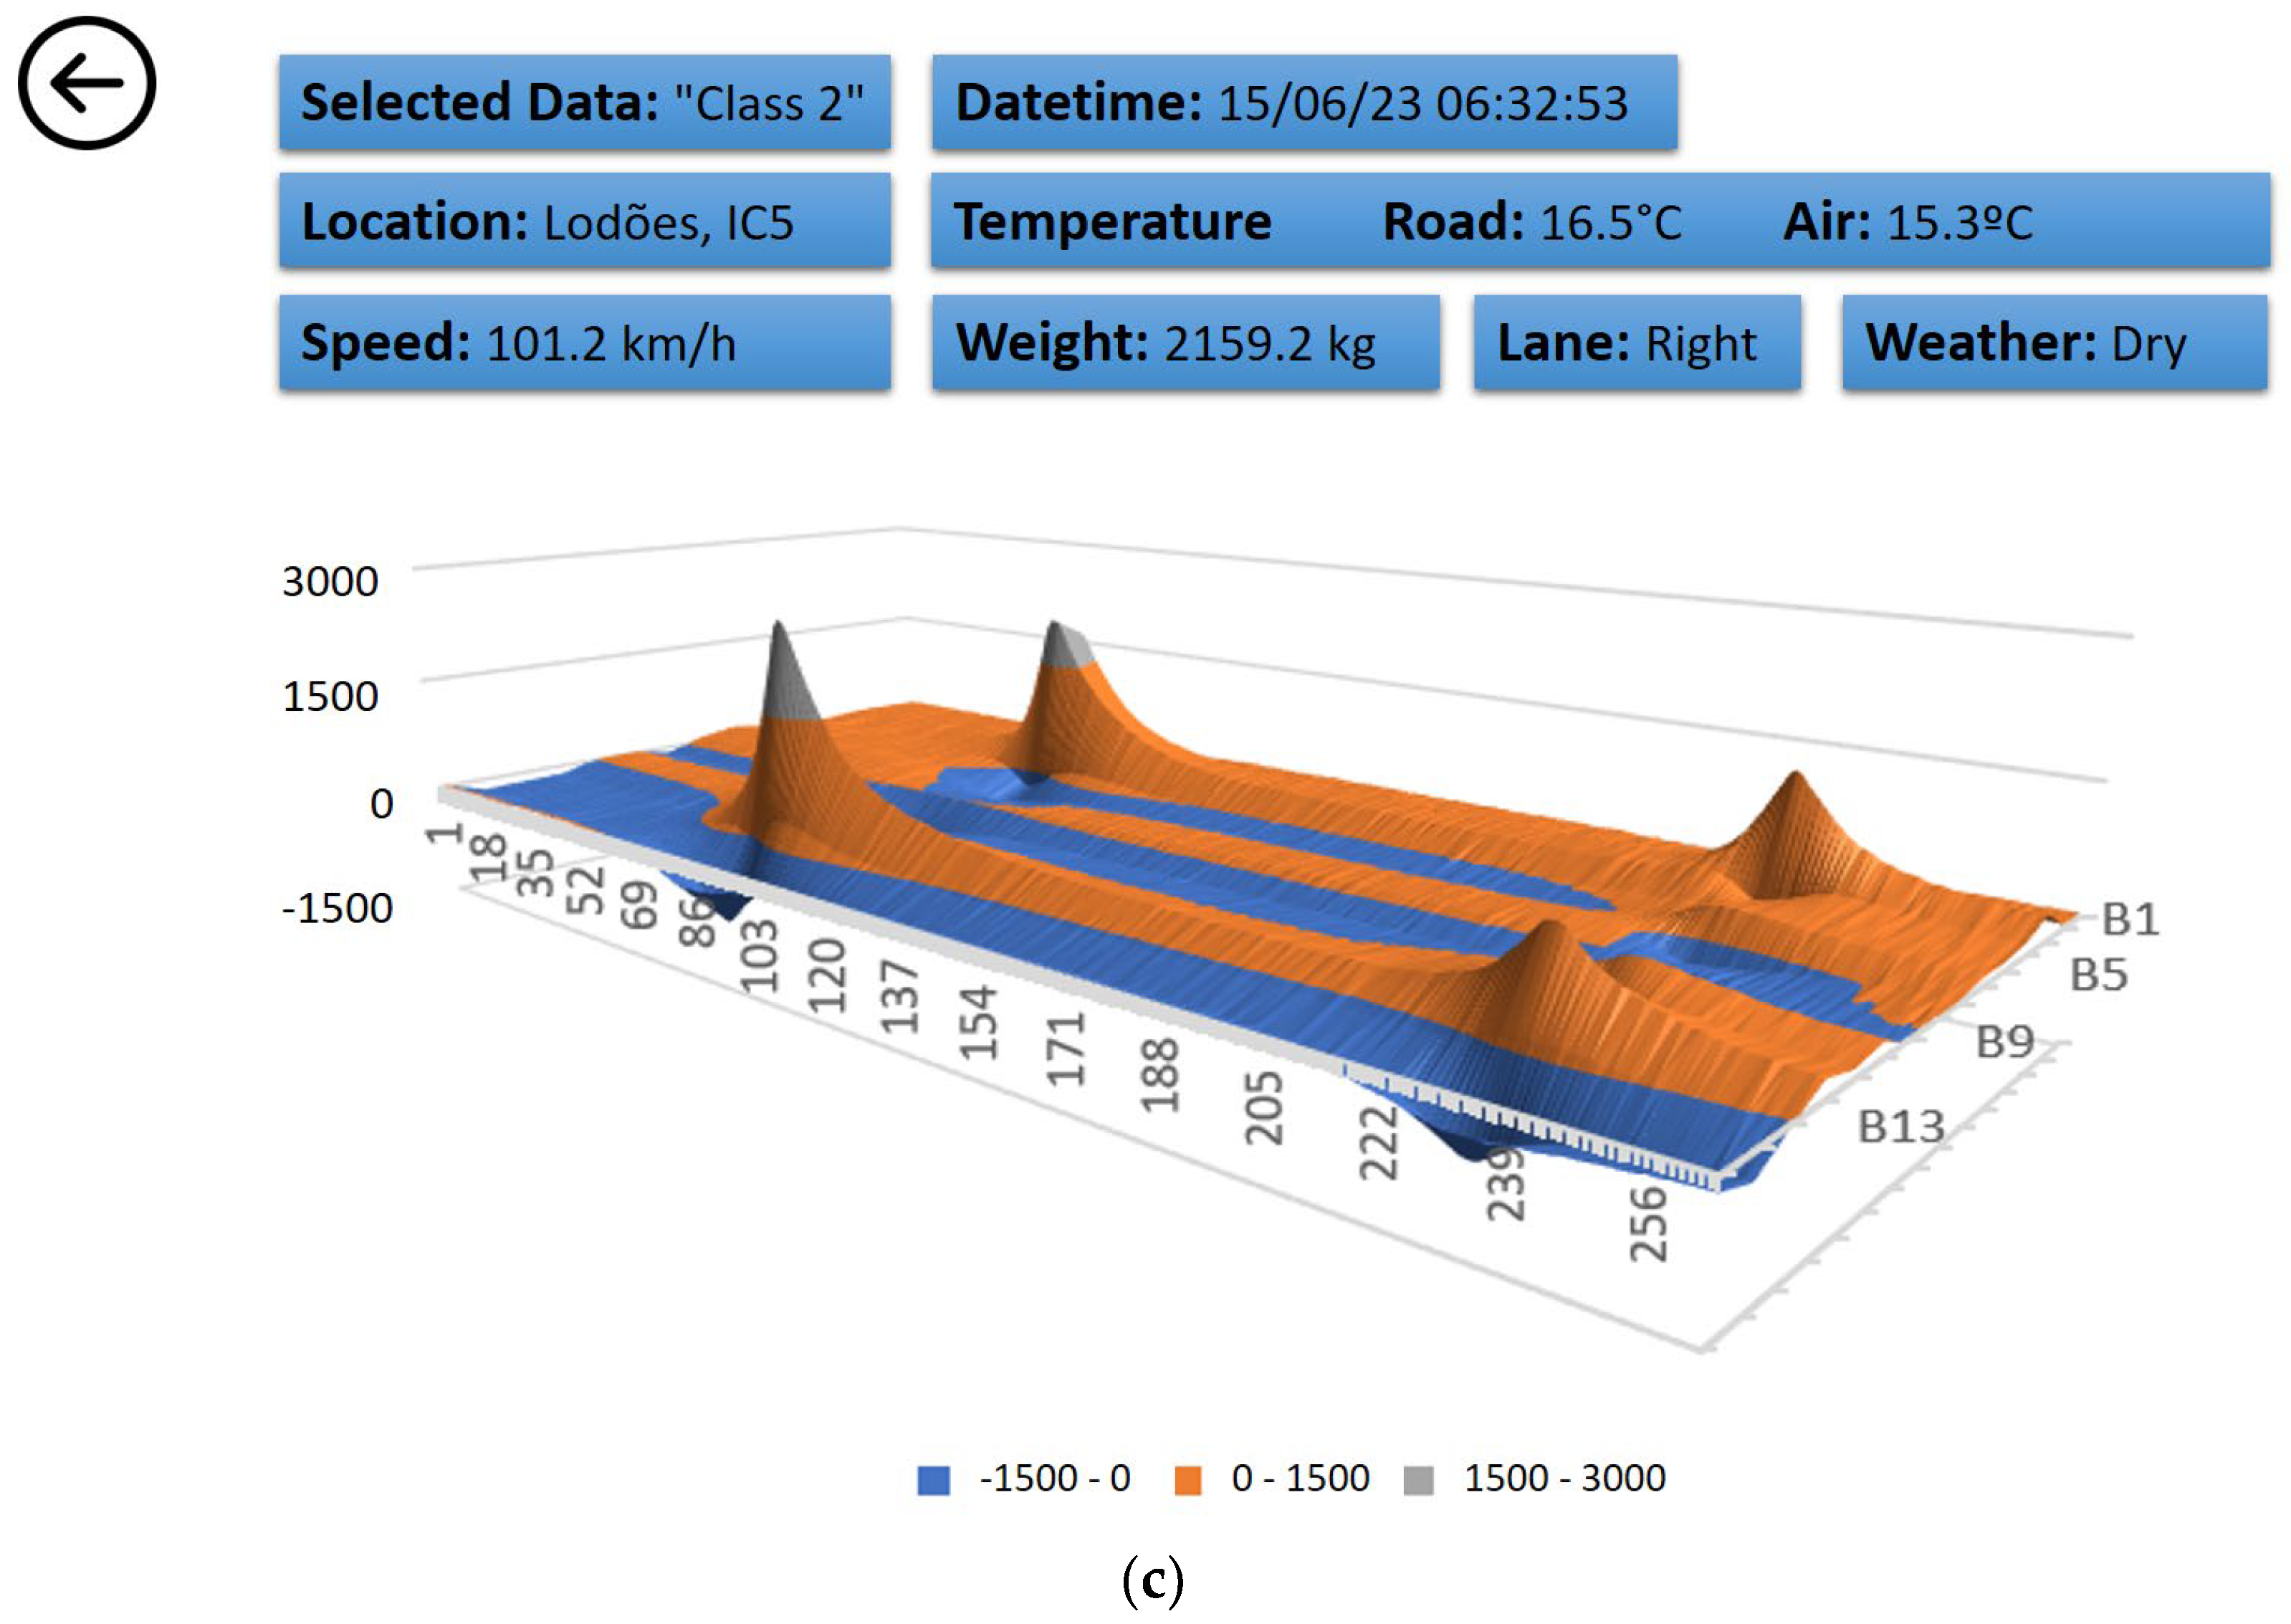
By selecting one of the points on the graph, in this case a vehicle (where is the red circle), you can see a 3D graph showing the vehicle passing in the lane through the channel with more sensors (B or E); see
Figure 9c. You can also see the recorded temperature and the weather forecast for that location, day, and time. The 3D view allows you to see and analyse where the left and right wheels of the vehicle passed on the road. In this case, they passed close to sensors B3 and B13. It can be seen that when the wheel does not pass directly over a sensor, the readings are very different. The figure also shows the effect of loads on the road. The supporting structure of the road suffers permanent deformations, increasing the possibility of degradation. This set of visualisations allows you to answer the analytical questions 1, 3, 4, 6, and 7.
5. Results
The monitoring system developed is capable of successfully capturing, preprocessing, and storing data from optical strain and temperature sensors.
The real-time processing can reliably collect data continuously, with an uptime rate of nearly 100%. The only interruptions in data flow occur during maintenance or calibration processes, both of which do not occur frequently. Additionally, there is a brief downtime of approximately one second during the weekly sensor reading reset. The users can access the visualisations remotely, and the system runs smoothly with no performance issues.
The batch processing needs more pre-processing to collect the data and effectively filter out a substantial portion of noise, resulting in a data volume reduction of approximately 2% of the original raw data, i.e., the system can reduce 15 GB of daily data to less than 300 MB. These data are ingested into the HDFS so that they can be used by the distributed storage system. The next steps would involve completing the analysis performed with the Spark scripts to generate additional Delta tables (with three layers: Bronze, Silver, and Gold) and finalising the configuration of the HIVE database in the Gold Layer. Furthermore, establishing a connection to Tableau would enable more immersive visualisations and dashboards.
Although the system is online and capable of storing and pre-processing sensor data, its potential was not fully explored due to several obstacles encountered during the solution’s development. These obstacles included several challenges in the selection, installation, and configuration of the tools to be integrated into the system, as well as time constraints for accumulating a substantial volume of sensor data required for building comprehensive historical analyses and predictive analyses.
However, following the BDSA allowed us to understand which layers and components were used (and used well) and also which components were not used, allowing us to prioritise the implementation of missing layers and components. In this particular case, the missing layers and components are:
Big Data Analytics layer—it is important to implement all the missing components; in particular artificial intelligence; to predict road degradation.
Data Publishers layer—to enable data sharing through a machine interface.
Entities layer—to implement applications that can use the data and also allow external applications to access the data.
Security, administration, and monitoring layer—when implementing the missing functionality; especially when enabling data sharing; it becomes important to ensure data security and protection; so this is a layer that needs to be managed and implemented whenever necessary.
6. Conclusions
This paper presents a proposal for a BDSA for road monitoring. Some specific layers and components have been integrated into two data flows: real-time and batch processing, from data collection to data analysis and visualisation to validate the system.
The case study presented showed how these technologies complement each other, with the overall objective of supporting the decision-making process. For this purpose, a section of road in Portugal was selected to install static Fibre Optical Sensors and all the necessary technological infrastructure to collect, process, store, and analyse the data collected, both in real-time and batch processing.
The case study implementation covered the layers of Data Source (sensors and web services for collecting weather data), Data Preparation (ETL for batch data and streaming ETL for real-time data), Data Storage (Real-Time storage, Data Lake, and (Big) Data Warehouse), and Big Data Analytics (data visualisation). It was possible to verify that the data stream was normal, that the selected technologies worked together, and that no integration or interoperability problems were identified.
In addition to the technical accomplishments outlined above, it is crucial to recognise the unique experimental environment in which the case study was undertaken. In addition to the technical achievements described above, it is crucial to acknowledge the unique experimental environment in which the case study was conducted. The journey from concept design to proof of concept was marked by several external factors that inevitably affected the pace and nature of this work, namely the reliance on third parties for sensor configuration, computer installation and configuration, permissions, etc., which posed unforeseen challenges and sometimes slowed progress.
In the future, it is expected that other components of the BDSA will be tested, as well as other technologies to be used. Some technologies will have to be chosen, and others can be replaced over time as more promising ones emerge. The challenge is to be able to store the volume of data generated to provide a history of at least five years.
Finally, in the BDSA Big Data Analytics layer, when we have a considerable data history, the AI component will be implemented and tested so that the solution will become an Adaptive Big Data System, combining predictive and optimisation algorithms to monitor and predict the health of roads to ensure their proper functioning.


 ,
, 


